Abstract
Phosphatidylserine decarboxylases (PSDs) are central enzymes in phospholipid metabolism that produce phosphatidylethanolamine (PE) in bacteria, protists, plants, and animals. We developed a fluorescence-based assay for selectively monitoring production of PE in reactions using a maltose-binding protein fusion with Plasmodium knowlesi PSD (MBP-His6-Δ34PkPSD) as the enzyme. The PE detection by fluorescence (λex = 403 nm, λem = 508 nm) occurred after the lipid reacted with a water-soluble distyrylbenzene-bis-aldehyde (DSB-3), and provided strong discrimination against the phosphatidylserine substrate. The reaction conditions were optimized for enzyme, substrate, product, and DSB-3 concentrations with the purified enzyme and also tested with crude extracts and membrane fractions from bacteria and yeast. The assay is readily amenable to application in 96- and 384-well microtiter plates and should prove useful for high-throughput screening for inhibitors of PSD enzymes across diverse phyla.
Keywords: phospholipid, phosphatidylserine decarboxylase, membrane biogenesis, inhibitor, fluorescence, inhibitor screening
Introduction
Few inhibitors exist for the enzymes of phospholipid metabolism, and many of the enzymes in these pathways have not been amenable to large-scale inhibitor screening (1–6). In this report, we focused upon development of a convenient and versatile new assay for PSDs2 (7), which play an important role in the generation of phosphatidylethanolamine (PE) in prokaryotes, parasites, plants, and animal eukaryotes (8–13). Yeast and plants produce multiple and structurally distinct forms of the enzyme, which are associated with different subcellular organelles (14–17). In contrast, the mammalian enzyme is restricted to the mitochondrial inner membrane (18, 19). Parasites such as Toxoplasma gondii produce two forms of the enzyme encoded by distinct genes, and one of these forms is secreted (11, 12). The enzyme from the human malarial parasite, Plasmodium falciparum (PfPSD), is associated with the endoplasmic reticulum instead of the mitochondrion (9). A closely related enzyme produced in Plasmodium knowlesi (PkPSD) is both a soluble and membrane-associated enzyme and not associated with mitochondria when expressed in yeast (20). Recently, systems for the expression and purification of MBP fusion constructs with catalytically active PSDs from Plasmodia species have become available and provided new information about the processing of proenzyme forms and activity of the mature enzyme (5, 20, 21). Proenzyme processing is an autoendoproteolytic event, which is executed in cis by a His-Asp-Ser catalytic triad that is phylogenetically conserved among PSDs (21) and is also a canonical active-site motif for numerous serine proteases (22). We recently developed purification procedures for a chimeric MBP-His6-Δ34PkPSD enzyme (5, 21) and produced sufficient quantities of the enzyme for screening libraries of inhibitors.
As an enzyme family, decarboxylases have been challenging for the development of facile generic screens amenable for high-throughput screening (23). One approach to developing screens for PSDs is to use agents that selectively react with the PE product of the enzyme reaction. We chose to investigate the distyrylbenzene-bis-aldehyde, (4,4′-((1E,1′E)-(2,5-bis((2,5,8,12,15,18-hexaoxanonadecan-10-yl)oxy)-1,4-phenylene)bis(ethene-2,1-diyl))dibenzaldehyde) (DSB-3), which reacts with unhindered primary amines (e.g. ethanolamine) to produce a relatively strong fluorescence spectrum but reacts poorly with α-carboxylated counterparts (e.g. serine) to produce little or no fluorescence (24, 25). DSB-3 contains two aldehydic moieties that can react with primary amines (Fig. 1A). We hypothesized that reaction of DSB-3 with PE would produce strong fluorescence, whereas fluorescence from DSB-3 reaction with PS would be negligible or weak (Fig. 1B). The goals of this study were to 1) determine the reactivity and fluorescence of DSB-3 conjugates with PS and PE, 2) optimize the conditions for the formation of fluorescent products, 3) determine the detection of PE formation coupled to an MBP-His6-Δ34PkPSD reaction, 4) develop an assay amenable to measuring activity with cell extracts and membrane preparations from bacteria and yeast, and 5) adapt the assay for use in 384-well microtiter plates for ultimate application in high-throughput screening for enzyme inhibitors.
Figure 1.
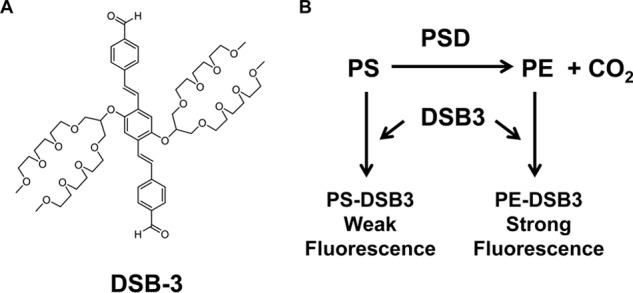
Structure of DSB-3 and schematic outline of its application to monitoring PSD activity. A, structure of the amine-reactive compound, DSB-3. B, predicted reaction of DSB-3 with PS and PE to produce fluorescent products.
Results
DSB-3 reacts with aminophospholipids and produces a relatively strong fluorescence signal with PE
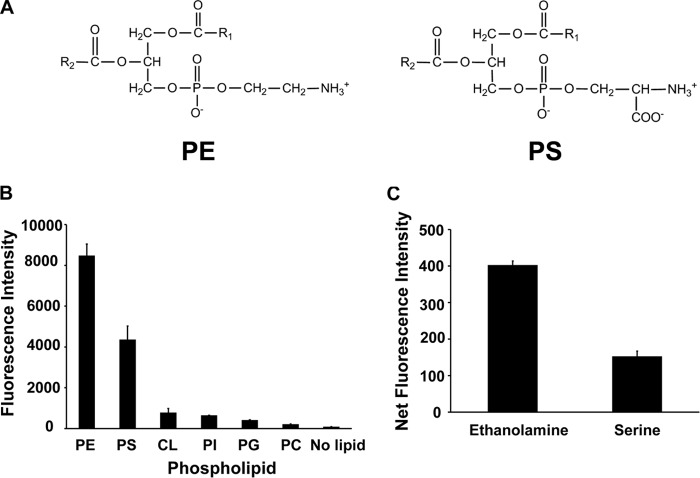
PE and PS harbor a primary amine available for reaction with suitable organic compounds (Fig. 2A). DSB-3 contains two aldehyde groups that can interact with primary amines and has been characterized by its reactivity and fluorescence following interaction with multiple water-soluble primary amines (24). Fig. 2B shows that DSB-3 reacts with 0.5 mm PS and PE and produces a strong fluorescence signal with λex = 403 nm and λem = 508 nm. In contrast, phospholipids lacking a primary amine, such as cardiolipin, phosphatidylinositol, phosphatidylglycerol, and phosphatidylcholine produce little fluorescence emission following incubation with DSB-3. The fluorescence yield of the DSB-3·PE adduct is twice that of the DSB-3·PS adduct. In addition, the fluorescence yield of the DSB-3·phospholipid adducts is ∼20-fold higher than that obtained for adducts formed with 10 mm ethanolamine or serine (Fig. 2C).
Figure 2.
DSB-3 reacts with PE and PS to produce a relatively strong fluorescent signal. A, structure of PE and PS. B, relative fluorescence intensity after reaction of PE, PS, and the non-primary amine-containing phospholipids, cardiolipin (CL), phosphatidylinositol (PI), phosphatidylglycerol (PG), and phosphatidylcholine (PC), with DSB-3. The phospholipids (0.5 mm in 0.25 mm Triton X-100) were mixed with DSB-3 (10 μm) for 1 h at 22 °C in 10 mm sodium tetraborate buffer (pH 9.5) in black-sided microtiter wells. Fluorescence was measured using a Tecan microplate reader with λex = 403 nm and λem = 508 nm. C, ethanolamine (10 mm) and serine were mixed with DSB-3 (10 μm) for 20 min at 22 °C, and fluorescence was measured using λex = 400 nm and λem = 490 nm. The data are from three independent experiments, and values are means ± S.E. (error bars).
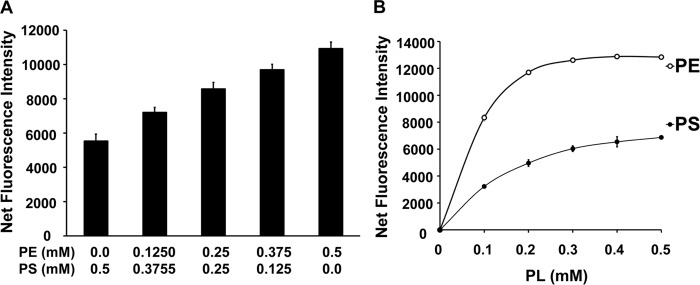
The differential fluorescence of DSB-3 with PS and PE led us to investigate whether there was any correlation in the fluorescence of DSB-3 compounds with the increasing relative concentrations of PE in the context of PS/PE mixed micelles. As shown in Fig. 3A, fluorescence intensities of the DSB-3 compound increase with increasing PE content of PS/PE mixed micelles. When PS-only, or PE-only micelles in a range of 0–0.5 mm were incubated with the DSB-3, fluorescence intensities increased in a hyperbolic pattern, with PS and PE approaching saturation at 0.3 and 0.2 mm, respectively (Fig. 3B). Progressive incremental changes in the PE/PS ratio enabled discrimination between the lipids by the reactivity with DSB-3 and differences in fluorescence yield. The latter incremental changes in fluorescence intensity of the phospholipid adducts mimic the progress of a PSD reaction with time, after initiation of an enzyme reaction commencing with a pure PS substrate.
Figure 3.
Changes in the ratio of PE/PS within mixed micelles produce quantitative changes in DSB-3 fluorescence. A, PE and PS (0.5 mm in 1.5 mm Triton X-100) were prepared as mixed micelles. The total phospholipid content of PE + PS was maintained at 0.5 mm, and the ratio of PE/PS was varied as shown. The fluorescence intensity was measured using a Tecan microplate reader with λex = 403 nm and λem = 508 nm, after a 1-h incubation with 10 μm DSB-3. B, fluorescence emission of DSB-3 after incubation with micelles containing either pure PE or pure PS in the range of 0–0.5 mm and 1.5 mm Triton X-100. The conditions for incubation with DSB-3 and measurement of fluorescence were the same as for A. The data are from three independent experiments and are means ± S.E. (error bars).
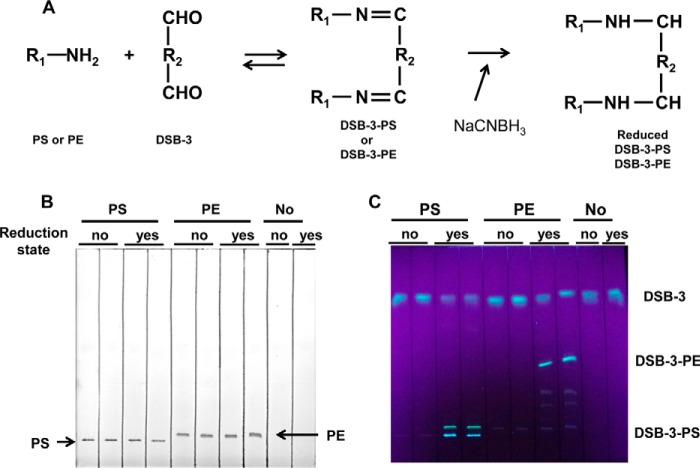
DSB-3 reacts with PE and PS through imine formation, which is relatively stable under alkaline conditions but can be reversed with dilution at neutral pH or under conditions routinely used for lipid extraction. To trap labile DSB-3·PE and DSB-3·PS adducts, these lipids were reduced with NaCNBH3, which converts unstable imines to stable amines by reductive alkylation, as shown in Fig. 4A (26). The reduced DSB-3·lipids were extracted from the reaction and analyzed by thin layer chromatography (Fig. 4, B and C) and visualized with iodine staining and UV light. Iodine staining demonstrates the presence of the underivatized lipids with very faint detection of derivatized lipids, because the amount of DSB-3 added to the reactions is very low (10 μm). Visualization with 366-nm UV light demonstrates the presence of two fluorescent adducts of PS. In contrast, DSB-3 interaction with PE yields one major adduct and trace levels of minor adducts detectable by fluorescence.
Figure 4.
Detection of DSB-3·PS and DSB-3·PE complexes. A, the aldehyde moiety of DSB-3 can form imines with the primary amines present in PE and PS. The imines are unstable with changes in pH and lipid extraction procedures. Reductive alkylation of imines with NaCNBH3 produces stable amine products. B, DSB-3 (10 μm) was incubated with 0.5 mm PS or PE for 20 min in 10 mm sodium tetraborate buffer, pH 9, and subsequently incubated for 20 h in the presence of 5 mm NaCNBH3. Lipids were extracted from the reaction and separated by thin layer chromatography. Unreduced and reduced DSB-3·PS and DSB-3·PE were resolved by thin layer chromatography. Lipids were visualized by iodine staining. C, fluorescent adducts of DSB-3·PS and DSB-3·PE on the thin layer plate were visualized with UV light (366 nm).
Fluorescence-based PSD analysis
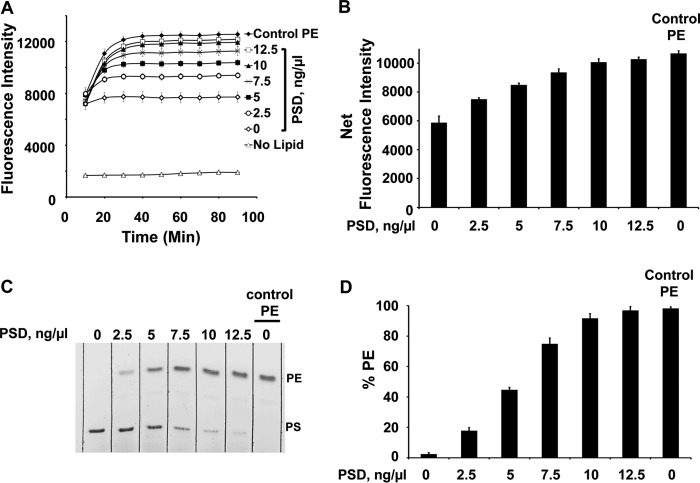
The differential fluorescence yield between DSB-3 adducts with PS and PE suggested a means to develop a new assay for PSD activity based upon this property. In experiments described in Fig. 5A, the time-dependent changes in fluorescent PE-adduct formation, after termination of the PSD reaction, were examined as a function of varying concentrations of MBP-His6-Δ34PkPSD and varying times for adduct formation. The data reveal that the appearance of fluorescent PE adducts can be used to follow the rate and extent of the catalytic reaction. The label Control PE present in different panels indicates the fluorescent signal generated by a concentration of pure PE that is the theoretical maximum for conversion of all PS to PE. The data for the 60-min time point in Fig. 5A are replotted as a function of enzyme concentration in Fig. 5B and demonstrate that low levels of enzyme can be used to obtain a maximum fluorescence signal. Fig. 5C shows a thin layer chromatogram stained with iodine, demonstrating the enzyme concentration–dependent conversion of PS to PE under the conditions of the reaction. In Fig. 5D, the data from multiple experiments using separation of PS and PE by thin layer chromatography and chemical phosphorus determinations were used to quantify the formation of PE. Collectively, the data in Fig. 5 demonstrate that the formation of fluorescent PE adducts with DSB-3 accurately reports the catalytic activity of PSD.
Figure 5.
Plasmodium PSD activity can be monitored by fluorescence emission after reaction mixtures are incubated with DSB-3. A, different concentrations (0–12. 5 ng/μl) of MBP-His6-Δ34PkPSD were incubated with 0.5 mm PS, 1.5 mm Triton X-100, 1 mm potassium phosphate, pH 7.4, at 30 °C for 45 min. At the end of this incubation, the pH was shifted to 9 by adjustment to 10 mm sodium tetraborate buffer, and subsequently DSB-3 was added to a final concentration of 10 μm. This latter mixture was next incubated for 90 min. During this second incubation period, fluorescence measurements were taken every 10 min, as shown, using a Tecan microplate reader. Also shown is the time course of fluorescence development of 0.5 mm PE, 1.5 mm Triton X-100 mixed with 10 μm DSB-3 (Control PE). B, the 60-min time point from A is replotted as a function of MBP-His6-Δ34PkPSD concentration. Control PE, 0.5 mm PE (theoretical maximal conversion of PS to PE). C, lipids were extracted from the enzyme reactions and separated by thin layer chromatography. The lipids were visualized with iodine vapor. D, the PE and PS spots from thin layer plates were scraped and quantified by complete oxidation and phosphate analysis. Data in A and B are means ± S.E. (error bars) for three independent experiments. Data in D are means ± S.E. for four experiments.
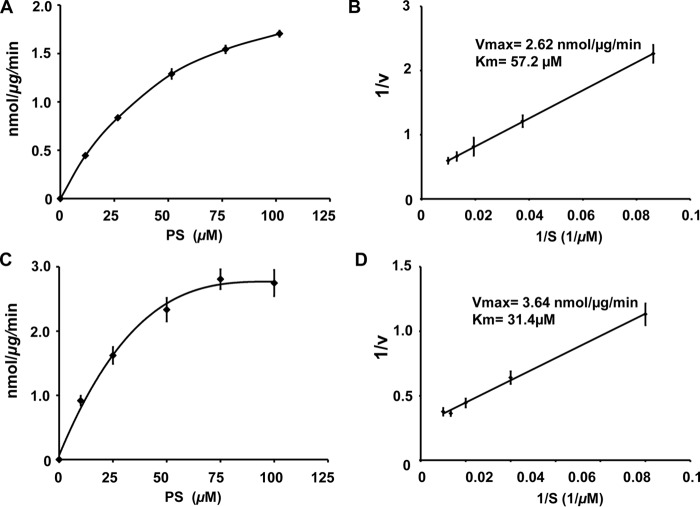
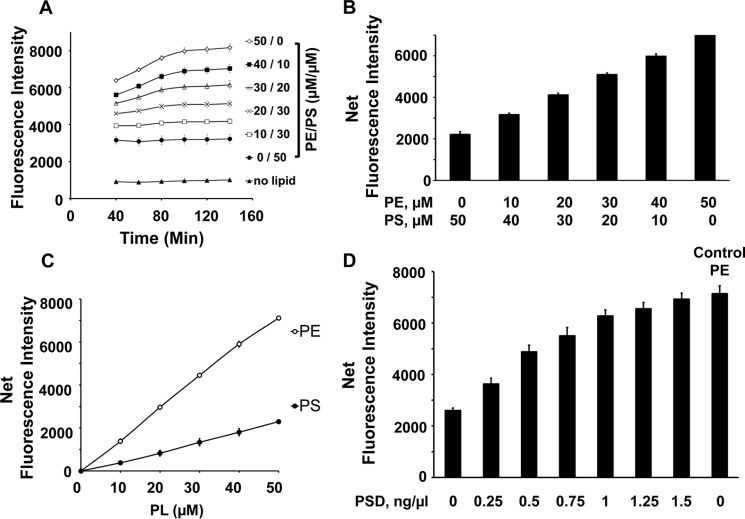
The experiments with enzyme described above were conducted under conditions where the substrate concentrations were sufficient to catalyze reactions at maximal velocities. However, for enzyme inhibitor screening, it is desirable to conduct reactions with substrate concentrations close to Km values so that competitive inhibitors may be more easily detected. To determine the Km value, we conducted radiochemical measurements of MBP-His6-Δ34PkPSD catalytic activity as a function of varying concentrations of PS substrate. The Vmax and Km values were determined as 2.62 nmol/μg of protein/min and 57.2 μm, respectively, using the radiochemical assay, as shown in Fig. 6 (A and B). By comparison, the fluorescence assay for catalytic activity produced a Vmax value of 3.64 nmol/μg of protein/min and a Km of 31.4 μm, as shown in Fig. 6 (C and D). We therefore modified the assay conditions to contain 50 μm PS, and the results are shown in Fig. 7. In Fig. 7A, the formation of fluorescent lipid adducts is shown as a function of time and varying ratios of PE/PS. Under these conditions, the DSB-3 adduct formation requires ∼100 min to reach completion. Fig. 7B demonstrates the incremental changes in fluorescent adduct formation (at 100 min after DSB-3 addition) as a function of different ratios of PE/PS and still reveals excellent discrimination between substrate and product for the PSD reaction. Moreover, the overall reduction in lipid concentration (compared with Fig. 5B) also improves the signal (PE) to background (PS) fluorescence of the adducts to ∼3-fold. Fig. 7C shows the concentration dependence of DSB-3 adduct formation as a function of concentration of either PS or PE, demonstrating a linear response over the tested concentrations. In Fig. 7D, the enzyme concentration–dependent formation of PE is shown and demonstrates that the condition of 50 μm PS and 1.5 ng/μl enzyme is sufficient to convert all of the substrate to product in a 75-min enzyme reaction.
Figure 6.
PkPSD enzyme kinetics. Enzyme assays were performed with 50 ng of purified MBP-His6-Δ34PkPSD and varied concentrations of PS (12–102 μm) with 104 cpm Ptd[1′-14C]Ser and 0.78 mm Triton X-100 in each reaction, performed at 37 °C for 20 min. The reaction volume was 100 μl, and 14CO2 was trapped on 2 m KOH impregnated filter paper. Radioactivity was quantified by liquid scintillation spectrometry. Vmax and Km were determined from data points ranging from ∼0.2 to 2 Km concentrations of PS. Data are means ± S.E. (error bars) for eight experiments each performed in duplicate. A, rate of PE formation as a function of substrate concentration. B, double reciprocal analysis of the data from A. Kinetic analyses were also performed using DSB-3 fluorescence to quantify PE formation. C, rate of PE formation detected by fluorescence as a function of substrate concentration. D, double reciprocal analysis of data from C. The fluorescence data summarize results from four independent experiments.
Figure 7.
Reduced scale reactions improve discrimination for PE formation and require longer time for DSB-3 adduct formation. A, time course for development of fluorescence emission after mixing 10 μm DSB-3 with 50 μm total lipid in 0.75 mm Triton X-100 micelles at different PE/PS ratios. B, replot of the data in A for the 120-min time point. C, fluorescence emission of DSB-3 adducts formed with different concentrations of either PS-only or PE-only micelles containing 0.75 mm Triton X-100. 10 μm DSB-3 was incubated with the lipids for 120 min at 22 °C. D, MBP-His6-Δ34PkPSD (0–1.5 ng/μl) was incubated with 50 μm PS, 0.75 mm Triton X-100, for 75 min. The reactions were shifted to pH 9.0 by adjusting to mm 10 μm sodium tetraborate buffer and subsequently 10 μm DSB-3. After 120 min, the fluorescence was determined. Control PE is 50 μm PE (theoretical maximal conversion of PS to PE). Fluorescence measurements for all panels were performed using a Tecan microplate reader. Data for A, B, and C are means ± S.E. (error bars) for three experiments. Data for D are means ± S.E. for four experiments.
Next, we tested the DSB-3–based PSD assay in a 384-well plate using a robotic platform for a future application of a high-throughput screen for PSD inhibitors. The assay was successfully conducted in a volume of 25 μl/well. Mean and S.D. values of the samples were used to calculate signal-to-background (S/B), coefficient of variation (CV), and Z prime (Z′) factors to ensure the assay quality (27). We observed an average 4% CV for positive control reaction samples with active PSD enzymes and 5% CV for negative control samples with heat-inactivated PSD enzymes (range, 2–14 and 3–9%, respectively), an average S/B = 3.5 (range, 2.8–3.9), and an average Z′ = 0.75 (range, 0.45–0.83), demonstrating low variability and high robustness of the assay.
Application of DSB-3 fluorescence to detect PSD activities in cell extracts and membrane preparations from Escherichia coli
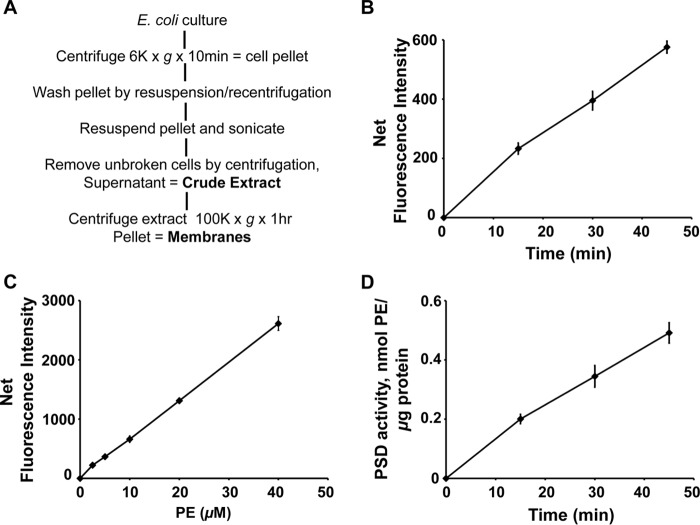
We tested whether the DSB-3 fluorescence–based PSD assay can be more broadly applied to enzyme assays using cell extracts containing only endogenously expressed PSD enzymes. To address this question, we chose E. coli as a source of the PSD enzyme. Fig. 8A provides a brief outline of the methods used to prepare crude extracts and membrane fractions from bacterial cultures. As described for purified MBP-His6-Δ34PkPSD, the method consists of three parts; the first is the PSD catalytic reaction, the second is DSB-3 adduct formation, and the third is fluorimetric detection. In the first step, the experiment was designed to conduct the enzyme assay at high (0.5 mm) PS concentration and high (3.1 mm) Triton X-100 concentration to maximize PSD activity in crude extracts. In the second step, the reaction was diluted by 12.5-fold to reduce the final lipid concentration to 40 μm and Triton X-100 concentration to 0.6 mm, which are optimal for DSB-3 adduct formation. The DSB-3 adduct formation proceeded for 100 min to yield maximum fluorescence. In the third step, the fluorescence data were acquired. Protein concentrations of the cell-free extracts were adjusted to achieve <20% of PS substrate conversion into PE product. As shown in Fig. 8B, the net fluorescence produced in the reaction increased linearly with time. Fig. 8C shows a standard curve for the net fluorescence produced by defined molar amounts of PE. The data in Fig. 8D use the information in B and C of Fig. 8 to calculate the time-dependent production of PE in the reaction. The data clearly demonstrate that DSB-3 can be used to detect PSD activity in cell-free extracts from E. coli.
Figure 8.
Application of DSB-3–based fluorescence PSD assay to cell extracts containing constitutive levels of bacterial PSD. E. coli (Rosetta DE3 strain) was grown to mid-log phase, and the cells were harvested and processed as shown in A to produce crude extracts. Enzyme assays were performed with crude cell-free extracts (200 ng of protein/μl), 0.5 mm PS, and 3.1 mm Triton X-100 at 37 °C for 0–45 min. The enzyme reaction was arrested, and the DSB-3 conjugation was initiated by 12.5-fold dilution of the enzyme reaction mixture in a buffer that contained 10 mm sodium tetraborate (pH 9.0) and 10 μm DSB-3. After 120 min, the fluorescence was quantified. B, net fluorescence intensities of each PSD assay at the indicated time are shown after background correction. Background fluorescence is the value obtained from the PSD assay at zero time with heat-inactivated cell extracts. C, standard curve of DSB-3 fluorescence with PS/PE mixed micelles produced in the presence of heat-inactivated E. coli cell-free extracts. Mock PSD assays of heat-inactivated cell extracts were performed with the mixed PE/PS micelles, varying the lipid ratios from 0 to 100%, where the total phospholipid content of the micelles was maintained at 0.5 mm. DSB-3 conjugation was performed after dilution of the mixture 12.5-fold. Net fluorescence intensities of increasing PE content in the mixed PE/PS micelles are calculated after background correction with the fluorescence value of the 0 mm PE, 0.5 mm PS. D, PSD activity of the E. coli cell-free extracts was calculated by applying the fluorescence data in B and C. The data are from five independent experiments and are means ± S.E. (error bars).
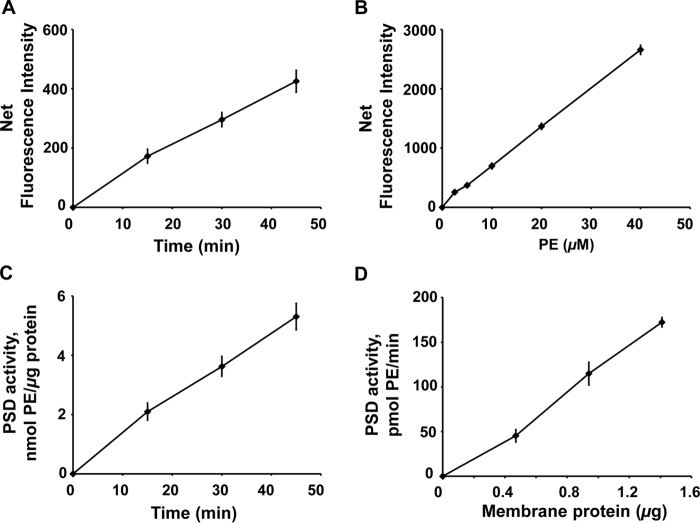
The fluorescence-based PSD assay was also conducted using a purified E. coli membrane fraction in which PSD enzymes are highly enriched. These membrane fractions for the assay removed more than 90% of proteins that could potentially interfere with DSB-3 binding to PE. Similar to assays conducted with cell-free extracts, the fluorescence intensities increased linearly with increasing reaction times (Fig. 9A). Fig. 9B shows the standard curve used for calculation of reaction rates in C and D of Fig. 9. Fig. 9D demonstrates that the catalytic activity reported by the DSB-3 assay increases linearly with the amount of enzyme added to the reaction. Collectively, the above experiments demonstrate that the DSB-3 fluorescence assay can be used under conditions where purified enzyme is not available. Interestingly, there was no noticeable reduction in the fluorescence intensity in the background of membrane samples compared with that of cell-free extracts, despite the fact that the protein content of the membranes was 10% of that for the crude extracts. This latter finding indicates that the primary amino groups present in the proteins of subcellular preparations do not significantly compete with aminophospholipids for DSB-3 binding. Taken together, these measurements of enzyme activity demonstrate that the DSB-3–based PSD assay can be successfully performed with either crude extracts or membranes containing the bacterial PSD enzymes.
Figure 9.
Application of DSB-3–based fluorescence PSD assay to membrane fractions purified from E. coli. A, E. coli PSD enzyme assays were performed with a membrane fraction (14.1 ng of protein/μl) prepared by the methods outlined in Fig. 8A. After the PSD reaction, fluorescent adduct formation with DSB-3 was initiated as described in the legend to Fig. 8B. After 120 min, the fluorescence was quantified. A, net fluorescence intensities of PE adducts are shown after background correction. Background fluorescence was determined with heat-inactivated membranes using the approach described in the legend to Fig. 8B. B, standard curve of DSB-3 fluorescence with PE/PS mixed micelles produced in the presence of heat-inactivated E. coli membranes. Mock PSD assays of heat-inactivated cell extracts were performed with the mixed PE/PS micelles, varying the lipid ratios from 0 to 100%, with the total phospholipid content of the micelles maintained at 0.5 mm. Fluorescence detection was performed after dilution of the mixture 12.5-fold. Net fluorescence intensities of increasing PE content in the mixed PE/PS micelles are calculated after background correction with the fluorescence value of the 0 mm PE, 0.5 mm PS. C, PSD activity of the E. coli cell-free extracts was calculated by applying the fluorescence data in A and B. Net fluorescence intensities of increasing PE in the mixed PE/PS micelles are calculated after background correction with fluorescence value of the 0 mm PE. The data are from six independent experiments and are means ± S.E. D, PSD activities of the E. coli membrane fractions are shown after conducting the PSD assay with varying amounts of membrane fraction (4.7–14.1 ng of protein/μl) for 45 min. The data are from five independent experiments and are means ± S.E. (error bars).
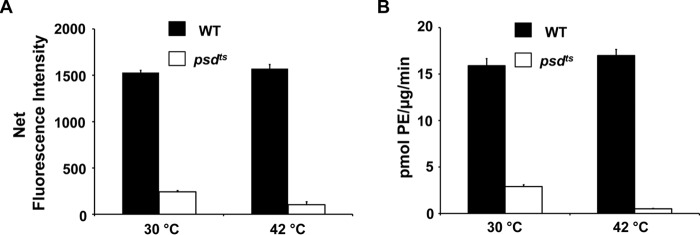
We also tested the fidelity and utility of the DSB-3 detection system when applied to mutant strains of E. coli defective for the expression of active PSD. We measured the activity of cell-free extracts from strains harboring either wildtype or temperature-sensitive alleles (psdts) of the enzyme. The data in Fig. 10 demonstrate that mutant strains grown at the permissive temperature exhibit ∼18% of the catalytic activity of wildtype strains, and shifting these strains to the non-permissive temperature (42 °C) for 4 generations reduces the detectable activity by 97%, in agreement with previously published findings (8, 28).
Figure 10.
Application of DSB-3–based fluorescence PSD assay to cell extracts containing temperature-sensitive bacterial PSD. Wildtype (HB101) and temperature-sensitive psd mutant (EH150) strains of E. coli were grown at 30 °C to early log phase and then either kept at 30 °C or shifted to 42 °C and grown for four generations. Cells were harvested and processed to produce crude extracts. Enzyme assays were performed with crude cell-free extracts (600 ng of protein/μl), 0.5 mm PS, and 3.1 mm Triton X-100 at 30 °C for 30 min. DSB-3 fluorescence detection reactions with the PSD reaction products were conducted as described in the legend to Fig. 8. A, net fluorescence intensities of each PSD assay at 30 min are shown after background correction. Background fluorescence is the value obtained from the PSD assay at zero time with heat-inactivated cell extracts. B, PSD activity of the E. coli cell-free extracts was calculated by applying the standard fluorescence data obtained as described in the legend to Fig. 8C. Standard fluorescence curves with the PE/PS mixed micelles for the three cell types were generated in the presence of corresponding heat-inactivated E. coli extracts. The data are from four independent experiments and are means ± S.E. (error bars).
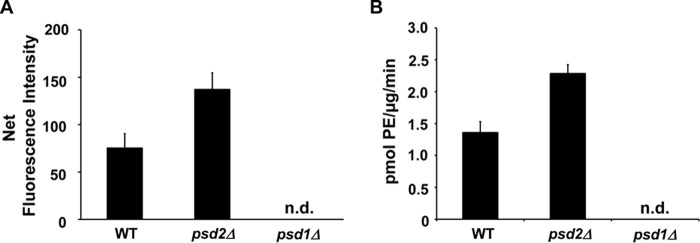
An additional test for the applicability of the DSB-3 detection assay was performed using the yeast Saccharomyces cerevisiae. Crude mitochondrial fractions were prepared, and the PSD activity was quantified in preparations from wildtype, psd1Δ, and psd2Δ strains, as shown in Fig. 11. The data demonstrate that PSD activity in yeast mitochondrial preparations is ∼10% of the activity found for E. coli. Predictably, an S. cerevisiae strain harboring a psd1Δ allele fails to show detectable activity (14, 16). In addition, strains with a psd2Δ allele show increased decarboxylase activity attributable to PSD1. From these latter findings, we conclude that the DSB-3 assay is also useful for evaluating yeast mutants.
Figure 11.
Application of DSB-3–based fluorescence PSD assay to mitochondrial fractions from S. cerevisiae containing null mutations in PSD1 or PSD2. Mitochondrial fractions were obtained from the yeast strains of WT (BY4742) and psd mutant strains (psd1Δ::KanMX/BY4741 and psd2Δ::KanMX/BY4742) as described under “Experimental procedures.” Enzyme assays were performed with mitochondrial fractions (1 μg of protein/μl), 0.5 mm PS, and 3.1 mm Triton X-100 at 30 °C for 30 min. DSB-3 fluorescence detection with the PSD reaction products was conducted as described in Fig. 8. A, net fluorescence intensities of each PSD assay at the indicated time are shown after background correction. Background fluorescence is the value obtained from the PSD assay at zero time with heat-inactivated mitochondrial fractions. B, PSD activity of the mitochondrial fractions was calculated by applying the standard fluorescence data obtained as described in the legend to Fig. 8C. The data are from four independent experiments and are means ± S.E. (error bars). n.d., not detected.
Discussion
The standard method for measuring PSD activity, using radiolabeled PS as a substrate and 14CO2 trapping, has been employed for more than 50 years (29). Other assay systems using [3H]PS or fluorescent 6-(N-methyl-N-(7-nitrobenz-2-oxa-1,3-diazol-4-yl))-PS have also been described, but these assays are far more cumbersome, requiring lipid extraction and thin layer chromatography (30, 31). In this report, we describe a new and highly sensitive system for measuring PSD activity that is based upon fluorescence detection of the PE product of the enzyme reaction. The sensitivity and simplicity of the assay system makes it useful for quantifying enzyme activity using either purified enzymes, cell extracts, or membrane preparations. The fluorescence assay also provides a gateway for application in high-throughput screening platforms.
The relatively recent availability of DSB-3 and its differential reactivity toward soluble primary amines (24) initially suggested that the compound might be useful for detecting phospholipids harboring primary amines. Our data demonstrate that the reaction of 10 μm DSB-3 with excess (0.5 mm) PS and PE produced a robust fluorescence signal that is ∼20-fold higher in intensity than that produced in the presence of excess (10 mm) serine or ethanolamine. These findings indicate that the hydrophobic environment of the amphitropic phospholipids contributes significantly to the fluorescence quantum yield of the adducts. In addition, there is a marked difference in fluorescence quantum efficiency between PS and PE, with PE producing twice the fluorescence intensity of PS on a molar basis. The enhancement of the fluorescence yield by the hydrophobic environment is dependent upon the formation of an imine adduct, because lipids lacking a primary amine (e.g. phosphatidylcholine, phosphatidylinositol, phosphatidylglycerol, and cardiolipin) do not by themselves significantly enhance the intrinsic fluorescence of DSB-3. We were able to successfully trap the unstable imine adduct by reducing the lipid·DSB-3 complex with NaCNBH3 and detect the fluorescent products by thin layer chromatography.
We applied the reactivity of DSB-3 with PS and PE to develop a new method for measuring PSD activity. Our fluorescence data from idealized mixtures of PE/PS and bona fide enzyme reactions yielding different ratios of PE/PS produce nearly identical results. These data provide unambiguous evidence for the utility of using DSB-3 in the detection of PSD activity. Because many high-throughput screens for enzymes are conducted using substrate concentrations near the Km values of the substrates, we also developed an assay system to detect PSD activity at a concentration close to the Km of the PS substrate. These latter alterations also produced an improved signal/background ratio (3.0) in the assay.
This fluorescence assay takes place in three distinct steps. In the first step, the PSD reaction is performed with the PS substrate and a source of enzyme. In the second step, the enzyme reaction is arrested by a shift in pH and the subsequent addition of DSB-3. The elevated pH strongly favors adduct formation between the PE product and DSB-3. Depending on the PS, PE, and DSB-3 concentrations, adduct formation can require 40–100 min. After completion of adduct formation, fluorescence is quantified in the third step of the procedure. Importantly, when conducted in microtiter well format, all of these manipulations can be conducted using sequential additions to a single well.
The fluorescence assay for PSD provides an important new gateway for application in high-throughput screening platforms. Large-scale screening assays for decarboxylase enzymes have been generally challenging (23). One approach has been to couple CO2 production by decarboxylases to enzymes that fix CO2 to substrates (e.g. phosphoenolpyruvate carboxylase) and are further coupled to subsequent enzyme reactions involved in the oxidation of NADH (e.g. malate dehydrogenase) (23). This latter approach also requires screening in environments where ambient CO2 levels are greatly reduced. Although such screens are useful, they are cumbersome and also require additional secondary screens for each enzyme involved in the coupling process. For our purposes, the reactivity of the PE product with DSB-3 proved far simpler for quantifying PSD activity.
The use of DSB-3 in a large-scale screen is not without pitfalls. Most notably, chemical libraries rich in compounds with primary amines and thiols might be expected to scavenge DSB-3 to some degree, and falsely report inhibition of enzymes like PSD, by reducing the amount of DSB-3 available for interaction with the PE product. By screening libraries at concentrations of individual compounds of 10 μm or less, these latter effects can be minimized. An additional complication could also arise if DSB-3 formed an adduct with a library compound that resulted in very high fluorescence. Fortunately, the conventional radiochemical assay for PSD provides an orthogonal assay for verifying any results obtained using DSB-3.
In summary, our studies identify DSB-3 as a sensitive and useful new agent for detecting PSD activity with significant potential for application in high-throughput screening. Because PSDs play a central role in lipid metabolism and membrane biogenesis across nearly all phyla, they may be important new enzyme targets for developing antimicrobial agents. For many bacteria, PSD activity is the only route for synthesizing PE. For yeast, multiple pathways exist for producing PE, but mitochondrial instability results after deleting PSD1. Mammalian systems have at least three additional routes for synthesizing PE (32), and the plasticity of PE synthesis in mammals may make them more tolerant of inhibitors causing temporary losses of endogenous PSD function. Mammalian PSDs are also ensconced within mitochondria and reside in the inner mitochondrial membrane (33), so drugs that do not enter mitochondria but transit microbial plasma membranes could show significant selectivity. Thus, the development and successful application of this fluorescence assay for PSD activity creates a new avenue for probing microbial vulnerabilities to disruption of a central enzyme in membrane biogenesis.
Experimental procedures
Materials
All chemicals for bacterial and yeast growth media were purchased from Sigma, Fisher, and Difco. Phospholipids were purchased from Avanti Polar Lipids. Silica gel plates for thin layer chromatography were purchased from Analtech and EMD. Reagents for quantifying protein were from Bio-Rad. Precast SDS-polyacrylamide gels were purchased from Invitrogen. Mouse monoclonal antibody against the His6 epitope tag was obtained from Clontech (catalogue no. 631212). Other reagents used for ligand blotting were purchased from Bio-Rad and Sigma.
Expression and purification of MBP-His6-Δ34PkPSD
Expression of MBP-His6-Δ34PkPSD in E. coli was performed as described previously (21). A Rosetta DE3 strain harboring a pMAL-C2X-His6-Δ34PkPSD plasmid vector was grown to saturation overnight in 1 liter of LB medium with 0.2% glucose, ampicillin (100 μg/ml), and chloramphenicol (34 μg/ml) and then diluted 100-fold and grown to an A600 of ∼0.5 at 37 °C. Expression of MBP-His6-Δ34PkPSD was induced by the addition of 0.3 mm isopropylthiogalactoside for 2 h at 37 °C. The cells were harvested by centrifugation (4,000 × g, 20 min, 4 °C) and washed by resuspension in water and centrifugation. The cells were resuspended in 25 ml of the disruption buffer (20 mm Tris-HCl, pH 7.4, 200 mm NaCl, 1 mm EDTA, and 10 mm β mercaptoethanol), flash-frozen in a dry ice/ethanol bath, stored overnight at −20 °C, and subsequently thawed on ice water. Cell extracts were obtained by sonication (15-s burst at 30% amplitude using a Fisher Sonic Dismembrator 500, performed 8 times, interrupted by 30-s cooling intervals) followed by centrifugation at 20,000 × g for 20 min at 4 °C. MBP-His6-Δ34PkPSD was purified from the resultant supernatants by amylose column affinity chromatography using methods described in the instruction manual from New England Biolabs (catalog no. E8200S). Briefly, the cell extracts were further diluted 5-fold in disruption buffer and applied to an amylose affinity column. The column was washed with 6-ml aliquots of the disruption buffer 11 times. MBP-His6-Δ34PkPSD proteins were eluted with the disruption buffer containing 10 mm maltose. In total, 20 fractions of 1.2 ml each were collected. The fractions containing the MBP-His6-Δ34PkPSD proteins were identified by polyacrylamide SDS gel electrophoresis followed by Coomassie staining of the gel and Western blot analysis using anti-His6 antibody.
Fluorescence-based PSD assay
The fluorescence-based PSD assay was conducted in a 100-μl volume in a 96-well microtiter plate (Corning, catalog no. 3631) with 0.5 mm PS substrate prepared as a detergent micelle in 1.55 mm Triton X-100 and varying amounts (0–1.25 μg) of MBP-His6-Δ34PkPSD in a buffer of 40 mm NaCl, 1 mm KPO4, pH 7.4. The enzyme reaction was conducted at 30 °C for 45 min with shaking at 120 rpm and was terminated by the addition of 12.5 μl of 100 mm sodium tetraborate buffer, pH 9. The DSB-3 (12.5 μl of a 100 μm solution in 10 mm KPO4, pH 7.4) was added to the reaction solution under reduced light conditions. Fluorescence intensity was monitored with λex = 403 nm and λem = 508 nm, every 10–20 min, for 140 min, using a TECAN Infinite M1000 microplate reader, which was managed by the software program i-control. For the initial high-throughput screen, a formatted PSD assay in 96-well plates was used. The optimized conditions contained 50 μm PS substrate prepared as a detergent micelle in 0.78 mm Triton X-100 and varying amounts (0–250 ng) of MBP-His6-Δ34PkPSDs in a 100-μl reaction volume.
PSD enzyme kinetics
Kinetic parameters were determined using both a radiochemical assay and the fluorescence method for measuring PSD activity. Affinity-purified MBP-His6-Δ34PkPSD was prepared as described above and used for both methods. The radiochemical PSD enzyme assays contained varied concentrations of PS (12–102 μm), 104 cpm of Ptd[1′-14C]Ser, 1.5 mm Triton X-100, and 50 ng of purified MBP-His6-Δ34PkPSD in a 100-μl reaction volume. After incubation at 37 °C for 20 min, the reaction product was trapped as 14CO2 on 2 m KOH-impregnated filter paper, as described previously (14). The DSB-3–based fluorescence assay was conducted as described for the radiochemical assay, but without radioactive PS. After the incubation at 37 °C for 20 min, the reaction tubes were shifted to 0 ºC. Lipid concentrations were adjusted to 50 μm final lipid micelles for determination of fluorescence. Standard curves of product formation were generated from mixtures of PS and PE as in Fig. 7B. Mock reactions contained heat-inactivated enzyme. Reactions were arrested by the addition of 12.5 μl of 100 mm sodium tetraborate buffer, pH 9, followed by the addition of 12.5 μl of 100 μm DSB-3 as described above. Adduct formation was allowed to proceed for 2 h at room temperature with shaking at 100 rpm. Enzyme velocity is reported as nmol/μg/min. The Km value and the Vmax were determined using the Microsoft Office Excel Solver add-in.
Fluorescence-based PSD assay in robotic platform
The assay was conducted with 384-well microtiter plates (Corning 3575). Freshly prepared assay reagents and buffers were frozen at −80 ºC in convenient aliquots and used within a month of preparation. The thawed MBP-His6-Δ34PkPSD was diluted in buffer A-1 (100 mm NaCl, 16 μm EDTA, 160 μm β-mercaptoethanol, 319 μm Tris-HCl, 1 mm KPO4, pH 7.4). The diluted enzyme preparation (10 μl) was dispensed using a Combidrop (Thermo Fisher Scientific) liquid handler for active enzyme and a multichannel pipette for heat-inactivated (negative control) enzyme. The plates were centrifuged (1,000 rpm for 30 s) and then shaken (1,100 rpm for 2 min) to ensure mixing. The PSD assay was initiated by the addition of 10 μl of PS substrate to appropriate wells using the Combidrop, followed by brief centrifugation and shaking. Control reactions consisting of either detergent (no substrate control) or PE (theoretical maximal substrate conversion to product) were dispensed with a multichannel pipettor. Plates were incubated at room temperature for 75 min to allow the enzyme reaction to progress. The final assay conditions were 50 mm NaCl, 0.78 mm Triton X-100, 50 μm PS (or 50 μm PE control), 80 μm β-mercaptoethanol, 160 μm Tris-HCl, 1 mm KPO4, pH 7.4, 30 ng of MBP-His6-Δ34PkPSD (or boiled enzyme control) in a volume of 20 μl. The enzyme reaction was arrested by the addition of 2.5 μl of 100 mm sodium tetraborate buffer (pH 9) and brief centrifugation and shaking. Subsequently, 2.5 μl of 100 μm DSB-3 in 1 mm KH2PO4, pH 7.4, was added to each well, followed by brief centrifugation and shaking and incubation for 2 h in the dark. The MBP-His6-Δ34PkPSD activity was monitored by measuring the fluorescence intensities (403 excitation/508 emission, Tecan Infinite M1000 plate reader).
Fluorescence-based PSD assay of E. coli cell extracts and membranes
To obtain E. coli cell-free extracts and membrane fractions, a Rosetta DE3 strain was grown to saturation overnight in 3 ml of LB medium and then diluted 100-fold in 150 ml of LB and grown for 3.5 h at 37 °C. The cells were harvested by centrifugation (4,000 × g, 20 min, 4 °C) and washed by resuspension in water and centrifugation. The cell pellet was resuspended in 3.75 ml of the disruption buffer, frozen in a dry ice/ethanol bath, and stored at −20 °C until proceeding with additional steps. For enzyme preparations, frozen cells were thawed in an ice water bath and disrupted by sonication (15-s burst at 20% amplitude, performed 8 times, interrupted by 30-s cooling intervals). The crude cell-free extracts were obtained after centrifugation at 6,000 × g for 20 min at 4 °C to remove unbroken cells. Membrane fractions were obtained by centrifugation at 100,000 × g for 60 min, followed by resuspension of the pellets with an equal volume of the disruption buffer. The PSD enzyme assay was conducted in a 100-μl volume in an Eppendorf tube with 0.5 mm PS substrate prepared as a detergent micelle in 3.1 mm Triton X-100 and E. coli cell-free extracts (200 ng/μl of crude extract) or E. coli membrane fractions (14.1 ng/μl of protein from 100,000 × g pellets) in a buffer of 50 mm NaCl and 1 mm KPO4, pH 7.4. The reaction was performed at 37 °C for the indicated times with shaking at 120 rpm. The enzyme reaction was terminated, and the fluorescence detection reaction was initiated by diluting 10 μl of PSD reaction mixture in a 115-μl volume of a DSB-3 reaction buffer (10.9 mm sodium tetraborate buffer, pH 9, 10.9 μm DSB-3, 0.4 mm Triton X-100, and 0.87 mm KPO4, pH 7.4). Fluorescence intensity was monitored as described above. Control PSD enzyme reactions contained heat-inactivated PSD enzyme sources and various concentrations of PE/PS mixed micelles, in which the total phospholipid content of the micelles was maintained at 0.5 mm. These control reactions were subjected to the same incubation and dilution manipulations as the active enzyme samples. Fluorescence intensities from control reactions were used to produce the standard curve of fluorescence emissions for varying concentrations of PE. In experiments comparing wildtype bacterial enzyme with that from psdts strains, the cultures were initially grown at 30 °C to early log phase and then maintained at 30 °C or shifted to 42 °C for 4 generations before preparation of crude extracts, as described above. The enzyme assays were performed at 30 °C
Fluorescence-based PSD assay of S. cerevisiae PSDs
To assess PSD activities in yeast, mitochondrial fractions were obtained from wildtype strains (BY4742) and strains with null mutations in either PSD1 (psd1Δ::KanMX-BY4741) or PSD2 (psd2Δ::KanMX-BY4741). Growth of the yeast strains and preparation of the mitochondria were as described previously (34, 35). Briefly, yeast strains were grown to early log phase in 1-liter cultures of YP-lactate medium supplemented with ethanolamine (2 mm) at 30 °C. Crude mitochondria were prepared by Dounce homogenizations of spheroplasts generated by zymolyase treatment of the cells, followed by differential centrifugation. The mitochondrial pellets were suspended in 0.6 m sorbitol, 20 mm MES, pH 6.0, and used as the enzyme source. PSD reactions in 100 μl contained mitochondrial fractions (100 μg of protein), 0.5 mm PS, and 3.1 mm Triton X-100 and were performed at 30 °C for 30 min. Fluorescent PE product was detected as described above for E. coli extracts.
Phospholipid analysis
Phospholipids from PSD assays were extracted (36) and analyzed by thin layer chromatography on Silica 60 plates using chloroform/methanol/water (65:25:4, v/v/v). Lipids were visualized with iodine vapor and quantified by measuring phosphate (37). The results are shown as the percentage of PE as a fraction of total phospholipid.
Author contributions
J.-Y.C., C.B.M., and D.R.V. conceptualization; J.-Y.C., Y.V.S., S.M.V.S., and D.R.V. investigation; J.-Y.C., Y.V.S., and D.R.V. methodology; J.-Y.C., Y.V.S., and D.R.V. writing-original draft; J.-Y.C., Y.V.S., C.B.M., and D.R.V. writing-review and editing; J.K., U.H.F.B., and D.R.V. resources; U.H.F.B., C.B.M., and D.R.V. supervision; C.B.M. and D.R.V. funding acquisition; D.R.V. project administration.
This work was supported by National Institutes of Health Grants GM104485 (to D. R. V.) and AI097218 (to C. B. M.). The authors declare that they have no conflicts of interest with the contents of this article. The content is solely the responsibility of the authors and does not necessarily represent the official views of the National Institutes of Health.
- PSD
- phosphatidylserine decarboxylase
- PkPSD and PfPSD
- PSD from P. knowlesi and P. falciparum, respectively
- PE
- phosphatidylethanolamine
- PS
- phosphatidylserine
- DSB-3 distyrylbenzene-bis-aldehyde
- (4,4′-((1E,1′E)-(2,5-bis((2,5,8,12,15,18-hexaoxanonadecan-10-yl)oxy)-1,4-phenylene) bis(ethene-2,1-diyl))dibenzaldehyde)
- MBP
- maltose-binding protein.
References
- 1. Boggs K. P., Rock C. O., and Jackowski S. (1995) Lysophosphatidylcholine and 1-O-octadecyl-2-O-methyl-rac-glycero-3-phosphocholine inhibit the CDP-choline pathway of phosphatidylcholine synthesis at the CTP:phosphocholine cytidylyltransferase step. J. Biol. Chem. 270, 7757–7764 10.1074/jbc.270.13.7757 [DOI] [PubMed] [Google Scholar]
- 2. Pessi G., Kociubinski G., and Mamoun C. B. (2004) A pathway for phosphatidylcholine biosynthesis in Plasmodium falciparum involving phosphoethanolamine methylation. Proc. Natl. Acad. Sci. U.S.A. 101, 6206–6211 10.1073/pnas.0307742101 [DOI] [PMC free article] [PubMed] [Google Scholar]
- 3. González-Bulnes P., Bobenchik A. M., Augagneur Y., Cerdan R., Vial H. J., Llebaria A., and Ben Mamoun C. (2011) PG12, a phospholipid analog with potent antimalarial activity, inhibits Plasmodium falciparum CTP:phosphocholine cytidylyltransferase activity. J. Biol. Chem. 286, 28940–28947 10.1074/jbc.M111.268946 [DOI] [PMC free article] [PubMed] [Google Scholar]
- 4. Bobenchik A. M., Witola W. H., Augagneur Y., Nic Lochlainn L., Garg A., Pachikara N., Choi J. Y., Zhao Y. O., Usmani-Brown S., Lee A., Adjalley S. H., Samanta S., Fidock D. A., Voelker D. R., Fikrig E., and Ben Mamoun C. (2013) Plasmodium falciparum phosphoethanolamine methyltransferase is essential for malaria transmission. Proc. Natl. Acad. Sci. U.S.A. 110, 18262–18267 10.1073/pnas.1313965110 [DOI] [PMC free article] [PubMed] [Google Scholar]
- 5. Choi J. Y., Kumar V., Pachikara N., Garg A., Lawres L., Toh J. Y., Voelker D. R., and Ben Mamoun C. (2016) Characterization of Plasmodium phosphatidylserine decarboxylase expressed in yeast and application for inhibitor screening. Mol. Microbiol. 99, 999–1014 10.1111/mmi.13280 [DOI] [PMC free article] [PubMed] [Google Scholar]
- 6. Garg A., Lukk T., Kumar V., Choi J. Y., Augagneur Y., Voelker D. R., Nair S., and Ben Mamoun C. (2015) Structure, function and inhibition of the phosphoethanolamine methyltransferases of the human malaria parasites Plasmodium vivax and Plasmodium knowlesi. Sci. Rep. 5, 9064 10.1038/srep09064 [DOI] [PMC free article] [PubMed] [Google Scholar]
- 7. Choi J. Y., Wu W. I., and Voelker D. R. (2005) Phosphatidylserine decarboxylases as genetic and biochemical tools for studying phospholipid traffic. Anal. Biochem. 347, 165–175 10.1016/j.ab.2005.03.017 [DOI] [PubMed] [Google Scholar]
- 8. Hawrot E., and Kennedy E. P. (1975) Biogenesis of membrane lipids: mutants of Escherichia coli with temperature-sensitive phosphatidylserine decarboxylase. Proc. Natl. Acad. Sci. U.S.A. 72, 1112–1116 10.1073/pnas.72.3.1112 [DOI] [PMC free article] [PubMed] [Google Scholar]
- 9. Baunaure F., Eldin P., Cathiard A. M., and Vial H. (2004) Characterization of a non-mitochondrial type I phosphatidylserine decarboxylase in Plasmodium falciparum. Mol. Microbiol. 51, 33–46 [DOI] [PubMed] [Google Scholar]
- 10. Rontein D., Wu W. I., Voelker D. R., and Hanson A. D. (2003) Mitochondrial phosphatidylserine decarboxylase from higher plants: functional complementation in yeast, localization in plants, and overexpression in Arabidopsis. Plant Physiol. 132, 1678–1687 10.1104/pp.103.023242 [DOI] [PMC free article] [PubMed] [Google Scholar]
- 11. Gupta N., Hartmann A., Lucius R., and Voelker D. R. (2012) The obligate intracellular parasite Toxoplasma gondii secretes a soluble phosphatidylserine decarboxylase. J. Biol. Chem. 287, 22938–22947 10.1074/jbc.M112.373639 [DOI] [PMC free article] [PubMed] [Google Scholar]
- 12. Hartmann A., Hellmund M., Lucius R., Voelker D. R., and Gupta N. (2014) Phosphatidylethanolamine synthesis in the parasite mitochondrion is required for efficient growth but dispensable for survival of Toxoplasma gondii. J. Biol. Chem. 289, 6809–6824 10.1074/jbc.M113.509406 [DOI] [PMC free article] [PubMed] [Google Scholar]
- 13. Kuge O., Nishijima M., and Akamatsu Y. (1991) A cloned gene encoding phosphatidylserine decarboxylase complements the phosphatidylserine biosynthetic defect of a Chinese hamster ovary cell mutant. J. Biol. Chem. 266, 6370–6376 [PubMed] [Google Scholar]
- 14. Trotter P. J., Pedretti J., and Voelker D. R. (1993) Phosphatidylserine decarboxylase from Saccharomyces cerevisiae: isolation of mutants, cloning of the gene, and creation of a null allele. J. Biol. Chem. 268, 21416–21424 [PubMed] [Google Scholar]
- 15. Clancey C. J., Chang S. C., and Dowhan W. (1993) Cloning of a gene (PSD1) encoding phosphatidylserine decarboxylase from Saccharomyces cerevisiae by complementation of an Escherichia coli mutant. J. Biol. Chem. 268, 24580–24590 [PubMed] [Google Scholar]
- 16. Trotter P. J., and Voelker D. R. (1995) Identification of a non-mitochondrial phosphatidylserine decarboxylase activity (PSD2) in the yeast Saccharomyces cerevisiae. J. Biol. Chem. 270, 6062–6070 10.1074/jbc.270.11.6062 [DOI] [PubMed] [Google Scholar]
- 17. Nerlich A., von Orlow M., Rontein D., Hanson A. D., and Dörmann P. (2007) Deficiency in phosphatidylserine decarboxylase activity in the psd1 psd2 psd3 triple mutant of Arabidopsis affects phosphatidylethanolamine accumulation in mitochondria. Plant Physiol. 144, 904–914 10.1104/pp.107.095414 [DOI] [PMC free article] [PubMed] [Google Scholar]
- 18. Dennis E. A., and Kennedy E. P. (1972) Intracellular sites of lipid synthesis and the biogenesis of mitochondria. J. Lipid Res. 13, 263–267 [PubMed] [Google Scholar]
- 19. van Golde L. M., Raben J., Batenburg J. J., Fleischer B., Zambrano F., and Fleischer S. (1974) Biosynthesis of lipids in Golgi complex and other subcellular fractions from rat liver. Biochim. Biophys. Acta 360, 179–192 10.1016/0005-2760(74)90168-4 [DOI] [PubMed] [Google Scholar]
- 20. Choi J. Y., Augagneur Y., Ben Mamoun C., and Voelker D. R. (2012) Identification of gene encoding Plasmodium knowlesi phosphatidylserine decarboxylase by genetic complementation in yeast and characterization of in vitro maturation of encoded enzyme. J. Biol. Chem. 287, 222–232 10.1074/jbc.M111.313676 [DOI] [PMC free article] [PubMed] [Google Scholar]
- 21. Choi J. Y., Duraisingh M. T., Marti M., Ben Mamoun C., and Voelker D. R. (2015) From protease to decarboxylase: the molecular metamorphosis of phosphatidylserine decarboxylase. J. Biol. Chem. 290, 10972–10980 10.1074/jbc.M115.642413 [DOI] [PMC free article] [PubMed] [Google Scholar]
- 22. Hedstrom L. (2002) Serine protease mechanism and specificity. Chem. Rev. 102, 4501–4524 10.1021/cr000033x [DOI] [PubMed] [Google Scholar]
- 23. Smithson D. C., Shelat A. A., Baldwin J., Phillips M. A., and Guy R. K. (2010) Optimization of a non-radioactive high-throughput assay for decarboxylase enzymes. Assay Drug Dev. Technol. 8, 175–185 10.1089/adt.2009.0249 [DOI] [PMC free article] [PubMed] [Google Scholar]
- 24. Kumpf J., and Bunz U. H. (2012) Aldehyde-appended distyrylbenzenes: amine recognition in water. Chemistry 18, 8921–8924 10.1002/chem.201200930 [DOI] [PubMed] [Google Scholar]
- 25. Kumpf J., Freudenberg J., and Bunz U. H. (2015) Distyrylbenzene-aldehydes: identification of proteins in water. Analyst 140, 3136–3142 10.1039/C5AN00155B [DOI] [PubMed] [Google Scholar]
- 26. Borch R. F., Bernstein M., and Dupont Durst H. (1971) Cyanohydridoborate anion as a selective reducing agent. J. Am. Chem. Soc. 93, 2897–2904 10.1021/ja00741a013 [DOI] [Google Scholar]
- 27. Zhang J. H., Chung T. D., and Oldenburg K. R. (1999) A simple statistical parameter for use in evaluation and validation of high throughput screening assays. J. Biomol. Screen. 4, 67–73 10.1177/108705719900400206 [DOI] [PubMed] [Google Scholar]
- 28. Hawrot E., and Kennedy E. P. (1978) Phospholipid composition and membrane function in phosphatidylserine decarboxylase mutants of Escherichia coli. J. Biol. Chem. 253, 8213–8220 [PubMed] [Google Scholar]
- 29. Kanfer J., and Kennedy E. P. (1964) Metabolism and function of bacterial lipids. II. Biosynthesis of phospholipids in Escherichia coli. J. Biol. Chem. 239, 1720–1726 [PubMed] [Google Scholar]
- 30. Voelker D. R. (1989) Phosphatidylserine translocation to the mitochondrion is an ATP-dependent process in permeabilized animal cells. Proc. Natl. Acad. Sci. U.S.A. 86, 9921–9925 10.1073/pnas.86.24.9921 [DOI] [PMC free article] [PubMed] [Google Scholar]
- 31. Voelker D. R. (1991) Adriamycin disrupts phosphatidylserine import into the mitochondria of permeabilized CHO-K1 cells. J. Biol. Chem. 266, 12185–12188 [PubMed] [Google Scholar]
- 32. van Meer G., Voelker D. R., and Feigenson G. W. (2008) Membrane lipids: where they are and how they behave. Nat. Rev. Mol. Cell Biol. 9, 112–124 10.1038/nrm2330 [DOI] [PMC free article] [PubMed] [Google Scholar]
- 33. Osman C., Voelker D. R., and Langer T. (2011) Making heads or tails of phospholipids in mitochondria. J. Cell Biol. 192, 7–16 10.1083/jcb.201006159 [DOI] [PMC free article] [PubMed] [Google Scholar]
- 34. Schumacher M. M., Choi J. Y., and Voelker D. R. (2002) Phosphatidylserine transport to the mitochondria is regulated by ubiquitination. J. Biol. Chem. 277, 51033–51042 10.1074/jbc.M205301200 [DOI] [PubMed] [Google Scholar]
- 35. Glick B. S., and Pon L. A. (1995) Isolation of highly purified mitochondria from Saccharomyces cerevisiae. Methods Enzymol. 260, 213–223 10.1016/0076-6879(95)60139-2 [DOI] [PubMed] [Google Scholar]
- 36. Bligh E. G., and Dyer W. J. (1959) A rapid method of total lipid extraction and purification. Can. J. Biochem. Physiol. 37, 911–917 10.1139/y59-099 [DOI] [PubMed] [Google Scholar]
- 37. Rouser G., Siakotos A. N., and Fleischer S. (1966) Quantitative analysis of phospholipids by thin layer chromatography and phosphorus analysis of spots. Lipids 1, 85–86 10.1007/BF02668129 [DOI] [PubMed] [Google Scholar]


