

Abstract
Tau is a microtubule (MT)-associated protein that regulates MT dynamics in the axons of neurons. Tau binds to MTs via its C-terminal MT-binding repeats. There are two types of tau, those with three (3R) or four (4R) MT-binding repeats; 4R tau has a stronger MT-stabilizing activity than 3R tau. The MT-stabilizing activity of tau is regulated by phosphorylation. Interestingly, both the isoform and phosphorylation change at the time of neuronal circuit formation during postnatal development; highly phosphorylated 3R tau is replaced with 4R tau, which is less phosphorylated. However, it is not known how the transition of the isoforms and phosphorylation are regulated. Here, we addressed this question using developing mouse brains. Detailed analysis of developing brains revealed that the switch from 3R to 4R tau occurred during postnatal day 9 (P9) to P18 under the same time course as the conversion of phosphorylation from high to low. However, hypothyroidism, which is known to delay brain development, delayed the timing of tau dephosphorylation but not the exchange of isoforms, indicating that isoform switching and phosphorylation are not necessarily linked. Furthermore, we confirmed this finding by using mouse brains that expressed a single isoform of human tau. Human tau, either 3R or 4R, reduced phosphorylation levels during development even though the isoform did not change. We also found that 3R tau and 4R tau were phosphorylated differently in vivo even at the same developmental days. These results show for the first time that the phosphorylation and isoform alteration of tau are regulated differently during mouse development.
Keywords: alternative splicing, Alzheimer disease, brain, development, phosphorylation, Tau protein (Tau), AT8, Phos-tag, hypothyroidism, isoform
Introduction
Tau is a microtubule (MT)2-associated protein that is primarily expressed in axons of neurons (1–3). Tau plays a role in axonal elongation and maintenance via the assembly and stabilization of MTs (3, 4). Tau is an extended molecule that is composed of an N-terminal projection domain and a C-terminal MT-binding repeat (MTB) region. Alternative mRNA splicing of N-terminal insertions and C-terminal MTBs produces six isoforms of tau, all of which are expressed in the adult human brain. In particular, the splicing of exon 10, which encodes the second MT-binding repeat, results in the generation of three-repeat (3R) or four-repeat (4R) tau (5). 4R tau has a stronger MT-binding and assembly ability than 3R tau (6–8), indicating that they have distinct functions. Isoforms expressed in fetal and adult brains are different; 3R tau alone is expressed in fetal and early postnatal periods, whereas 4R tau is expressed in the adult mouse brain, and both 3R and 4R tau are expressed at a 1:1 ratio in an adult human brain (9–14). However, it is not known why the isoforms are changed and how the change is regulated.
Tau is phosphorylated at many sites by a variety of protein kinases (3, 15). It is well documented that tau is hyperphosphorylated in Alzheimer's disease (AD) brains (1–3, 16–20). More than 40 abnormal phosphorylation sites have been identified in aggregated AD tau. Interestingly, tau is also highly phosphorylated in fetal and early postnatal brains, and the highly phosphorylated embryonic tau is changed to the less phosphorylated adult tau during brain development (4, 16, 21). Phosphorylation regulates tau's function. Although a large number of studies have been performed on tau phosphorylation, why and how the phosphorylation states of tau decrease in accordance with the alteration from embryonic 3R tau to adult 4R tau are unknown.
The developmental changes of the isoforms and phosphorylation occur 2–3 weeks postnatally, and this time window corresponds to the critical period when neuronal plasticity is dramatically altered (22, 23). Thyroid hormone is a factor that affects brains at that time. Its deficiency delays brain development, resulting in developmental diseases such as mental retardation (24, 25). A pioneering experiment on the effect of hypothyroid conditions on tau expression was performed in the early 1990s (26). The authors reported that thyroid hormone deficiency delays the transition from immature tau to mature tau at a transcriptional level. However, there have been no subsequent reports on its effect at the protein level. On the other hand, thyroid hormone has been shown to affect tau phosphorylation at two sites, Ser-199 and Ser-422 (27). Thus, the effect of thyroid hormone on developmental changes in the isoforms and the phosphorylation of tau are investigated separately. In addition, even in the normal developmental changes of the isoforms and phosphorylation, most previous studies have been performed independently, and it is unknown whether they are coupled. In this study, we examined the relationship between the changes in tau isoforms and phosphorylation during brain development of normal, hypothyroid, and human 3R or 4R knockin mice using 3R- or 4R-specific antibodies for tau isoforms and Phos-tag SDS-PAGE for tau phosphorylation.
Results
Expression of 3R and 4R tau in mouse brain during postnatal development
To investigate the developmental regulation of tau expression in mouse brains, we first examined the expression levels of tau in the cerebral cortex from postnatal day 5 (P5) to P30 by immunoblotting with Tau5, the antibody that recognizes total tau (Fig. 1A, Tau5). Tau5 reactivity showed biphasic changes in expression; the expression increased ∼31% from P5 to P12 followed by a decrease by ∼60% at P18 and then a gradual decrease until P30 (Fig. 1A, lower panel). A minor tau band above the major tau that appeared at P9 and P12 was highly phosphorylated 4R tau (Fig. 1A, arrowhead in the blot of Tau5) as described below.
Figure 1.
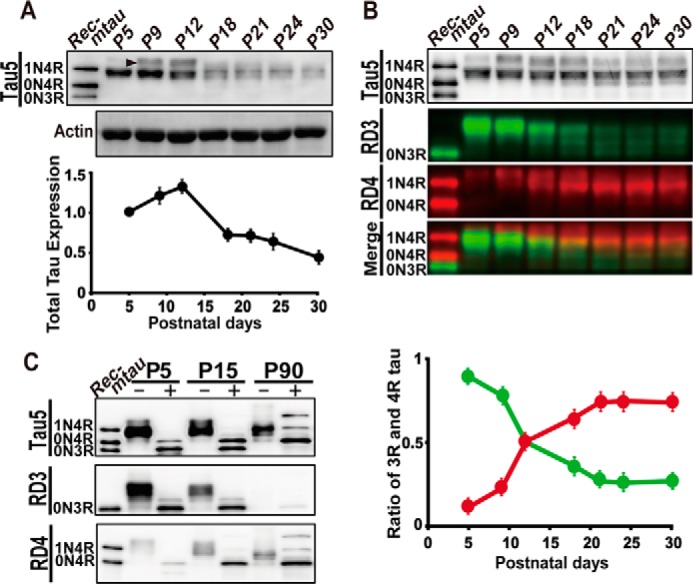
Expression of 3R and 4R tau in the mouse brain during postnatal development. A, an immunoblot of total tau in mouse brains from P5 to P30 with Tau5. The extracts of mouse cerebral cortex at the indicated postnatal days were applied on each lane after normalization with actin (lower) and blotted with Tau5 (upper). Rec-mtau is recombinant mouse tau (1N4R, 0N4R, and 0N3R). The quantification of tau is shown at the bottom. The ratio of tau to that at P5 is represented as the mean (n = 3). Error bars represent S.E. B, the percent ratio of 3R and 4R tau expressed in mouse brain from P5 to P30. The amount of tau was normalized with Tau5 (top). Immunoblots with the 3R tau-specific antibody RD3 and the 4R tau-specific antibody RD4 are shown in green and red, respectively. The merge of 3R and 4R tau is at the bottom. The ratio of 3R and 4R tau, RD3 or RD4/(RD3 + RD4), is quantified and shown below as the mean (n = 3). Error bars represent S.E. C, analysis of tau isoforms after dephosphorylation with ALP. The extracts of cerebral cortex at P5, P15, and P90 were treated with (+) or without (−) ALP at 37 °C for 4 h and immunoblotted with Tau5, RD3, and RD4. The left lane is recombinant mouse tau (Rec-mtau).
To determine how tau isoforms change from 3R fetal tau to 4R adult tau, tau was probed with 3R- and 4R-specific antibodies, RD3 and RD4, respectively. To quantitatively measure the ratio of 3R and 4R isoforms in total tau, we adjusted the total tau protein in samples using Tau5 antibody (Fig. 1B, Tau5). The immunoblot analysis with RD3 demonstrated that 3R tau was highly expressed at P5 and P9 and then decreased until P21 (Fig. 1B, RD3, green). In contrast, 4R tau increased from P5 to P18 and then showed a constant expression at least until P30 (Fig. 1B, RD4, red). A merge of RD3 and RD4 is shown in the fourth panel of Fig. 1B. 4R tau appeared above the 3R tau band at P5 (as described above in Fig. 1A) and gradually increased the electrophoretic mobility to almost the same position of 3R tau as the ratio increased (Fig. 1B, Merge). 4R tau above 3R tau at P5 should be highly phosphorylated. Because a major band of 3R and 4R tau showed the same electrophoretic mobility in SDS-PAGE, their discrimination would require the use of isoform-specific antibodies. Because we adjusted the immunoreaction of RD3 and RD4 with recombinant mouse tau to those with Tau5 (Fig. S1), we could measure the ratio of 3R or 4R tau in total tau directly by calculating 3R tau or 4R tau/(3R tau + 4R tau) (Fig. 1B, bottom panel). The decrease in 3R tau and increase of 4R tau started at P5 and was almost complete at P18, and 3R or 4R tau showed a 50% decrease or increase, at around P12. The changing patterns of 3R and 4R tau isoform show a mirror image of each other, which confirms that the protein expression of 3R and 4R tau exactly follows the alternative splicing of tau mRNA.
Both 3R and 4R tau generate three isoforms with a different number of N-terminal insertions, 0N, 1N, and 2N (5). To examine which isoform is expressed at postnatal and adult stages, tau was dephosphorylated and compared with recombinant 0N3R, 0N4R, and 1N4R tau by immunoblotting with RD3 or RD4 (Fig. 1C). Dephosphorylation by alkaline phosphatase (ALP) increased the mobility, which resulted in two or three sharp bands depending on the postnatal day. 2N4R tau was confirmed by comparing with human tau 6 isoforms (Fig. S1B). Mouse tau is 9 amino acids shorter than the corresponding human tau isoform. At P5, 0N3R tau was mainly expressed. Nearly equal amounts of 0N3R and 0N4R tau were expressed at P15. At P90 in adult animals, 1N4R and 2N4R became expressed, although the amount was less than the amount of 0N4R (Fig. 1C).
Phosphorylation profiles of 3R and 4R tau in developing mouse brains
Previous studies on tau phosphorylation in developing brains used a repertoire of anti-phosphotau antibodies (17, 21). These studies provided information on the relative change in phosphorylation at respective sites, but it is difficult to gain insight on the total phosphorylation states. Here, we exploited the Phos-tag method to analyze tau phosphorylation profiles and levels. Phosphorylated proteins are shifted upward dramatically and are separated depending on the extent and sites of phosphorylation during Phos-tag SDS-PAGE (28–30). Fig. 2 shows the banding patterns of tau in developing mouse brains probed with Tau5 for total tau, RD3 for 3R tau, and RD4 for 4R tau in immunoblots after Phos-tag SDS-PAGE. The applied tau was normalized by respective antibodies. Recombinant nonphosphorylated mouse tau is included in the left lane to indicate the position of nonphosphorylated tau and the specificity of the immunoreaction. Tau was separated into many bands in Phos-tag SDS-PAGE when probed with any of Tau5, RD3, and RD4 antibodies, indicating that tau, either 3R or 4R, is present as a number of different phosphorylation states (phosphoisotypes) in brains. Tau bands, all at P5 and most at P21, were detected in the region above nonphosphorylated recombinant tau on the blots, indicating their phosphorylation. A downward shift was clearly observed with 3R tau from P9 to P18 (Fig. 2, RD3), indicating that 3R tau is dephosphorylated gradually over this period of time. The nonphosphorylated band was also detected after P18 (Fig. 2, arrowhead in RD3), and phosphorylation levels became constant after P21. 4R tau was also found to be shifted upward at P9, and a fraction moving faster was increased at P12 and P18 (Fig. 2A, RD4). However, the increase in the downward shift appeared smaller than that of 3R tau. These results reveal for the first time that 3R and 4R tau are phosphorylated differently during brain development as observed via the combinatory use of Phos-tag and 3R/4R-specific antibodies.
Figure 2.

Phosphorylation profiles of 3R and 4R tau in developing mouse brains. A, immunoblots of tau in postnatal mouse brains from P5 to P30 with Tau5 (left), RD3 (middle), and RD4 (right) after Phos-tag SDS-PAGE. The center of phosphorylation mass was measured by densitometric scanning of the region indicated by dotted lines in the blots of RD3 and RD4, and is indicated by white asterisks. Rec-mtau is recombinant mouse tau. Black arrowheads indicate non-phosphorylated 0N3R tau in RD3 and 0N4R tau in RD4. B, comparisons of the decrease in the 3R or 4R tau isoform and phosphorylation during postnatal development. For the 3R tau isoform, the data from Fig. 1B is used (black circles, y axis on the left side). For phosphorylation levels, the center of phosphorylation mass (CPM) in the blot of RD3 (middle in A) and RD4 (right in A) is used (white circles for RD3 and white triangles for RD4, y axis on the right side). The data are presented as the mean (n = 3). Error bars represent S.E. a.u., arbitrary units.
The conversion of the isoforms and phosphorylation appeared to occur at the same time during development. In particular, this was clear with the decrease in 3R tau (Fig. 1B) and its dephosphorylation (Fig. 2A, RD3). To definitively demonstrate this theory, we defined the center of phosphorylation mass as a parameter that represents the average of the overall phosphorylation of proteins composed of many phosphoisotypes. Practically, the center of phosphorylation mass was estimated as the average migration of phosphoisotypes separated by Phos-tag according to the method of the center of mass in ImageJ. The positions of the center of phosphorylation mass are marked in each lane of the blot with RD3 and RD4 (Fig. 2A, asterisks). The plots indicate that the dephosphorylation of 3R tau proceeds almost identically with the isoform change (Fig. 2B). The degree of dephosphorylation seemed to be smaller in 4R tau than in 3R, although it proceeded in the same time course.
Regional differences in tau isoforms and tau phosphorylation in adult mouse brain
In contrast to humans in which both 3R and 4R tau are equally expressed in the adult brain (5, 9), only 4R tau isoforms are expressed in adult brain of mice or rats (10). However, particular brain areas known for neurogenesis have been reported to express 3R tau in adults (13). We examined the phosphorylation states of tau in those areas (the hippocampus and olfactory bulb) compared with those of the cerebral cortex and cerebellum. Tau in those regions at P5 was also examined as a reference. The amount of tau was adjusted with Tau5 (Fig. 3A, upper panel). Both postnatal and adult tau showed a similar electrophoretic mobility in Laemmli SDS-PAGE at a position between recombinant 0N4R and 1N4R tau (Fig. 3A, upper panel). When tau was probed with RD3 and RD4 by immunoblotting (Fig. 3A, lower panels), it was shown that tau at P5 was mostly 3R, and tau in adults at 3 months was mainly 4R in the four regions.
Figure 3.

Isoforms and the phosphorylation of tau in various brain regions of the adult mouse. A, immunoblots of tau in the cerebral cortex (Cx), cerebellum (Cb), hippocampus (Hc), and olfactory bulb (Ob) at P5 and at P90 (adult (Ad)) with Tau5, RD3, and RD4. The amounts of tau were adjusted with Tau5. Rec-mtau is recombinant mouse tau. B, an immunoblot of tau in four brain regions with Tau5 before (−) or after (+) dephosphorylation with ALP. Below are densitometric scans of dephosphorylated tau: blue, cerebral cortex; red, cerebellum; green, hippocampus; and purple, olfactory bulb. C, immunoblots of tau in the olfactory bulb (Ob) of adult mice with RD3 and RD4 after dephosphorylation with ALP (+). Tau before dephosphorylation is shown in lane −. The left lane is recombinant mouse tau (Rec-mtau).
To identify tau isoforms with N-terminal insertions, we dephosphorylated adult tau with ALP. Tau5 detected three tau bands in every region, which would correspond to 0N, 1N, and 2N isoforms (Fig. 3B, upper panel, +). Their relative ratio was estimated by densitometric scanning (Fig. 3B, lower panel). 0N4R tau was most abundant in all four regions, accounting for ∼80% of total tau in the olfactory bulb and ∼60% in other regions. Interestingly, the relative ratio of tau isoforms with different N-terminal insertions was slightly different depending on brain regions, whereas the expression levels of the 1N4R and 2N4R isoforms were roughly equal in the cerebral cortex and hippocampus (Fig. 3B, blue and green, respectively), and 2N4R expression was higher than 1N4R expression in the cerebellum (Fig. 3B, red). In contrast, in the olfactory bulb, a band ahead of 0N4R tau on the electrophoretic mobility assay was detected in a higher amount than 1N4R and 2N4R tau (Fig. 3B, purple). This faster migrating band was shown to be 3R tau by blot analysis with RD3 (Fig. 3C, left). 3R tau in the olfactory bulb would be expressed in young neurons, which are continuously migrating into the olfactory bulb in the adult stage.
We analyzed the overall phosphorylation of tau in these regions using Phos-tag SDS-PAGE (Fig. S1C). The phosphorylation states of tau were similar in the four regions at P5. In the adult brains, they were slightly variable; in particular, the olfactory bulb showed a slightly stronger reaction in the upper phosphorylation region with less of the nonphosphorylated tau than that in other regions (Fig. S1C, arrowheads). This may be due to the 3R isoform expressed in those regions.
The conversion of tau from 3R to 4R is not affected by hypothyroidism
The conversion in tau isoforms and phosphorylation proceeded similarly during P5 to P18 (Figs. 1 and 2). One of the objectives in this study was to determine whether the switch of the isoforms is associated with the change in phosphorylation. To separate these events, if possible, we used 2-mercapto-1-methylimidazole (MMI), an inhibitor of thyroid hormone synthesis. Thyroid hormone is essential for normal brain development, and its perinatal deficiency causes developmental retardation (24, 25). Furthermore, hypothyroidism is reported to delay the transition between 3R and 4R tau transcripts in the rat brain (26). Hypothyroidism was induced in mice by administering MMI in the drinking water as described previously (27). Its effect was seen by reduced body size and weight (Fig. S2, A and B) as reported previously (27). The growth rate recovered to that of control mice after P21 even with the continuous administration of MMI. Because the cerebellum is severely affected by hypothyroid conditions (31–33), we examined mainly the cerebellum of MMI-treated mice.
We observed the delay of brain development in mice treated with MMI through Nissl staining of frozen sections. Although brain size was smaller in MMI-treated mice, differences were not so obvious when whole brains were observed (Fig. S3A). It is reported that the hypothyroid condition affects the cerebellum by delaying the migration of granule cells from the outer granular layer to the inner granule layer and then the growth of the molecular layer (31–33). We closely inspected the cerebellum cortex (Fig. 4). As was reported previously, the outer granule layer was thicker and the molecular layer was thinner in the cerebellum of mice treated with MMI at P9 to P15. This delay disappeared after P18 when outer granule cells completed their migration to the inner granule layer. These results confirmed that the maturation of the cerebellar cortex is delayed by hypothyroidism.
Figure 4.
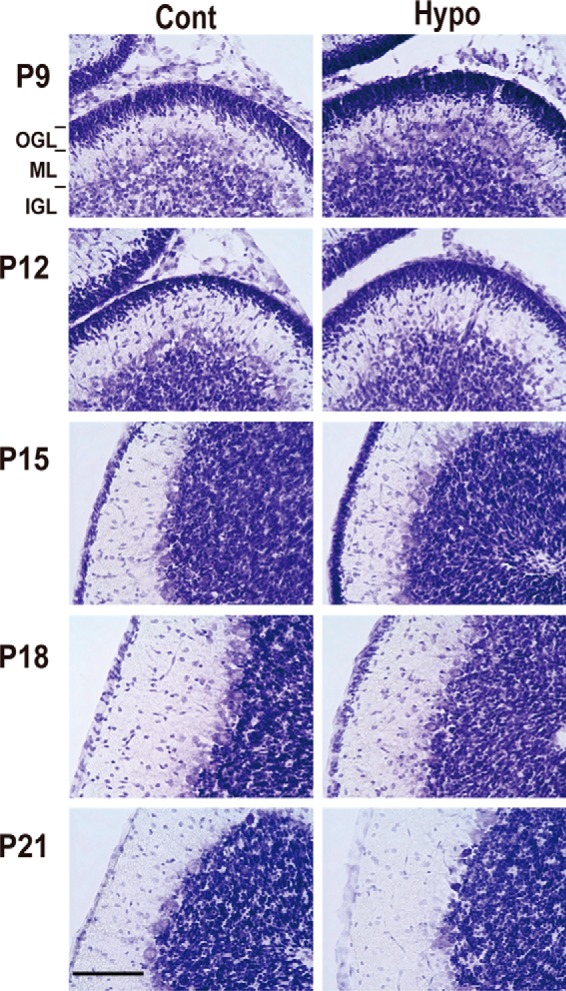
Hypothyroidism delays cortical maturation of cerebellum. Nissl staining of cerebellum cortex of mice treated with MMI (hypothyroid (Hypo); right) or control (Cont; left) from P9 to P21. OGL, outer granular layer; ML, molecular layer; IGL, inner granular layer. Scale bar, 100 μm.
The expression levels of total tau were not greatly changed by the MMI treatment in either the cerebral cortex or the cerebellum (Fig. S2, C and D). The amounts of tau were adjusted with Tau5 to estimate the relative ratio of 3R and 4R tau, and the results of the cerebellum are shown in Fig. 5. The banding profiles of total tau were almost identical between control and MMI-treated mice (Fig. 5A, upper panel, Tau5). The expression levels of 3R and 4R tau were examined by immunoblotting with RD3 and RD4, respectively (Fig. 5A, lower panels, RD3 and RD4). 3R tau began to decrease in protein amount and increase in electrophoretic mobility at P12. 4R tau began to increase in protein amount at P12 and continued to increase until P21. Thus, the switch between isoforms took place within P9–P21 in the cerebellum and proceeded in a similar time course between control and hypothyroid mice. Although the disappearance of 3R tau appeared to be delayed slightly in hypothyroidism, this might be due to the effect of the phosphorylation on the banding patterns as described below.
Figure 5.
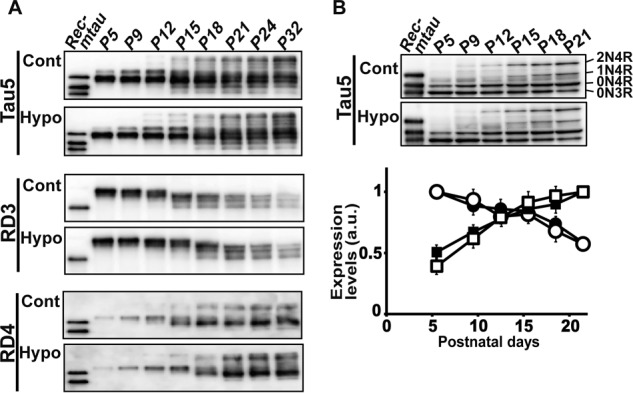
Hypothyroidism does not affect the postnatal conversion of tau isoforms. A, immunoblots of tau in the cerebellum of control (Cont) and hypothyroid (Hypo) mice from P5 to P32 with Tau5 (upper), RD3 (middle), and RD4 (lower). The amounts of tau were adjusted with Tau5. Rec-mtau is recombinant mouse tau (1N4R, 0N4R, and 0N3R). B, immunoblots of dephosphorylated tau with Tau5. The extracts of cerebellum of control (Cont) and hypothyroid (Hypo) mice from P5 to P21 were treated with ALP as described under “Experimental procedures.” Each isoform of 0N3R, 0N4R, 1N4R, and 2N4R is indicated at the right side of the control blot. The lower panel is the quantification of 0N3R and 0N4R: white circles, control 0N3R; black circles, hypothyroid 0N3R; white squares, control 0N4R; black squares, hypothyroid 0N4R. The data are presented as the mean (n = 3). Error bars represent S.E. a.u., arbitrary units.
We confirmed the above results by quantification of dephosphorylated tau (Fig. 5B). Dephosphorylation made respective tau isoforms distinct. Four isoforms, 0N3R, 0N4R, 1N4R, and 2N4R, were expressed at P21. A faint band detected above 0N4R at P5 and P9 may be 1N3R. 2N4R appeared at P12, and 1N4R was slightly delayed at this time point. The expression levels of 0N3R and 0N4R tau were quantified (Fig. 5B, lower panel). The decrease of 0N3R and increase of 0N4R proceeded almost similarly between control and MMI-treated mice. These results suggest that the splicing of tau is not affected markedly, at least at the protein level, by the hypothyroid treatment.
Hypothyroid treatment delays the transition of tau from high- to low-phosphorylation states
Next, we examined the effect of MMI on the phosphorylation of tau using Phos-tag SDS-PAGE. The 3R tau result is shown in Fig. 6A; the transition of 3R tau from high- to low-phosphorylation states was observed at P9 to P15 in control mice (Fig. 6A, upper). In contrast, the transition was detected 3 days later, from P12 to P18, in MMI-treated mice (Fig. 6A, lower). The results were confirmed with total tau (Tau5) and 4R (RD4) tau (Fig. S4), which also displayed a 3-day delay in the transition of phosphorylation states in MMI-treated mice. These results were unexpected but clearly indicate that the change in the phosphorylation status of tau is affected by hypothyroid treatment, which is different from the isoform change.
Figure 6.

Hypothyroidism delays the transition of the phosphorylation of tau from high to low. A, immunoblots of tau in control (Cont) and hypothyroid (Hypo) mice from P5 to P21 with RD3 after Phos-tag SDS-PAGE. Rec-mtau is recombinant mouse tau. The position of recombinant 0N3R tau is indicated by dotted lines. B, immunoblots of tau in control (Cont) and hypothyroid (Hypo) mice from P5 to P21 with AT8 (upper) and Tau1 (lower) antibodies. The lower panel shows quantifications: white circles, AT8 of control; black circles, AT8 of hypothyroid; white squares, Tau-1 of control; black squares, Tau-1 of hypothyroid. The data are presented as the mean (n = 3; ***, p < 0.001). Error bars represent S.E.; a.u., arbitrary units. C, phosphorylation of tau at Ser-202 and Thr-205. Tau in cerebellum of control (Cont) and hypothyroid (Hypo) mice from P5 to P21 was blotted with anti-phospho-Ser-202 (pS202; CP13) and anti-phospho-Thr-205 (pT205). Quantification is shown to the right: white, control; black, MMI-treated mice. The data are presented as the mean (n = 3; ***, p < 0.001). Error bars represent S.E. D, immunoblots of tau in cerebral cortex of control (Cont) and hypothyroid (Hypo) with anti-phospho-Ser-199 (pS199) and anti-phospho-Ser-422 (pS422) (19). E, immunoblots of tau in cerebral cortex of control (Cont) and hypothyroid (Hypo) mice from P5 to P21 with anti-phospho-Thr-231 (pT231), anti-phospho-Ser-396 (pS396), and anti-phospho-Ser-404 (pS404).
To analyze which phosphorylation sites on tau are affected by MMI, we first used AT8, a phosphospecific antibody frequently used for the detection of phosphorylated tau in AD, and Tau1 for nonphosphorylated tau at the AT8 sites. The AT8 sites were highly phosphorylated in postnatal tau until P12, and the phosphorylation levels greatly decreased at P15 in control mice, consistent with a previous report (21). In contrast, in hypothyroid mice, the high phosphorylation state continued until P15 (Fig. 6B, AT8). This delay in the transition was confirmed by immunoblot analysis with Tau-1. The reaction to Tau-1 was opposite; Tau-1 increased from P15 in control mice, whereas the increase was detected only from P18 in MMI-treated mice (Fig. 6B, Tau1). These results demonstrated that MMI delays the dephosphorylation event of tau at AT8 sites in the developing mouse brain.
The AT8 epitope results from phosphorylation at both Ser-202 and Thr-205. To identify which site determines the reactivity to AT8 in the developing mouse brain, we used antibodies specific to each site, anti-phospho-Ser-202 (CP13) and anti-phospho-Thr-205. The reactivity of both sites was decreased in a similar time course to the AT8 reactivity (Fig. 6C), indicating that both sites contribute to the reactivity of AT8 equally in developing mouse brains. Furthermore, MMI delays the dephosphorylation of tau at both Ser-202 and Thr-205 in a similar manner.
Phosphorylation of tau at Ser-199 and Ser-422 is affected by thyroxine T4 in cultured cerebellum granule cells (46). We examined their phosphorylation in mice treated with MMI. Phosphorylation at Ser-199 was increased after P15 in control mice and was not affected by the MMI treatment (Fig. 6D). In contrast, Ser-422 was phosphorylated at early postnatal days, showed decreased phosphorylation after P18, and was also not apparently affected by the MMI treatment (Fig. 6D). We examined three additional sites, Thr-231, Ser-396, and Ser-404, to determine whether their phosphorylation was affected by MMI. These sites are reported to be phosphorylated independently of development (21). The phosphorylation at these sites was not changed by MMI treatment (Fig. 6E). These results indicate that hypothyroid conditions specifically affect the developmentally regulated phosphorylation of tau at the AT8 site.
We examined expression of tau in the cerebellum by immunocytochemistry. There has been only one report of tau immunostaining in developing mouse cerebellum (34) with the use of RD3 alone but not the other anti-tau antibodies used here. So, we first examined the specificity of the antibodies and determined the optimum staining conditions using mouse brain lacking tau as a negative control (Fig. S3B). Tau5 staining indicated expression of tau mainly in the molecular layer, which consists of axons of granule neurons, with modest staining of the granular cell layer (Fig. 7). The staining of the molecular layer with Tau5 increased in thickness gradually with development. Any anti-tau antibodies, either RD3 or RD4 and either AT8 or Tau1, mainly stained the molecular layer with some staining of inner granule neurons (Fig. 7), although the staining intensities were variable depending on the antibodies used. It was interesting to observe that AT8 and Tau1 stained the molecular layer complementarily at P12 such that AT8 stained the outer region of the molecular layer more strongly, whereas Tau-1 stained the inner region close to the Purkinje cell layer more intensely (Fig. 7, higher magnification of AT8 and Tau1 at P12). This may represent the replacement of highly phosphorylated 3R tau with less phosphorylated 4R tau in axons of granule neurons.
Figure 7.
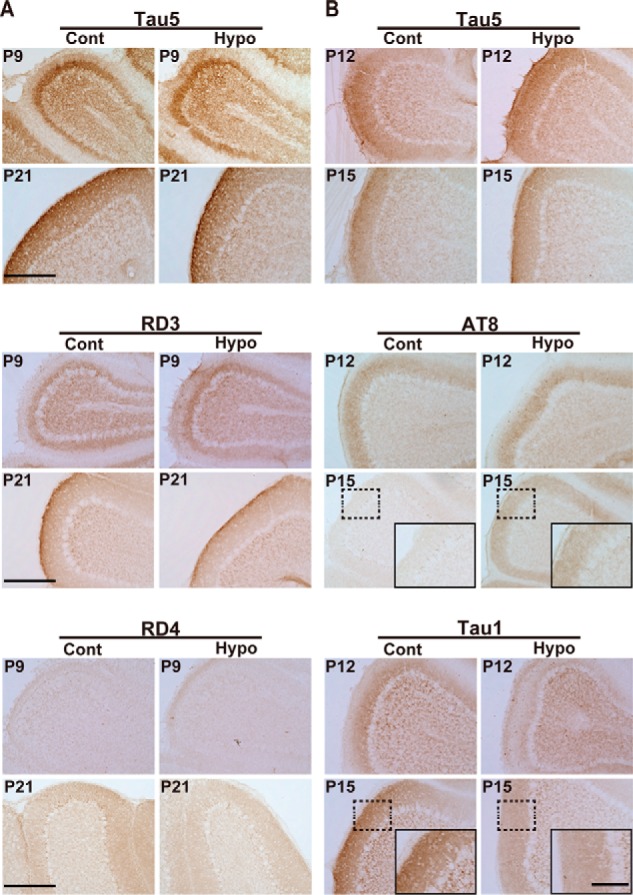
Immunohistochemical staining of mouse brains during postnatal development. A, cerebellum cortex of control (Cont) and hypothyroid (Hypo) mice at P9 and P21 stained with Tau5 (upper), RD3 (middle), and RD4 (lower). B, cerebellum cortex of control (Cont) and hypothyroid (Hypo) mouse at P12 and P15 stained with Tau5 (upper), AT8 (middle), and Tau1 (lower). Scale bar, 100 μm. Insets in AT8 and Tau1 at P15 are higher magnification of the region indicated by dotted box. Scale bar, 20 μm.
Phosphorylation of knockin human 3R or 4R tau in mouse brain during postnatal development
The aforementioned results have already indicated that the developmental changes in splicing and the phosphorylation of tau are not necessarily linked. However, the changes in the expression levels of 3R or 4R tau hampered the analysis of phosphorylation. To properly compare the phosphorylation profiles on the same immunoblot membrane, we had to vary the protein amounts of the extracts in each lane depending on the expression levels of tau. We then used genetically engineered mice in which a single human tau isoform was knocked in. In this study, heterozygotes that expressed both human tau and mouse endogenous tau were used. The results of mice expressing human 0N3R tau are shown in Fig. 8, A and B. Human 0N3R tau was detected with the Tau12 or HT7 human tau-specific antibody, whereas 4R mouse tau is shown for comparison by probing with RD4. When normalized with actin, endogenous 4R mouse tau showed an increase from P5 to P10 and exhibited constant expression until P20, although it decreased slightly toward P90 (Fig. 8A, lower panel). In heterozygous mice, the change of mouse tau from 3R to 4R took place normally. In contrast, human 3R tau appeared with relatively constant expression until P90 (Fig. 8A, upper panel, Tau12). To confirm this result, we dephosphorylated human 3R tau with ALP (Fig. 8A, second panel, HT7) and quantified its expression (Fig. 8E). Indeed, the amount of human knockin 3R tau increased during early postnatal days. We do not know the reason why knockin tau showed an increased expression in contrast to the decrease in mouse endogenous tau. The phosphorylation state of human 0N3R tau was analyzed by Phos-tag SDS-PAGE. The decrease in the phosphorylation state was detected by the increase in the mobility during P10 to P15 (Fig. 8B), a similar time course of mouse tau. The results confirm that the phosphorylation and isoform changes are independently regulated during development.
Figure 8.
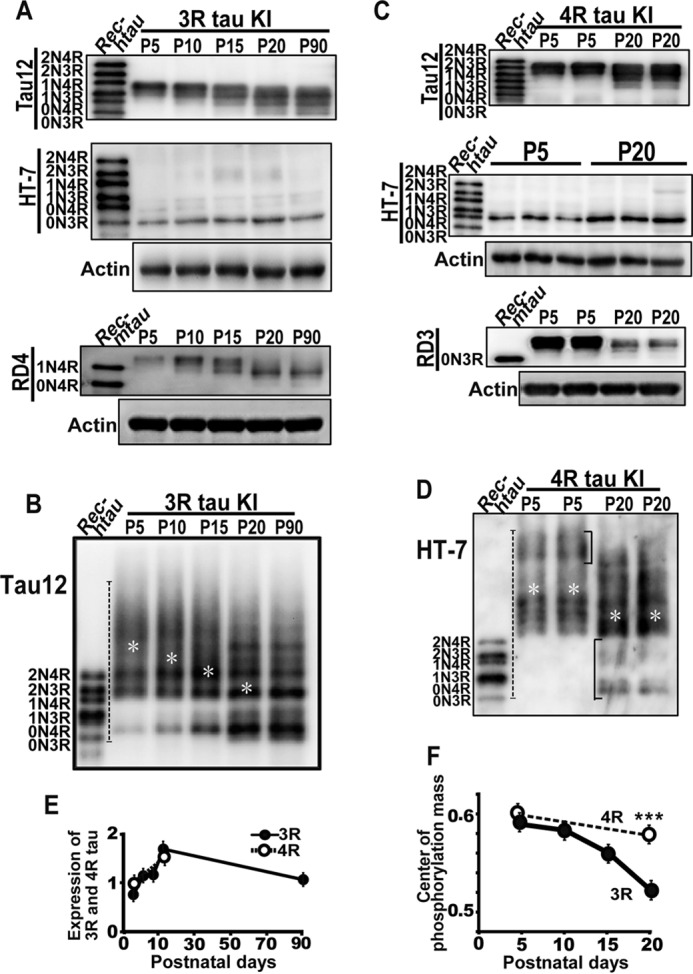
Phosphorylation of knockin human 3R or 4R tau in mouse brains. A, an immunoblot of knockin (KI) human 0N3R tau in mouse brains (+/h3rtau) from P5 to P90 with anti-human tau Tau12 (upper) and an immunoblot with anti-human tau HT7 after dephosphorylation (middle). RD4 shows endogenous mouse 4R tau in the same mice. Rec-htau is recombinant human six tau isoforms in the blots of Tau12 and HT7, and Rec-mtau is recombinant mouse tau in the blot of RD4. Actin is the loading control. B, phosphorylation states of human 3R tau assessed by immunoblotting with Tau12 after Phos-tag SDS-PAGE. The left lane is recombinant human six tau isoforms (Rec-htau). White asterisks indicate the position of the center of phosphorylation mass. C, an immunoblot of knockin human 0N4R tau in the mouse (+/h4rtau) brain in duplicate at P5 and P20 with anti-human tau Tau12 (upper) and an immunoblot with anti-human tau HT7 after dephosphorylation (middle). RD3 shows endogenous mouse 3R tau in the same mice. Actin is the loading control. D, phosphorylation of human 0N4R tau was assessed by immunoblotting with anti-human-specific tau HT7 after Phos-tag SDS-PAGE. Rec-htau is recombinant human tau isoforms. White asterisks indicate the position of the center of phosphorylation mass. E, expression levels of knockin human 3R (black circles) or 4R tau (white circles) in mouse brains quantified after dephosphorylation. The data are presented as the mean (n = 3). Error bars represent S.E. F, the center of phosphorylation mass of 3R and 4R tau during brain development. Black circles are 3R, and white circles are 4R tau. The data are presented as the mean (n = 3; ***, p < 0.001). Error bars represent S.E.
We next examined the phosphorylation of human 4R tau in mouse brains at P5 and P20. When normalized to actin, the expression of endogenous 3R tau was reduced at P20 as in wildtype mice (Fig. 8C, RD3). Knockin 4R tau was expressed at a similar level between P5 and P20 (Fig. 8C, upper panel, Tau12). To confirm this, human knockin 4R tau was estimated after dephosphorylation by ALP (Fig. 8, C, second panel, and E). Knockin 4R tau was increased at P20. Phosphorylation levels of knockin 4R tau were again examined by Phos-tag SDS-PAGE (Fig. 8D). Knockin 4R tau was highly phosphorylated at P5 when endogenous 3R tau was highly phosphorylated and was low at P20 when endogenous 4R tau phosphorylation was low. However, it is known from the Phos-tag banding patterns that only a part of 4R tau has remarkably reduced phosphorylation; the upper bands at P5 disappeared (Fig. 8D, bracket in the P5 lanes), and the lower bands appeared at P20 (Fig. 8D, bracket in the P20 lanes). Most 4R tau showed migrations at the area that overlapped the migration of 4R tau at P5, although the banding patterns were different, suggesting that phosphorylation sites are altered between P5 and P20.
Phosphorylation levels appeared to be different between 3R and 4R tau, particularly at P20. The phosphorylation intensity of the faster migrating bands of 3R and 4R tau was different, strong in 3R versus weak in 4R tau (Fig. 8, B and D). We compared it with the center of phosphorylation mass (Fig. 8F). Although the phosphorylation levels of 3R and 4R tau at P5 were close, they were different at P20 when the phosphorylation levels of 4R tau were higher than those of 3R tau.
Discussion
Tau switches its isoform from 3R to 4R and the phosphorylation states change from high to low in the mouse brain during development (10–12, 16, 21, 34). However, it is not known whether these two events are linked biochemically or physiologically. Here, we investigated their relationship and found that they are regulated differently, although they proceeded in a similar time course in mouse brains during postnatal weeks 2–3, an important developmental stage for neuronal circuit formation under the influence of external stimuli (23). We also found for the first time that 3R and 4R tau are phosphorylated differently in brains both at early postnatal days and after maturation, suggesting the different role and regulation of isoform-dependent phosphorylation.
4R tau, with one MTB more than 3R tau, has stronger MT-stabilizing activity than 3R tau (6–8). Phosphorylation also reduces tau's ability to stabilize MTs (3, 4, 35, 36). Therefore, highly phosphorylated 3R tau should be considerably weaker in MT-stabilizing activity than less phosphorylated 4R tau. In other words, MTs with 3R tau in fetal/perinatal brains are highly dynamic compared with those with 4R tau in adult brains. Considering the function of MTs in neuronal plasticity (8), it is crucial to understand the regulation mechanism of these developmental conversions. One can easily speculate that isoform changes by alternative splicing constitute the major regulation with the posttranslational phosphorylation as a modulator. It is not known, however, how these two distinct regulatory systems cooperate in developing brains or whether these two regulations proceed together. An alternate possibility is that 3R and 4R tau are intrinsically phosphorylated differently; 3R is highly phosphorylated, and 4R is less phosphorylated. To explore their respective functions, we intended to distinguish their regulation mechanisms.
It is reported that neonatal tau is exclusively expressed as 3R, and only 4R tau is expressed in adults (10, 11). Our detailed biochemical analysis revealed that highly phosphorylated 3R tau was gradually decreased in amount and phosphorylation levels from P9 to P18 in parallel with the increased ratio of less phosphorylated 4R tau. However, 4R tau expressed at low levels at P9 was more phosphorylated than adult 4R tau, and a residual amount of 3R tau detected after P21 was less phosphorylated than neonatal 3R tau. These results were confirmed with knockin human tau, which was expressed as a single isoform, 3R or 4R, in mouse brain. In these mice too, phosphorylation levels of both 3R and 4R human tau were high at P5 and lessened at P20. Thus, phosphorylation status is not necessarily associated with the isoforms but rather determined by the developmental stages, suggesting that there must be a yet unidentified developmental reaction that changes phosphorylation levels of tau at the same time as the isoform change.
Alternative splicing of tau takes place at the pre-mRNA stage in the nucleus, whereas phosphorylation of tau occurs in the cytoplasm after translation. Nonetheless, both changes proceeded under the same time course during development. The next question that has arisen is whether these two events occur coincidently at the same time or are regulated under the same signaling pathways. The alternative splicing of tau pre-mRNA has been studied in relation to the balance between 3R and 4R tau in AD and frontotemporal dementia and parkinsonism linked to chromosome 17 (FTDP-17) (37). Many intron mutations in the MAPT tau gene have been found in FTDP-17, and they are reported to increase the expression ratio of 4R tau (37, 38). It has been shown that the splicing in or out activity of exon 10 is regulated by the phosphorylation of serine/arginine-rich (SR) proteins in the spliceosome (39). Although there are protein kinases that are relatively specific for SR splicing proteins, such as SR protein kinase or Cdc-like kinase (CLK/Sly) (38, 39), several tau protein kinases, including GSK3β, DYRK1, and PKA, are also reported to regulate the splicing of tau pre-mRNA by phosphorylating the particular splicing proteins (40–44). Although their involvement in the developmental regulation of tau isoforms has not been investigated, some of these protein kinases could regulate both the splicing of tau pre-mRNA and the phosphorylation of tau protein. In particular, the kinase activity of GSK3β and Dyrk1A is developmentally regulated (21). These kinases are known to phosphorylate the AT8 site (3, 20), the phosphorylation of which was changed at the time of the isoform change. Thus, the question was whether the two events were regulated together as downstream effects of one of those kinases. Our present results demonstrate that hypothyroidism dissociated the splicing and phosphorylation, indicating that they are regulated independently.
The decrease in total phosphorylation, but not in the conversion of the isoforms, was delayed in mice treated with MMI. This was unexpected for us because it was reported that hypothyroidism delayed the transition between immature (3R) and mature (4R) tau transcripts (26). However, having looked at their data closely, we noticed that hypothyroid conditions delayed the disappearance of immature (3R) tau mRNA but did not affect the timing of the reduction of 3R tau mRNA or the beginning of 4R tau mRNA expression (26). We did not detect the delay in the disappearance of 3R tau when measured after dephosphorylation (Fig. 5B). The slight delay of the disappearance of 3R tau mRNA might not be apparent at protein levels. There is also a recent report that described no effect of hypothyroid conditions on the splicing of tau pre-mRNA in differentiating granule cells in the adult mouse hippocampus (45). Accordingly, the effect of hypothyroid conditions on the transition of tau isoforms would be limited. On the contrary, hypothyroidism delayed the transition of total phosphorylation from high to low. There is only one report that describes the effect of thyroid hormone on tau phosphorylation. Thyroxine T4 affected the phosphorylation of tau at Ser-199 and Ser-422 in cerebellar granular neuron culture (46). We also examined the developmental changes of tau phosphorylation at Ser-199 and Ser-422. Their phosphorylation behaved differently; Ser-199 phosphorylation increased after P15, whereas Ser-422 phosphorylation decreased. These results in control mice are in agreement with the data by Yu et al. (21). However, the hypothyroid treatment did not affect the changes in phosphorylation at these sites. It is possible that in vivo chronic depletion and acute addition in cultured cells may regulate the tau kinase activities differently.
An interesting finding is the difference in phosphorylation between 3R and 4R tau in mouse brains. Some reports indicate the existence of isoform-dependent phosphorylation in vitro (47). However, this is the first in vivo evidence showing their different, i.e. not identical, phosphorylation. The results could be obtained for the first time by using a combination of Phos-tag and 3R- or 4R-specific antibodies. Previous studies using anti-phosphospecific antibodies could not discern 3R and 4R tau because the phosphorylation sites are commonly shared between them (3, 15, 45). The different banding patterns of 3R and 4R tau were not due to the different antibodies used, RD3 versus RD4. A similar result was obtained by immunoblotting human 3R and 4R knockin tau with a single anti-human tau antibody after Phos-tag SDS-PAGE. Furthermore, although 3R tau changed phosphorylation states dramatically at P9–P12, only a subpopulation of 4R tau showed a downward shift with the major portion keeping constant phosphorylation levels. In this study, however, we have not yet identified the phosphorylation sites which differ between 3R and 4R tau. The significance of this potential difference will have to wait for their identification. We have detected the different phosphorylation states of 3R and 4R tau overexpressed in cultured cells.3 The expression of a single isoform in cultured cells will be useful to identify isoform-specific phosphorylation because the phosphorylation profiles are similar in cultured cells and mouse brains (48).
For the identification of isoform-specific function, the expression of a single tau isoform would also be appropriate. Using a purified single tau isoform, it was shown in vitro that 4R tau has a higher MT assembly activity than 3R tau (6–8). At the cellular and in vivo levels, however, the isoform-specific function has not been clearly demonstrated yet, probably because their subtle difference would be obscured by other MT-associated proteins expressed. The conversion of tau isoform from 3R to 4R takes place during postnatal weeks 2–3 when neuronal circuit formation is ongoing (23). Therefore, it has been speculated that the isoform alteration represents the change of MT dynamics accompanying the establishment of the neuronal connection. However, we showed here that hypothyroidism did not affect the timing of the isoform exchange even though it delayed cerebellar development such as differentiation, migration, and axon outgrowth of cerebellar granule neurons (Figs. 5 and 7), which could be MT-dependent. The isoform-specific function might not be involved in these developmental events previously speculated. Detailed analysis of mice expressing a single isoform, such as 3R or 4R tau knockin mice, would provide some indications on the 3R- and 4R-specific functions.
The high phosphorylation of fetal tau is often discussed in relationship to the abnormal phosphorylation of tau in AD (3, 15, 18, 47). Many AD phosphorylation sites in tau are phosphorylated in fetal/perinatal brains. In fact, we recently showed that the phosphorylation of fetal mouse tau is similar to major phosphoisotypes of tau found in AD brains using Phos-tag (48). The AT8 site appears to be particularly interesting; the site is frequently used for the histological diagnosis of AD and contributes to the high fetal/perinatal phosphorylation of tau. AT8 requires phosphorylation at both Ser-202 and Thr-205, and Tau1 recognizes the nonphosphorylated tau at the AT8 site. Here, we showed that phosphorylation at both Ser-202 and Thr-205 was reduced at the same time of isoform change at P12–P15 and was affected by hypothyroid conditions (Fig. 6). AT8 and Tau1 stained the molecular layer of cerebellum complementarily at P12 (Fig. 7), suggested that phospho-3R tau localizes to the more distal region of axons, and nonphospho-4R tau localizes in the proximal region. Axons in the molecular layer run in parallel, suitable for observation of axonal MTs (49). We reported previously that the phosphorylation at the AT8 site increased the inter-MTs spaces and then suppressed the mitochondrial transport in axons by expressing a non-phosphorylatable Ala or phosphomimetic Asp mutant of 4R tau in primary neurons (50). The phosphorylation at the AT8 site appeared to alter the conformation of tau to extend the N-terminal projection domain into the inter-MT space, leading to the reduced flexibility of MT's lateral movements that would result in reduced mitochondrial movements. It would be interesting to compare the inter-MT distance in molecular layer axons during postnatal development in control and hypothyroid mice. Additionally, Ser-202 and Thr-205 are proline-directed protein kinase phosphorylation sites. Although several proline-directed protein kinases, including cyclin-dependent kinase 5 (Cdk5), GSK3β, JNK, and Dyrk1A, have been shown to phosphorylate these sites in vitro (3, 15, 45), in vivo AT8 kinases are still under examination. Furthermore, it is not known how the AT8 sites are hyperphosphorylated in AD brains. We think that the identification of the responsible kinase, the activation of which should be affected by MMI, is possible. In the future, it may be intriguing to investigate the developmental role and regulation of AT8 site phosphorylation in relation to the effect of hypothyroid conditions or AD hyperphosphorylation.
Experimental procedures
Antibodies and chemicals
Primary antibodies used in this study are listed in Table 1. Anti-actin was from Sigma-Aldrich. Phos-tag acrylamide, bacterial alkaline phosphatase, and 4-(2-aminoethyl)benzenesulfonyl fluoride hydrochloride (Pefabloc) were from Wako Chemicals (Osaka, Japan). MMI was purchased from Sigma-Aldrich. The ABC staining kit was obtained from Vector Laboratories (Burlingame, CA).
Table 1.
Anti-tau antibodies used in this study
P-tau, phosphorylated tau; dep-tau, dephosphorylated tau; Mono, monoclonal; Poly, polyclonal; Thermo Sci, Thermo Fisher Scientific.
| Antibody | Specificity | Phosphorylation sites | Type | Source (catalog no., lot no.) |
|---|---|---|---|---|
| AT8 | P-tau | Ser-202/Thr-205 | Mono | Thermo Sci (MN1020, RG2218673) |
| CP13 | P-tau | Ser-202 | Poly | Peter Davies |
| HT-7 | Human tau | Mono | Thermo Sci (MN1000, OB183715) | |
| RD3 | 3R tau | Mono | Millipore (05-803, 2712326) | |
| RD4 | 4R tau | Mono | Millipore (05-804, 2950020) | |
| Tau-1 | dep-tau | Ser-195/198/199/202 | Mono | Millipore (MAB3420, 2370726) |
| Tau5 | Tau | Mono | Millipore (577801, D00139295) | |
| Tau12 | Human tau | Mono | Millipore (MAB2241/2842158) | |
| pS199 | P-tau | Ser-199 | Poly | Abcam (ab81268, GR97739-8) |
| pT205 | P-tau | Thr-205 | Poly | Biosource (44-738Z, 44738-1BA) |
| pT231 | P-tau | Thr-231 | Poly | Abcam (ab151559, GR112038-27) |
| pS396 | P-tau | Ser-396 | Poly | Abcam (ab109390, YG120402C) |
| pS404 | P-tau | Ser-404 | Poly | Abcam (ab30666,GR55583-2) |
| pS422 | P-tau | Ser-422 | Poly | Yasuo Ihara (19) |
Animal experiments
All animal experiments were performed according to the guidelines for animal experimentation of Tokyo Metropolitan University and Doshisha University (in accordance with the Society for Neuroscience Guidelines). The study was approved by the Research Ethics Committee of Tokyo Metropolitan University (approval number A27-45) and Doshisha University (approval number A16070). All efforts were made to reduce the suffering of animals used. Pregnant mice of the ICR strain were purchased from Sankyo Lab Service (Tokyo, Japan). Human tau knockin mice were developed by inserting human cDNA and floxed PGK-Neo poly(A) cassette in the same region as in the previous tau knockout mice (51). Namely, the knockin mice were developed by in-frame insertion of human cDNA for 0N3R or 0N4R isoforms followed by the rabbit β-globin poly(A) signal sequence from the mouse endogenous start codon in the first coding exon. Floxed PGK-Neo poly(A) was inserted after the human tau cDNA. The mice were housed in cages of two to five littermates with access to food and water ad libitum in an environment subjected to a 12-h light/dark cycle in the animal facility of the Tokyo Metropolitan University and Doshisha University.
Hypothyroid treatment was performed according to the protocol described previously (27). Six pregnant animals were used for each control and hypothyroid group. Mice in the hypothyroid group were rendered hypothyroid by administering 0.025% (w/v) MMI in drinking water to their mothers from the 15th day of conception.
Preparation of mouse brain extracts
Cerebral cortices, hippocampus, cerebellum, and olfactory bulb were dissected from mouse brains and immediately homogenized in 10 mm HEPES, pH 7.4, 0.8 m NaCl, 2 mm MgCl2, 1 mm EGTA, 10% sucrose, 10 mm NaF, 10 mm β-glycerophosphate, 0.4 mm Pefabloc, 10 μg/ml leupeptin, and 1 mm dithiothreitol with a Teflon-glass homogenizer. After centrifugation at 15,000 × g for 20 min, the supernatants were used as the extracts.
For the dephosphorylation of tau, brains were homogenized in 50 mm Tris-HCl, pH 8.0, 100 mm NaCl, 0.1% sucrose, 2 mm MgCl2, 1 mm EGTA, 0.4 mm Pefabloc, 10 μg/ml leupeptin, and 1 mm dithiothreitol with a Teflon-glass homogenizer on ice immediately after dissection (53). Dephosphorylation of tau in brain extracts was performed as described previously (48). The supernatants of the centrifugation at 15,000 × g for 20 min were dephosphorylated with 100 units/liter Escherichia coli alkaline phosphatase for 4 h at 37 °C. The reactions were stopped by boiling for 5 min at 100 °C.
Histology and immunocytochemistry
Brains of control and MMI-treated mice were fixed by cardiac perfusion with saline followed by ice-cold 4% paraformaldehyde in 0.1 m phosphate-buffered saline (PBS), pH 7.4, under deep anesthesia with isoflurane. The brains were dissected, immersed in the fixative overnight, and transferred to 15% and then 30% sucrose in 20 mm phosphate-buffered saline, pH 7.4, until they sank. The brains were frozen in crushed dry ice, and 20-μm-thick sagittal sections were cut in a Cryostar NX70 cryostat (Thermo Fisher). The free-floating sections were kept in PBS at 4 °C to process for immunohistochemistry (52).
For high-sensitivity detection, free-floating brain sections were autoclaved at 105 °C for 10 min and treated with formic acid for 10 min. Sections were then incubated with 0.5% H2O2 in methanol for 30 min to inactivate endogenous peroxidases, blocked with 10% calf serum in PBS for 20 min, and incubated overnight with appropriate antibodies, Tau5 (1:200), anti-RD3 (1:500), anti-RD4 (1:200), AT8 (1:100), or Tau-1 (1:5000), diluted with 20 mm PBS containing 5% normal goat serum. After incubation with the biotinylated secondary antibody for 2 h, labeling was detected using the ABC staining kit with 0.1% 3,3-diaminobenzidine. Slides were coverslipped with mounting medium. Images were observed with an all-in-one microscope/digital camera (BZ-X710, Keyence, Osaka, Japan).
Expression and purification of recombinant tau
Recombinant human tau (0N3R, 0N4R, 1N3R, 1N4R, 2N3R, and 2N4R) and mouse tau (0N3R, 0N4R, and 1N4R) were synthesized in E. coli cultures and purified as described previously (48). Protein concentration was determined by Coomassie Brilliant Blue staining of the polyacrylamide gels using bovine serum albumin as a standard.
SDS-PAGE, Phos-tag SDS-PAGE, and immunoblotting
Laemmli SDS-PAGE was performed using 10% (w/v) polyacrylamide gels, and Phos-tag SDS-PAGE was performed using 7.5% (w/v) polyacrylamide gels containing 50 μm Phos-tag acrylamide and 150 μm MnCl2 as described previously (28–30). For immunoblotting, the proteins separated in the gel were transferred to a PVDF membrane (Merck Millipore) using a submerged blotting apparatus and then visualized with enhanced chemiluminescence detection kit reagents (GE Healthcare). The immunoreaction was captured with a FUSION SL apparatus (Vilber Lourmat, Wembley, Australia).
Estimation of center of phosphorylation mass
To define the overall levels of phosphorylation, we introduced the concept of “center of phosphorylation mass.” The center of phosphorylation mass represents the average of the phosphorylation states of proteins phosphorylated at multiple sites. The proteins are separated into many bands depending on the number and sites of phosphorylation by Phos-tag SDS-PAGE, and the center of phosphorylation mass is the average position of the separated bands. It is calculated by the method of center of mass with ImageJ and represented as the ratio of the average position to the total span of the separated bands along the electrophoretic direction.
Statistical analysis
The band intensity and banding profiles of phosphorylated tau separated by Phos-tag SDS-PAGE were analyzed with ImageJ (64-bit) software. The means ± S.E. were obtained from more than three independent experiments.
Author contributions
D. T. performed most experiments. T. K., A. S., and K. F. performed some of the experiments and assisted D. T. throughout the study. T. M. prepared human tau knockin mice. M. H. prepared recombinant tau. T. K., M. H., and K. A. provided critical comments throughout the study and during writing the manuscript. D. T. and S. H. wrote the manuscript. S. H. supervised the study.
Supplementary Material
Acknowledgments
We thank Drs. Naruhiko Sahara at National Institute of Radiological Sciences, Peter Davies at Feinstein Institute for Medical Research, and Yasuo Ihara at Doshisha University for providing us with anti-human tau Tau-12, CP13 anti-phospho-Ser-202, and anti-phospho-Ser-422 (pS422), respectively; Drs. Akihiro Harada at Osaka University, Yasuo Ihara at Doshisha University, and Mamoru Ito at Central Institute for Experimental Animals for the use of 3R or 4R human tau knockin mice; Dr. Tomoko Tashiro at Aoyama Gakuin University for discussing the hypothyroid mouse experiments; and Elizabeth Stone at the Ohio State University for reading the manuscript.
Note added in proof
Table 1 was inadvertently omitted from the version of this article that published as a Paper in Press on December 1, 2017.
This work was supported by Ministry of Education, Culture, Sports, Science and Technology (MEXT) Grant-in-aid Project Scientific Research on Innovation Area (Brain Protein Aging and Dementia Control) of Japan (to T. M., M. H., K. A., and S. H.) and by a MEXT grant-in-aid (to S. H. and T. K.). The authors declare that they have no conflicts of interest with the contents of this article.
This article contains Figs. S1–S4.
T. Kimura and S. Hisanaga, manuscript in preparation.
- MT
- microtubule
- 3R
- three-repeat
- 4R
- four-repeat
- AD
- Alzheimer's disease
- ALP
- alkaline phosphatase
- GSK3β
- glycogen synthase kinase 3β
- MTB
- microtubule-binding repeat
- MMI
- 2-mercapto-1-methylimidazole
- FTDP-17
- frontotemporal dementia and parkinsonism linked to chromosome 17
- P
- postnatal day.
References
- 1. Ballatore C., Lee V. M., and Trojanowski J. Q. (2007) Tau-mediated neurodegeneration in Alzheimer's disease and related disorders. Nat. Rev. Neurosci. 8, 663–672 10.1038/nrn2194 [DOI] [PubMed] [Google Scholar]
- 2. Spillantini M. G., and Goedert M. (2013) Tau pathology and neurodegeneration. Lancet Neurol. 12, 609–622 10.1016/S1474-4422(13)70090-5 [DOI] [PubMed] [Google Scholar]
- 3. Wang Y., and Mandelkow E. (2016) Tau in physiology and pathology. Nat. Rev. Neurosci. 17, 5–21 10.1038/nrc.2016.112 [DOI] [PubMed] [Google Scholar]
- 4. Stoothoff W. H., and Johnson G. V. (2005) Tau phosphorylation: physiological and pathological consequences. Biochim. Biophys. Acta 1739, 280–297 10.1016/j.bbadis.2004.06.017 [DOI] [PubMed] [Google Scholar]
- 5. Goedert M., Spillantini M. G., Jakes R., Rutherford D., and Crowther R. A. (1989) Multiple isoforms of human microtubule-associated protein tau: sequences and localization in neurofibrillary tangles of Alzheimer's disease. Neuron. 3, 519–526 10.1016/0896-6273(89)90210-9 [DOI] [PubMed] [Google Scholar]
- 6. Goedert M., and Jakes R. (1990) Expression of separate isoforms of human tau protein: correlation with the tau pattern in brain and effects on tubulin polymerization. EMBO J. 9, 4225–4230 [DOI] [PMC free article] [PubMed] [Google Scholar]
- 7. Lu M., and Kosik K. S. (2001) Competition for microtubule-binding with dual expression of tau missense and splice isoforms. Mol. Biol. Cell 12, 171–184 10.1091/mbc.12.1.171 [DOI] [PMC free article] [PubMed] [Google Scholar]
- 8. Panda D., Samuel J. C., Massie M., Feinstein S. C., and Wilson L. (2003) Differential regulation of microtubule dynamics by three- and four-repeat tau: implications for the onset of neurodegenerative disease. Proc. Natl. Acad. Sci. U.S.A. 100, 9548–9553 10.1073/pnas.1633508100 [DOI] [PMC free article] [PubMed] [Google Scholar]
- 9. Goedert M., Spillantini M. G., Potier M. C., Ulrich J., and Crowther R. A. (1989) Cloning and sequencing of the cDNA encoding an isoform of microtubule-associated protein tau containing four tandem repeats: differential expression of tau protein mRNAs in human brain. EMBO J. 8, 393–399 [DOI] [PMC free article] [PubMed] [Google Scholar]
- 10. Kosik K. S., Orecchio L. D., Bakalis S., and Neve R. L. (1989) Developmentally regulated expression of specific tau sequences. Neuron 2, 1389–1397 10.1016/0896-6273(89)90077-9 [DOI] [PubMed] [Google Scholar]
- 11. Takuma H., Arawaka S., and Mori H. (2003) Isoforms changes of tau protein during development in various species. Brain Res. Dev. Brain Res. 142, 121–127 10.1016/S0165-3806(03)00056-7 [DOI] [PubMed] [Google Scholar]
- 12. McMillan P., Korvatska E., Poorkaj P., Evstafjeva Z., Robinson L., Greenup L., Leverenz J., Schellenberg G. D., and D'Souza I. (2008) Tau isoform regulation is region- and cell-specific in mouse brain. J. Comp. Neurol. 511, 788–803 10.1002/cne.21867 [DOI] [PMC free article] [PubMed] [Google Scholar]
- 13. Bullmann T., Härtig W., Holzer M., and Arendt T. (2010) Expression of the embryonal isoform (0N/3R) of the microtubule-associated protein tau in the adult rat central nervous system. J. Comp. Neurol. 518, 2538–2553 10.1002/cne.22351 [DOI] [PubMed] [Google Scholar]
- 14. Liu C., and Götz J. (2013) Profiling murine tau with 0N, 1N and 2N isoform-specific antibodies in brain and peripheral organs reveals distinct subcellular localization, with the 1N isoform being enriched in the nucleus. PLoS One 8, e84849 10.1371/journal.pone.0084849 [DOI] [PMC free article] [PubMed] [Google Scholar]
- 15. Hanger D. P., Anderton B. H., and Noble W. (2009) Tau phosphorylation: the therapeutic challenge for neurodegenerative disease. Trends Mol. Med. 15, 112–119 10.1016/j.molmed.2009.01.003 [DOI] [PubMed] [Google Scholar]
- 16. Brion J. P., Smith C., Couck A. M., Gallo J. M., and Anderton B. H. (1993) Developmental changes in tau phosphorylation: fetal tau is transiently phosphorylated in a manner similar to paired helical filament-tau characteristic of Alzheimer's disease. J. Neurochem. 61, 2071–2080 10.1111/j.1471-4159.1993.tb07444.x [DOI] [PubMed] [Google Scholar]
- 17. Goedert M., Jakes R., Crowther R. A., Six J., Lübke U., Vandermeeren M., Cras P., Trojanowski J. Q., and Lee V. M. (1993) The abnormal phosphorylation of tau protein at Ser-202 in Alzheimer disease recapitulates phosphorylation during development. Proc. Natl. Acad. Sci. U.S.A. 90, 5066–5070 10.1073/pnas.90.11.5066 [DOI] [PMC free article] [PubMed] [Google Scholar]
- 18. Kenessey A., and Yen S. H. (1993) The extent of phosphorylation of fetal tau is comparable to that of PHF-tau from Alzheimer paired helical filaments. Brain Res. 629, 40–46 10.1016/0006-8993(93)90478-6 [DOI] [PubMed] [Google Scholar]
- 19. Morishima-Kawashima M., Hasegawa M., Takio K., Suzuki M., Yoshida H., Watanabe A., Titani K., and Ihara Y. (1995) Hyperphosphorylation of tau in PHF. Neurobiol. Aging 16, 365–371; discussion 371–380 10.1016/0197-4580(95)00027-C [DOI] [PubMed] [Google Scholar]
- 20. Gong C. X., and Iqbal K. (2008) Hyperphosphorylation of microtubule-associated protein tau: a promising therapeutic target for Alzheimer disease. Curr. Med. Chem. 15, 2321–2328 10.2174/092986708785909111 [DOI] [PMC free article] [PubMed] [Google Scholar]
- 21. Yu Y., Run X., Liang Z., Li Y., Liu F., Liu Y., Iqbal K., Grundke-Iqbal I., and Gong C. X. (2009) Developmental regulation of tau phosphorylation, tau kinases, and tau phosphatases. J. Neurochem. 108, 1480–1494 10.1111/j.1471-4159.2009.05882.x [DOI] [PMC free article] [PubMed] [Google Scholar]
- 22. Espinosa J. S., and Stryker M. P. (2012) Development and plasticity of the primary visual cortex. Neuron 75, 230–249 10.1016/j.neuron.2012.06.009 [DOI] [PMC free article] [PubMed] [Google Scholar]
- 23. Sugiyama S., Prochiantz A., and Hensch T. K. (2009) From brain formation to plasticity: insights on Otx2 homeoprotein. Dev. Growth Differ. 51, 369–377 10.1111/j.1440-169X.2009.01093.x [DOI] [PubMed] [Google Scholar]
- 24. Oppenheimer J. H., and Schwartz H. L. (1997) Molecular basis of thyroid hormone-dependent brain development. Endocr. Rev. 18, 462–475 10.1210/edrv.18.4.0309 [DOI] [PubMed] [Google Scholar]
- 25. Koibuchi N., Jingu H., Iwasaki T., and Chin W. W. (2003) Current perspectives on the role of thyroid hormone in growth and development of cerebellum. Cerebellum 2, 279–289 10.1080/14734220310011920 [DOI] [PubMed] [Google Scholar]
- 26. Aniello F., Couchie D., Bridoux A. M., Gripois D., and Nunez J. (1991) Splicing of juvenile and adult tau mRNA variants is regulated by thyroid hormone. Proc. Natl. Acad. Sci. U.S.A. 88, 4035–4039 10.1073/pnas.88.9.4035 [DOI] [PMC free article] [PubMed] [Google Scholar]
- 27. Sawano E., Negishi T., Aoki T., Murakami M., and Tashiro T. (2013) Alterations in local thyroid hormone signaling in the hippocampus of the SAMP8 mouse at younger ages: association with delayed myelination and behavioral abnormalities. J. Neurosci. Res. 91, 382–392 10.1002/jnr.23161 [DOI] [PMC free article] [PubMed] [Google Scholar]
- 28. Kinoshita E., Kinoshita-Kikuta E., Takiyama K., and Koike T. (2006) Phosphate-binding tag, a new tool to visualize phosphorylated proteins. Mol. Cell. Proteomics 5, 749–757 10.1074/mcp.T500024-MCP200 [DOI] [PubMed] [Google Scholar]
- 29. Kinoshita E., Kinoshita-Kikuta E., and Koike T. (2009) Separation and detection of large phosphoproteins using Phos-tag SDS-PAGE. Nat. Protoc. 4, 1513–1521 10.1038/nprot.2009.154 [DOI] [PubMed] [Google Scholar]
- 30. Kimura T., Hosokawa T., Taoka M., Tsutsumi K., Ando K., Ishiguro K., Hosokawa M., Hasegawa M., and Hisanaga S. (2016) Quantitative and combinatory determination of in situ phosphorylation of tau and its FTDP-17 mutants. Sci. Rep. 6, 33479 10.1038/srep33479 [DOI] [PMC free article] [PubMed] [Google Scholar]
- 31. Quignodon L., Grijota-Martinez C., Compe E., Guyot R., Allioli N., Laperrière D., Walker R., Meltzer P., Mader S., Samarut J., and Flamant F. (2007) A combined approach identifies a limited number of new thyroid hormone target genes in post-natal mouse cerebellum. J. Mol. Endocrinol. 39, 17–28 10.1677/JME-06-0054 [DOI] [PubMed] [Google Scholar]
- 32. Takahashi M., Negishi T., and Tashiro T. (2008) Identification of genes mediating thyroid hormone action in the developing mouse cerebellum. J. Neurochem. 104, 640–652 10.1111/j.1471-4159.2007.05049.x [DOI] [PubMed] [Google Scholar]
- 33. Anderson G. W. (2008) Thyroid hormone and cerebellar development. Cerebellum 7, 60–74 10.1007/s12311-008-0021-4 [DOI] [PubMed] [Google Scholar]
- 34. Bullmann T., Holzer M., Mori H., and Arendt T. (2009) Pattern of tau isoforms expression during development in vivo. Int. J. Dev. Neurosci. 27, 591–597 10.1016/j.ijdevneu.2009.06.001 [DOI] [PubMed] [Google Scholar]
- 35. Wada Y., Ishiguro K., Itoh T. J., Uchida T., Hotani H., Saito T., Kishimoto T., and Hisanaga S. (1998) Microtubule-stimulated phosphorylation of tau at Ser202 and Thr205 by cdk5 decreases its microtubule nucleation activity. J. Biochem. 124, 738–746 10.1093/oxfordjournals.jbchem.a022174 [DOI] [PubMed] [Google Scholar]
- 36. Janke C., Beck M., Stahl T., Holzer M., Brauer K., Bigl V., and Arendt T. (1999) Phylogenetic diversity of the expression of the microtubule-associated protein tau: implications for neurodegenerative disorders. Brain Res. Mol. Brain Res. 68, 119–128 10.1016/S0169-328X(99)00079-0 [DOI] [PubMed] [Google Scholar]
- 37. Goedert M., and Spillantini M. G. (2000) Tau mutations in frontotemporal dementia FTDP-17 and their relevance for Alzheimer's disease. Biochim. Biophys. Acta 1502, 110–121 10.1016/S0925-4439(00)00037-5 [DOI] [PubMed] [Google Scholar]
- 38. Qian W., and Liu F. (2014) Regulation of alternative splicing of tau exon 10. Neurosci. Bull. 30, 367–377 10.1007/s12264-013-1411-2 [DOI] [PMC free article] [PubMed] [Google Scholar]
- 39. Nikolakaki E., Kohen R., Hartmann A. M., Stamm S., Georgatsou E., and Giannakouros T. (2001) Cloning and characterization of an alternatively spliced form of SR protein kinase 1 that interacts specifically with scaffold attachment factor-B. J. Biol. Chem. 276, 40175–40182 10.1074/jbc.M104755200 [DOI] [PubMed] [Google Scholar]
- 40. Singh T. J., Grundke-Iqbal I., and Iqbal K. (1996) Differential phosphorylation of human tau isoforms containing three repeats by several protein kinases. Arch. Biochem. Biophys. 328, 43–50 10.1006/abbi.1996.0140 [DOI] [PubMed] [Google Scholar]
- 41. Hartmann A. M., Rujescu D., Giannakouros T., Nikolakaki E., Goedert M., Mandelkow E. M., Gao Q. S., Andreadis A., and Stamm S. (2001) Regulation of alternative splicing of human tau exon 10 by phosphorylation of splicing factors. Mol. Cell. Neurosci. 18, 80–90 10.1006/mcne.2001.1000 [DOI] [PubMed] [Google Scholar]
- 42. Hernández F., Pérez M., Lucas J. J., Mata A. M., Bhat R., and Avila J. (2004) Glycogen synthase kinase-3 plays a crucial role in tau exon 10 splicing and intranuclear distribution of SC35. Implications for Alzheimer's disease. J. Biol. Chem. 279, 3801–3806 10.1074/jbc.M311512200 [DOI] [PubMed] [Google Scholar]
- 43. Shi J., Qian W., Yin X., Iqbal K., Grundke-Iqbal I., Gu X., Ding F., Gong C. X., and Liu F. (2011) Cyclic AMP-dependent protein kinase regulates the alternative splicing of tau exon 10: a mechanism involved in tau pathology of Alzheimer disease. J. Biol. Chem. 286, 14639–14648 10.1074/jbc.M110.204453 [DOI] [PMC free article] [PubMed] [Google Scholar]
- 44. Yin X., Jin N., Gu J., Shi J., Zhou J., Gong C. X., Iqbal K., Grundke-Iqbal I., and Liu F. (2012) Dual-specificity tyrosine phosphorylation-regulated kinase 1A (Dyrk1A) modulates serine/arginine-rich protein 55 (SRp55)-promoted Tau exon 10 inclusion. J. Biol. Chem. 287, 30497–30506 10.1074/jbc.M112.355412 [DOI] [PMC free article] [PubMed] [Google Scholar]
- 45. Arendt T., Stieler J. T., and Holzer M. (2016) Tau and tauopathies. Brain Res. Bull. 126, 238–292 10.1016/j.brainresbull.2016.08.018 [DOI] [PubMed] [Google Scholar]
- 46. Oyanagi K., Negishi T., and Tashiro T. (2015) Action of thyroxine on the survival and neurite maintenance of cerebellar granule neurons in culture. J. Neurosci. Res. 93, 592–603 10.1002/jnr.23519 [DOI] [PubMed] [Google Scholar]
- 47. Jovanov-Milošević N., Petrović D., Sedmak G., Vukšić M., Hof P. R., and Simić G. (2012) Human fetal tau protein isoform: possibilities for Alzheimer's disease treatment. Int. J. Biochem. Cell Biol. 44, 1290–1294 10.1016/j.biocel.2012.05.001 [DOI] [PMC free article] [PubMed] [Google Scholar]
- 48. Kimura T., Hatsuta H., Masuda-Suzukake M., Hosokawa M., Ishiguro K., Akiyama H., Murayama S., Hasegawa M., and Hisanaga S. (2016) The abundance of nonphosphorylated tau in mouse and human tauopathy brains revealed by the use of Phos-Tag method. Am. J. Pathol. 186, 398–409 10.1016/j.ajpath.2015.10.009 [DOI] [PubMed] [Google Scholar]
- 49. Shahpasand K., Uemura I., Saito T., Asano T., Hata K., Shibata K., Toyoshima Y., Hasegawa M., and Hisanaga S. (2012) Regulation of mitochondrial transport and inter-microtubule spacing by tau phosphorylation at the sites hyperphosphorylated in Alzheimer's disease. J. Neurosci. 32, 2430–2441 10.1523/JNEUROSCI.5927-11.2012 [DOI] [PMC free article] [PubMed] [Google Scholar]
- 50. Chen J., Kanai Y., Cowan N. J., and Hirokawa N. (1992) Projection domains of MAP2 and tau determine spacings between microtubules in dendrites and axons. Nature 360, 674–677 10.1038/360674a0 [DOI] [PubMed] [Google Scholar]
- 51. Harada A., Oguchi K., Okabe S., Kuno J., Terada S., Ohshima T., Sato-Yoshitake R., Takei Y., Noda T., and Hirokawa N. (1994) Altered microtubule organization in small-calibre axons of mice lacking tau protein. Nature 369, 488–491 10.1038/369488a0 [DOI] [PubMed] [Google Scholar]
- 52. Yoshioka N., Kimura-Kuroda J., Saito T., Kawamura K., Hisanaga S., and Kawano H. (2011) Small molecule inhibitor of type I transforming growth factor-β receptor kinase ameliorates the inhibitory milieu in injured brain and promotes regeneration of nigrostriatal dopaminergic axons. J. Neurosci. Res. 89, 381–393 10.1002/jnr.22552 [DOI] [PubMed] [Google Scholar]
- 53. Kimura T., Tsutsumi K., Taoka M., Saito T., Masuda-Suzukake M., Ishiguro K., Plattner F., Uchida T., Isobe T., Hasegawa M., and Hisanaga S. (2013) Isomerase Pin1 stimulates dephosphorylation of tau protein at cyclin-dependent kinase (Cdk5)-dependent Alzheimer phosphorylation sites. J. Biol. Chem. 288, 7968–7977 10.1074/jbc.M112.433326 [DOI] [PMC free article] [PubMed] [Google Scholar]
Associated Data
This section collects any data citations, data availability statements, or supplementary materials included in this article.