

Abstract
Oncogene-induced senescence (OIS) is considered a powerful tumor suppressor mechanism. Caveolin-1 acts as a scaffolding protein to functionally regulate signaling molecules. We demonstrate that a lack of caveolin-1 expression inhibits oncogenic K-Ras (K-RasG12V)-induced premature senescence in mouse embryonic fibroblasts and normal human bronchial epithelial cells. Oncogenic K-Ras induces senescence by limiting the detoxification function of MTH1. We found that K-RasG12V promotes the interaction of caveolin-1 with MTH1, which results in inhibition of MTH1 activity. Lung cancer cells expressing oncogenic K-Ras have bypassed the senescence barrier. Interestingly, overexpression of caveolin-1 restores cellular senescence in both A549 and H460 lung cancer cells and inhibits their transformed phenotype. In support of these findings, our in vivo data demonstrate that overexpression of oncogenic K-Ras (K-RasG12D) induces cellular senescence in the lung of wildtype but not caveolin-1–null mice. A lack of K-RasG12D–induced premature senescence in caveolin-1–null mice results in the formation of more abundant lung tumors. Consistent with these data, caveolin-1–null mice overexpressing K-RasG12D display accelerated mortality. Finally, our animal data were supported by human sample analysis in which we show that caveolin-1 expression is dramatically down-regulated in lung adenocarcinomas from lung cancer patients, both at the mRNA and protein levels, and that low caveolin-1 expression is associated with poor survival. Together, our data suggest that lung cancer cells escape oncogene-induced premature senescence through down-regulation of caveolin-1 expression to progress from premalignant lesions to cancer.
Keywords: caveolae, caveolin, cellular senescence, oncogene, Ras protein, senescence
Introduction
Most cells cannot divide indefinitely due to a process termed cellular senescence (1, 2). Replicative senescence is spontaneously achieved by somatic cells. Senescence can be accelerated by a number of stressful stimuli, such as oncogene activation, DNA damage, cytotoxic drugs, and oxidative stress (3–7). This type of senescence is referred to as stress-induced premature senescence. Although no single feature of the senescent phenotype is exclusively specific, hallmarks of cellular senescence include growth arrest, exit from the cell cycle, increased p53 activity, increased p21Waf1/Cip1 and p16 protein expression, hypophosphorylation of pRb, nuclear foci containing DDR proteins (DNA-SCARS/TIF) or heterochromatin, and the senescence-associated secretory phenotype (1, 2, 4, 8). Senescent cells can also be experimentally identified by their enlarged and flattened morphology, as well as by their positive staining for β-galactosidase activity at pH 6.
Lung cancer is the most frequent type of cancer. In the United States, lung cancer accounted for ∼13% of all cancer diagnoses and 27% of all cancer deaths in 2015. It is the second most diagnosed cancer in both men and women, but it is the most common cause of cancer-related death in men and women. Non-small cell lung cancer (NSCLC)3 is the most common form of lung cancer and adenocarcinoma is the most common type of NSCLC (9). Progression from premalignant lesions to malignant adenocarcinomas is a hallmark of NSCLC pathogenesis. In humans, K-Ras mutations are among the most common molecular changes in lung adenocarcinomas (10–12). K-Ras is a GTPase that plays an important role in normal tissue signaling. Wildtype K-Ras is activated by signals that promote the exchange of bound GDP to GTP. This is a transient activation due to the intrinsic ability of K-Ras to hydrolyze GTP and therefore turn itself off. However, single point mutations generate an oncogenic mutant form of K-Ras with a constitutively activated GTP-bound state. Interestingly, a well-established and intriguing function of K-Ras is its ability to promote oncogene-induced senescence (7, 13, 14).
What is the functional significance of OIS in the context of tumorigenesis? Cellular senescence is considered a tumor suppressor mechanism because it prevents the propagation of cells with damaged DNA and potentially carrying oncogenic mutations (8, 15). In vivo data suggest that oncogenic K-Ras-transformed cells need to bypass the OIS barrier to proliferate and progress to higher grades of malignancy (7, 16–18). Tumor cell senescence is not restricted to mouse models, and it has been reported in human premalignant lesions as well (18–21). Thus, a high level of oncogenic K-Ras promotes a transformed phenotype only when the tumor suppressor features of K-Ras–induced senescence are bypassed. However, the mechanisms that define this fundamental transition in tumorigenesis remain to be fully established.
Caveolin-1 is a structural protein component of caveolae, invaginations of the plasma membrane (22, 23). Although caveolae were originally believed to function as macromolecular transport vesicles (24), their role has expanded to include signal transduction, cellular metabolism, cholesterol homeostasis, endocytosis, tumor promotion, and tumor suppression (25). Caveolin-1 acts as a scaffolding protein that concentrates and functionally regulates signaling molecules. The direct interaction with caveolin-1 generally results in the sequestration of a given signaling molecule within caveolar membranes and modulation of its signaling activity (26–30). These signaling proteins include G-protein α subunits, H-Ras, nitric-oxide synthase, epidermal growth factor receptor, Src-like nonreceptor tyrosine kinases, protein kinase C, protein kinase A, and NADPH oxidase. Our laboratory was the first to show that caveolin-1 promotes stress-induced premature senescence in fibroblasts through the modulation of Mdm2, ATM, PP2A-C, Nrf2, and Sirt1 functions (31–38). However, whether caveolin-1 regulates the tumor suppressor properties of oncogene-induced senescence remains unexplored. In this study, we demonstrate that caveolin-1 promotes oncogenic K-Ras–induced senescence and that activation of the oncogenic K-Ras/caveolin-1/senescence pathway prevents lung cancer development in mice. Consistent with these findings, low caveolin-1 expression is found in lung cancer patients and is associated with poor lung cancer patient survival. Together, our data provide novel molecular insights into the functional significance of OIS.
Results
Caveolin-1 promotes oncogenic K-Ras–induced premature senescence in mouse embryonic fibroblasts and human bronchial epithelial cells
To investigate the role of caveolin-1 in oncogene-induced senescence, we overexpressed oncogenic K-Ras (K-RasG12V) in mouse embryonic fibroblasts (MEFs) derived from either wildtype or caveolin-1–null mice, which do not express caveolin-1 (31). After 2 weeks, cellular senescence was quantified by using three independent senescence markers: senescence-associated β-galactosidase (SA-β-gal) staining and expression of p21 and p16 by immunoblotting analysis. We found that overexpression of K-RasG12V induced senescence in ∼90% of wildtype MEFs, as assessed by SA-β-gal staining (Fig. 1, A and B). In contrast, K-RasG12V-induced senescence was dramatically inhibited in MEFs lacking caveolin-1 expression (Fig. 1, A and B). Consistent with these findings, the K-RasG12V-promoted up-regulation of both p21 and p16 was significantly inhibited in MEFs derived from caveolin-1–null mice, as compared with wildtype MEFs (Fig. 1, C and D). In support of these data, we found that oncogenic K-Ras induced senescence in normal human bronchial epithelial cells (Fig. 2, A and B) and that down-regulation of caveolin-1 in these cells significantly inhibited K-RasG12V-induced senescence (Fig. 2, C–E). We conclude that K-RasG12V induces cellular senescence in a caveolin-1–dependent manner.
Figure 1.

A lack of caveolin-1 inhibits oncogenic K-Ras–induced cellular senescence in MEFs. A–D, MEFs were derived from either wildtype or caveolin-1–null mice. MEFs (passage 1) were infected with a lentivirus expressing a c-Myc–tagged K-RasG12V cDNA (pLVX-K-RasG12V). Infection with a lentivirus carrying the empty pLVX vector (pLVX) was used as control. Cells were cultured for 14 days, and cellular senescence was assessed by SA-β-gal staining (quantification is shown in A, and representative images are shown in B) and immunoblotting analysis using antibody probes specific for caveolin-1 (Cav-1), c-Myc, p16, and p21. Immunoblotting with anti-β-actin IgGs was performed to show equal loading (representative blots are shown in C, and quantification analysis is shown in D). Values in A and D represent means ± S.E. (error bars); statistical comparisons were made using a t test. *, p < 0.001.
Figure 2.
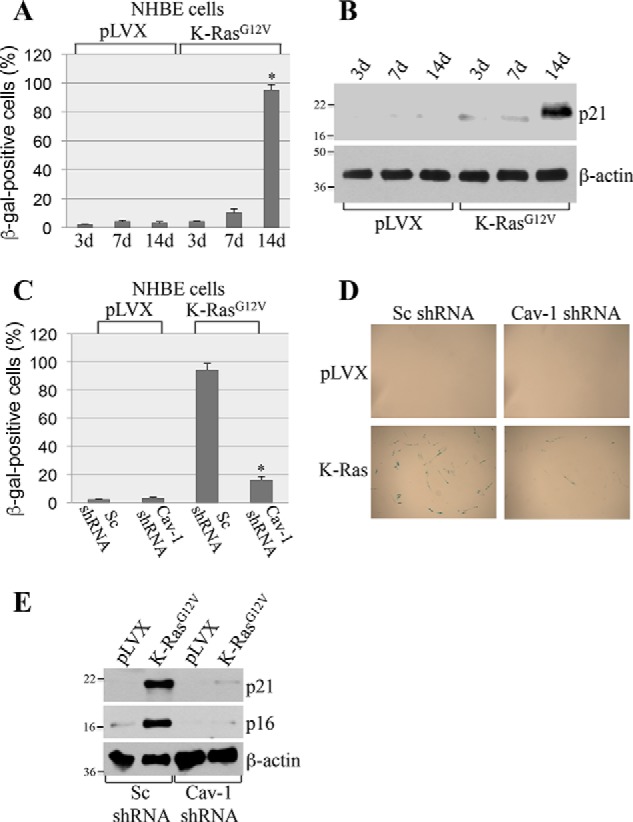
Down-regulation of caveolin-1 inhibits oncogenic K-Ras–induced cellular senescence in NHBE cells. A and B, NHBE cells were infected with either vector alone (pLVX) or oncogenic K-Ras (K-RasG12V). Cells were collected after 3, 7, and 14 days, and cellular senescence was quantified by SA-β-gal staining (quantification is shown in A) and immunoblotting analysis using antibody probes specific for p21 (B). Immunoblotting with anti-β-actin IgGs was performed to show equal loading (B). C–E, caveolin-1 protein expression was down-regulated in NHBE cells by ∼90% using shRNA (data not shown). Cells were then infected with either vector alone (pLVX) or K-RasG12V. Cells were collected after 14 days, and cellular senescence was quantified by SA-β-gal staining (quantification is shown in C, and representative images are shown in D) and immunoblotting analysis using antibody probes specific for p16 and p21 (E). Immunoblotting with anti-β-actin IgGs was performed to show equal loading. Values in A and C represent means ± S.E. (error bars); statistical comparisons were made using a t test. *, p < 0.001.
K-RasG12V inhibits the detoxification function of MTH1 through caveolin-1
Oncogenic K-Ras promotes premature senescence through oxidative DNA damage (7, 13, 14). MTH1 is the major mammalian detoxifier of the oxidized DNA precursor 8-oxo-dGTP. MTH1 removes reactive oxygen species–induced 8-oxoguanine from the dNTP pool, preventing its incorporation into DNA and the initiation of a DNA damage/senescence response (39–44). Down-regulation of MTH1 induces premature senescence, whereas overexpression of MTH1 inhibits oncogene-induced senescence (39–44). Thus, oncogenic K-Ras induces premature senescence by limiting the detoxification function of MTH1. However, the endogenous signaling mechanism through which oncogenic K-Ras limits MTH1 activity and promotes OIS remains to be established. To gain insights into K-RasG12V-induced and caveolin-1–mediated cellular senescence, we asked whether caveolin-1 was the molecule through which oncogenic K-Ras inhibits MTH1. The scaffolding domain of caveolin-1, which is represented by residues 82–101, mediates direct protein-protein interactions between caveolin-1 and a variety of signaling molecules carrying a caveolin-binding domain (ΦXΦXXXXΦ, ΦXXXXΦXXΦ, or ΦXΦXXXXΦXXΦ, where Φ represents an aromatic amino acid and X represents any amino acid) (45–47). Analysis of the MTH1 protein sequence indicates that MTH1 has a putative caveolin-binding domain between amino acids 27 and 35 (Fig. 3A). To investigate whether MTH1 is a binding partner of caveolin-1 in vitro, we performed pulldown assays using a series of caveolin-1 deletion mutants fused to GST (Fig. 3B). Fig. 3C shows that MTH1 is a novel caveolin-1–binding protein and that the scaffolding domain of caveolin-1 was sufficient for binding to MTH1. We then asked whether caveolin-1 interacts with MTH1 in cells and whether oncogenic K-Ras regulates such interaction. Normal human bronchial epithelial cells were infected with a lentiviral vector (pLVX) expressing oncogenic K-Ras (K-RasG12V). K-RasG12V–expressing cells were cultured for different periods of time (3, 7, and 14 days). Cells infected with pLVX alone were used as control. Cells were collected, and caveolin-1 was immunoprecipitated using an antibody probe specific for caveolin-1. Immunoprecipitates were subjected to immunoblotting analysis with anti-MTH1 IgGs. We show in Fig. 4A that caveolin-1 interacted with MTH1 only in cells expressing oncogenic K-Ras beginning at 7 days after K-Ras infection. Importantly, normal human bronchial epithelial (NHBE) cells displayed a senescent phenotype only 14 days after infection with K-RasG12V (Fig. 2, A and B). We conclude that oncogenic K-Ras promotes the interaction between caveolin-1 and MTH1, which precedes the onset of oncogene-induced premature senescence. To determine the functional significance of MTH1 binding to caveolin-1, K-RasG12V was expressed in NHBE cells in which caveolin-1 expression was down-regulated by shRNA, and cells were cultured for 7 days. We show in Fig. 4 (B and C) that down-regulation of caveolin-1 limited the oncogenic K-Ras–induced elevation of 8-oxoguanine. Because increased levels of 8-oxoguanine in cells are a direct indication of MTH1 inhibition, these data indicate that oncogenic K-Ras inhibits MTH1 function through caveolin-1. Together, our findings suggest that oncogenic K-Ras induces premature senescence by promoting the caveolin-1–mediated inhibition of the detoxification function of MTH1.
Figure 3.

MTH1 is a novel caveolin-1–interacting protein. A, schematic showing the consensus caveolin-binding domain (CBD) and the caveolin-binding domain of MTH1 (amino acids 27–35). Φ represents an aromatic amino acid, and X represents any amino acid. B, Ponceau S staining of GST alone and caveolin-1–GST fusion proteins. FL, full-length. C, caveolin-1–GST fusion protein pulldown assays were performed using cell lysates from NIH 3T3 cells transiently transfected with MTH1-Myc. IP, immunoprecipitation; IB, immunoblotting.
Figure 4.

K-RasG12V promotes the interaction of caveolin-1 with MTH1; caveolin-1 mediates K-RasG12V-induced elevation of 8-oxoguanine. A, NHBE cells were infected with either vector alone (pLVX) or K-RasG12V. Cells were collected after 3, 7, and 14 days, and cell lysates were immunoprecipitated using an antibody probe specific for caveolin-1 (IP: Cav-1). Immunoprecipitates were then subjected to immunoblotting analysis using an antibody probe specific for MTH1 (IB: MTH1). Total expression of caveolin-1 (Cav-1), MTH1, and K-RasG12V is shown in the bottom panels (Input). B and C, scrambled shRNA (Sc shRNA)- and caveolin-1 shRNA (Cav-1 shRNA)-expressing NHBE cells were infected with pLVX-K-RasG12V. Infection with vector alone was used as control. Our data show that Cav-1 shRNA down-regulates Cav-1 expression by ∼90% (data not shown). Cells were collected 7 days after infection, and the level of 8-oxoguanine was quantified by staining with FITC-labeled avidin. Quantification is shown in B, and representative images are shown in C. Specificity of staining was demonstrated by a lack of signal when FITC-Avidin was preblocked with soluble 8-oxoguanosine (data not shown). Values in B represent means ± S.E. (error bars); statistical comparisons were made using a t test. *, p < 0.001.
Re-expression of caveolin-1 restores cellular senescence in lung cancer cells and inhibits their transformed phenotype
NSCLC cells are known to possess a transformed phenotype because they escaped OIS (7, 16–18). A549 cells carry oncogenic K-Ras (K-RasG12V) and are representative of NSCLC. Interestingly, caveolin-1 expression is almost undetectable in these cells (Fig. 5A). Because our data show that caveolin-1 expression promotes oncogene-induced senescence (Figs. 1 and 2), we asked whether re-expression of caveolin-1 in A549 cells was sufficient to restore the ability of these cells to undergo cellular senescence. A549 cells were infected with a lentiviral vector expressing caveolin-1. Cellular senescence was quantified after 2 weeks. We show in Fig. 5 (B and C) that re-expression of caveolin-1 was sufficient to promote senescence in A549 cells, as shown by p21 expression and SA-β-gal staining.
Figure 5.

Overexpression of caveolin-1 restores cellular senescence in A549 cells and inhibits their transformed phenotype. A, total cell lysates from NHBE and A549 cells were subjected to immunoblotting analysis using anti-caveolin-1 IgGs. Immunoblotting with anti-β-actin IgGs was performed to show equal loading. B and C, A549 lung cancer cells were infected with lentivirus expressing caveolin-1 (Cav-1). Infection with lentivirus carrying the empty vector pLVX was used as control. Cells were collected after 3, 7, and 14 days. Cellular senescence was determined by SA-β-gal staining (B) and immunoblotting analysis using an antibody probe specific for p21 (C). Overexpression of caveolin-1 was verified using anti-caveolin-1 IgGs (C). Immunoblotting using anti-β-actin IgGs was performed to show equal loading (C). D, A549 cells were infected as described in B and C. Cell number was counted at different times after the infection (0, 1, 3, 5, and 7 days). E and F, A549 cells were infected as described in B and C. After 7 days, A549 cells were collected and cultured in soft agar for 7 days. Representative images are shown in E, and quantification of growth in soft agar is shown in F. Values in B, D, and F represent means ± S.E. (error bars); statistical comparisons were made using a t test. *, p < 0.001.
Cellular senescence is a powerful tumor suppressor mechanism. As such, we then asked whether restoration of cellular senescence by caveolin-1 inhibited the transformation properties of A549 cells. We demonstrate that re-expression of caveolin-1 inhibited proliferation of A549 cells (Fig. 5D) and their ability to grow in soft agar (Fig. 5, E and F). Importantly, these data were confirmed in H460 cells, a lung cancer cell line that, like A549, expresses mutant K-Ras but has wildtype p53. We found that overexpression of caveolin-1 in H460 cells promoted cellular senescence (Fig. 6, A and B) and inhibited their transformed phenotype (Fig. 6, C and D). We conclude from these data that the re-introduction of caveolin-1 restores the anti-proliferative properties of cellular senescence in oncogenic K-Ras–expressing lung cancer cells.
Figure 6.

Overexpression of caveolin-1 restores cellular senescence in H460 cells and inhibits their transformed phenotype. A and B, H460 lung cancer cells were infected with lentivirus expressing caveolin-1 (Cav-1). Infection with lentivirus carrying the empty vector pLVX was used as control. Cells were collected after 3, 7, and 14 days. Cellular senescence was determined by SA-β-gal staining (A) and immunoblotting analysis using an antibody probe specific for p21 (B). Overexpression of caveolin-1 was verified using anti-caveolin-1 IgGs B. Immunoblotting using anti-β-actin IgGs was performed to show equal loading (B). C and D, H460 cells were infected as described in A and B. After 7 days, H460 cells were collected and cultured in soft agar for 7 days. Representative images are shown in C, and quantification of growth in soft agar is shown in D. Values in A and D represent means ± S.E. (error bars); statistical comparisons were made using a t test. *, p < 0.001.
Oncogenic K-Ras–induced cellular senescence is inhibited in the lung of caveolin-1–null mice
Our cell culture data of Figs. 1–6 demonstrate that caveolin-1 plays a key role in the induction of cellular senescence induced by oncogenic K-Ras. To confirm these data in vivo, we generated a novel mouse model in which oncogenic K-Ras (K-RasG12D) was expressed in a caveolin-1–null background. More specifically, we crossed K-RasLA2-G12D mice with caveolin-1−/− mice to generate the novel K-RasLA2-G12D/Cav-1−/− mouse (Fig. 7, A and B). K-RasLA2-G12D/Cav-1+/+ mice were used as controls. K-RasLA2-G12D mice are heterozygous for the K-Ras G12D mutation and develop lung tumors with a histopathology very similar to human disease (48). Thus, it is a well-established mouse model to study lung cancer development. The lungs of 4-week-old K-RasLA2-G12D/Cav-1+/+ and K-RasLA2-G12D/Cav-1−/− mice were extracted, and cellular senescence was quantified by staining frozen sections for senescence-associated β-gal activity. We found that the number of cells positive for SA-β-gal activity was dramatically reduced in K-RasLA2-G12D/Cav-1−/− mice, as compared with K-RasLA2-G12D/Cav-1+/+ mice (Fig. 7C). Consistent with these findings, expression of the senescence markers p16 and p21 was significantly lower in the lungs of K-RasLA2-G12D mice lacking caveolin-1 (Fig. 7, D and E). In addition, we show that 95% of tumor lesions in K-RasLA2-G12D/Cav-1+/+ mice were senescence-positive, as compared with only 40% in K-RasLA2-G12D/Cav-1−/− mice (Fig. 7, F and G). Thus, caveolin-1 expression promotes oncogene-induced cellular senescence in a mouse model of lung cancer expressing K-RasLA2-G12D.
Figure 7.

A lack of caveolin-1 inhibits oncogenic K-Ras-induced cellular senescence in mice. A, breeding strategy for the generation of K-RasLA2-G12D/Cav-1−/− mice. B, PCR-based screening for the identification of K-RasLA2-G12D/Cav-1+/+ and K-RasLA2-G12D/Cav-1−/− mice. C, the lungs of 4-week-old K-RasLA2-G12D/Cav-1+/+ and K-RasLA2-G12D/Cav-1−/− mice (n = 7) were extracted, and frozen sections were subjected to SA-β-gal staining. An H-score was determined using Imagescope (Leica Biosystems) and the Positive Pixel algorithm (see “Experimental procedures” for details). D and E, the lungs of 4-week-old K-RasLA2-G12D/Cav-1+/+ and K-RasLA2-G12D/Cav-1−/− mice (n = 7) were extracted. Tissue lysates were subjected to immunoblotting analysis using antibody probes specific for caveolin-1 (Cav-1) and the senescence markers p21 and p16. Immunoblotting with anti-β-actin IgGs was performed to show equal loading. A representative blot is shown in D, and quantification of p21 and p16 protein expression is shown in E. Quantification of caveolin-1 expression is shown in Fig. 11B. F and G, the lungs of 4-week-old K-RasLA2-G12D/Cav-1+/+ and K-RasLA2-G12D/Cav-1−/− mice (n = 7) were extracted, and serial frozen sections were subjected to H&E and SA-β-gal staining. Cancerous lesions were identified by H&E staining, and the percentage of lung lesions that resulted positive for SA-β-gal staining was determined (F). Representative images are shown in G. Values in C, E, and F represent means ± S.E. (error bars); statistical comparisons were made using a t test. *, p < 0.001.
A lack of caveolin-1 promotes lung tumor development in K-RasLA2-G12D mice
Because cellular senescence is a tumor suppressor mechanism and our data show that the absence of caveolin-1 expression inhibits the development of K-RasG12D–induced cellular senescence in the lung in mice, we then asked whether lung tumor formation was enhanced in K-RasLA2-G12D/Cav-1−/− mice. To this end, the number of microscopic lesions was quantified by H&E staining in the lungs of 4-week-old K-RasLA2-G12D mice, either expressing or lacking caveolin-1. In mouse pulmonary pathology, atypical adenomatous hyperplasia (AAH) is a premalignant lesion preceding adenomas (48, 49). In mice, adenomas are often non-invasive but malignant lesions, some of which may proceed to invasive adenocarcinoma (50–53). Microscopic examination shows a 3-fold increase in the number of malignant adenomas in the lung of 4-week-old K-RasLA2-G12D/Cav-1−/− mice, as compared with K-RasLA2-G12D/Cav-1+/+ mice. Quantification is shown in Fig. 8A, and representative images are shown in Fig. 8B (Fig. 8C shows high-magnification images of lesions from Fig. 8B). In support of these data, the total number of surface tumors was 2.5-fold higher in K-RasLA2-G12D/Cav-1−/− than K-RasLA2-G12D/Cav-1+/+ mice (Fig. 8D). Enhanced tumorigenesis in RasLA2-G12D/Cav-1−/− mice was confirmed in older mice (21–26-week-old age group), as shown by a further increase in the number of adenomas (Fig. 9, A–C) as well as that of total surface tumors (Fig. 10A) in K-RasLA2-G12D/Cav-1−/− mice, as compared with K-RasLA2-G12D/Cav-1+/+ mice. Consistent with these findings, overall survival (Fig. 10B) and mean age of death (Fig. 10C) of K-RasLA2-G12D/Cav-1−/− mice were lower than those of K-RasLA2-G12D/Cav-1+/+ mice. We conclude from these data that caveolin-1 promotes the tumor-suppressive function of cellular senescence during lung cancer development.
Figure 8.

Lung cancer formation is increased in young K-RasLA2-G12D mice lacking caveolin-1. A–C, the lungs of 4-week-old K-RasLA2-G12D/Cav-1+/+ and K-RasLA2-G12D/Cav-1−/− mice (n = 7) were extracted, and lung sections were subjected to H&E staining. The number of AAHs and adenomas was scored by a Board-certified pathologist. Quantification of tumor lesions per mouse is shown in (A), representative low-power images are shown in (B), and representative high-power images are shown in (C). D, the lungs of 4-week-old K-RasLA2-G12D/Cav-1+/+ and K-RasLA2-G12D/Cav-1−/− mice (n = 7) were extracted, and the number of surface tumors per mouse was scored. Values in A and D represent means ± S.E. (error bars); statistical comparisons were made using a t test. *, p < 0.001.
Figure 9.

A lack of caveolin-1 expression enhances lung tumor development in old K-RasLA2-G12D mice. A–C, the lungs of 21–26-week-old K-RasLA2-G12D/Cav-1+/+ and K-RasLA2-G12D/Cav-1−/− mice (n = 6) were extracted, and lung sections were subjected to H&E staining. The number of lung lesions (AAH, adenoma, and ADC) was scored by a Board-certified pathologist. Quantification of tumor lesions per mouse is shown in A, representative low-power images are shown in B, and representative high-power images are shown in C. Values in A represent means ± S.E. (error bars); statistical comparisons were made using a t test. *, p < 0.001; #, p < 0.05.
Figure 10.
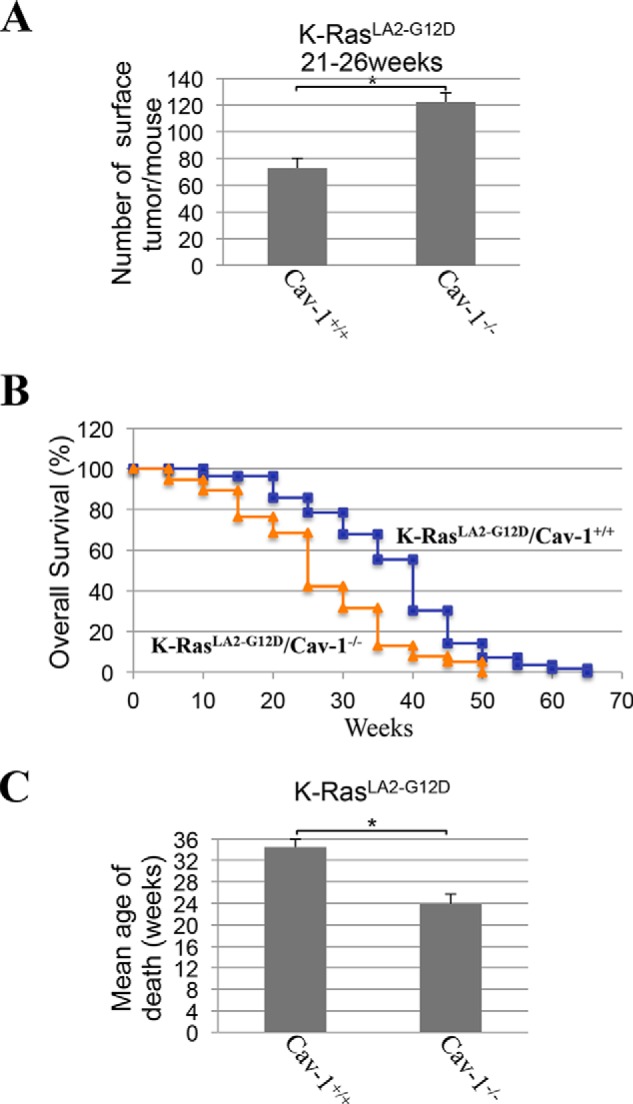
K-RasLA2-G12D/Cav-1−/− mice develop more surface lung tumors and display accelerated mortality. A, the lungs of 21–26-week-old K-RasLA2-G12D/Cav-1+/+ and K-RasLA2-G12D/Cav-1−/− mice (n = 6) were extracted, and the number of surface tumors per mouse was scored. B, the overall survival of K-RasLA2-G12D/Cav-1+/+ (blue curve) and K-RasLA2-G12D/Cav-1−/− (orange curve) mice was plotted in a Kaplan–Meier curve. C, the mean age of death was calculated for K-RasLA2-G12D/Cav-1+/+ and K-RasLA2-G12D/Cav-1−/− mice. Values represent means ± S.E. (error bars); statistical comparisons were made using a t test. *, p < 0.001.
Down-regulation of endogenous caveolin-1 in K-RasG12D mice correlates with lung tumor development
Because we found that K-RasG12D/Cav-1−/− mice develop more lung tumors than K-RasG12D/Cav-1+/+ mice, our data show that oncogenic K-Ras–initiated and caveolin-1–mediated cellular senescence is a tumor suppressor mechanism. However, wildtype caveolin-1/K-RasG12D–expressing mice do eventually develop lung tumors and therefore bypass senescence as they age. How is caveolin-1–mediated cellular senescence bypassed in these wildtype caveolin-1/K-RasG12D mice? To address this question, we investigated the hypothesis that down-regulation of endogenous caveolin-1 might represent a molecular mechanism through which oncogenic K-Ras–expressing cells bypass senescence. Our data of Figs. 7D and 11B show that caveolin-1 expression was only marginally reduced in the lungs of 4-week-old wildtype caveolin-1/K-RasG12D mice (as compared with age-matched C57Bl6 mice), which show abundant lung cell senescence but only marginal lung tumor formation (Fig. 8A). In contrast, we show in Fig. 11 (A and B) that caveolin-1 expression was significantly down-regulated in the lungs of 21–26-week-old Cav-1+/+/K-RasG12D mice, which showed increased tumor formation with respect to their younger counterparts (Fig. 9A), as compared with age-matched C57Bl6 mice. These data suggest that down-regulation of caveolin-1 might allow oncogenic K-Ras–expressing cells to bypass oncogene-induced senescence and promote tumor development. To support this conclusion, we infected wildtype MEFs with a lentiviral vector expressing K-RasG12V. MEFs infected with an empty vector were used as a control. As shown in Fig. 1, only K-RasG12V–expressing MEFs underwent cellular senescence after 14 days. However, by culturing K-RasG12V-expressing MEFs for ∼8 weeks, we were able to isolate cells that maintained expression of oncogenic K-Ras (Fig. 11C) but continued to grow and escaped cellular senescence (data not shown). Interestingly, caveolin-1 expression was down-regulated in K-RasG12V-expressing MEFs that escaped cellular senescence (Fig. 11, C and D). Importantly, this phenomenon was not observed in MEFs infected with vector alone, which stopped growing after ∼3–4 weeks (as is expected for primary culture of MEFs) and did not show down-regulation of caveolin-1 (Fig. 11, C and D). Together, these data suggest that a selective pressure exists in oncogenic K-Ras–expressing cells that allows them to escape senescence possibly through the down-regulation of caveolin-1.
Figure 11.

Down-regulation of endogenous caveolin-1 expression correlates with lung tumor development in K-RasLA2-G12D/Cav-1+/+ mice and occurs in wildtype MEFs that escape OIS. A and B, caveolin-1 expression was determined in 21–26-week-old C57Bl6 and K-RasLA2-G12D/Cav-1+/+ mice by immunoblotting analysis using an antibody probe specific for caveolin-1. Immunoblotting with anti-β-actin IgGs was performed to show equal loading. Representative blots are shown in A, and quantification is shown in B. In B, we also show quantification of caveolin-1 expression from 4-week-old C57Bl6 and K-RasLA2-G12D/Cav-1+/+ mice that is presented in Fig. 7D. C and D, caveolin-1 expression was assessed by immunoblotting analysis using anti-caveolin-1 IgGs in wildtype MEFs that were infected with a lentivirus expressing K-RasG12V and that escaped OIS (see “Results” for details). Wildtype MEFs that were infected with lentivirus carrying the empty vector pLVX were used as controls. Immunoblotting with anti-β-actin IgGs was performed to show equal loading. Representative blots are shown in C; quantification is shown in D. Values in B and D represent means ± S.E. (error bars); statistical comparisons were made using a t test. *, p < 0.001; #, p < 0.05.
Caveolin-1 expression is down-regulated in human lung cancer, and low caveolin-1 expression is associated with poor survival
Because a loss of caveolin-1 expression promotes lung tumor development in K-RasG12D mice and to give our findings a more direct clinical relevance, we investigated whether caveolin-1 expression was down-regulated in lung tumors in humans. Using lung adenocarcinoma tumor tissue microarrays (TMAs) stained for caveolin-1, we found that 86% of human adenocarcinomas were caveolin-1–negative (95% CI 79–91%; Fig. 12A) and that 91% (59 of 65) of adenocarcinoma cases carrying mutant K-Ras were caveolin-1–negative (Fig. 12A). Interestingly, caveolin-1 expression was not lost in the tumor stroma, which resulted Cav-1–positive in 82% of TMAs (95% CI 74–88%; Fig. 12A). Representative images of Cav-1(−) tumor cells and Cav-1(+) stromal cells are shown in Fig. 12B. Immunofluorescence staining with a caveolin-1–specific antibody probe confirmed reduced caveolin-1 expression in lung adenocarcinoma specimens, as compared with normal lung tissue (Fig. 12C). In support of these findings, DNA methylation analysis using the Cancer Genome Atlas database showed methylation of the caveolin-1 gene in human lung adenocarcinomas and a significant correlation between increased methylation of the caveolin-1 gene and reduced caveolin-1 expression (Fig. 12D). These data were independently confirmed by gene expression analysis using RNA derived from lung adenocarcinoma patients, on which we performed Kaplan–Meier analysis of the overall survival, stratified by caveolin-1 positivity. We found that the rate of death was 60% lower for patients with high caveolin-1 expression (Fig. 12E). More specifically, the high caveolin-1 group showed better overall survival (median overall survival of 48 months) as compared with subjects with a low caveolin-1 signal (median overall survival of 18 months) (log-rank p value = 0.004) even after controlling for tumor stage and sex as co-factors (hazard ratio 0.41, 95% CI 0.22–0.79) (Fig. 12E). Together, these data suggest that caveolin-1 has tumor-suppressive functions in human lung cancer and support the notion that reduced/loss of caveolin-1 expression in tumor cells may serve as an independent prognostic marker.
Figure 12.

Down-regulation of caveolin-1 expression occurs in human lung cancer and is associated with reduced lung cancer patient survival. A–C, TMAs were obtained from 128 lung adenocarcinoma patients who underwent thoracic surgical procedures at the University of Pittsburgh Cancer Institute. Immunohistochemical analysis was performed on TMAs using a mouse monoclonal antibody (mAb 2297). Caveolin-1 positivity was defined as 2+ staining in at least 30% of cancer cells assessed. Quantification is shown in A, and representative images are shown in B. C, representative immunofluorescence staining with a caveolin-1–specific antibody probe (pAb N-20) of adenocarcinoma cases and normal lung tissue. D, caveolin-1 gene expression and methylation analysis in 21 normal lung samples (Pearson r = 0.242) and 440 lung adenocarcinoma samples (Pearson r = −0.401) from the Cancer Genome Atlas database. E, mRNA was extracted from 62 human lung adenocarcinoma samples, as described previously (59). Caveolin-1 gene expression was measured by an Illumina bead array. Overall survival of lung cancer patients with high caveolin-1 (>527) and low caveolin-1 (≤527) expression was plotted in a Kaplan–Meier curve. F, schematic diagram summarizing the tumor suppressor role of oncogenic K-Ras–initiated and caveolin-1–mediated senescence in lung cancer. Caveolin-1 promotes oncogenic K-Ras-induced cellular senescence in premalignant lung lesions, which inhibits tumor development. The oncogenic K-Ras–induced senescence barrier is lost following down-regulation of caveolin-1 expression, which allows premalignant lung lesions to progress to malignant cancer.
Discussion
Most normal mammalian cells, in contrast to cancer cells, have limited proliferative capacity. After a certain number of cell divisions, somatic cells experience an irreversible cell cycle arrest; they become irresponsive to growth factor stimulation and undergo morphological and biochemical changes but remain metabolically active. This physiological process can be accelerated by stressful stimuli, including oncogene activation. Almost 20 years ago, it was shown for the first time that overexpression of oncogenic H-Ras (H-RasG12V) in normal cells was sufficient to induce cellular senescence instead of increasing cell proliferation (7). Since then, numerous investigations have demonstrated that oncogene-induced senescence acts as a tumor suppressor mechanism. Studies have shown that senescence occurs in premalignant lesions in several mouse cancer models, including lymphoma, prostate, mammary, and lung carcinoma. In the lungs, Serrano et al. (18) have found that senescence is restricted to premalignant lesions of the lung and is absent in malignant cancers in a mouse model of lung cancer expressing K-RasG12V. In humans, senescence was found in benign lesions of the prostate, skin, and neurofibromas and was associated with oncogenic mutation of BRAF, PTEN inactivation, and NF1 mutations. Thus, cellular senescence is activated by the same oncogene that drove the initial tumorigenesis and represents a barrier that preneoplastic lesions need to escape to progress to cancer. The molecular players and mechanisms that promote oncogenic K-Ras-induced cellular senescence remain to be fully elucidated, and their identification will provide additional insights into cancer development.
In this study, we demonstrate that caveolin-1 is a key regulator of the signaling events linking expression of oncogenic K-Ras to cellular senescence in cells. Senescence induced by the overexpression of K-RasG12V was inhibited in mouse embryonic fibroblasts derived from caveolin-1–null mice, which do not express caveolin-1 and NHBE cells lacking caveolin-1. We also found that the oncogenic K-Ras–induced interaction of caveolin-1 with MTH1 results in inhibition of MTH1 function. MTH1 is a key detoxifier in mammalian cells, and its action prevents the initiation of a DNA damage/senescence response. Thus, our data propose that the caveolin-1–mediated inhibition of MTH1 is an important molecular mechanism that explains how oncogenic K-Ras elicits cellular senescence. Interestingly, re-expression of caveolin-1 in caveolin-1–negative A549 and H460 lung cancer cells restored senescence and inhibited the transformed phenotype of these cells. These data are consistent with previous findings by Lisanti's group showing that a lack of caveolin-1 expression enhanced the transformed phenotype of INK4a(−/−) MEFs after oncogene overexpression in vitro and in vivo (54). Thus, oncogenic K-Ras–induced cellular senescence is mediated by caveolin-1 in cells.
Our study also shows that caveolin-1 is a key regulator of oncogene-induced senescence in mice. We crossed K-RasLA2-G12Dmice with caveolin-1–null mice (both on a C57Bl6 background) to obtain K-RasLA2-G12D/Cav-1−/− mice. K-RasLA2-G12D mice are heterozygous for the K-Ras G12D mutation and represent a well-established mouse model to study lung cancer development (48). Caveolin-1–null mice are viable and fertile and do not show any gross physical abnormalities. At around 12 months of age, they show decreased cardiac muscle contractility and cardiac fibrosis; they also have progressive lipid metabolism pathologies and lung endothelial cell hyperproliferation. They do not spontaneously develop tumors, and the role of caveolin-1 in lung tumorigenesis remains unexplored. We found that cellular senescence induced by the overexpression of K-RasG12D was significantly inhibited in the lungs of mice lacking caveolin-1 expression, directly confirming our cell culture data using MEFs and NHBE cells. Consistent with the tumor suppressor ability of cellular senescence, lung tumor development was enhanced, and overall survival was reduced in K-RasG12D-expressing caveolin-1–null mice, as compared with K-RasG12D/Cav-1+/+ mice. Accelerated mortality of K-RasG12D/Cav-1−/− mice was associated with increased adenoma but not adenocarcinoma formation. This finding was not surprising, considering that (i) adenocarcinoma formation is limited in this mouse model and (ii) we observed numerous large adenomas in K-RasG12D/Cav-1−/− mice, for which an absolute criterion does not exist for distinguishing them from well-differentiated adenocarcinomas (55). Moreover, considering that adenomas are malignant lung lesions in mice that do not necessarily progress to adenocarcinomas and that our data show that adenomas in K-RasG12D/Cav-1−/− mice occupy/replace a significant lung parenchyma volume (Figs. 8 and 9), enhanced malignant adenoma formation in K-RasLA2-G12D/Cav-1−/− mice probably compromises lung function and significantly contributes to the accelerated mortality of these mice (Fig. 10, B and C), even in the absence of increased adenocarcinoma formation. Finally, we cannot rule out the possibility that the anti-tumorigenic effects of caveolin-1 are not limited to its pro-senescent actions in oncogenic K-Ras–expressing epithelial cells. We speculate that caveolin-1–mediated signaling might elicit tumor suppressor responses in other cell types, such as immune cells; separate lines of investigation are required to directly test this hypothesis, which goes beyond the scope of the current study. Importantly, our results are consistent with studies showing that caveolin-1–null mice have increased tumorigenesis in certain mouse models of cancer, such as breast (56) and skin cancer (57), in which, however, caveolin-1–dependent senescence was not investigated.
Human lung cancer analysis directly supports the conclusions from cell culture and animal studies. In fact, our data show that caveolin-1 expression is low in lung cancer cells, but not stromal cells, from adenocarcinoma patients, both at the mRNA and protein levels. They also show that the great majority of patients carrying oncogenic K-Ras are also caveolin-1–negative. Consistent with these findings, low tumor caveolin-1 expression was associated with poor survival in lung cancer patients. These findings suggest that reduced/loss of caveolin-1 expression in lung cancer cells may serve as a novel and independent prognostic marker. Together, our data indicate that caveolin-1 has tumor suppressor properties through its ability to promote oncogene-induced senescence. Lung cells expressing oncogenic K-Ras bypass oncogene-induced senescence when caveolin-1 expression is either reduced or lost, which results in accelerated lung cancer development and reduced survival (Fig. 12F). This scenario is consistent with our data showing that down-regulation of caveolin-1 correlates with lung tumor development in the K-RasG12D mouse model (Fig. 11, A and B) and occurs in cells escaping oncogene-induced senescence in culture (Fig. 11, C and D).
K-Ras has been an elusive therapeutic target since the identification of K-Ras mutations in lung cancer, nearly 30 years ago. This can be partially explained by the fact that the direct inhibition of K-Ras activity has been technically challenging and that K-Ras has multiple downstream signaling partners (including Raf/MEK/ERK- and PI3K/Akt/TOR-dependent pathways). Based on our current findings, we believe that one additional and unconventional explanation contributes to justifying the failure of K-Ras–based therapies: By inhibiting K-Ras activity, a drug would inhibit the pro-tumorigenic properties of K-Ras but, at the same time, would prevent K-Ras–transformed cells from reverting back to a pro-senescent phenotype, an event that requires K-Ras and caveolin-1 function. Thus, we propose that the selective inhibition of the signaling molecules that are responsible for down-regulation of caveolin-1 expression in cells in which K-Ras activity is maintained is a better therapeutic strategy because it will allow the selective inhibition of pro-tumorigenic K-Ras signaling while rescuing pro-senescent and caveolin-1–dependent K-Ras pathways.
Experimental procedures
Materials
Antibodies and their sources were as follows: anti-caveolin-1 IgG (pAb N-20), anti-p21 IgG (pAb), anti-c-Myc IgG (mAb 9E10), and anti-β-actin (mAb C4) were from Santa Cruz Biotechnology, Inc. (Dallas, TX); anti-caveolin-1 IgG (mAb 2297) was from BD Biosciences; anti-p16 IgG (pAb ab51243) was from Abcam (Cambridge, MA); horseradish peroxidase-conjugated goat anti-mouse and anti-rabbit secondary antibodies were from Pierce. Lentiviruses expressing either K-RasG12V or caveolin-1 were generated by using the Lenti-X Expression System from Takara (Mountain View, CA). Diphenyleneiodonium chloride was purchased from Sigma. All other biochemicals used were of the highest purity available and were obtained from regular commercial sources.
Cell culture
MEFs were derived from wildtype and caveolin-1–null mice as described previously (31). MEFs were grown in Dulbecco's modified Eagle's medium supplemented with glutamine, antibiotics (penicillin and streptomycin), and 10% fetal bovine serum. NHBE cells were grown in BEGM medium supplemented with BulletKit from Lonza (Anaheim, CA). A549 and H460 lung cancer cells were grown in Ham's F-12 supplemented with glutamine, antibiotics (penicillin and streptomycin), and 10% fetal bovine serum.
Immunoblotting
Cells were collected in boiling sample buffer. Cellular proteins were resolved by SDS-PAGE (12.5% acrylamide) and transferred to BA83 nitrocellulose membranes (Schleicher & Schuell). Blots were incubated for 2 h in TBST (10 mm Tris-HCl, pH 8.0, 150 mm NaCl, 0.2% Tween 20) containing 2% powdered skim milk and 1% BSA. After three washes with TBST, membranes were incubated for 2 h with the primary antibody and for 1 h with horseradish peroxidase-conjugated goat anti-rabbit/mouse IgG. Bound antibodies were detected using an ECL detection kit (Pierce). Quantification of immunoblotting analysis was performed from three independent experiments and normalized versus β-actin.
Acid β-galactosidase staining
Acid β-galactosidase staining was performed using the senescence-associated β-galactosidase staining kit (Cell Signaling), according to the manufacturer's recommendations.
Cells
Cells were washed twice with PBS and fixed with the fixative solution for 15 min. Then cells were washed twice with PBS and incubated overnight at 37 °C with the staining solution. Cells were then examined for the development of blue color. Cells were photographed at a ×40 magnification using a BX50WI Olympus Optical light microscope (Tokyo, Japan).
Tissue
Frozen mouse lung sections were thawed, fixed with the fixative solution for 15 min, and incubated overnight at 37 °C with the staining solution. Slides were then washed twice with PBS and mounted with an antifade solution. Pictures of β-gal–stained lung sections were taken at ×20 magnification. β-gal staining was quantified using Imagescope (Leica Biosystems, Buffalo Grove, IL) and the Positive Pixel algorithm. A minimum of 10–15 non-overlapping regions from each tissue were used for quantification. This algorithm identifies pixels (intensity of staining) in three different categories: number of weak positive, number of positive, and number of strong positive pixels. H-score is then calculated using the formula, H-score = ((Nwp/Ntotal) × 100)) + ((Np/Ntotal) × 200) + ((Nsp/Ntotal) × 300)), where Nwp represents the number of weakly positive pixels, Np is the number of moderately positive pixels, Nsp is the number of strongly positive pixels; and Ntotal is the total number of negative + positive pixels.
Growth in soft agar
pLVX- and pLVX-Cav-1–infected A549/H460 cells (5 × 10⁴) were suspended in 3 ml of Ham's F-12 medium containing 10% fetal bovine serum and 0.33% SeaPlaque low-melting temperature agarose. These cells were plated over a 2-ml layer of solidified Ham's F-12 medium containing 10% fetal bovine serum and 0.5% agarose and allowed to settle to the interface between these layers at 37 °C. After 20 min, the plates were allowed to harden at room temperature for 30 min before returning to 37 °C. After 10 days, colonies were photographed under low magnification (×5). The colonies in 80 randomly chosen fields from three independent plates were counted.
Generation of K-RasLA2-G12D/Cav-1−/− mice and genotyping analysis
All mouse experiments were reviewed and approved by the institutional animal care and use committee at the University of Pittsburgh. K-RasLA2-G12D mice were crossed with caveolin-1–null (Cav-1−/−) mice (both mouse strains were obtained from the Jackson Laboratory and were on a C57Bl/6 background) to obtain K-RasLA2-G12D/Cav-1−/− mice. Genotype determinations were made by PCR analysis from tail snips of 3-week-old pups using the following primers: K-Ras-F (5′-TGCACAGCTTAGTGAGACCC-3′), K-Ras-R1 (5′-GACTGCTCTCTTTCACCTCC-3′), K-Ras-R2 (5′-GGAGCAAAGCTGCTATTGGC-3′), Cav-1-F1 (5′-GTGTATGACGCGCACACCAAG-3′), Cav-1-F2 (5′-CTAGTGAGACGTGCTACTTCC-3′), and Cav-1-R (5′-CTTGAGTTCTGTTAGCCCAG-3′).
Histological analysis on mouse lung tissue
Mice were euthanized at the indicated times. Lungs were perfused with PBS and inflated with OCT. After 5 min, lungs were extracted, and surface tumors were counted. Lungs were then embedded in OCT and frozen in liquid nitrogen. Serial sections from OCT-frozen lungs were obtained and stained with H&E for histological examination.
Human lung TMAs
Formalin-fixed paraffin-embedded (FFPE) lung tumor tissues were obtained from lung cancer patients who underwent thoracic surgical procedures at the University of Pittsburgh Cancer Institute from 2004 to 2011 under an institutional review board–approved protocol. TMAs were constructed using randomly selected archival FFPE lung ADC tumors and histologically evaluated by hematoxylin and eosin stain to select areas of each FFPE specimen containing representative tumor cells. At least four 1.0-mm diameter cores were extracted from the selected area of each FFPE block and arrayed on new recipient blocks using a commercially available microarray instrument (Beecher Instruments Manual Arrayer, Beecher Instruments, Inc., San Prairie, WI). A total of four TMAs were constructed, which included 128 ADC tumor samples. Clinical and pathological information for each case was abstracted from the University of Pittsburgh Cancer Institute cancer registry and verified by chart review.
Immunohistochemical analysis on human lung tumor samples
Immunohistochemical analysis was performed on TMAs using a mouse monoclonal antibody (mAb 2297) at a 1:200 dilution. Incubation with TBS was used as negative control. Staining was scored by a Board-certified pathologist (S. D.), blinded to clinical outcome. Caveolin-1 positivity was defined as 2+ staining in at least 30% of cancer cells assessed, as described previously (58).
Immunofluorescence analysis on human lung tumor samples
Immunofluorescence staining was performed on four adenocarcinoma cases and three control samples with a polyclonal anti-caveolin-1 antibody (pAb N-20) at a 1:500 dilution in phosphate-buffered solution with calcium and magnesium (PBS-CM) containing 0.1% Triton X-100 (PBS-CM-T) at room temperature for 3 h. Slides were washed three times (10 min each) in PBS-CM-T. Slides were then incubated for 2 h in secondary antibodies (1:1000 dilution in PBS-CM-T). Slides were washed three times in PBS-CM-T for 10 min each, and a coverslip was mounted on the tissue with slow-Fade antifade reagent (Invitrogen) and sealed with nail polish.
Caveolin-1 gene expression analysis in human lung tumor samples and overall survival analysis
mRNA was extracted from a cohort of 62 lung adenocarcinoma patients who underwent thoracic surgical procedures at the University of Pittsburgh Cancer Institute from 1992 to 2006 under an institutional review board–approved protocol, as described previously (59). Caveolin-1 gene expression was measured by an Illumina bead array. For predicting overall survival, we used recursive partitioning to identify an optimal cutpoint (>527) based on reduction of a one-step deviance and minimization of cross-validation predicting error. Overall survival was calculated in months from the date of lung cancer surgery until death or last contact. Univariate models examining group differences in overall survival were plotted and evaluated using a Kaplan–Meier survival curve and the log-rank test. Multivariable models with tumor stage (0–4 continuous for stage IA, IB, II, III, and IV) and sex as additional predictors were fitted using Cox proportional hazards regression using R version 3.3.1 (R Foundation for Statistical Computing, Vienna, Austria).
Author contributions
F. G. conceived the project. D. V., A. R. V., Y. P. D., and F. G. designed experiments. D. V., A. R. V., and C. C. performed experiments and analyzed data. S. D., L. P. S., B. F. K., S. R. A., T. F. B., and J. M. H. analyzed data. F. G. wrote the manuscript.
This work was supported by NCI, National Institutes of Health (NIH), Grants R01-CA205165 (to F. G.), P50-CA090440, and P30-CA047904 and NHLBI, NIH, Grants R01-HL124747 (to F. G.) and R01-HL091938 (to Y. P. D.). The authors declare that they have no conflicts of interest with the contents of this article. The content is solely the responsibility of the authors and does not necessarily represent the official views of the National Institutes of Health.
- NSCLC
- non-small cell lung cancer
- NHBE
- normal human bronchial epithelial
- H&E
- hematoxylin and eosin
- ADC
- adenocarcinoma
- OIS
- oncogene-induced senescence
- MEF
- mouse embryonic fibroblast
- SA
- senescence-associated
- AAH
- atypical adenomatous hyperplasia
- CI
- confidence interval
- pAb
- polyclonal antibody
- TMA
- tumor tissue microarray
- FFPE
- formalin-fixed paraffin-embedded.
References
- 1. Lundberg A. S., Hahn W. C., Gupta P., and Weinberg R. A. (2000) Genes involved in senescence and immortalization. Curr. Opin. Cell Biol. 12, 705–709 10.1016/S0955-0674(00)00155-1 [DOI] [PubMed] [Google Scholar]
- 2. Sherr C. J., and DePinho R. A. (2000) Cellular senescence: mitotic clock or culture shock? Cell 102, 407–410 10.1016/S0092-8674(00)00046-5 [DOI] [PubMed] [Google Scholar]
- 3. Jeyapalan J. C., and Sedivy J. M. (2008) Cellular senescence and organismal aging. Mech. Ageing Dev. 129, 467–474 10.1016/j.mad.2008.04.001 [DOI] [PMC free article] [PubMed] [Google Scholar]
- 4. Kreiling J. A., Tamamori-Adachi M., Sexton A. N., Jeyapalan J. C., Munoz-Najar U., Peterson A. L., Manivannan J., Rogers E. S., Pchelintsev N. A., Adams P. D., and Sedivy J. M. (2011) Age-associated increase in heterochromatic marks in murine and primate tissues. Aging Cell 10, 292–304 10.1111/j.1474-9726.2010.00666.x [DOI] [PMC free article] [PubMed] [Google Scholar]
- 5. Frippiat C., Chen Q. M., Zdanov S., Magalhaes J. P., Remacle J., and Toussaint O. (2001) Subcytotoxic H2O2 stress triggers a release of transforming growth factor-β1, which induces biomarkers of cellular senescence of human diploid fibroblasts. J. Biol. Chem. 276, 2531–2537 10.1074/jbc.M006809200 [DOI] [PubMed] [Google Scholar]
- 6. Robles S. J., and Adami G. R. (1998) Agents that cause DNA double strand breaks lead to p16INK4a enrichment and the premature senescence of normal fibroblasts. Oncogene 16, 1113–1123 10.1038/sj.onc.1201862 [DOI] [PubMed] [Google Scholar]
- 7. Serrano M., Lin A. W., McCurrach M. E., Beach D., and Lowe S. W. (1997) Oncogenic ras provokes premature cell senescence associated with accumulation of p53 and p16INK4a. Cell 88, 593–602 10.1016/S0092-8674(00)81902-9 [DOI] [PubMed] [Google Scholar]
- 8. Campisi J. (2013) Aging, cellular senescence, and cancer. Annu. Rev. Physiol. 75, 685–705 10.1146/annurev-physiol-030212-183653 [DOI] [PMC free article] [PubMed] [Google Scholar]
- 9. van Zandwijk N., Mooi W. J., and Rodenhuis S. (1995) Prognostic factors in NSCLC: recent experiences. Lung Cancer 12, S27–S33 10.1016/0169-5002(95)00418-Z [DOI] [PubMed] [Google Scholar]
- 10. Mitsudomi T., Viallet J., Mulshine J. L., Linnoila R. I., Minna J. D., and Gazdar A. F. (1991) Mutations of ras genes distinguish a subset of non-small-cell lung cancer cell lines from small-cell lung cancer cell lines. Oncogene 6, 1353–1362 [PubMed] [Google Scholar]
- 11. Cancer Genome Atlas Research Network (2014) Comprehensive molecular profiling of lung adenocarcinoma. Nature 511, 543–550 10.1038/nature13385 [DOI] [PMC free article] [PubMed] [Google Scholar]
- 12. Karachaliou N., Mayo C., Costa C., Magrí I., Gimenez-Capitan A., Molina-Vila M. A., and Rosell R. (2013) KRAS mutations in lung cancer. Clin. Lung Cancer 14, 205–214 10.1016/j.cllc.2012.09.007 [DOI] [PubMed] [Google Scholar]
- 13. Sarkisian C. J., Keister B. A., Stairs D. B., Boxer R. B., Moody S. E., and Chodosh L. A. (2007) Dose-dependent oncogene-induced senescence in vivo and its evasion during mammary tumorigenesis. Nat. Cell Biol. 9, 493–505 10.1038/ncb1567 [DOI] [PubMed] [Google Scholar]
- 14. Young T. W., Mei F. C., Yang G., Thompson-Lanza J. A., Liu J., and Cheng X. (2004) Activation of antioxidant pathways in ras-mediated oncogenic transformation of human surface ovarian epithelial cells revealed by functional proteomics and mass spectrometry. Cancer Res. 64, 4577–4584 10.1158/0008-5472.CAN-04-0222 [DOI] [PubMed] [Google Scholar]
- 15. Rodier F., and Campisi J. (2011) Four faces of cellular senescence. J. Cell Biol. 192, 547–556 10.1083/jcb.201009094 [DOI] [PMC free article] [PubMed] [Google Scholar]
- 16. Baek K. H., Bhang D., Zaslavsky A., Wang L. C., Vachani A., Kim C. F., Albelda S. M., Evan G. I., and Ryeom S. (2013) Thrombospondin-1 mediates oncogenic Ras-induced senescence in premalignant lung tumors. J. Clin. Invest. 123, 4375–4389 10.1172/JCI67465 [DOI] [PMC free article] [PubMed] [Google Scholar]
- 17. Collado M., and Serrano M. (2010) Senescence in tumours: evidence from mice and humans. Nat. Rev. Cancer 10, 51–57 10.1038/nrc2772 [DOI] [PMC free article] [PubMed] [Google Scholar]
- 18. Collado M., Gil J., Efeyan A., Guerra C., Schuhmacher A. J., Barradas M., Benguría A., Zaballos A., Flores J. M., Barbacid M., Beach D., and Serrano M. (2005) Tumour biology: senescence in premalignant tumours. Nature 436, 642 10.1038/436642a [DOI] [PubMed] [Google Scholar]
- 19. Bartkova J., Rezaei N., Liontos M., Karakaidos P., Kletsas D., Issaeva N., Vassiliou L. V., Kolettas E., Niforou K., Zoumpourlis V. C., Takaoka M., Nakagawa H., Tort F., Fugger K., Johansson F., et al. (2006) Oncogene-induced senescence is part of the tumorigenesis barrier imposed by DNA damage checkpoints. Nature 444, 633–637 10.1038/nature05268 [DOI] [PubMed] [Google Scholar]
- 20. Chen Z., Trotman L. C., Shaffer D., Lin H. K., Dotan Z. A., Niki M., Koutcher J. A., Scher H. I., Ludwig T., Gerald W., Cordon-Cardo C., and Pandolfi P. P. (2005) Crucial role of p53-dependent cellular senescence in suppression of Pten-deficient tumorigenesis. Nature 436, 725–730 10.1038/nature03918 [DOI] [PMC free article] [PubMed] [Google Scholar]
- 21. Michaloglou C., Vredeveld L. C., Soengas M. S., Denoyelle C., Kuilman T., van der Horst C. M., Majoor D. M., Shay J. W., Mooi W. J., and Peeper D. S. (2005) BRAFE600-associated senescence-like cell cycle arrest of human naevi. Nature 436, 720–724 10.1038/nature03890 [DOI] [PubMed] [Google Scholar]
- 22. Lisanti M. P., Scherer P., Tang Z.-L., and Sargiacomo M. (1994) Caveolae, caveolin and caveolin-rich membrane domains: a signalling hypothesis. Trends Cell Biol. 4, 231–235 10.1016/0962-8924(94)90114-7 [DOI] [PubMed] [Google Scholar]
- 23. Okamoto T., Schlegel A., Scherer P. E., and Lisanti M. P. (1998) Caveolins, A family of scaffolding proteins for organizing “pre-assembled signaling complexes” at the plasma membrane. J. Biol. Chem. 273, 5419–5422 10.1074/jbc.273.10.5419 [DOI] [PubMed] [Google Scholar]
- 24. Matveev S., Li X., Everson W., and Smart E. J. (2001) The role of caveolae and caveolin in vesicle-dependent and vesicle-independent trafficking. Adv. Drug Deliv. Rev. 49, 237–250 10.1016/S0169-409X(01)00138-7 [DOI] [PubMed] [Google Scholar]
- 25. Williams T. M., and Lisanti M. P. (2005) Caveolin-1 in oncogenic transformation, cancer, and metastasis. Am. J. Physiol. Cell Physiol. 288, C494–C506 [DOI] [PubMed] [Google Scholar]
- 26. García-Cardeña G., Oh P., Liu J., Schnitzer J. E., and Sessa W. C. (1996) Targeting of nitric oxide synthase to endothelilal cell caveolae via palmitoylation: implications for caveolae localization. Proc. Natl. Acad. Sci. U.S.A. 93, 6448–6453 10.1073/pnas.93.13.6448 [DOI] [PMC free article] [PubMed] [Google Scholar]
- 27. Liu P., Ying Y., and Anderson R. G. (1997) Platelet-derived growth factor activates mitogen-activated protein kinase in isolated caveolae. Proc. Natl. Acad. Sci. U.S.A. 94, 13666–13670 10.1073/pnas.94.25.13666 [DOI] [PMC free article] [PubMed] [Google Scholar]
- 28. Smart E. J., Ying Y.-S., and Anderson R. G. W. (1995) Hormonal regulation of caveolae internalization. J. Cell Biol. 131, 929–938 10.1083/jcb.131.4.929 [DOI] [PMC free article] [PubMed] [Google Scholar]
- 29. Schnitzer J. E., Liu J., and Oh P. (1995) Endothelial caveolae have the molecular transport machinery for vesicle budding, docking, and fusion including VAMP, NSF, SNAP, annexins, and GTPases. J. Biol. Chem. 270, 14399–14404 10.1074/jbc.270.24.14399 [DOI] [PubMed] [Google Scholar]
- 30. Segal S. S., Brett S. E., and Sessa W. C. (1999) Codistribution of NOS and caveolin throughout peripheral vasculature and skeletal muscle of hamsters. Am. J. Physiol. 277, H1167–H1177 [DOI] [PubMed] [Google Scholar]
- 31. Bartholomew J. N., Volonte D., and Galbiati F. (2009) Caveolin-1 regulates the antagonistic pleiotropic properties of cellular senescence through a novel Mdm2/p53-mediated pathway. Cancer Res. 69, 2878–2886 10.1158/0008-5472.CAN-08-2857 [DOI] [PMC free article] [PubMed] [Google Scholar]
- 32. Dasari A., Bartholomew J. N., Volonte D., and Galbiati F. (2006) Oxidative stress induces premature senescence by stimulating caveolin-1 gene transcription through p38 mitogen-activated protein kinase/Sp1-mediated activation of two GC-rich promoter elements. Cancer Res. 66, 10805–10814 10.1158/0008-5472.CAN-06-1236 [DOI] [PMC free article] [PubMed] [Google Scholar]
- 33. Volonte D., and Galbiati F. (2009) Inhibition of thioredoxin reductase 1 by caveolin 1 promotes stress-induced premature senescence. EMBO Rep. 10, 1334–1340 10.1038/embor.2009.215 [DOI] [PMC free article] [PubMed] [Google Scholar]
- 34. Volonte D., and Galbiati F. (2011) Polymerase I and transcript release factor (PTRF)/cavin-1 is a novel regulator of stress-induced premature senescence. J. Biol. Chem. 286, 28657–28661 10.1074/jbc.C111.235119 [DOI] [PMC free article] [PubMed] [Google Scholar]
- 35. Volonte D., Kahkonen B., Shapiro S., Di Y., and Galbiati F. (2009) Caveolin-1 expression is required for the development of pulmonary emphysema through activation of the ATM-p53-p21 pathway. J. Biol. Chem. 284, 5462–5466 10.1074/jbc.C800225200 [DOI] [PMC free article] [PubMed] [Google Scholar]
- 36. Volonte D., Zhang K., Lisanti M. P., and Galbiati F. (2002) Expression of caveolin-1 induces premature cellular senescence in primary cultures of murine fibroblasts. Mol. Biol. Cell 13, 2502–2517 10.1091/mbc.01-11-0529 [DOI] [PMC free article] [PubMed] [Google Scholar]
- 37. Volonte D., Liu Z., Musille P. M., Stoppani E., Wakabayashi N., Di Y. P., Lisanti M. P., Kensler T. W., and Galbiati F. (2013) Inhibition of nuclear factor-erythroid 2-related factor (Nrf2) by caveolin-1 promotes stress-induced premature senescence. Mol. Biol. Cell 24, 1852–1862 10.1091/mbc.E12-09-0666 [DOI] [PMC free article] [PubMed] [Google Scholar]
- 38. Volonte D., Zou H., Bartholomew J. N., Liu Z., Morel P. A., and Galbiati F. (2015) Oxidative stress-induced inhibition of Sirt1 by caveolin-1 promotes p53-dependent premature senescence and stimulates the secretion of interleukin 6 (IL-6). J. Biol. Chem. 290, 4202–4214 10.1074/jbc.M114.598268 [DOI] [PMC free article] [PubMed] [Google Scholar]
- 39. Gad H., Koolmeister T., Jemth A. S., Eshtad S., Jacques S. A., Ström C. E., Svensson L. M., Schultz N., Lundbäck T., Einarsdottir B. O., Saleh A., Göktürk C., Baranczewski P., Svensson R., Berntsson R. P., et al. (2014) MTH1 inhibition eradicates cancer by preventing sanitation of the dNTP pool. Nature 508, 215–221 10.1038/nature13181 [DOI] [PubMed] [Google Scholar]
- 40. Huber K. V., Salah E., Radic B., Gridling M., Elkins J. M., Stukalov A., Jemth A. S., Göktürk C., Sanjiv K., Strömberg K., Pham T., Berglund U. W., Colinge J., Bennett K. L., Loizou J. I., Helleday T., Knapp S., and Superti-Furga G. (2014) Stereospecific targeting of MTH1 by (S)-crizotinib as an anticancer strategy. Nature 508, 222–227 10.1038/nature13194 [DOI] [PMC free article] [PubMed] [Google Scholar]
- 41. Patel A., Burton D. G., Halvorsen K., Balkan W., Reiner T., Perez-Stable C., Cohen A., Munoz A., Giribaldi M. G., Singh S., Robbins D. J., Nguyen D. M., and Rai P. (2015) MutT homolog 1 (MTH1) maintains multiple KRAS-driven pro-malignant pathways. Oncogene 34, 2586–2596 10.1038/onc.2014.195 [DOI] [PMC free article] [PubMed] [Google Scholar]
- 42. Rai P., Onder T. T., Young J. J., McFaline J. L., Pang B., Dedon P. C., and Weinberg R. A. (2009) Continuous elimination of oxidized nucleotides is necessary to prevent rapid onset of cellular senescence. Proc. Natl. Acad. Sci. U.S.A. 106, 169–174 10.1073/pnas.0809834106 [DOI] [PMC free article] [PubMed] [Google Scholar]
- 43. Rai P., Young J. J., Burton D. G., Giribaldi M. G., Onder T. T., and Weinberg R. A. (2011) Enhanced elimination of oxidized guanine nucleotides inhibits oncogenic RAS-induced DNA damage and premature senescence. Oncogene 30, 1489–1496 10.1038/onc.2010.520 [DOI] [PubMed] [Google Scholar]
- 44. Rai P. (2012) Human Mut T homolog 1 (MTH1): a roadblock for the tumor-suppressive effects of oncogenic RAS-induced ROS. Small GTPases 3, 120–125 10.4161/sgtp.19556 [DOI] [PMC free article] [PubMed] [Google Scholar]
- 45. Couet J., Li S., Okamoto T., Ikezu T., and Lisanti M. P. (1997) Identification of peptide and protein ligands for the caveolin-scaffolding domain: implications for the interaction of caveolin with caveolae-associated proteins. J. Biol. Chem. 272, 6525–6533 10.1074/jbc.272.10.6525 [DOI] [PubMed] [Google Scholar]
- 46. Jagannadham M. V., Sharadadevi A., and Nagaraj R. (2002) Effects of deleting a tripeptide sequence observed in muscular dystrophy patients on the conformation of synthetic peptides corresponding to the scaffolding domain of caveolin-3. Biochem. Biophys. Res. Commun. 298, 203–206 10.1016/S0006-291X(02)02426-9 [DOI] [PubMed] [Google Scholar]
- 47. Song K. S., Tang Z., Li S., and Lisanti M. P. (1997) Mutational analysis of the properties of caveolin-1. A novel role for the C-terminal domain in mediating homotypic caveolin-caveolin interactions. J. Biol. Chem. 272, 4398–4403 10.1074/jbc.272.7.4398 [DOI] [PubMed] [Google Scholar]
- 48. Johnson L., Mercer K., Greenbaum D., Bronson R. T., Crowley D., Tuveson D. A., and Jacks T. (2001) Somatic activation of the K-ras oncogene causes early onset lung cancer in mice. Nature 410, 1111–1116 10.1038/35074129 [DOI] [PubMed] [Google Scholar]
- 49. Jackson E. L., Willis N., Mercer K., Bronson R. T., Crowley D., Montoya R., Jacks T., and Tuveson D. A. (2001) Analysis of lung tumor initiation and progression using conditional expression of oncogenic K-ras. Genes Dev. 15, 3243–3248 10.1101/gad.943001 [DOI] [PMC free article] [PubMed] [Google Scholar]
- 50. Fisher G. H., Wellen S. L., Klimstra D., Lenczowski J. M., Tichelaar J. W., Lizak M. J., Whitsett J. A., Koretsky A., and Varmus H. E. (2001) Induction and apoptotic regression of lung adenocarcinomas by regulation of a K-Ras transgene in the presence and absence of tumor suppressor genes. Genes Dev. 15, 3249–3262 10.1101/gad.947701 [DOI] [PMC free article] [PubMed] [Google Scholar]
- 51. Foley J. F., Anderson M. W., Stoner G. D., Gaul B. W., Hardisty J. F., and Maronpot R. R. (1991) Proliferative lesions of the mouse lung: progression studies in strain A mice. Exp. Lung Res. 17, 157–168 10.3109/01902149109064408 [DOI] [PubMed] [Google Scholar]
- 52. Ohshima M., Ward J. M., Singh G., and Katyal S. L. (1985) Immunocytochemical and morphological evidence for the origin of N-nitrosomethylurea-induced and naturally occurring primary lung tumors in F344/NCr rats. Cancer Res. 45, 2785–2792 [PubMed] [Google Scholar]
- 53. Rehm S., Devor D. E., Henneman J. R., and Ward J. M. (1991) Origin of spontaneous and transplacentally induced mouse lung tumors from alveolar type II cells. Exp. Lung Res. 17, 181–195 10.3109/01902149109064410 [DOI] [PubMed] [Google Scholar]
- 54. Williams T. M., Lee H., Cheung M. W., Cohen A. W., Razani B., Iyengar P., Scherer P. E., Pestell R. G., and Lisanti M. P. (2004) Combined loss of INK4a and caveolin-1 synergistically enhances cell proliferation and oncogene-induced tumorigenesis: role of INK4a/CAV-1 in mammary epithelial cell hyperplasia. J. Biol. Chem. 279, 24745–24756 10.1074/jbc.M402064200 [DOI] [PubMed] [Google Scholar]
- 55. Nikitin A. Y., Alcaraz A., Anver M. R., Bronson R. T., Cardiff R. D., Dixon D., Fraire A. E., Gabrielson E. W., Gunning W. T., Haines D. C., Kaufman M. H., Linnoila R. I., Maronpot R. R., Rabson A. S., Reddick R. L., et al. (2004) Classification of proliferative pulmonary lesions of the mouse: recommendations of the mouse models of human cancers consortium. Cancer Res. 64, 2307–2316 10.1158/0008-5472.CAN-03-3376 [DOI] [PubMed] [Google Scholar]
- 56. Williams T. M., Cheung M. W., Park D. S., Razani B., Cohen A. W., Muller W. J., Di Vizio D., Chopra N. G., Pestell R. G., and Lisanti M. P. (2003) Loss of caveolin-1 gene expression accelerates the development of dysplastic mammary lesions in tumor-prone transgenic mice. Mol. Biol. Cell 14, 1027–1042 10.1091/mbc.E02-08-0503 [DOI] [PMC free article] [PubMed] [Google Scholar]
- 57. Capozza F., Williams T. M., Schubert W., McClain S., Bouzahzah B., Sotgia F., and Lisanti M. P. (2003) Absence of caveolin-1 sensitizes mouse skin to carcinogen-induced epidermal hyperplasia and tumor formation. Am. J. Pathol. 162, 2029–2039 10.1016/S0002-9440(10)64335-0 [DOI] [PMC free article] [PubMed] [Google Scholar]
- 58. Feldman R., Gatalica Z., Reddy S. K., Castro M., and Sachdev J. C. (2015) Caveolin-1: oncogenic role in breast cancer? Clues from molecular profiling. J. Clin. Oncol. 33, 134 10.1200/jco.2015.33.28_suppl.134 [DOI] [Google Scholar]
- 59. Stabile L. P., Dacic S., Land S. R., Lenzner D. E., Dhir R., Acquafondata M., Landreneau R. J., Grandis J. R., and Siegfried J. M. (2011) Combined analysis of estrogen receptor β-1 and progesterone receptor expression identifies lung cancer patients with poor outcome. Clin. Cancer Res. 17, 154–164 10.1158/1078-0432.CCR-10-0992 [DOI] [PMC free article] [PubMed] [Google Scholar]