Significance
The anatomy and dynamics of different layers of the cerebral cortex are distinct. Physiological work in the sensory cortex has investigated how different layers process sensory inputs, and how they are engaged during attention tasks. In the frontal and prefrontal cortices, where lamination is present, very few studies have investigated the role of distinct layers for cognition. We studied frontal cortex laminar neuronal activity as monkeys performed working memory tasks. Spiking and gamma-band activity (50–150 Hz) in the superficial layers reflected active maintenance of working memories. Alpha/beta frequencies (4–22 Hz) in the deep layers modulated the gamma activity in the superficial layers. This might serve a control function, allowing information to enter or exit active storage in superficial layers.
Keywords: cortical layers, oscillations, working memory, frontal cortex
Abstract
All of the cerebral cortex has some degree of laminar organization. These different layers are composed of neurons with distinct connectivity patterns, embryonic origins, and molecular profiles. There are little data on the laminar specificity of cognitive functions in the frontal cortex, however. We recorded neuronal spiking/local field potentials (LFPs) using laminar probes in the frontal cortex (PMd, 8A, 8B, SMA/ACC, DLPFC, and VLPFC) of monkeys performing working memory (WM) tasks. LFP power in the gamma band (50–250 Hz) was strongest in superficial layers, and LFP power in the alpha/beta band (4–22 Hz) was strongest in deep layers. Memory delay activity, including spiking and stimulus-specific gamma bursting, was predominately in superficial layers. LFPs from superficial and deep layers were synchronized in the alpha/beta bands. This was primarily unidirectional, with alpha/beta bands in deep layers driving superficial layer activity. The phase of deep layer alpha/beta modulated superficial gamma bursting associated with WM encoding. Thus, alpha/beta rhythms in deep layers may regulate the superficial layer gamma bands and hence maintenance of the contents of WM.
Working memory (WM) is associated with neural activity during a memory delay. This is thought to be due to recurrent connections between columns of pyramidal neurons in superficial cortical layers (1), but support for this has been mixed. One study found that delay activity was shared across superficial and deep layer neurons (2), whereas another reported delay activity neurons (“late storage units”) at more superficial depths (3). This uncertainty may be due to the previous use of single-contact electrodes, which make it difficult to assess the depth of the recorded signals.
Another question is whether the frontal cortex shows similar layer-specific properties as the visual cortex (4–7). In the visual cortex, multiple-contact “laminar” electrodes have revealed that gamma (>30 Hz) oscillations are prominent in superficial/middle layers, while slower oscillations (alpha/beta; 10–30 Hz) are prominent in deep layers (5, 7, 8). Deep layer alpha activity drives superficial alpha activity (4, 6), and the phase of deep layer alpha modulates the amplitude of superficial layer gamma (9). Similar tests in the supplemental eye fields have reported gamma power in superficial layers (10, 11); however, one of those studies failed to find evidence of deep layer low-frequency oscillations coupled with superficial gamma (11), leading to the conclusion that frontal cortex laminar dynamics might be fundamentally different. Neither study examined WM-related activity in the frontal cortex with laminar electrodes.
We recorded both spiking and local field potential (LFP) activity with multilaminar electrodes in six frontal cortex areas (PMd, 8A, 8B, SMA/ACC, DLPFC, and VLPFC) in three WM tasks. This revealed delay period spiking predominately in superficial layers and laminar dynamics in frontal cortex similar to those in visual cortex, suggesting a layer-specific pattern of recurring dynamics between visual and frontal cortices.
Results
Gamma Power Peaks in Superficial Layers and Alpha/Beta Peaks in Deep Layers.
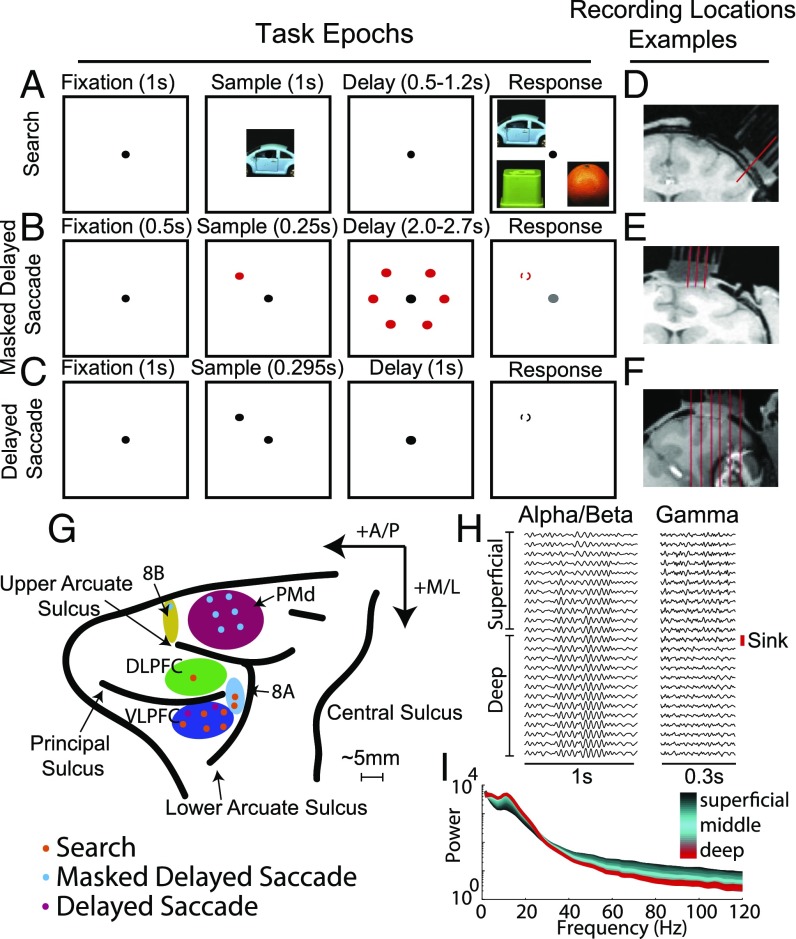
Three monkeys performed three different WM tasks (Fig. 1 A–C). Either spatial or object identity information had to be retained during a delay period. Laminar probes with spacing of 100–200 μm between contacts recorded LFPs and neuronal spiking from all cortical layers (Fig. 1 D–F). They were lowered as perpendicular as possible to the cortex to ensure an even sampling of the different layers. We completed a total of 60 U/V probe recordings in frontal cortex (Fig. 1G and SI Appendix, Table S1). The middle cortical layer (bottom of layer 3/layer 4) was identified, using current source density (CSD) analysis, by the presence of a current sink in response to a visual stimulus (see SI Appendix, Experimental Procedures). We aligned all of the data from all electrodes to the middle layer (i.e., the contact with the first significant CSD sink; see SI Appendix, Fig. S1 for the average CSD profiles).
Fig. 1.
(A) Visual search task. A match between sample and test image was chosen after a delay (0.5–1.2 s) by making a saccade to the match. Each image was positioned randomly at any one of four possible locations (Upper Right, Lower Right, Upper Left, and Lower Left). (B) Masked delayed saccade. After a sample period, during which a single spatial location was cued (one of six possible locations), the animal had to hold fixation through a variable delay (2.2–2.7 s) and the presentation of the visual mask. After this delay, and when the fixation point color changed, the animal had to saccade to the previously cued location. (C) Delayed saccade. After a sample period, during which a single spatial location was cued (one of four possible locations), the animal had to hold fixation through a fixed delay (0.99 s) and saccade to the cued location when the fixation dot disappeared. (D and E) The small red lines indicate sample trajectories chosen to be as perpendicular as possible to cortex. (F) The small red lines indicate sample trajectories that were possible given the recording hardware. Only the third trajectory from the left was used for laminar recordings. (G) We recorded across frontal cortex. The different colored dots indicate the task, and the letters indicate the corresponding anatomic region. In addition to those labeled, we recorded from the anterior cingulate cortex (ACC) and the supplementary motor area (SMA) (SI Appendix, Fig. S12). (H) Sample LFP recordings were bandpass-filtered at 10–25 Hz (Left) and 40–160 Hz (Right). The red line marks the location of the first significant CSD sink and the border between the superficial and deep layers. (I) A sample power spectrum with a clear alpha/beta bump (between 10 and 25 Hz) and broadband gamma (>40 Hz). The variations across layers are plotted as a color gradient (black, superficial to red, deep).
We calculated power from 200 ms before the visual stimulus to 500 ms post stimulus. High frequency power peaked in superficial layers and low frequencies peaked in deep layers. Fig. 1H plots examples of low- and high-passed LFPs from one laminar recording, and Fig. 1I is a power spectrum, illustrating that high frequencies (above ∼40 Hz) dominated in superficial layers and low frequencies (below ∼20 Hz) dominated in deep layers. To quantify these differences in power across each laminar probe, we normalized power at each frequency (1–500 Hz) and each contact by the maximal power at that frequency across contacts. For each frequency and each session, the contact with maximal power had a value of 1 and other contacts had values relative to this maximum.
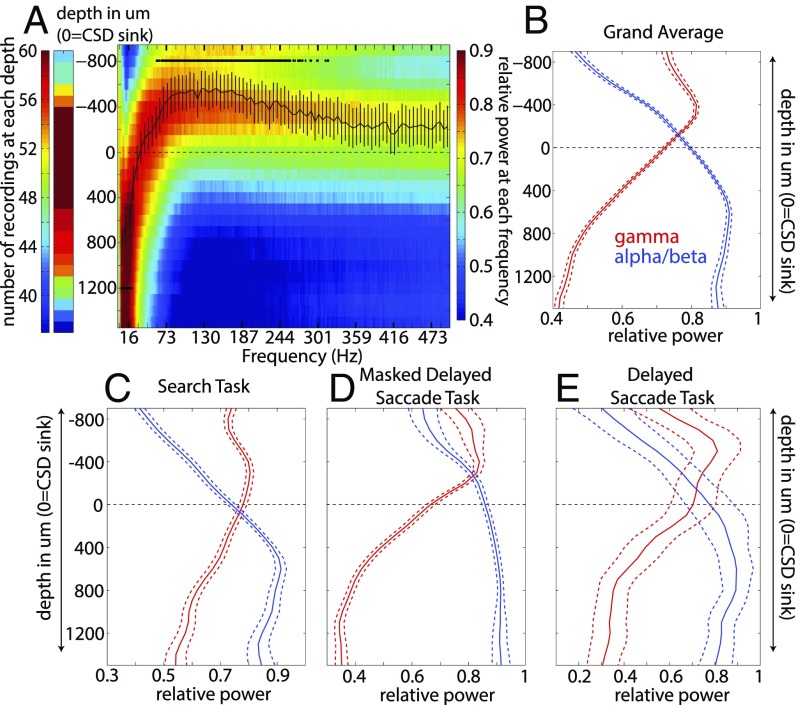
Fig. 2A shows the mean power profile across the entire dataset. The middle cortical layer is at depth 0 (where the early sink was detected), negative depths are superficial layers (layers 1–3), and positive depths are deep layers (layers 5–6). Red colors indicate the maximal power and blue the minimal. The superimposed black line is the mean depth at which the maximal power occurred for each frequency. We tested whether each frequency consistently peaked away from zero. Lower frequencies (4–22 Hz) had their maximal power at sites significantly deeper than depth zero, while a continuous band of higher frequencies (58–260 Hz) had their maximal power above zero, in superficial layers (sign test across sessions, Bonferroni corrected for multiple comparisons, P < 0.05).
Fig. 2.
(A) Number of LFP recordings performed per depth (Left) and normalized power averaged across multicontact probes with respect to depth and frequency (Right). Red indicates greater power at a particular depth; blue, less power. The black line represents the average depth at which the power at each frequency peaks. Error bars ± 1 SEM. The black stars indicate frequency bins at which the mean depth was significantly different from zero (Bonferroni- corrected for multiple comparisons). (B) Normalized power averaged across low (4–22 Hz, blue line) and high (50–250 Hz, red line) frequencies. Error bars ± 1 SEM. (C–E) Normalized power profiles across low and high frequencies for each task. Error bars ± 1 SEM.
We collapsed Fig. 2A into two separate profiles by averaging across the alpha/beta (4–22 Hz) and gamma (58–260 Hz) frequency bands (Fig. 2B). The peak gamma power (red line) occurred in superficial layers, 400 μm above the sink, and the peak alpha/beta power (blue line) occurred in deep layers, 600 μm below the sink. The cross-over point between the profiles (the intersection of the blue and red lines) occurred between −100 and −200 um, nearly identical to the location of the CSD sink. Thus, gamma power was prominent in superficial layers, and alpha/beta in deep. In middle layers (from 200 μm above to 300 μm below the sink), there was a transition zone in which neither gamma nor alpha/beta predominated. These results were present in each of the three tasks (Fig. 2 C–E) and in all of the individual areas that we sampled (SI Appendix, Fig. S2), with the exception of the alpha/beta profile for one area (8B), which was qualitatively similar. This pattern was also observed when we defined the middle layer based on CSD analysis time locked either to a monitor screen flash or to sample onset during the WM task (SI Appendix, Fig. S1).
Delay Period Activity in Superficial Layers.
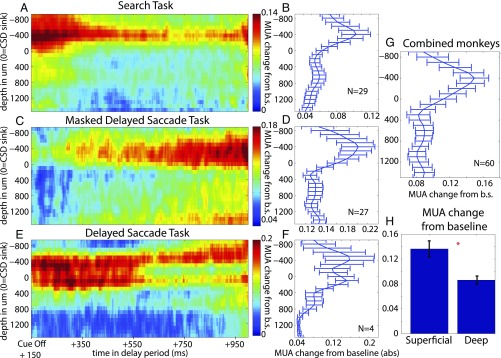
WM has been linked to persistent modulation of delay period spiking activity, but whether this activity is layer-specific is unclear. We found that delay period spiking was largely localized to superficial layers. To measure multiunit activity (MUA), we used rectified, high-pass signals >500 Hz. To assess delay period modulation, we took the absolute value of the mean change in MUA between the delay and the baseline (the presample fixation window), and z-scored it by the SD of delay period MUA across trials (SI Appendix, Experimental Procedures). This normalization step ensured that differences in the overall strength of MUA across sessions were deemphasized before pooling. We used the absolute values because activity in delays could increase or decrease relative to baseline (12).
Fig. 3 A, C, and E shows the time-resolved delay period MUA modulation averaged across sessions for each task. In the figure, red indicates a change in MUA from the presample fixation baseline, and blue indicates little or no change. In all tasks, the greatest change in MUA was in superficial layers. Fig. 3 B, D, and F illustrates the time-averaged delay period modulation. It shows that the greatest modulations were in superficial layers. Averaging across all tasks, delay MUA peaked at 400 μm above the sink and dropped in deeper cortical layers (P < 0.002, sign test across sessions; Fig. 3G). This was the same depth at which gamma power peaked in the LFP (Fig. 2B). Moreover, the laminar profile of the average modulation of delay period MUA was positively correlated (Spearman rank correlation across depth from −900 to 1,500 μm, ρ = 0.84; P = 2E-6) with the laminar profile of gamma power (compare with Fig. 2B) and negatively correlated with alpha/beta power (Spearman rank correlation, ρ = −0.67; P = 3E-4). This correlation was present in each task individually (Spearman rank correlation, visual search; gamma: ρ= 0.79, P < 1E-5; alpha/beta: ρ = −0.57, P = 0.003; masked delayed saccade, gamma: ρ = 0.80, P < 1E-5, alpha/beta: ρ = −0.66, P < 0.001; delayed saccade, gamma: ρ = 0.86, P < 1E-5, alpha/beta: ρ = −0.68, P < 0.001). In addition, the peak delay period MUA was in superficial layers for all six areas (P = 0.03, sign test; SI Appendix, Fig. S3).
Fig. 3.
(A, C, and E) Delay period, MUA modulation across cortical depth and time, plotted from 150 ms after sample offset to 1 s into the delay, for the visual search, masked delayed saccade, and delayed saccade tasks. (B, D, and F) The mean delay period MUA modulation per cortical depth for each task. Error bars ± 1 SEM. (G) The delay period MUA modulation averaged across all tasks per cortical depth. Error bars ± 1 SEM. (H) The mean MUA modulation averaged across all tasks, and all superficial or deep contacts. Error bars ± 1 SEM.
The rectified, high-pass signal that we used to measure MUA (“analog MUA”) is thought to capture the mean of all spiking activity within the local vicinity of the recording contact (13). However, we noted some spectral overlap between this signal and the gamma power in superficial layers, raising the possibility that the greater gamma power was due to the MUA (or vice versa). To address this, we used a thresholded signal to measure the spike rate. This signal was more conservative than the MUA signal, capturing only small groups of units with large spikes near the contact (hereinafter referred to as “units”). Representative spike waveforms and firing rates for a single session are shown in SI Appendix, Fig. S4. We identified a total of 423 units.
Analysis of delay period modulation based on spike rates confirmed that the proportion of units with delay activity was higher in superficial layers compare with deep layers (53% vs. 34%; P = 3E-4, χ2 proportion test; SI Appendix, Fig. S5B, Inset). Spiking during the delay period carried significant information about the sample, as measured by percent explained variance (PEV) (SI Appendix, Experimental Procedures and Fig. S6). In addition, the peak spike PEV value was observed in superficial layers at a depth of −400 um, the same depth at which gamma power peaked. The greater proportion of modulated units in superficial layers was not the result of a poor signal-to-noise ratio or lack of units in deep layers. In fact, baseline firing rates were higher in the deep layers (SI Appendix, Fig. S5C), as were unit yields (SI Appendix, Fig. S5D). A similar delay period profile was seen when we aligned depth based on the transition between cerebrospinal fluid and the gray matter (SI Appendix, Fig. S7). Finally, MUA in superficial layers did not dominate all task periods. During sample processing, MUA activity was more prominent in middle layers (in granular areas), and during saccade generation, both deep and superficial layers became active (SI Appendix, Fig. S8).
Gamma Bursts in Superficial Layers Encode Stimulus Information During the Delay.
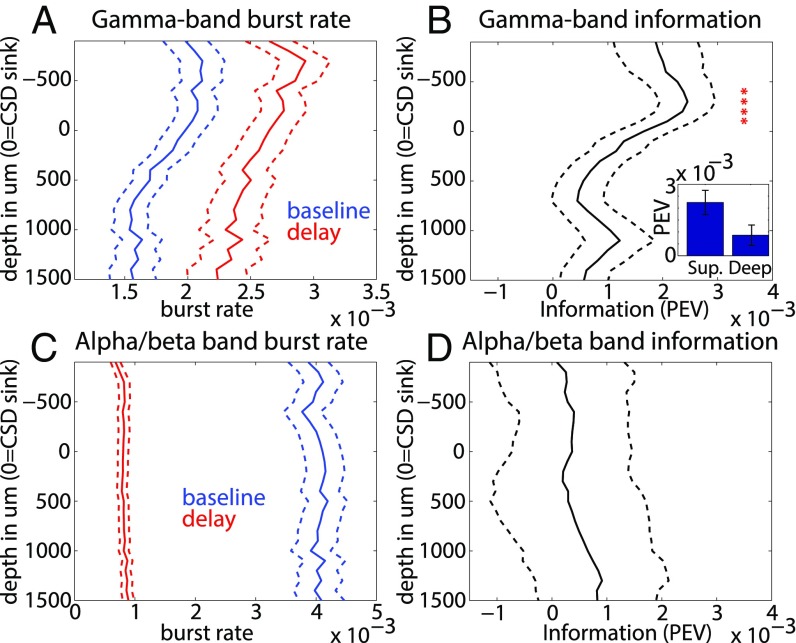
Recent work has shown that oscillatory gamma bursting in the prefrontal cortex (PFC) is associated with encoding of stimuli in WM (14). We tested for its layer-specificity. To distinguish this from the power analyses described above, we defined bursts as periods in which the power in the alpha/beta (4–22 Hz) and gamma (50–150 Hz) bands exceeded the mean power at each frequency band by 2 SD for three oscillation cycles (SI Appendix, Experimental Procedures). The gamma and alpha/beta burst rates during the delay and presample fixation baseline periods are shown in Fig. 4 A and C. The average gamma burst rate increased during the delay relative to the baseline (P = 0.004, sign test; Fig. 4A), and the alpha/beta burst rate decreased (P < 1E-8, sign test; Fig. 4C).
Fig. 4.
(A) Gamma burst rates at baseline (blue) and during the delay (red). (B) Percentage of explained variance (omega-squared) of the gamma bursts across different cortical depths. Red asterisks indicate depths at which there is significantly nonzero PEV across sessions (P < 0.05, Bonferroni-corrected). (Inset) Mean PEV across all superficial and deep contacts, respectively. Error bars ± 1 SEM. (C) Same as A, but for alpha/beta. (D) PEV of alpha/beta bursts across different cortical depths. Error bars ± 1 SEM.
We tested whether delay period gamma and alpha/beta bursts carried information about which cue was held in WM by calculating the PEV between the burst rate and cued object/location during the delay (SI Appendix, Experimental Procedures). Fig. 4B shows the profile of information in gamma bursts by layer, and Fig. 4D for alpha/beta bursts. Over sessions, gamma bursting was more informative in superficial layers than in deep layers (P = 0.004, sign test over sessions; Fig. 4B, Inset). Furthermore, the amount of gamma bursting information per layer was strongly correlated with gamma power (Spearman’s rank correlation, ρ = 0.82; P < 3E-6). Information from alpha/beta bursting was weaker, as might be expected given the very low burst rate during the delay. Information in alpha/beta bursting was not significantly different between deep and superficial layers, but trended toward an increase in deep layers (Fig. 4D). The amount of information in alpha/beta bursting correlated with the laminar alpha/beta power profile (ρ = 0.51; P < 0.02).
Alpha/Beta Oscillations in Deep Layers Modulate Superficial Layers, and Coupling Is Reduced During the Delay.
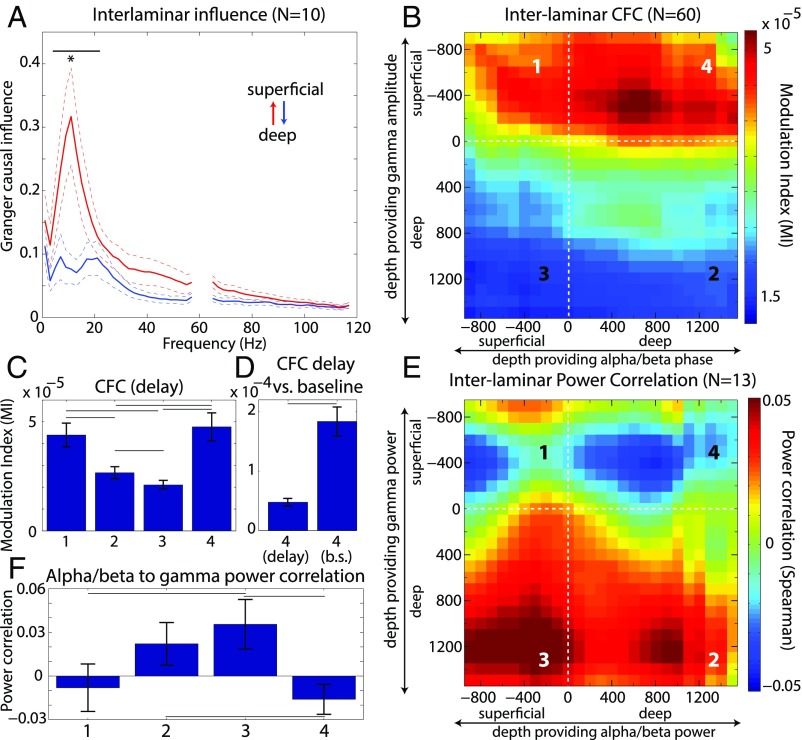
We next tested for interactions between oscillatory activity and layers. To assess frequency-resolved directed interactions, we applied nonparametric Granger causality (GC; a measure of statistical prediction between time series; SI Appendix, Experimental Procedures) analysis to LFPs within superficial and deep layers. We found that the GC spectrum had peaks in the alpha/beta range, and that directed interactions were asymmetric. Deep layer alpha/beta drove superficial layer alpha/beta more than the other way around (4–22 Hz, P = 0.002, sign test; Fig. 5A).
Fig. 5.
(A) The Granger causal (GC) influence across frequency during the delay period. The red line is the GC of deep to superficial layers, and the blue is the reverse. Only sessions in which two laminar probes were placed within 2–4 mm of one another were used (see SI Appendix, Experimental Procedures). (B) Cross Frequency Coupling (CFC) between the phase of alpha/beta oscillations and the amplitude of gamma oscillations. Plotted across both axes is the CFC between specific cortical depths. (C) The mean CFC across all four possible laminar combinations during the delay-period: superficial phase to superficial amplitude (Left, 1), deep phase to deep amplitude (Middle-Left, 2), superficial phase to deep amplitude (Middle-Right, 3), and deep phase to superficial amplitude (Right, 4). (D) CFC between deep phase to superficial amplitude during the delay (Left) and the baseline (Right). (E) Correlation map between the power of alpha/beta and gamma over the delay period. Only recordings with a fixed delay period were used (four recordings from the delayed saccade task, nine from the search task). (F) Average power correlation between alpha/beta and gamma for all four possible laminar combinations. Same numbering scheme for laminar combinations as in C. Error bars ± 1 SEM. Lines indicate significantly different comparisons at P < 0.05.
GC is a linear measurement of interlaminar interactions, in the sense that interactions are only tested between different channels at the same frequency. To test for cross-frequency (nonlinear) interactions, we next investigated cross-frequency coupling (CFC) between superficial and deep layers. To test whether the phase of the slower frequency band (alpha/beta band) coupled with the amplitude of the higher-frequency band (gamma band), we used the modulation index (15), a measure of how nonuniformly distributed the amplitudes of one frequency band are across the phase space of another (SI Appendix, Experimental Procedures). We systematically calculated CFC at every possible combination of (alpha/beta) phase-providing channel and (gamma) amplitude-providing channel.
We found that the influence of the deep alpha/beta phase coupled with superficial gamma amplitude was stronger in the ascending (deep to superficial) direction than in the reverse direction (P < 1E-4, sign test over sessions; Fig. 5 B and C). This laminar profile of deep layer alpha/beta phasic modulation of gamma power in superficial layers was largely preserved across all six cortical areas (SI Appendix, Fig. S9). The GC and CFC results were basically consistent, with both indicating an ascending (deep to superficial) direction of influence or modulation.
To test whether deep to superficial coupling was task-modulated, we tested whether CFC and GC changed during presample fixation baseline vs. delay. CFC was significantly reduced during delay relative to baseline (P < 0.0005, sign test over sessions; Fig. 5D and SI Appendix, Fig. S10). In contrast, we found no significant differences in GC influence in the delay vs. baseline contrast (P > 0.2).
To test whether the interlaminar coupling between gamma and alpha/beta was excitatory or inhibitory, we performed power-power correlation analysis between all possible combinations of layers (SI Appendix, Experimental Procedures). Deep layer alpha/beta power was negatively correlated with superficial gamma power, consistent with an inhibitory influence (Fig. 5E). Power-power correlation in this compartment was significantly more negative than deep gamma power correlations with both deep and superficial alpha/beta power (P < 0.05, sign test over sessions; Fig. 5F). This suggests that deep layer alpha/beta regulates superficial alpha/beta (via ascending GC influence), which in turn regulates superficial layer gamma (via both CFC and negative power correlation).
Discussion
Evidence for Recurring Dynamics.
Superficial and deep layers of frontal cortex exhibited distinct dynamics. Gamma power peaked in superficial layers, while alpha/beta power peaked in deep layers. The phase of these deep-layer alpha/beta oscillations modulated the amplitude of superficial gamma. Delay-period activity peaked in superficial layers. These dynamics were consistent across six distinct cortical areas (SI Appendix, Figs. S2, S3, and S9) spanning from premotor cortex to prefrontal cortex in our dataset, and match closely with reported results from visual cortex (4–9). The consistency and the specificity of these physiological effects suggest an underlying pattern of recurring neuronal dynamics shared between visual and frontal cortices (16, 17). Along with these consistencies, we also observed some qualitative deviations from these patterns, possibly as a result of comparing different tasks. Moreover, although many aspects of the dynamics were shared, this does not imply that each laminar circuit is identical. Therefore, further studies are needed to determine to what extent and in what areas these laminar dynamics are shared, and the functional consequence of this.
Delay Activity in Superficial Layers.
Delay period spiking and gamma bursting encoding the contents of WM were most prominent in superficial layers. The co-occurrence of these two phenomena is consistent with reports that gamma bursts are associated with spiking that encodes a stimulus in WM (14). The relationship between layer 2/3 gamma and WM was also predicted by a WM model (18), which itself was based on known superficial layer connectivity and sparse activity patterns (1, 19, 20). The broadband nature of the average power spectrum in the gamma range (which lacked a clear peak) does not necessarily imply the lack of an oscillatory phenomenon, which could manifest as bursts of varying frequency within individual trials (14). Indeed, we found gamma bursts that increased in the delay and carried stimulus-related information, especially in superficial layers. The lower baseline firing rates in superficial layers, together with higher delay period information in gamma bursting argues against contamination of gamma by spiking activity, and in favor of a more sparse and selective neural code in these layers.
During the WM delay, both alpha/beta bursts and coupling between deep layer alpha/beta and superficial layer oscillations decreased relative to baseline. Alpha/beta oscillations are purported to be an inhibitory rhythm responsible for suppressing behaviorally dominant rules and disregarding distracting stimuli (21–24). Low frequencies in the theta and alpha range modulate high-frequency gamma activity (9, 25–27). We hypothesize that low-frequency coupling between deep and superficial layers may serve a control function, by suppressing access to superficial layers via rhythmic alpha/beta inhibition. The putative control function of deep to superficial layers that we have hypothesized here will be explicitly tested by manipulating WM control in a future study.
WM activity, according to this logic, may be a consequence of deep layer low-frequency modulation of superficial gamma. A decrease in coupling might release inhibition from deep to superficial layers, and allow layer 2/3 spiking and gamma bursting to maintain cue information. There, this information could be stored through recurrent lateral connections that result, on average, in sustained neuronal activity but within a single trial as short-lived bursts of gamma and spiking that reactivate the WM trace (14). This is consistent with PFC anatomy that shows strong and input specific recurrent connectivity within supragranular, but not infragranular, layers (1, 28).
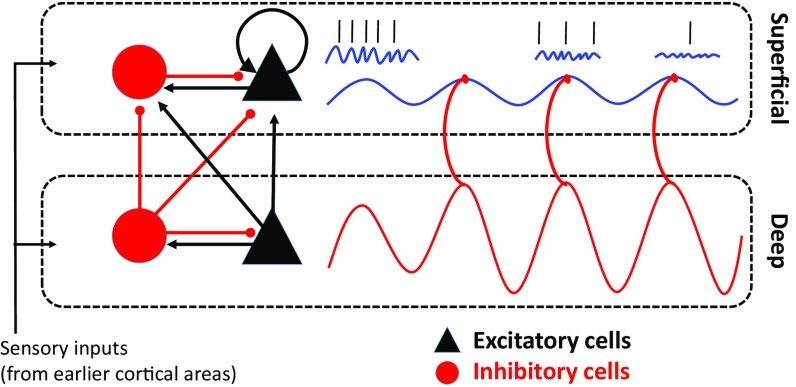
In Fig. 6, we summarize this model. We note that both superficial and deep layers are comprised of networks of deeply interconnected excitatory pyramidal (black) neurons and inhibitory (red) interneurons. Circuits in both layers are capable of oscillating within the alpha/beta range (the red sine wave below, the blue line above) but the drive is directional. Deep layers (as seen in the red arrows) drive superficial layers to resonate within the alpha/beta frequency. These alpha/beta oscillations are coupled with superficial layer gamma oscillations. Strong deep to superficial layer coupling and/or deep-layer alpha/beta suppresses gamma-related activity. These dynamics have been previously observed in visual cortex and studied in computational modeling work (29). With a few modifications, this circuit could also implement WM. During the memory delay, we propose that this default suppression of gamma band activity is released, and as a result, the recurrent excitation of layer 2/3 neurons (as indicated by the loop arrow) is allowed to persist. This recurrent excitation generates gamma activity as well as the dominance of a particular ensemble (i.e., one encoding the cue information; ref. 18). We also note that middle and deep layers of PFC are reciprocally connected with the mediodorsal nucleus of the thalamus, with layer 4 receiving thalamic input and layer 5/6 sending output to the thalamus (30). Delay period spiking activity is prominent in MD thalamus (31), and beta band coherence has been reported between PFC and thalamus during WM maintenance (32). Thus, the modulatory role of alpha/beta activity in the deep layers for WM control might be in part regulated by the thalamocortical loop.
Fig. 6.
A model of WM. Denoted by two rectangular, dashed boxes, two cortical compartments, superficial and deep, are made up of densely interconnected pyramidal (black) and inhibitory (red) neurons. Inhibitory connections are line segments with a red, rounded end, and excitatory connections are line segments with a black, arrow end. The looping arrow returning on itself represents the recurrent connectivity found within layer 3 pyramidal cell networks in prefrontal cortex. The sinusoidal red-line in deep layers reflects the predominance of alpha/beta oscillations deep and their driving influence on superficial alpha/beta oscillations (the sinusoidal blue line). Alpha/beta oscillations are coupled with gamma oscillations (blue squiggly lines), and these gamma oscillations organize informative spiking (straight black marks). Over time, moving from left to right in the figure, the deep alpha/beta suppresses both superficial gamma and spiking, which would “clear out” the contents of WM.
Previously, we linked gamma-band dynamics with feedforward mechanisms (21, 33). In that earlier work, gamma was found to signal sensory stimuli from lower to higher visual cortex (6, 33, 34) and to drive stimulus-driven attention (21). Here we find that gamma dynamics are associated with WM maintenance. It has been hypothesized that each cortical area expands on the processing of the previous area with largely conserved laminar circuitry (17) and dynamics (16). In the visual system, the function of superficial layer cells, with gamma band dynamics, is thought to involve feedforward information transmission (35). In PFC cortex, we find preservation of this feature of the laminar circuit (superficial layer gamma-dominated dynamics). At the highest levels of the cortical hierarchy (e.g., PFC), the function of feedforward connections is undefined (36). We suggest that in the absence of further levels to the hierarchy, these superficial layers take on a new role, namely WM.
Experimental Procedures
We performed multilaminar recordings using linear array U and V probes (Plexon). We recorded spiking and LFP activity in frontal and prefrontal cortices of three macaque monkeys (Macaca mulatta) while the animals performed tasks requiring either spatial or object-based information to be held in WM. We performed CSD analysis of the LFPs in response to visual stimulation. The earliest reliable current sink was used as the zero point to align sessions. All surgical and animal care procedures were approved by the Massachusetts Institute of Technology’s (MIT) Committee on Animal Care and were conducted in accordance with the guidelines of the National Institute of Health and MIT’s Department of Comparative Medicine. A detailed descriptions of the study methodology is provided in SI Appendix, Experimental Procedures.
Supplementary Material
Acknowledgments
We thank Scott Brincat, Morteza Moazami, and Jefferson Roy for assistance during the surgeries and behavioral training; Nancy Kopell and the Cognitive Rhythms Collaborative for fruitful discussions regarding our statistical analyses; and the MIT veterinary staff and animal caretakers for their excellent support. This work was supported by National Institutes of Mental Health Grant R37MH087027, Office of Naval Research Multidisciplinary University Research Initiatives Grant N00014-16-1-2832, and the MIT Picower Institute Innovation Fund.
Footnotes
The authors declare no conflict of interest.
This article is a PNAS Direct Submission.
This article contains supporting information online at www.pnas.org/lookup/suppl/doi:10.1073/pnas.1710323115/-/DCSupplemental.
References
- 1.Goldman-Rakic PS. Regional and cellular fractionation of working memory. Proc Natl Acad Sci USA. 1996;93:13473–13480. doi: 10.1073/pnas.93.24.13473. [DOI] [PMC free article] [PubMed] [Google Scholar]
- 2.Sawaguchi T, Matsumura M, Kubota K. Catecholaminergic effects on neuronal activity related to a delayed response task in monkey prefrontal cortex. J Neurophysiol. 1990;63:1385–1400. doi: 10.1152/jn.1990.63.6.1385. [DOI] [PubMed] [Google Scholar]
- 3.Markowitz DA, Curtis CE, Pesaran B. Multiple component networks support working memory in prefrontal cortex. Proc Natl Acad Sci USA. 2015;112:11084–11089. doi: 10.1073/pnas.1504172112. [DOI] [PMC free article] [PubMed] [Google Scholar]
- 4.Bollimunta A, Mo J, Schroeder CE, Ding M. Neuronal mechanisms and attentional modulation of corticothalamic α oscillations. J Neurosci. 2011;31:4935–4943. doi: 10.1523/JNEUROSCI.5580-10.2011. [DOI] [PMC free article] [PubMed] [Google Scholar]
- 5.Buffalo EA, Fries P, Landman R, Buschman TJ, Desimone R. Laminar differences in gamma and alpha coherence in the ventral stream. Proc Natl Acad Sci USA. 2011;108:11262–11267. doi: 10.1073/pnas.1011284108. [DOI] [PMC free article] [PubMed] [Google Scholar]
- 6.van Kerkoerle T, et al. Alpha and gamma oscillations characterize feedback and feedforward processing in monkey visual cortex. Proc Natl Acad Sci USA. 2014;111:14332–14341. doi: 10.1073/pnas.1402773111. [DOI] [PMC free article] [PubMed] [Google Scholar]
- 7.Maier A, Adams GK, Aura C, Leopold DA. Distinct superficial and deep laminar domains of activity in the visual cortex during rest and stimulation. Front Syst Neurosci. 2010;4:31. doi: 10.3389/fnsys.2010.00031. [DOI] [PMC free article] [PubMed] [Google Scholar]
- 8.Smith MA, Jia X, Zandvakili A, Kohn A. Laminar dependence of neuronal correlations in visual cortex. J Neurophysiol. 2013;109:940–947. doi: 10.1152/jn.00846.2012. [DOI] [PMC free article] [PubMed] [Google Scholar]
- 9.Spaak E, Bonnefond M, Maier A, Leopold DA, Jensen O. Layer-specific entrainment of γ-band neural activity by the α rhythm in monkey visual cortex. Curr Biol. 2012;22:2313–2318. doi: 10.1016/j.cub.2012.10.020. [DOI] [PMC free article] [PubMed] [Google Scholar]
- 10.Godlove DC, Maier A, Woodman GF, Schall JD. Microcircuitry of agranular frontal cortex: Testing the generality of the canonical cortical microcircuit. J Neurosci. 2014;34:5355–5369. doi: 10.1523/JNEUROSCI.5127-13.2014. [DOI] [PMC free article] [PubMed] [Google Scholar]
- 11.Ninomiya T, Dougherty K, Godlove DC, Schall JD, Maier A. Microcircuitry of agranular frontal cortex: Contrasting laminar connectivity between occipital and frontal areas. J Neurophysiol. 2015;113:3242–3255. doi: 10.1152/jn.00624.2014. [DOI] [PMC free article] [PubMed] [Google Scholar]
- 12.Miller EK, Erickson CA, Desimone R. Neural mechanisms of visual working memory in prefrontal cortex of the macaque. J Neurosci. 1996;16:5154–5167. doi: 10.1523/JNEUROSCI.16-16-05154.1996. [DOI] [PMC free article] [PubMed] [Google Scholar]
- 13.Siegel M, Buschman TJ, Miller EK. Cortical information flow during flexible sensorimotor decisions. Science. 2015;348:1352–1355. doi: 10.1126/science.aab0551. [DOI] [PMC free article] [PubMed] [Google Scholar]
- 14.Lundqvist M, et al. Gamma and beta bursts underlie working memory. Neuron. 2016;90:152–164. doi: 10.1016/j.neuron.2016.02.028. [DOI] [PMC free article] [PubMed] [Google Scholar]
- 15.Tort ABL, Komorowski R, Eichenbaum H, Kopell N. Measuring phase-amplitude coupling between neuronal oscillations of different frequencies. J Neurophysiol. 2010;104:1195–1210. doi: 10.1152/jn.00106.2010. [DOI] [PMC free article] [PubMed] [Google Scholar]
- 16.Bastos AM, et al. Canonical microcircuits for predictive coding. Neuron. 2012;76:695–711. doi: 10.1016/j.neuron.2012.10.038. [DOI] [PMC free article] [PubMed] [Google Scholar]
- 17.Douglas RJ, Martin KA. A functional microcircuit for cat visual cortex. J Physiol. 1991;440:735–769. doi: 10.1113/jphysiol.1991.sp018733. [DOI] [PMC free article] [PubMed] [Google Scholar]
- 18.Lundqvist M, Herman P, Lansner A. Theta and gamma power increases and alpha/beta power decreases with memory load in an attractor network model. J Cogn Neurosci. 2011;23:3008–3020. doi: 10.1162/jocn_a_00029. [DOI] [PubMed] [Google Scholar]
- 19.Sakata S, Harris KD. Laminar structure of spontaneous and sensory-evoked population activity in auditory cortex. Neuron. 2009;64:404–418. doi: 10.1016/j.neuron.2009.09.020. [DOI] [PMC free article] [PubMed] [Google Scholar]
- 20.Kampa BM, Letzkus JJ, Stuart GJ. Cortical feed-forward networks for binding different streams of sensory information. Nat Neurosci. 2006;9:1472–1473. doi: 10.1038/nn1798. [DOI] [PubMed] [Google Scholar]
- 21.Buschman TJ, Miller EK. Top-down versus bottom-up control of attention in the prefrontal and posterior parietal cortices. Science. 2007;315:1860–1862. doi: 10.1126/science.1138071. [DOI] [PubMed] [Google Scholar]
- 22.Buschman TJ, Denovellis EL, Diogo C, Bullock D, Miller EK. Synchronous oscillatory neural ensembles for rules in the prefrontal cortex. Neuron. 2012;76:838–846. doi: 10.1016/j.neuron.2012.09.029. [DOI] [PMC free article] [PubMed] [Google Scholar]
- 23.Jensen O, Mazaheri A. Shaping functional architecture by oscillatory alpha activity: Gating by inhibition. Front Hum Neurosci. 2010;4:186. doi: 10.3389/fnhum.2010.00186. [DOI] [PMC free article] [PubMed] [Google Scholar]
- 24.Haegens S, Nácher V, Luna R, Romo R, Jensen O. α-Oscillations in the monkey sensorimotor network influence discrimination performance by rhythmical inhibition of neuronal spiking. Proc Natl Acad Sci USA. 2011;108:19377–19382. doi: 10.1073/pnas.1117190108. [DOI] [PMC free article] [PubMed] [Google Scholar]
- 25.Canolty RT, et al. High gamma power is phase-locked to theta oscillations in human neocortex. Science. 2006;313:1626–1628. doi: 10.1126/science.1128115. [DOI] [PMC free article] [PubMed] [Google Scholar]
- 26.Lakatos P, et al. An oscillatory hierarchy controlling neuronal excitability and stimulus processing in the auditory cortex. J Neurophysiol. 2005;94:1904–1911. doi: 10.1152/jn.00263.2005. [DOI] [PubMed] [Google Scholar]
- 27.Colgin LL, et al. Frequency of gamma oscillations routes flow of information in the hippocampus. Nature. 2009;462:353–357. doi: 10.1038/nature08573. [DOI] [PubMed] [Google Scholar]
- 28.Luebke JI. Pyramidal neurons are not generalizable building blocks of cortical networks. Front Neuroanat. 2017;11:11. doi: 10.3389/fnana.2017.00011. [DOI] [PMC free article] [PubMed] [Google Scholar]
- 29.Mejias JF, Murray JD, Kennedy H, Wang X-J. Feedforward and feedback frequency-dependent interactions in a large-scale laminar network of the primate cortex. Sci Adv. 2016;2:e1601335. doi: 10.1126/sciadv.1601335. [DOI] [PMC free article] [PubMed] [Google Scholar]
- 30.Giguere M, Goldman-Rakic PS. Mediodorsal nucleus: Areal, laminar, and tangential distribution of afferents and efferents in the frontal lobe of rhesus monkeys. J Comp Neurol. 1988;277:195–213. doi: 10.1002/cne.902770204. [DOI] [PubMed] [Google Scholar]
- 31.Watanabe Y, Funahashi S. Neuronal activity throughout the primate mediodorsal nucleus of the thalamus during oculomotor delayed-responses, I: Cue-, delay-, and response-period activity. J Neurophysiol. 2004;92:1738–1755. doi: 10.1152/jn.00994.2003. [DOI] [PubMed] [Google Scholar]
- 32.Parnaudeau S, et al. Inhibition of mediodorsal thalamus disrupts thalamofrontal connectivity and cognition. Neuron. 2013;77:1151–1162. doi: 10.1016/j.neuron.2013.01.038. [DOI] [PMC free article] [PubMed] [Google Scholar]
- 33.Bastos AM, et al. Visual areas exert feedforward and feedback influences through distinct frequency channels. Neuron. 2015;85:390–401. doi: 10.1016/j.neuron.2014.12.018. [DOI] [PubMed] [Google Scholar]
- 34.Michalareas G, et al. Alpha-beta and gamma rhythms subserve feedback and feedforward influences among human visual cortical areas. Neuron. 2016;89:384–397. doi: 10.1016/j.neuron.2015.12.018. [DOI] [PMC free article] [PubMed] [Google Scholar]
- 35.Roberts MJ, et al. Robust gamma coherence between macaque V1 and V2 by dynamic frequency matching. Neuron. 2013;78:523–536. doi: 10.1016/j.neuron.2013.03.003. [DOI] [PubMed] [Google Scholar]
- 36.Markov NT, et al. The anatomy of hierarchy: Feedforward and feedback pathways in macaque visual cortex. J Comp Neurol. 2013;522:225–259. doi: 10.1002/cne.23458. [DOI] [PMC free article] [PubMed] [Google Scholar]
Associated Data
This section collects any data citations, data availability statements, or supplementary materials included in this article.


