

Summary
In the mammalian brain, auditory information is known to be processed along a central ascending pathway leading to auditory cortex (AC). Whether there exist any major pathways beyond this canonical auditory neuraxis remains unclear. In awake mice, we found that auditory responses in entorhinal cortex (EC) cannot be explained by a previously proposed relay from AC based on response properties. By combining anatomical tracing and optogenetic/pharmacological manipulations, we discovered that EC received auditory input primarily from the medial septum (MS), rather than AC. A previously uncharacterized auditory pathway was then revealed: it branched from the cochlear nucleus, and via caudal pontine reticular nucleus, pontine central gray and MS, reached EC. Neurons along this non-canonical auditory pathway responded selectively to high-intensity broadband noise, but not pure tones. Disruption of the pathway resulted in an impairment of specifically noise-cued fear conditioning. This reticular-limbic pathway may thus function in processing aversive acoustic signals.
Keywords: lemniscal and nonlemniscal auditory pathway, entorhinal cortex, septum complex, limbic system, reticular formation, basal forebrain, auditory fear conditioning
eTOC Blurb
Zhang et al. revealed a previously unrecognized central auditory pathway, which is involved in processing aversive acoustic signals and contributes to auditory fear conditioning. It opens a window to reconsider the overall strategy for auditory information processing in the brain.
Introduction
The central auditory system in mammalian brains is a complex system consisting of a number of different nuclei. It starts from the cochlear nucleus (CN), runs through the superior olivary complex (SOC), nucleus of lateral lemniscus (NLL), inferior colliculus (IC), medial geniculate body (MGB) of thalamus, and ends in the auditory cortex (AC) (Syka et al., 1988; Webster et al., 1992; Winer et al., 2011). Auditory information is hierarchically relayed along this neuraxis, with distinct auditory features gradually extracted by its component nuclei (Chechik et al., 2006; Escabi and Read, 2003; Webster et al., 1992; Yao et al., 2015; Zhang et al., 2011). There are two parallel ascending pathways along this canonical auditory neuraxis: the lemniscal (primary) and nonlemniscal (secondary) pathways(Hu et al., 1994; Jones, 2003). The primary pathway carries auditory specific input and peripheral tonotopic maps, while the secondary pathway may be part of an integrative system involved in polysensory integration, temporal pattern recognition, and certain forms of learning (Winer, 1992). Auditory responses in other brain regions are in general attributed to relays from this neuraxis. For example, MGB and AC can provide auditory input to the basolateral amygdala (LeDoux et al., 1985, 1990). Potential major central pathways beyond the canonical auditory neuraxis, however, remain poorly studied.
Besides sensory cortices, the entorhinal cortex (EC) is one of the upper-end structures receiving sensory information. As the main interface between the neocortex and hippocampus, EC functions as a hub in a widespread network for memory and navigation(Buzsaki and Moser, 2013). It is thought that multi-modal information from various brain areas, including both spatial and non-spatial, is primarily conveyed by EC into the hippocampus (Ahmed and Mehta, 2009; Buzsáki and Moser, 2013; Fyhn et al., 2004; Van Strien et al., 2009). Auditory evoked spiking activity has been reported in EC (Aronov et al., 2017; Rummell et al., 2016; Vinogradov, 1975). Auditory stimuli also increase the c-fos staining in EC (Wan et al., 2001). It has been postulated that the auditory input to EC comes from AC or cortical association areas (Moxon et al., 1999), but this idea has rarely been carefully examined in anatomical or functional assays. Since EC also receives potential synaptic projections from a variety of other brain regions that exhibit responses to auditory stimulation, such as the amygdala, septal nuclei and hippocampal formation(Frank et al., 2000; Justus et al., 2017; PITKÄNEN et al., 2006), any of these structures might be able to drive auditory responses in EC.
Identifying the neural pathway for relaying auditory information to EC will be crucial for understanding the processing of sensory cues mediated by this structure. In this study, by combining electrophysiological assays of neuronal response properties, anatomical and functional tracing, as well as optogenetic and pharmacological manipulations, we have elucidated a previously uncharacterized reticular-limbic pathway which diverges from the canonical central auditory pathway at the stage of CN. This identified pathway relays specifically information of high-intensity broadband noise rapidly to EC and thus may be involved in transmitting behaviorally significant aversive auditory signals for emotional and memory functions.
Results
Auditory responses in the entorhinal cortex
To examine auditory responses in EC, we carried out single-cell loose-patch recordings in awake head-fixed mice (see STAR Methods). The animal was free to run on a smoothly rotatable plate (Figure 1A). Auditory stimuli were delivered through a speaker in the contralateral field. As shown by an example EC neuron (Figure 1B), the cell exhibited strong spike responses to white noise at a high intensity of 80 dB sound pressure level (SPL), with an onset latency of 13.2 ms. On the other hand, no clear responses to pure tones were observed, as manifested by the absence of a clear frequency response area (FRA) (Figure 1C) or increased firing rate in the peri-stimulus spike time histogram (PSTH) generated from the responses to test tones (Figure 1D and Figure S1). Noise-evoked spike responses were observed in about 21% (26 out of 126 recorded neurons, from 11 mice) of the total recorded EC neurons. A similar trend was observed in these auditory responsive EC neurons: they responded robustly to loud noise, but not tones (Figure 1E and Figure S1). As shown by the average rate-intensity function (Figure 1F), these neurons started to respond to noise at around 60 dB SPL, indicating a high intensity threshold. Our recordings were made in both the lateral and medial entorhinal cortex (ECl and ECm respectively) (Figure S2A-B). Neurons in ECl and ECm exhibited similar response properties (Figure S2C-E), and they were thus pooled. EC neurons were different from cells in the primary auditory cortex (A1), which exhibited typical V-shaped FRAs and robust tone-evoked responses (Figure 1G–I). A1 neurons also displayed noise-evoked responses, with onset latencies not different from EC responses (Figure 1J). This comparison of EC and A1 response properties, in particular, the response latency, cast doubt on whether AC or its downstream association areas could be a direct input source for the auditory responses observed in EC.
Figure 1. Auditory responses in EC and A1.
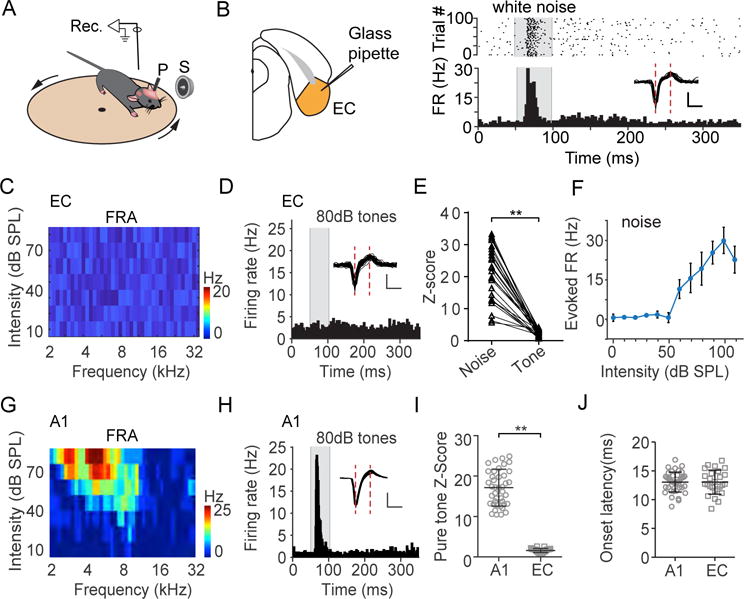
(A) Recording setup. P, post for head-fixation; S, speaker. Arrows indicate rotation of the plate.
(B) Left, diagram showing loose-patch recording in EC. Right, spike responses of an example EC neuron to white noise (80 dB SPL). Upper, raster plot. Lower, peri-stimulus spike time histogram (PSTH). Gray box marks the duration of sound stimulation. Inset, superimposed 50 randomly selected spike waveforms. Scale: 50 pA, 0.5 ms.
(C) Color-coded spike rates in response to tones of different frequencies and intensities (i.e., frequency response area) for the same cell.
(D) PSTH generated from spike responses to all test tones at 80 dB SPL for the same cell. Inset, superimposed spike waveforms. Scale: 50 pA, 0.5 ms.
(E) Comparison of Z-scores for noise responses (at 80 dB SPL) and tone responses (maximum response within the binned FRA with a 0.5-octave bin size). Data points for the same cell are connected with a line. **P < 0.01, paired t-test, n = 26 from 5 animals.
(F) Spike rates evoked by noise at different intensity levels (i.e., rate-intensity function) averaged for all the responsive cells (n = 26). Bar = SD.
(G) Frequency response area of an example A1 neuron.
(H) PSTH generated from spike responses to all test tones at 80 dB SPL for the same A1 neuron.
(I) Comparison of maximum Z-scores of pure-tone responses between EC and A1 (n = 41 from 8 animals) neurons. **P < 0.01, unpaired two-tailed t-test (equal variances not assumed). Bar = mean ± SD.
(J) Comparison of onset latencies of maximally evoked noise responses between EC and A1 neurons. P = 0.959, unpaired two-tailed t-test. Bar = mean ± SD.
MS provides major auditory input to EC
To address the above question, we injected rabies virus encoding GFP into ECl (Figure 2A1). Dense retrogradely labeled cells were observed locally in the EC (Figure 2A1). However, only very sparse neurons were labeled in AC, temporal association area (TEA) and ectorhinal cortex (Figure S3A), and no labeled neurons were found in the auditory thalamus, MGB (Figure S3A). These observations argue against streaming of auditory information mainly from the canonical central pathway to EC. On the other hand, retrogradely labeled cells were robustly found in the medial septum (MS) complex in the basal forebrain, including MS and the central sector of the nucleus of the diagonal band of Broca (NDB) (Figure 2A1 right), as well as in the hippocampus, retrosplenial cortex (RSP) and claustrum (CLA) (Figure S3B-C). These results are in general consistent with recent studies on the mesoscopic connectome of the mouse brain (Oh et al., 2014; Zingg et al., 2014; and data from the Allen Brain Atlas, Experiment 530000865, http://connectivity.brain-map.org/). Rabies viral injections targeted in ECm resulted in similarly dense labeling in the MS complex (Figure 2A2). Previously, auditory responses have been reported in MS (Vinogradov, 1975), raising the possibility that MS could be a direct input source of EC.
Figure 2. MS provides primary auditory input to EC.
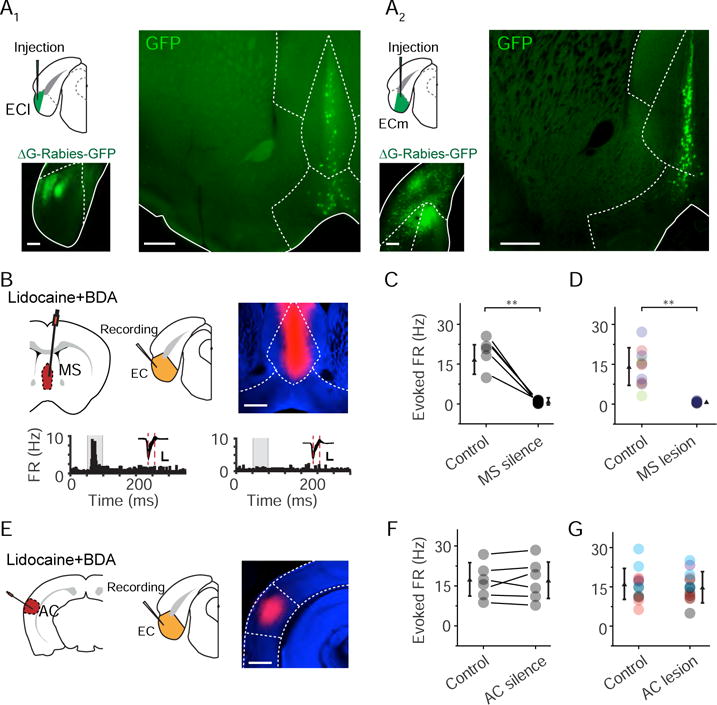
(A) Injection of rabies virus encoding GFP in the ECl (A1) or ECm (A2). Image on the bottom left shows the retrogradely labeled cells around the injection site. Image on the right shows labeled cells in the MS complex. LS, lateral septum; CP, caudoputamen; aco, anterior commissure. Scale bar, 500 μm.
(B) Application of lidocaine and BDA (red) into the MS and recording from EC. Image on the upper right shows representative BDA fluorescence. Scale bar, 500 μm. Lower, PSTH for responses of an example EC neuron to noise (80 dB SPL) before (left) and after (right) lidocaine application into MS. Insets, superimposed spike waveforms. Scale: 50 pA, 0.5 ms.
(C) Multi-unit spike rates in EC evoked by noise in the control condition and after silencing MS with lidocaine. Data points for the same animal are connected with a line. **P < 0.01, paired t-test, n = 5 animals.
(D) Multi-unit spike rates in EC evoked by noise in the control condition and after electrolytic lesion of MS. **P < 0.01, unpaired two-tailed t-test, n = 15 sites from 5 animals. Recording sites in the same animal are marked in the same color.
(E) Application of lidocaine and BDA into the auditory cortex and an example image of BDA fluorescence (right). Scale bar, 800 μm.
(F) Multi-unit spike rates in EC evoked by noise in the control condition and after silencing AC with lidocaine. P = 0.823, paired t-test, n = 6 animals.
(G) Multi-unit spike rates in EC evoked by noise in the control condition and after electrolytic lesion of AC. P = 0.771, unpaired two-tailed t-test, n = 15 sites from 4 animals. Recording sites in the same animal are marked in the same color.
To test whether MS relays auditory information to EC, we perfused lidocaine, a voltage-gated sodium channel blocker, into MS via an implanted cannula (see STAR Methods), while performing extracellular recording in EC (Figure 2B). The drug application site was confirmed by the fluorescence of co-applied biotinylated dextran amine (BDA) (Figure 2B, upper right). We found that noise-evoked spike responses of EC neurons were eliminated (Figure 2B, bottom, and Figure 2C) after silencing the MS with lidocaine (Figure S4A). Responses in A1, in contrast, were not affected by silencing MS (Figure S4B). Similarly, electrolytic lesion of MS (Figure S4D) also blocked auditory responses in EC (Figure 2D and Figure S4D). In contrast, silencing AC with lidocaine (Figure 2E and Figure S4C) or electrolytic lesion of AC (Figure S4E) did not affect auditory responses in EC (Figure 2F–G and Figure S4E). Thus, different from a previous postulation (Moxon et al., 1999), we demonstrate that MS rather than AC primarily drives the auditory responses (at least the early responses) observed in EC.
MS input to EC via glutamatergic projections
MS contains neurons of several cell types, including GABAergic, cholinergic and glutamatergic (Justus et al., 2017; Saunders et al., 2015; Xu et al., 2015). GABAergic MS neurons have been shown to innervate interneurons primarily in EC, and this projection has been thought to mediate a disinhibitory effect in EC(Fuchs et al., 2016; Gonzalez-Sulser et al., 2014; Justus et al., 2017). Glutamatergic neurons have recently been shown to account for about 25% of the MS neuron population (Colom et al., 2005; Robinson et al., 2016). We reasoned that to drive time-locked, sensory-evoked spike rate increases, glutamatergic projections might be more effective than disinhibition mediated by GABAergic projections. To test this possibility, we perfused 6,7-dinitroquinoxaline-2,3-dione (DNQX), a blocker of glutamate receptors, into EC via an implanted cannula, which nearly completely blocked the noise-induced spike rate increases of EC neurons (Figure 3A–B), in addition to decreasing the spontaneous firing rate (Figure 3A). In contrast, perfusion of Gabazine, a GABAergic receptor blocker, did not significantly affect the peak evoked firing rate within a 50-ms window immediately after the noise onset (Figure 3C), although late responses might be altered (Figure S5A). Methyllycaconitine (MLA) and dihydro-β-erythroidine (DHβE), which blocked cholinergic receptors (Arroyo et al., 2012), only slightly reduced the response amplitude (Figure 3D and Figure S5B). These data suggest that the auditory responses in EC are mediated primarily by glutamatergic transmission.
Figure 3. MS provides auditory input to EC via glutamatergic projections.
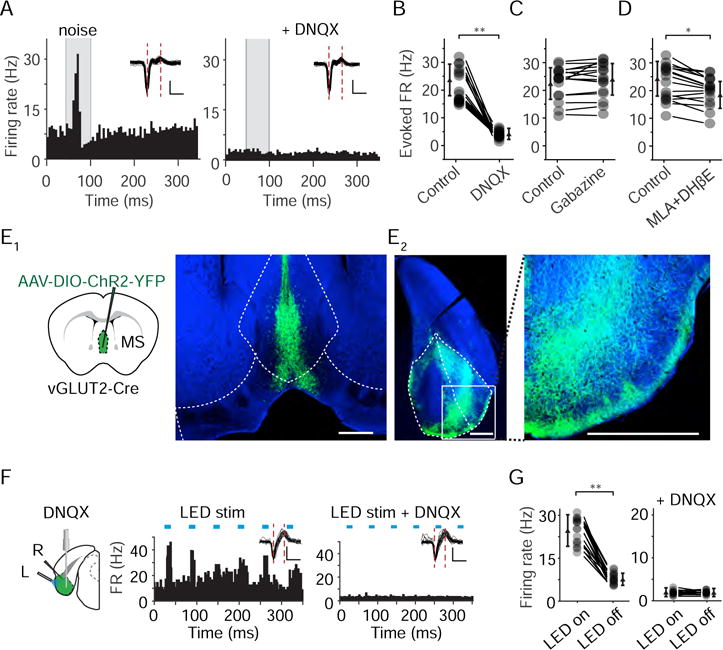
(A) PSTH for spike responses of an example EC neuron to noise (80 dB SPL) in the control condition (left) and after perfusing DNQX into EC (right). Scale: 50 pA, 0.5 ms.
(B) Evoked firing rates of EC neurons in the control condition and after DNQX application. **P < 0.01, paired t-test, n = 18. Smaller symbols represent mean ± SD.
(C) Evoked firing rates of EC neurons in the control condition and after Gabazine application. P = 0.142, paired t-test, n = 17.
(D) Evoked firing rates of EC neurons in the control condition and after MLA and DHβE application. *P < 0.05, paired t-test, n = 17.
(E) Injection of AAV encoding Cre-dependent ChR2-EYFP into the MS of vGLUT2-Cre mice. Images show fluorescence labeling in the MS complex (E1) and fluorescence-labeled axons in EC (E2, coronal section, an enlarged image of the boxed area is shown on the right). Scale bar, 500 μm.
(F) Application of blue LED light to the EC surface and perfusion of DNQX into EC via a cannula (left). L, LED; R, recording. Middle and right, PSTH for an example EC neuron before and after DNQX application. Blue bars indicate LED pulses. Inset, superimposed spike waveforms. Scale: 50 μV, 0.5 ms.
(G) Spike rates in the presence and absence of LED stimulation in the control condition (left, **P < 0.01, paired t-test, n = 18) and after DNQX application (right, P = 0.752, paired t-test, n = 15). Spike rate was measured over the time window that starts from the onset of each LED pulse and ends at 10 ms after the offset of the LED pulse.
We further examined axonal projections of glutamatergic MS neurons, by injecting adeno-associated virus (AAV) encoding Cre-dependent channelrhodopsin2 (ChR2) fused with EYFP in vGLUT2-Cre mice (Figure 3E1). Tracing of fluorescence-labeled axons revealed that glutamatergic MS neurons projected strongly to EC (Figure 3E2). We then activated the ChR2-expressing axons by delivering blue LED light (473 nm) onto the surface of EC and recorded spikes from EC neurons (Figure 3F, left). Pulses of LED light could reliably induce phase-locked increases of firing rate (Figure 3F, middle), indicating that the glutamatergic projections from MS can efficiently drive EC cells. In the same cell, perfusion of DNQX into EC completely blocked the LED-evoked spike responses (Figure 3F, right), confirming that glutamatergic transmission mediated these responses. In a total of 17 recorded EC cells (from 3 animals), we observed spike rate increases in response to LED stimulation, which disappeared immediately after the DNQX application (Figure 3G). Together, these data demonstrate that glutamatergic MS projections primarily drive auditory responses of EC neurons.
MS receives auditory input from PCG
We next examined auditory responses in MS by single-unit recording (Figure 4A). About 62% of recorded neurons exhibited acoustic responses (n = 31 out of 50 recorded cells, from 5 animals). Interestingly, these MS neurons exhibited transient responses to white noise (Figure 4A), but no apparent responses to tones (Figure 4B), very similar to EC neurons. In addition, the noise-evoked responses in MS also showed a relatively high intensity threshold (Figure 4C). To test whether MS neurons could be activated in a natural environment, we applied a thunderstorm sound at different intensities, which was composed of epochs of broadband noise (Figure 4D). MS neurons responded robustly to the thunderstorm sound (Figure 4D), and the responses also showed a relatively high intensity threshold (Figure 4E).
Figure 4. Neurons in MS and its input source PCG exhibited similar response properties as those in EC.
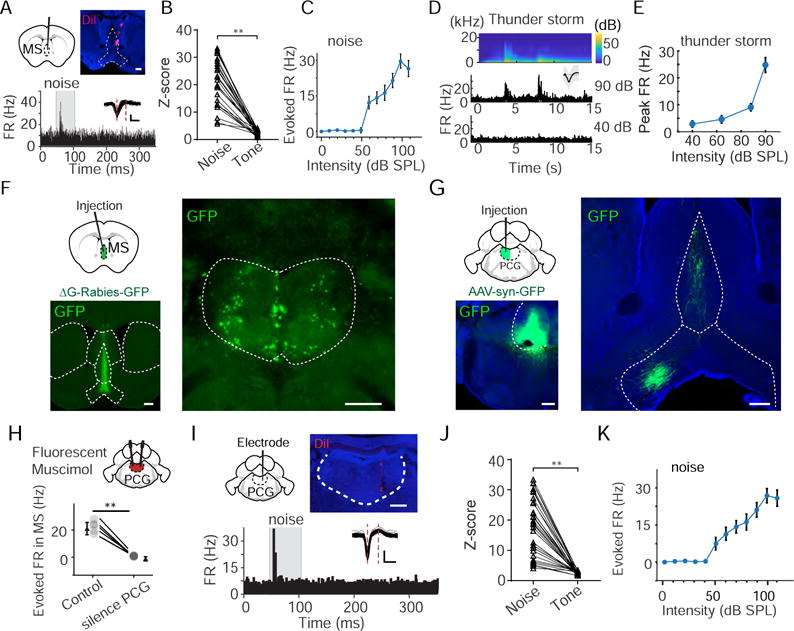
(A) Recording in MS. Image on top shows the track of recording electrode coated with DiI. Scale bar, 500 μm. Bottom, PSTH for spike responses of an example neuron to white noise (80 dB SPL). Inset, superimposed spike waveforms. Scale: 50 μV, 0.5 ms.
(B) Comparison of Z-scores between noise (80 dB SPL) responses and tone responses (maximum within the binned FRA). **P < 0.01, paired t-test, n = 31 from 5 animals.
(C) Average rate-intensity function for the responsive MS neurons (n = 31). Bar = SD.
(D) Upper, the spectrogram of thunderstorm sound. Lower, PSTH for responses of an example MS neuron to thunderstorm sound at two different intensities (90 and 40 dB SPL). Inset, spike waveform.
(E) Average rate-intensity function for MS neurons responding to thunderstorm sound (n = 23).
(F) Injection of ΔG-Rabies-GFP into MS. Images show GFP fluorescence in the MS complex (left) and retrogradely labeled cell bodies in the PCG (right). Scale bar, 500 μm.
(G) Injection of AAV-syn-GFP into PCG. Images show GFP fluorescence in PCG (left) and GFP labeled axons in the MS complex (right). Scale bar, 500 μm.
(H) Bilaterally perfusion of fluorescent muscimol into PCG. Bottom, noise-evoked multi-unit spike rates recorded in MS in the control condition and after silencing PCG with muscimol. **P < 0.01, n = 5 animals, paired t-test.
(I) PSTH for responses of an example PCG neuron to noise (80 dB SPL). Image on top shows the track of electrode. Scale, 500 μm. Inset, spike waveforms. Scale: 50 μV, 0.5 ms.
(J) Comparison of Z-scores between noise and tone (maximally evoked within the FRA) responses. **P < 0.01, paired t-test, n = 30 PCG neurons from 5 animals.
(K) Average rate-intensity function for all the responsive PCG neurons (n = 30 from 5 animals). Bar = SD.
We next traced input sources of MS by injecting ΔG-Rabies-GFP (Figure 4F). One structure in which dense retrogradely labeled cell bodies were observed was the pontine central gray (PCG) (Figure 4F, right), while no cell labeling was found in midbrain nuclei such as the IC and superior colliculus (SC) (data not shown). Anterograde tracing of PCG axons confirmed that they projected to MS (Figure 4G). To test whether PCG provided auditory input to MS, we perfused muscimol into PCG while performing extracellular recording in MS. We found that noise-evoked multi-unit spike responses in the control condition were eliminated by silencing PCG (Figure 4H), confirming that PCG provided auditory input to MS. We further carried out single-unit recording in PCG to characterize its auditory response properties. As shown by an example cell (Figure 4I) and summary of 30 responsive cells (out of 42 recorded cells, from 5 animals) (Figure 4J–K), PCG neurons exhibited response properties similar to MS and EC neurons, i.e. they responded robustly to high-intensity noise but not to tones.
PRN relays auditory information from CN to PCG
We further traced input sources of PCG by injecting AAVretro-Cre into Ai14, a Cre-dependent tdTomato reporter line (Madisen et al., 2010). We found tdTomato-labeled cell bodies in the dorsal part of the caudal pontine reticular nucleus (PRNc) (Figure 5A). Anterograde tracing of PRN axons confirmed their projections to PCG (Figure 5B), but not to MS (Figure S6). Single-unit recordings in the dorsal part of PRNc again demonstrated similar auditory response properties as in PCG, MS and EC (Figure 5C–G), except that the intensity threshold was slightly lower (Figure 5E). Finally, by injecting AAVretro-Cre into PRNc of Ai14 mice (Figure 5H1), we found that the input to PRNc could be traced back to the contralateral CN, including the anteroventral and dorsal cochlear nucleus (AVCN and DCN respectively) (Figure 5H2), consistent with previous reports (Kandler and Herbert, 1991; Lee et al., 1996) as well as the anterograde tracing data of the Allen Brain Atlas (Experiment 286556914, http://connectivity.brain-map.org/). CN is known to receive auditory input directly from the inner ear (Webster et al., 1992). Therefore, PRN can relay auditory information from CN to PCG.
Figure 5. PRN relays auditory information from CN to PCG.
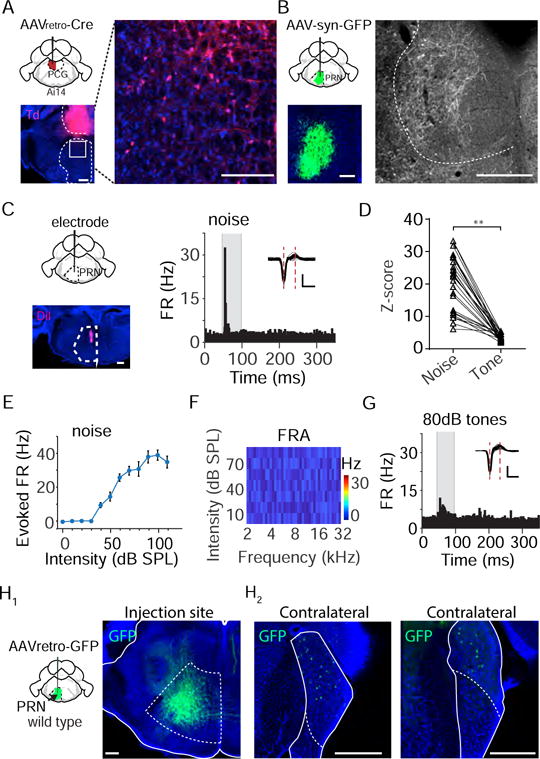
(A) Injection of AAVretro-Cre into PCG of Ai14 mice. Images show strong tdTomato labeling in the PCG (left) and labeled cells in the dorsal part of PRN (right, which is an enlarged image of the boxed area on the left). Scale bar, 500 μm.
(B) Injection of AAV-syn-GFP into PCG. Images show GFP labeling in PRN (left) and labeled axons in PCG (right). Scale bar, 500 μm.
(C) Recording in the PRN region. Image on the left shows the electrode track. Right, PSTH for responses of an example PRN neuron to noise (80 dB SPL). Inset, spike waveforms. Scale: 50 μV, 0.5 ms.
(D) Comparison of Z-scores between noise and tone responses. **P < 0.01, paired t-test, n = 23 from 5 animals.
(E) Average rate-intensity function for PRN neurons (n = 23 from 5 animals). Bar = SD.
(F) Frequency response area of an example PRN neuron.
(G) PSTH of spike responses of the same cell to test tones at 80 dB SPL.
(H) Injection of AAVretro-Cre into PRNc. Images show GFP fluorescence around the injection site (H1, right) and retrogradely labeled cell bodies in the contralateral CN (H2). Scale bar, 500 μm. AVCN, anterior ventral cochlear nucleus; PVCN, posterior ventral cochlear nucleus; DCN, dorsal cochlear nucleus; 8n, eighth nerve.
The reticular-limbic ascending auditory pathway
The above experiments suggest a non-canonical central auditory pathway from the CN to PRN, to PCG, to MS and then to EC. We compared response properties between this reticular-limbic pathway and the canonical lemniscal pathway leading to AC. At each successive stage downstream of CN, neurons in the reticular-limbic pathway exhibited significantly higher intensity thresholds than those in the canonical pathway (Figure 6A). The high intensity threshold first emerged in PRN and persisted across the successive stages of the reticular-limbic pathway. The onset latency of auditory responses (quantified for responses to noise at 80 dB SPL) was progressively increased along both pathways (Figure 6B), consistent with a serial connection scheme. The response latency in MS was comparable to that in the auditory thalamus (ventral MGB), while the latency in EC was comparable to that in A1 (Figure 6B). These data indicate that via the relay by the reticular-limbic pathway, EC can receive auditory information as fast as A1.
Figure 6. Comparison of response properties between two central auditory pathways.
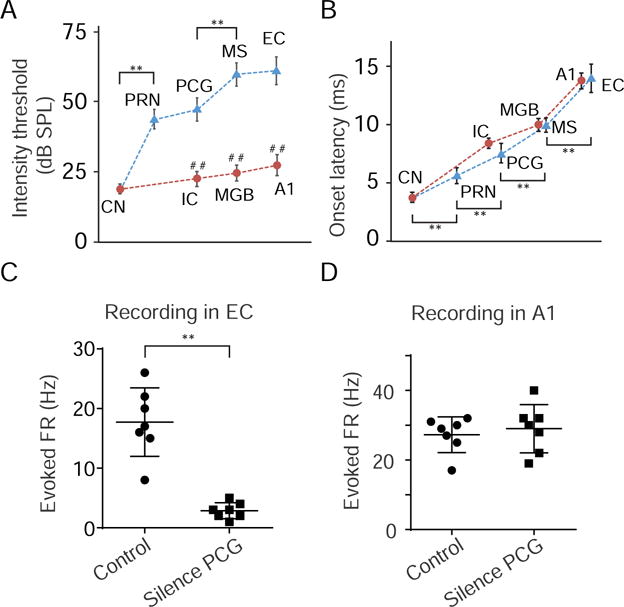
(A) Average intensity thresholds as determined by responses to noise at successive stages of the reticular-limbic (blue) and canonical lemniscal (red) pathways. Bar = SD. N = 21 for CN (from 5 animals), 23 for IC (from 4 animals), 18 for MGBv (from 5 animals), and 56 for A1 (from 8 animals). **P < 0.01, in comparison with the previous stage in the same pathway, one-way ANOVA post hoc (Tukey) test. ##P < 0.01, in comparison with the corresponding stage in the other pathway, unpaired two-tailed t-test.
(B) Average response onset latencies at different stages. Bar = SD. **P < 0.01, in comparison with the previous stage in the same reticular-limbic pathway, one-way ANOVA post hoc (Tukey) test.
(C) Noise-induced multi-unit responses in EC before and after silencing PCG (n = 7 sites from 3 animals). **P < 0.01, unpaired two-tailed t-test. Bar = mean ± SD.
(D) Noise-induced multi-unit responses in A1 before and after silencing PCG (n = 7 sites from 3 animals). P = 0.48, unpaired two-tailed t-test.
To further demonstrate the functional separation between the reticular-limbic and canonical central pathways in our experimental condition, we performed multi-unit recording in EC or A1 and silenced PCG with muscimol. Silencing PCG blocked noised-evoked spike responses in EC (Figure 6C), but did not affect auditory responses in A1 (Figure 6D).
Involvement in auditory-related conditioned fear memory
It has been well documented that PRNc mediates acoustic startle response (ASR) (Koch and Schnitzler, 1997; Lee et al., 1996). We first examined whether the identified reticular-limbic pathway could play a role in ASR by monitoring the Preyer’s reflex, manifested by movements of pinna immediately following the exposure to a loud sound (Jero et al., 2015) (Figure 7A). In the control condition, noise (80 dB SPL) successfully elicited the Preyer’s reflex in > 90% of randomly tested trials, and tones (80 dB SPL, 7.5 kHz) induced weaker reflexive responses in a slightly lower percentage of trials (Figure 7B). Neither silencing PCG with muscimol nor silencing MS with lidocaine had any effect on the reflexive response (Figure 7B), indicating that the reticular-limbic pathway is not involved in ASR.
Figure 7. The reticular-limbic pathway plays a role in auditory-related conditioned fear memory.
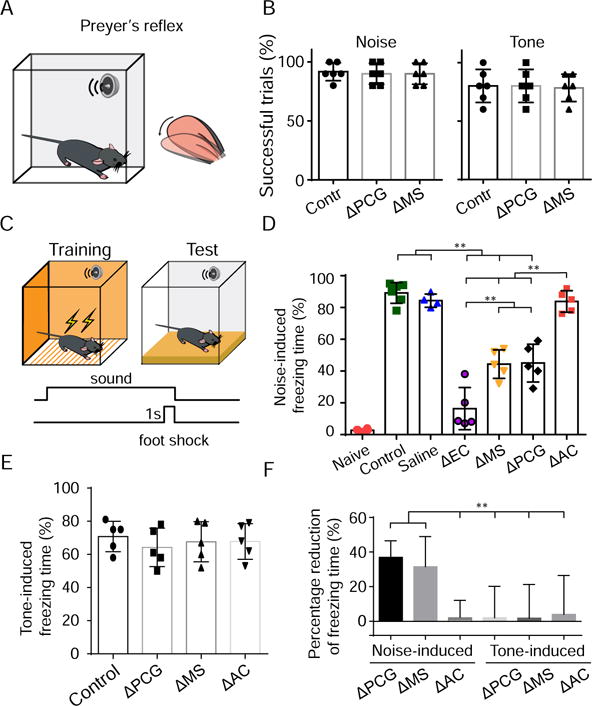
(A) A schematic illustration of test of the Preyer’s reflex.
(B) Percentage of successful trials showing Preyer’s reflex immediately following noise (left) or tone (right) presentation for the control group (n = 6 animals) as well as PCG (n = 6 animals, bilaterally with muscimol) and MS (n = 6 animals, bilaterally with lidocaine) silencing groups. Each data point represents one animal. Bar =SD.
(C) Diagram showing the conditioned fear response assay. For training, 1-s foot shock co-terminated with 20-s sound.
(D) Percentage freezing time during presentation of noise (80 dB SPL) alone on the testing day for naïve (n = 6 animals), noise-conditioned control (n = 6), saline-injected control (n = 4, into EC) groups as well as for experimental groups in which EC (n = 5, with lidocaine), MS (n = 5, with lidocaine), PCG (n = 5, with muscimol) or AC (n = 5, with lidocaine) was silenced during conditioning. Bar = SD. **P < 0.01, one-way ANOVA post hoc (Tamhane) test.
(E) Percentage freezing time during presentation of tones (80 dB SPL, 7.5kHz) alone in the tone-conditioned control (n =5 animals), as well as in the experimental groups in which MS (n =5), PCG (n =5) or AC (n=5) was silenced during conditioning. Bar = SD.
(F) Summary of percentage reduction of freezing time in experimental groups in which MS, PCG or AC was silenced during conditioning [(experimental – saline-injected control)/experimental, bootstrap resampling]. Bar represents mean ± SD. **P < 0.01, unpaired t-test.
EC is known to be involved in memory functions (Andersen et al., 2006; Buzsaki and Moser, 2013; Li et al., 2017). We wondered whether the reticular-limbic pathway to EC could play a role in establishing auditory-related memory. To test this possibility, we employed a classic conditioned fear response assay (Fanselow and Poulos, 2005; Letzkus et al., 2011; Romanski and LeDoux, 1992). For conditioning, mice were exposed to five pairings of a conditioned stimulus (CS, 20-s white noise, 80 dB SPL) and a foot shock (unconditioned stimulus, US) (Figure 7C). On the following day, they were exposed to the CS alone without foot shocks in a different context as to measure the cued conditioned response (Figure 7C), which was quantified as the percentage of time freezing during the presentation of CS. Naïve animals having not experienced the pairings of CS and US did not exhibit freezing upon CS presentation, whereas conditioned control and saline-perfused control (EC-perfused, 85 ± 4%, n = 5; MS-perfused, 89 ± 7%, n = 4; PCG-perfused, 87 ± 5%, n = 4) animals exhibited robust freezing on the testing day (Figure 7D). Perfusion of lidocaine into EC bilaterally just before parings of CS and US, i.e. to silence EC activity during conditioning, dramatically reduced the freezing time measured on the following day (Figure 7D, ΔEC), consistent with the previous notion of involvement of EC in the formation of fear memory (Baldi et al., 2013; Sparta et al., 2014). Silencing MS or PCG activity during pairings of CS and US also significantly impaired the freezing response, although to a lesser extent (Figure 7D, ΔMS, ΔPCG). In contrast, silencing AC during conditioning had no effect on the freezing response on the testing day (Figure 7D, ΔAC).
Since neurons in the reticular-limbic pathway exhibited little response to tones, we reasoned that tone-conditioned fear memory might not be affected by interrupting this pathway. To test this idea, we trained mice by pairing a tone (80 dB SPL, 7.5 kHz) with a foot shock for ten times. Control mice exhibited robust freezing on the testing day after conditioning (Figure 7E). Silencing MS and PCG during conditioning had no effect on the freezing time (Figure 7E), indicating that the reticular-limbic pathway is not involved in tone-conditioned fear learning. Consistent with a previous study (Romanski and LeDoux, 1992), we found that AC was also not required for tone-cued fear conditioning (Figure 7E). It should be noted that different results have also been reported (e.g., Banerjee et al., 2017), which may be attributed to differences in experimental conditions. As summarized in Figure 7F, disrupting activity in nuclei of the reticular-limbic pathway during conditioning specifically reduced noise- but not tone-conditioned fear response, indicating that this pathway plays a role in transmitting specifically noise signals for the formation of auditory-related conditioned fear memory.
Discussion
Auditory responses in the limbic system
Information processing in the mammalian brain relies on a hierarchical relay of sensory input along central processing pathways. To understand this process, it is fundamental to characterize neuronal responses at each stage of these pathways. In the auditory system, previous studies have predominantly focused on the well-characterized auditory neuraxis from the CN to AC. However, in several earlier studies, auditory responses have also been reported in brain regions beyond the canonical neuraxis, in particular, the nuclei associated with the limbic system, e.g., the cingulate cortex, lateral and basolateral amygdala, dentate gyrus of hippocampal formation, septum, entorhinal cortex, and mammillary body (Vinogradov, 1975). In those studies, auditory response properties have not been characterized quantitatively. It thus has remained unclear what auditory pathways are underlying these acoustic responses. In the present study, we compared neuronal responses to noise and tone stimuli and their temporal properties in the limbic system. Our findings of MS and EC neurons responding specifically to high-intensity noise are consistent with previous observations that neurons in the limbic system could be driven more efficiently by loud click sounds (Vinogradov, 1975), and that tone-evoked Ca2+ responses were absent at the EC axon terminals in the hippocampus (Lovett-Barron et al., 2014).
Auditory responses in pontine nuclei
PRNc is known to be involved in acoustic startle response (Koch and Schnitzler, 1997; Lee et al., 1996). For this reflexive behavior, PRNc neurons receive auditory input from the cochlear nucleus and project to the spinal cord to drive motor neurons, resulting in muscle contractions (Koch and Schnitzler, 1997). Our behavioral experiments demonstrate that disrupting activity of the nuclei in the reticular-limbic pathway downstream of PRNc does not affect ASR (Figure 7B). Therefore, the pathway delineated in this study is likely separate from the circuit mediating ASR, although it also relies on PRNc to receive auditory input (Figure 8).
Figure 8.
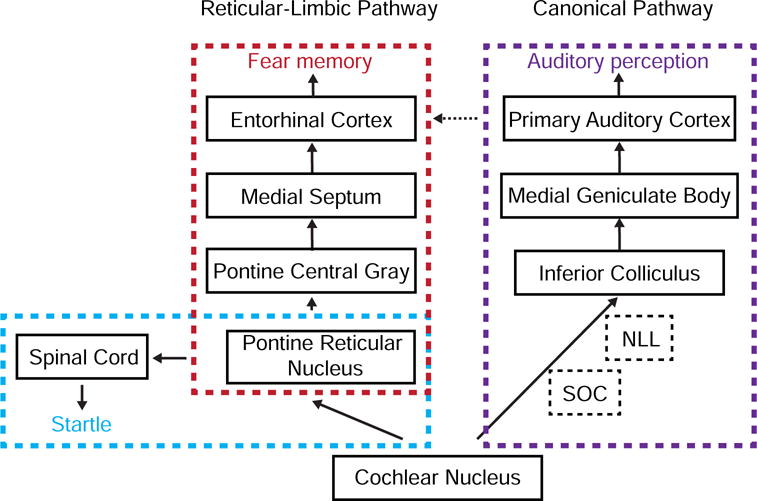
Summary of serial connections in the reticular-limbic and canonical lemniscal pathways. The former diverges from the latter at the stage of CN. The circuit specific for ASR is boxed with purple color. The sparse projections from AC to EC are labeled with a dotted line. NLL, the nucleus of lateral lemniscus; SOC, superior olivary complex.
It has been observed previously that PRN neurons respond to tone stimuli only with intensity as high as 80 dB SPL (Lee et al., 1996; Lingenhohl and Friauf, 1994). Our result confirmed this point (Figure 5G). More importantly, our data show that PRN neurons can be more efficiently driven by noise stimuli, with a moderate intensity threshold. This may result from a convergence of multiple relatively weak CN inputs with different frequency preferences onto a single PRN neuron. Consistent with a previous report (Kandler and Herbert, 1991), our retrograde labeling experiments indicate that both AVCN and DCN project to PRN, suggesting that a variety of CN cell types, e.g. giant neurons in deep layers of DCN (Romand, 1997), may provide input to PRN neurons.
Modulation of PRN activity has been implicated in the prepulse inhibition of ASR (Carlson and Willott, 1998; Lingenhohl and Friauf, 1994). In this case, PRN is considered as a terminal structure where multiple forms of modulation can take effect (Koch and Schnitzler, 1997). However, the roles of its broad projections to the reticular formation and midbrain (Iwasaki et al., 1999) remain unknown. In this study, our results suggest that PCG integrates auditory information from the PRN and then relays it to the forebrain. Since PRN is multisensory (Yeomans et al., 2002), it is likely that multisensory information can also be relayed via PCG to MS.
A non-canonical central auditory pathway
Our study, for the first time, has elucidated a complete central relay pathway divergent from the canonical auditory neuraxis (Figure 8). We demonstrate that auditory responses, at least the early responses, in EC are primarily driven by MS. This is supported by both the anatomical and pharmacological evidence. It appears that the reticular-limbic and canonical pathways are mostly independent of each other, since silencing MS has no effect on auditory responses in AC (Figure S4B) and silencing AC has no effect on the responses in EC (Figure 2F). On the other hand, we should note that our anatomical data (Figure S3) and previous tracing results (Allen Brain Atlas, connectivity.brain-map.org) both indicate that there are relatively sparse projections from AC to EC, and that EC may also receive indirect inputs from AC via TEA, ectorhinal or perirhinal cortical regions (Burwell and Amaral, 1998; Kotak et al., 2015). Since in this study we have focused explicitly on short-latency responses in EC, it remains possible that AC-mediated direct or indirect inputs can contribute to some late responses. The functional interactions between AC and EC remain to be further investigated in the future.
It is somewhat surprising to find that MS relays the primary auditory input to EC. Although auditory responses were previously observed in MS (Miller and Freedman, 1993; Vinogradov, 1975), the structure has mostly been implicated in driving oscillatory activity in the hippocampus and relaying information of locomotion speed (Fuhrmann et al., 2015; Justus et al., 2017; Robinson et al., 2016). In the present study, we showed that MS neurons could respond robustly to broadband noise contained in natural sounds. It is thus possible that MS can perform multiple functions, possibly through recruiting distinct types (Gonzalez-Sulser et al., 2014; Saunders et al., 2015) or subsets of neurons under different contexts.
Functional implication for the reticular-limbic auditory pathway
The limbic system, especially its components EC, MS, and hippocampus, is known to be critically involved in memory functions (Andersen et al., 2006). It is thus straightforward to postulate that one functional purpose of the reticular-limbic pathway is to relay some salient signals rapidly for memory storage or retrieval. Neurons in PRN acquire auditory response properties very different from their source neurons in CN, indicating that sound information has been filtered at this stage. Across all the successive stages, broadband noise stimuli more efficiently drive neuronal responses than pure tones, although tones of very high intensity (> 90 dB SPL) may elicit some responses (data not shown). In our previous studies, we have shown that loud noise can trigger flight response in rodents (Xiong et al., 2015; Zingg et al., 2017). Thus the pathway delineated in this study appears to specifically convey acoustic information of aversive nature. As EC projects to the dentate gyrus of the hippocampus and primarily drives auditory responses there (Deadwyler et al., 1981), the reticular-limbic pathway may provide a route for the fast relay of aversive, behaviorally significant acoustic signals to the hippocampus.
It is interesting to note that silencing EC produced a larger effect on fear conditioning than disrupting each earlier stage in the reticular-limbic pathway (Figure 7D). We reason that EC is likely a late-stage center for integrating information from various sources essential for the formation of fear memory. That is, it receives input not only from MS as we demonstrate in this study, but also from other pathways, e.g. via the amygdala, which is also important for the formation of fear memory (LeDoux, 2012). In addition, our data demonstrate that inactivating each stage of the reticular-limbic pathway during conditioning impairs noise-conditioned but not tone-conditioned fear memory. This result is consistent with the observation that this pathway transmits little tone information, and suggests that transmitting noise signals along the pathway is essential for the formation of the noise-specific conditioned fear memory. On the other hand, tone signals may be transmitted through other pathways, e.g. via the amygdala (Ehrlich et al., 2009; Haubensak et al., 2010; Wolff et al., 2014), to form tone-specific fear memory. How the auditory information of noise is processed beyond EC will be of great interest for future investigations.
STAR Methods
Contact for Reagent and Resource Sharing
Futher information and requests for resources and reagents should be directed to and will be fulfilled by the Lead Contact, Li I. Zhang (liizhang@usc.edu).
Experimental Models and Subject Details
Experiments were performed in the Zilkha Neurogenetic Institute at the University of Southern California (USC), and experimental procedures in this study were approved by the Animal Care and Use Committee of USC. Male and female C57BL/6J, Ai14 (Cre-dependent tdTomato reporter) mice (Jackson Laboratories, RRID: IMSR_JAX:007914) and vGlut2-IRES-Cre mice (Jackson Laboratories, RRID: IMSR_JAX: 016963) aged 2–3 months were used in this study. Mice were housed with 12-h light/dark cycles. All recordings and behavioral tests were conducted in the dark cycle.
Method Details
Head-fixed animal preparation
Three days before the experiment, the mouse was anesthetized with isoflurane (1.5% by volume), and a screw for head fixation was mounted on top of the skull with dental cement. The head screw was clamped into a metal post to fix the head. The animal was trained to run freely on a flat plate rotating smoothly around its center. One day before electrophysiological recordings, the mouse was anesthetized with isoflurane, and a craniotomy was performed over the intended recording region and then sealed with silicone adhesive (Kwik-Cast Sealant, WPI Inc.) until the recording experiments.
In vivo electrophysiological recordings in awake animals
The following recordings and tests were all performed in a sound-attenuation booth (Acoustic Systems). Individual recording sessions lasted for no more than 2 hrs. The animal was given drops of 5% sucrose through a tube during recording break. Loose-patch and single-unit extracellular recordings in EC were performed according to previous procedures (Liang et al., 2015; Tao et al., 2017), with a patch pipette filled with an artificial cerebral spinal fluid (ACSF; 126 mM NaCl, 2.5 mM KCl, 1.25 mM Na2PO4, 26 mM NaHCO3, 1 mM MgCl2, 2 mM CaCl2 and 10 mM glucose). Axopatch 200B amplifier (Molecular Devices) was used to record signals. A loose seal (0.1–0.5 GΩ) was made on the cell body, allowing spikes only from the patched cell to be recorded in voltage-clamp mode. Signals were filtered with a 300–3,000 Hz band-pass filter. With large pipette openings (resistance < 6 MΩ), no cortical fast-spiking neurons were ever recorded, suggesting that these recording parameters imposed a strong sampling bias towards excitatory neurons, which have larger cell bodies and more extensive dendritic fields than most inhibitory neurons. This bias has also been shown in our previous studies (Ibrahim et al., 2016; Liang et al., 2015; Liu et al., 2011). Single-unit recordings in the MS, PCG, and PRN were performed using a tungsten electrode (0.5 MΩ impedance, WPI Inc.). Data were acquired and digitized at 30 kHz sampling rate (Plexon). Coordinates for recording were based on the Allen Reference Atlas (Dong, 2007). Some electrodes were coated with DiI (Invitrogen) for the reconstruction of electrode track (Tao et al., 2017).
Recording in the AC
Auditory cortical regions were pre-mapped with extracellular recordings. The primary auditory cortex was identified by its tonotopic representation of characteristic frequencies in a caudal-to-rostral (low to high frequency) gradient, relatively sharp spike FRAs and short response onset latencies, as we previously described (Sun et al., 2010; Zhou et al., 2014; Tao et al., 2017).
Recording in the MGBv
We mapped the auditory thalamus by extracellular recordings with a parylene-coated tungsten electrode (2 MΩ, FHC). Single units were sorted. Mapping was performed in a three-dimensional manner by systematically varying the depth and the x–y coordinates of the electrode that penetrated the primary auditory cortical surface with an approximately right angle. We distinguished the MGBv (∼ 2.4̶–2.6 mm below the auditory cortical surface) from other auditory thalamic divisions based on its tonotopic frequency representation, relatively sharp spike FRAs and short onset latencies (Xiong et al., 2015).
Recording in the IC
The IC area was mapped by extracellular recordings with a tungsten electrode. Single units were sorted. The ICC region was identified based on short response latencies (6–8 ms for noise responses), sharply tuned FRAs as well as a dorsal-to-ventral gradient of characteristic frequencies (from low to high), as described in our previous study (Xiong et al., 2013).
Recording in the CN
After opening the right part of the occipital bone, part of the cerebellum was aspirated to expose the dorsal part of CN (DCN). During the experiment, DCN was covered with an artificial cerebrospinal fluid (ACSF; in mM: 124 NaCl, 1.2 NaH2PO4, 2.5 KCl, 25 NaHCO3, 20 glucose, 2 CaCl2, 1 MgCl2). We mapped the DCN tonotopy with extracellular recordings, which demonstrated a low-high frequency gradient along the lateral-medial axis, as described in our previous study (Zhou et al., 2012; Zhou et al., 2015).
Recording in the ECl
The head of the animal was laterally rotated at 45°. A 1×1 mm2 craniotomy window was performed over the juncture of temporal, occipital and interparietal bone (3.75 mm lateral to midline, 4.6 mm posterior to bregma). The electrode was penetrated orthogonal to the cortical surface and below the caudal rhinal vein (~1.75 mm below the pia).
Recording in the ECm
Craniotomy was performed over the ECm (3.5 mm lateral to midline, 4.9 mm posterior to bregma). During recording sessions, the animal head was anteriorly rotated at 7° and electrode was vertically penetrated to a depth of ~3.5 mm below the pia.
Recording in the MS
Craniotomy was performed over the MS (1 mm lateral to midline, 0.8 mm anterior to bregma). The animal head was laterally rotated at 13°. The electrode was penetrated to a depth of 4–5 mm below pia and recording position was reconstructed after recording.
Recording in the PCG and PRN
Craniotomy was performed over the PCG and PRN (0.5 mm lateral to midline, 5.5mm posterior to bregma). The electrode was penetrated to a depth of 3–4 mm below the pia for PCG and 4.5–5.5 mm below the pia for PRN. Recoding position was confirmed after the reconstruction of the electrode track.
Sound stimulation
A calibrated open field speaker (Vifa XT25G30-04 1″ Dual Ring Tweeter) was used for sound delivery. Its position was adjusted according to that of the ear, such that the speaker was 10 cm away from and facing the left ear (contralateral to the recorded brain regions listed above except CN), with the ear canal aligned with the axis of the speaker. Software for sound stimulation and data acquisition was custom developed with LabVIEW (National Instruments, Austin, TX), and PCI-6731 NI board (16-bits output, and 1MHz sampling rate) was used for sound generation. The experimental sequence was the same for each recorded cell: testing of response to 80 dB SPL white noise (20-50 trials, with 5-s inter-stimulus interval), followed by FRA mapping (at least 3 trials) and then by testing of rate-intensity function (20 trials). For FRA mapping, pure tones (2–32 kHz at 0.1-octave intervals, 50 ms duration, 3 ms ramp) at eight, 10 dB-spaced sound intensities (10–80 dB SPL) were delivered in a pseudo-random sequence. The time interval and intensity difference between two sequential tones were set at 0.5 s and no more than 30 dB SPL, respectively, to ensure minimal interactions between tone responses. Characteristic frequency (CF), the frequency at which the neuron responded to tones with the minimum intensity, was determined online. For testing rate-intensity function, broadband white noise (1–64 kHz) at twelve intensities (0–110 dB SPL spaced at 10 dB) were delivered in a pseudo-random sequence (intensity difference between sequential stimuli > 30 dB), with the inter-stimulus interval set as 5 s.
Viral injection
Stereotaxic injection of the virus was carried out as we previously described (Xiong et al., 2015; Zingg et al., 2017). Coordinates for injections followed those for recording. Mice were anesthetized with 1.5% isoflurane. A small cut was made on the skin covering the ECl, ECm, MS, PCG, and PRN and the muscles were removed. One ∼0.2×0.2 mm2 craniotomy window was made for each region as described in above recording experiments. The following adeno-associated viruses (AAVs, encoding ChR2, or GFP or Cre) or rabies virus (encoding GFP) (Wickersham et al., 2007) were used depending on the purpose of experiments and strain of mice: AAV9.EF1α.DIO.hChR2(H134R)-EYFP.WPRE.hGH (UPenn vector core, Addgene 20298), pAAV-Syn-GFP (Upenn vector core, Addgene 58867), AAVretro-Cre (Tervo et al., 2016), ΔG-rabies-GFP(Salk Institute). A beveled glass micropipette (tip opening diameter: ∼20–30 μm) was used to deliver the virus, and the glass micropipette was attached to a microsyringe pump (World Precision Instruments). For each injection, 50 nl of the viral solution was injected at a rate of 15 nl min−1. Right after the injection, the pipette was allowed to rest for 4 min before withdrawal. The scalp was then sutured. Following the surgery, 0.1 mg kg−1 buprenorphine was injected subcutaneously before returning the animals back to their home cages. Mice were allowed to recover for at least 3 weeks.
Optogenetic activation
To activate MS glutamatergic axon terminals in EC, an optic fiber (200 μm, Thorlabs) connecting to a blue LED source (473 nm, Thorlabs) was positioned close to the surface of ECl. The tip of the optic fiber was covered by agar stained with black pigments to prevent light leakage. To ensure the specificity of the optogenetic stimulation, no ChR2-expressing fibers and structures other than the targeted structure should be present in the light pathway within 800 μm from the end of the optic fiber. The axis of the light pathway was the same as the central axis of the optic fiber, and the illumination angle was determined by the fiber’s NA value. This rule applied to all of our experiments. After each experiment, the brain was sectioned and imaged under a fluorescence microscope to confirm the expression of ChR2-EYFP.
Silencing of brain structures
Lidocaine, a blocker of the voltage-gated Na+ channel (2%, dissolved in ACSF containing biotinylated dextran amines, BDA), or fluorescent muscimol BODIPY (0.7 mM in ACSF with 5% DMSO) was used to silence a targeted brain region. The drug was applied via implanted cannulas (OD, 300 μm; ID, 140 μm). The silencing efficiency was evaluated for each experiment by comparing the evoked spike responses before and after the perfusion of the drug (Figure S4). To silence the AC (lidocaine, volume, 150 nl per hemisphere), the cannula was inserted to a depth of 400 μm below the cortical surface centered on A1. For MS silencing (lidocaine, volume, 150 nl), the cannula was inserted to a depth of 4250 μm below the surface. For PCG silencing (muscimol, 100 nl per hemisphere), the cannula was inserted to a depth of 2300 μm below the surface. The spread of lidocaine was estimated by the fluorescent imaging of BDA. Two hours after injection, the animals were transcardially perfused with 4% paraformaldehyde in phosphate-buffered saline. Coronal brain sections (100 μm) were made with a vibratome (Leica Microsystems) and imaged under a confocal microscope (Olympus). For electrolytic lesion, a parylene-coated tungsten electrode (tip diameter, 45 μm) was implanted to target MS, or AC using the same methods as described above. A direct current of 1mA from a current source (Keithley Instruments) was applied for 10 sec.
Fear conditioning
Mice underwent auditory fear conditioning in custom-made behavioral boxes in a sound-attenuation booth (Gretch-Ken Industries, Inc). The training box was a hard paper box with metal wires on the bottom, and the testing box was an acrylic box with bedding materials. The conditioning chamber and the test box were cleaned with 70% ethanol before and after each session. The bedding material in the test box was replaced before each test session. On the first day, after 10 min habituation to the conditioning chamber, animals were exposed to white noise (80 dB SPL, duration = 20 s) for 5 times to measure the basal level response. On the second day (conditioning), the animals were exposed to the 20-s noise co-terminated with a 0.75-mA foot shock (5Hz for 1 s with the duration of each pulse = 100 ms) for 5 times. On the third day, mice were placed in a different context (test box) and given 5 noise presentations in the absence of foot shocks. Inter-trial interval for noise presentation was randomly chosen from a range of 120 s to 240 s with the mean of 180 s. All the processes were video recorded, and a blind procedure was implemented for behavioral analysis. The fear response was scored as the percentage of time freezing during the 20-s presentation of noise alone. The freezing was scored when no movement (except for respiratory movements) was detected for at least 1s, and the total freezing time during a sound presentation was counted based on the video analysis.
Test of the Preyer’s reflex
Mice underwent tests of the Preyer’s reflex in a custom-made behavioral box placed in a sound-attenuation booth (Gretch-Ken Industries, Inc). We conducted testing in the dark. The movement of the animal was monitored using a high speed (240 fps) camera. The animal was exposed to 80 dB SPL, 200-ms white noise or tones (7.5kHz) for 10 times with a randomly chosen inter-stimulus interval (3-5 min. A quick movement of pinna within 50 ms after the onset of sound stimulation was considered as a successful trial.
Quantification and Statistical Analysis
Data processing
FRAs were reconstructed according to the array sequence. CF was defined as the frequency that evoked reliable spike responses at the lowest intensity level. Response onset latency was determined from the PSTH by the time point at which spiking activity exceeded the average baseline firing rate (measured during the 100-ms time window before the stimulus onset) by 3 standard deviations of baseline fluctuations. Offline spike sorting (Mclust, written by A. D. Redish, http://redishlab.neuroscience.umn.edu/MClust/MClust.html; Offline sorter, Plexon, Inc.) was applied to isolate single units. The signal-to-noise ratio in our recordings was usually >10dB. Analysis performers were blind to the allocation of the experiments. All data were first pooled together without categorizing the neurons according to their recording sites, and randomized batch processing was then performed. The Z-score was calculated as the evoked firing rate (calculated within a 50-ms window after the stimulus onset) divided by the standard deviation of the baseline firing rate (calculated within a 100-ms window before the stimulus onset).
Statistics
Shapiro–Wilk test was first applied to examine whether samples had a normal distribution. Leven’s test was used to test the equality of variances. In the case of a normal distribution, t-test, paired t-test or analysis of variance test was applied. In the case of unequal variance, t-test with equal variance not assumed was used. In the case of homogeneous variance, one-way ANOVA with Tukey post-hoc test was used; in the case of inhomogeneous variance, one-way ANOVA with Tamhane post-hoc test was applied. Data were presented as mean ± SD. if not otherwise specified.
Supplementary Material
Highlights.
-
·
A non-canonical, reticular-limbic central auditory pathway was discovered.
-
·
It branches from cochlear nucleus and reaches entorhinal cortex via medial septum.
-
·
It specifically transmits loud noise-like aversive acoustic signals.
-
·
This newly identified pathway contributes to noise-cued fear conditioning.
Acknowledgments
This work was supported by grants to L.I.Z. from the US National Institutes of Health (R01DC008983 and RF1MH114112). H.W.T. was supported by NIH grants (EY019049 and EY022478) and the Kirchgessner Foundation. Y.X. was supported by National Nature Science Foundation of China (31471056). G.W.Z. was supported by China Scholarship Council (No. 201503170410). J.H. was supported by grants from Hong Kong Research Grants Council (11166316M) as well as Health and Medical Research Fund (03141196). B.Z. was supported by an NIH grant (F31DC015185).
Footnotes
Publisher's Disclaimer: This is a PDF file of an unedited manuscript that has been accepted for publication. As a service to our customers we are providing this early version of the manuscript. The manuscript will undergo copyediting, typesetting, and review of the resulting proof before it is published in its final citable form. Please note that during the production process errors may be discovered which could affect the content, and all legal disclaimers that apply to the journal pertain.
Author contributions
L.I.Z. and H.W.T. conceived the study. G.W.Z. performed most behavioral and recording experiments. W.J.S. started and contributed to early behavioral and recording experiments. B.Z. contributed to anatomical experiments. L.S. contributed to recordings and data analysis. J.H. contributed to discussion. L.I.Z., H.W.T. and Y.X. supervised the project. L.I.Z., H.W.T. and G.W.Z. wrote the manuscript.
Declaration of Interests
The authors declare no competing interests.
References
- Ahmed OJ, Mehta MR. The hippocampal rate code: anatomy, physiology and theory. Trends Neurosci. 2009;32:329–338. doi: 10.1016/j.tins.2009.01.009. [DOI] [PMC free article] [PubMed] [Google Scholar]
- Andersen P, Morris R, Amaral D, Bliss T, O’Keefe J, Oxford University Press . The Hippocampus Book. New York: Oxford University Press; 2006. p. 852. [Google Scholar]
- Aronov D, Nevers R, Tank DW. Mapping of a non-spatial dimension by the hippocampal-entorhinal circuit. Nature. 2017;543:719–722. doi: 10.1038/nature21692. [DOI] [PMC free article] [PubMed] [Google Scholar]
- Arroyo S, Bennett C, Aziz D, Brown SP, Hestrin S. Prolonged Disynaptic Inhibition in the Cortex Mediated by Slow, Non- 7 Nicotinic Excitation of a Specific Subset of Cortical Interneurons. J Neurosci. 2012;32:3859–3864. doi: 10.1523/JNEUROSCI.0115-12.2012. [DOI] [PMC free article] [PubMed] [Google Scholar]
- Baldi E, Liuzzo A, Bucherelli C. Fimbria-fornix and entorhinal cortex differential contribution to contextual and cued fear conditioning consolidation in rats. Physiol Behav. 2013;114–115:42–48. doi: 10.1016/j.physbeh.2013.03.011. [DOI] [PubMed] [Google Scholar]
- Banerjee SB, Gutzeit VA, Baman J, Aoued HS, Doshi NK, Liu RC, Ressler KJ. Perineuronal Nets in the Adult Sensory Cortex Are Necessary for Fear Learning. Neuron. 2017;95:169–179.e3. doi: 10.1016/j.neuron.2017.06.007. [DOI] [PMC free article] [PubMed] [Google Scholar]
- Burwell RD, Amaral DG. Perirhinal and postrhinal cortices of the rat: Interconnectivity and connections with the entorhinal cortex. J Comp Neurol. 1998;391:293–321. doi: 10.1002/(sici)1096-9861(19980216)391:3<293::aid-cne2>3.0.co;2-x. [DOI] [PubMed] [Google Scholar]
- Buzsáki G, Moser EI. Memory, navigation and theta rhythm in the hippocampal-entorhinal system. Nat Neurosci. 2013;16:130–138. doi: 10.1038/nn.3304. [DOI] [PMC free article] [PubMed] [Google Scholar]
- Carlson S, Willott JF. Caudal pontine reticular formation of C57BL/6J mice: responses to startle stimuli, inhibition by tones, and plasticity. J Neurophysiol. 1998;79:2603–2614. doi: 10.1152/jn.1998.79.5.2603. [DOI] [PubMed] [Google Scholar]
- Chechik G, Anderson MJ, Bar-Yosef O, Young ED, Tishby N, Nelken I. Reduction of Information Redundancy in the Ascending Auditory Pathway. Neuron. 2006;51:359–368. doi: 10.1016/j.neuron.2006.06.030. [DOI] [PubMed] [Google Scholar]
- Colom LV, Castaneda MT, Reyna T, Hernandez S, Garrido-Sanabria E. Characterization of medial septal glutamatergic neurons and their projection to the hippocampus. Synapse. 2005;58:151–164. doi: 10.1002/syn.20184. [DOI] [PubMed] [Google Scholar]
- Deadwyler SA, West MO, Robinson JH. Entorhinal and septal inputs differentially control sensory-evoked responses in the rat dentate gyrus. Science. 1981;211:1181–1183. doi: 10.1126/science.7466392. [DOI] [PubMed] [Google Scholar]
- Dong H. The allen reference atlas: a digital color brain atlas of the C57BL/6J male mouse. John Wiley and Sons, Inc; 2007. [Google Scholar]
- Ehrlich I, Humeau Y, Grenier F, Ciocchi S, Herry C, Lüthi A. Amygdala Inhibitory Circuits and the Control of Fear Memory. Neuron. 2009;62:757–771. doi: 10.1016/j.neuron.2009.05.026. [DOI] [PubMed] [Google Scholar]
- Escabi MA, Read HL. Representation of spectrotemporal sound information in the ascending auditory pathway. Biol Cybern. 2003;89:350–362. doi: 10.1007/s00422-003-0440-8. [DOI] [PubMed] [Google Scholar]
- Fanselow MS, Poulos AM. The Neuroscience of Mammalian Associative Learning. Annu Rev Psychol. 2005;56:207–234. doi: 10.1146/annurev.psych.56.091103.070213. [DOI] [PubMed] [Google Scholar]
- Frank LM, Brown EN, Wilson M. Trajectory encoding in the hippocampus and entorhinal cortex. Neuron. 2000;27:169–178. doi: 10.1016/s0896-6273(00)00018-0. [DOI] [PubMed] [Google Scholar]
- Fuchs EC, Neitz A, Pinna R, Melzer S, Caputi A, Monyer H. Local and Distant Input Controlling Excitation in Layer II of the Medial Entorhinal Cortex. Neuron. 2016;89:194–208. doi: 10.1016/j.neuron.2015.11.029. [DOI] [PMC free article] [PubMed] [Google Scholar]
- Fuhrmann F, Justus D, Sosulina L, Kaneko H, Beutel T, Friedrichs D, Schoch S, Schwarz M, Fuhrmann M, Remy S. Locomotion, Theta Oscillations, and the Speed-Correlated Firing of Hippocampal Neurons Are Controlled by a Medial Septal Glutamatergic Circuit. Neuron. 2015;86:1253–1264. doi: 10.1016/j.neuron.2015.05.001. [DOI] [PubMed] [Google Scholar]
- Fyhn M, Molden S, Witter MP, Moser EI, Moser MB. Spatial representation in the entorhinal cortex. Science. 2004;305:1258–1264. doi: 10.1126/science.1099901. [DOI] [PubMed] [Google Scholar]
- Gonzalez-Sulser A, Parthier D, Candela A, McClure C, Pastoll H, Garden D, Surmeli G, Nolan MF. GABAergic Projections from the Medial Septum Selectively Inhibit Interneurons in the Medial Entorhinal Cortex. J Neurosci. 2014;34:16739–16743. doi: 10.1523/JNEUROSCI.1612-14.2014. [DOI] [PMC free article] [PubMed] [Google Scholar]
- Haubensak W, Kunwar PS, Cai H, Ciocchi S, Wall NR, Ponnusamy R, Biag J, Dong HW, Deisseroth K, Callaway EM, et al. Genetic dissection of an amygdala microcircuit that gates conditioned fear. Nature. 2010;468:270–276. doi: 10.1038/nature09553. [DOI] [PMC free article] [PubMed] [Google Scholar]
- Hu B, Senatorov V, Mooney D. Lemniscal and non-lemniscal synaptic transmission in rat auditory thalamus. J Physiol. 1994;479:217–231. doi: 10.1113/jphysiol.1994.sp020290. [DOI] [PMC free article] [PubMed] [Google Scholar]
- Ibrahim LA, Mesik L, Ji XY, Fang Q, Li HF, Li YT, Zingg B, Zhang LI, Tao HW. Cross-Modality Sharpening of Visual Cortical Processing through Layer-1-Mediated Inhibition and Disinhibition. Neuron. 2016;89:1031–1045. doi: 10.1016/j.neuron.2016.01.027. [DOI] [PMC free article] [PubMed] [Google Scholar]
- Iwasaki H, Kani K, Maeda T. Neural connections of the pontine reticular formation, which connects reciprocally with the nucleus prepositus hypoglossi in the rat. Neuroscience. 1999;93:195–208. doi: 10.1016/s0306-4522(99)00151-7. [DOI] [PubMed] [Google Scholar]
- Jero J, Coling ED, Lalwani KA. The Use of Preyer’s Reflex in Evaluation of Hearing in Mice. 2015;121:1–7. [PubMed] [Google Scholar]
- Jones EG. Chemically Defined Parallel Pathways in the Monkey Auditory System. Annals of the New York Academy of Sciences. 2003:218–233. doi: 10.1196/annals.1284.033. [DOI] [PubMed] [Google Scholar]
- Justus D, Dalügge D, Bothe S, Fuhrmann F, Hannes C, Kaneko H, Friedrichs D, Sosulina L, Schwarz I, Elliott DA, et al. Glutamatergic synaptic integration of locomotion speed via septoentorhinal projections. Nat Neurosci. 2017;20:16–19. doi: 10.1038/nn.4447. [DOI] [PubMed] [Google Scholar]
- Kandler K, Herbert H. Auditory projections from the cochlear nucleus to pontine and mesencephalic reticular nuclei in the rat. Brain Res. 1991;562:230–242. doi: 10.1016/0006-8993(91)90626-7. [DOI] [PubMed] [Google Scholar]
- Koch M, Schnitzler HU. The acoustic startle response in rats—circuits mediating evocation, inhibition and potentiation. Behav Brain Res. 1997;89:35–49. doi: 10.1016/s0166-4328(97)02296-1. [DOI] [PubMed] [Google Scholar]
- Kotak VC, Mowery TM, Sanes DH. Characterization of auditory synaptic inputs to gerbil perirhinal cortex. Front Neural Circuits. 2015;9:1–8. doi: 10.3389/fncir.2015.00040. [DOI] [PMC free article] [PubMed] [Google Scholar]
- LeDoux J. Rethinking the Emotional Brain. Neuron. 2012;73:653–676. doi: 10.1016/j.neuron.2012.02.004. [DOI] [PMC free article] [PubMed] [Google Scholar]
- LeDoux JE, Ruggiero DA, Reis DJ. Projections to the subcortical forebrain from anatomically defined regions of the medial geniculate body in the rat. J Comp Neurol. 1985;242:182–213. doi: 10.1002/cne.902420204. [DOI] [PubMed] [Google Scholar]
- LeDoux JE, Farb C, Ruggiero DA. Topographic organization of neurons in the acoustic thalamus that project to the amygdala. J Neurosci. 1990;10:1043–1054. doi: 10.1523/JNEUROSCI.10-04-01043.1990. [DOI] [PMC free article] [PubMed] [Google Scholar]
- Lee Y, Lbpez DE, Meloni EG, Davis’ M. A Primary Acoustic Startle Pathway: Obligatory Role of Cochlear Root Neurons and the Nucleus Reticularis Pontis Caudalis. J Neurosci. 1996;16:3775–3789. doi: 10.1523/JNEUROSCI.16-11-03775.1996. [DOI] [PMC free article] [PubMed] [Google Scholar]
- Letzkus JJ, Wolff SBE, Meyer EMM, Tovote P, Courtin J, Herry C, Lüthi A. A disinhibitory microcircuit for associative fear learning in the auditory cortex. Nature. 2011;480:331–335. doi: 10.1038/nature10674. [DOI] [PubMed] [Google Scholar]
- Li Y, Xu J, Liu Y, Zhu J, Liu N, Zeng W, Huang N, Rasch MJ, Jiang H, Gu X, et al. A distinct entorhinal cortex to hippocampal CA1 direct circuit for olfactory associative learning. Nat Neurosci. 2017;20:559–570. doi: 10.1038/nn.4517. [DOI] [PubMed] [Google Scholar]
- Liang F, Xiong XR, Zingg B, Ji XY, Zhang LI, Tao HW. Sensory Cortical Control of a Visually Induced Arrest Behavior via Corticotectal Projections. Neuron. 2015;86:755–767. doi: 10.1016/j.neuron.2015.03.048. [DOI] [PMC free article] [PubMed] [Google Scholar]
- Lingenhohl K, Friauf E. Giant neurons in the rat reticular formation: a sensorimotor interface in the elementary acoustic startle circuit? J Neurosci. 1994;14:1176–1194. doi: 10.1523/JNEUROSCI.14-03-01176.1994. [DOI] [PMC free article] [PubMed] [Google Scholar]
- Liu BH, Li YT, Ma WP, Pan CJ, Zhang LI, Tao HW. Broad inhibition sharpens orientation selectivity by expanding input dynamic range in mouse simple cells. Neuron. 2011;71:542–554. doi: 10.1016/j.neuron.2011.06.017. [DOI] [PMC free article] [PubMed] [Google Scholar]
- Lovett-Barron M, Kaifosh P, Kheirbek MA, Danielson N, Zaremba JD, Reardon TR, Turi GF, Hen R, Zemelman BV, Losonczy A. Dendritic Inhibition in the Hippocampus Supports Fear Learning. Science (80-) 2014;343:857–863. doi: 10.1126/science.1247485. [DOI] [PMC free article] [PubMed] [Google Scholar]
- Madisen L, Zwingman TA, Sunkin SM, Oh SW, Zariwala HA, Gu H, Ng LL, Palmiter RD, Hawrylycz MJ, Jones AR, et al. A robust and high-throughput Cre reporting and characterization system for the whole mouse brain. Nat Neurosci. 2010;13:133–140. doi: 10.1038/nn.2467. [DOI] [PMC free article] [PubMed] [Google Scholar]
- Miller CL, Freedman R. Medial septal neuron activity in relation to an auditory sensory gating paradigm. Neuroscience. 1993;55:373–380. doi: 10.1016/0306-4522(93)90506-b. [DOI] [PubMed] [Google Scholar]
- Moxon KA, Gerhardt GA, Bickford PC, Austin K, Rose GM, Woodward DJ, Adler LE. Multiple single units and population responses during inhibitory gating of hippocampal auditory response in freely-moving rats. Brain Res. 1999;825:75–85. doi: 10.1016/s0006-8993(99)01187-7. [DOI] [PubMed] [Google Scholar]
- Nader K, Schafe GE, Le Doux JE. Fear memories require protein synthesis in the amygdala for reconsolidation after retrieval. Nature. 2000;406:722–726. doi: 10.1038/35021052. [DOI] [PubMed] [Google Scholar]
- Oh SW, Harris JA, Ng L, Winslow B, Cain N, Mihalas S, Wang Q, Lau C, Kuan L, Henry AM, et al. A mesoscale connectome of the mouse brain. Nature. 2014;508:207–214. doi: 10.1038/nature13186. [DOI] [PMC free article] [PubMed] [Google Scholar]
- PITKÄNEN A, PIKKARAINEN M, NURMINEN N, YLINEN A. Reciprocal Connections between the Amygdala and the Hippocampal Formation, Perirhinal Cortex, and Postrhinal Cortex in Rat: A Review. Ann N Y Acad Sci. 2006;911:369–391. doi: 10.1111/j.1749-6632.2000.tb06738.x. [DOI] [PubMed] [Google Scholar]
- Robinson J, Manseau F, Ducharme G, Amilhon B, Vigneault E, El Mestikawy S, Williams S. Optogenetic Activation of Septal Glutamatergic Neurons Drive Hippocampal Theta Rhythms. J Neurosci. 2016;36:3016–3023. doi: 10.1523/JNEUROSCI.2141-15.2016. [DOI] [PMC free article] [PubMed] [Google Scholar]
- Romand E. The central auditory system. Oxford: 1997. [Google Scholar]
- Romanski LM, LeDoux JE. Equipotentiality of thalamo-amygdala and thalamo-cortico-amygdala circuits in auditory fear conditioning. J Neurosci. 1992;12:4501–4509. doi: 10.1523/JNEUROSCI.12-11-04501.1992. [DOI] [PMC free article] [PubMed] [Google Scholar]
- Rummell BP, Klee JL, Sigurdsson T. Attenuation of Responses to Self-Generated Sounds in Auditory Cortical Neurons. J Neurosci. 2016;36:12010–12026. doi: 10.1523/JNEUROSCI.1564-16.2016. [DOI] [PMC free article] [PubMed] [Google Scholar]
- Saunders A, Granger AJ, Sabatini BL. Corelease of acetylcholine and GABA from cholinergic forebrain neurons. Elife. 2015;2015 doi: 10.7554/eLife.06412. [DOI] [PMC free article] [PubMed] [Google Scholar]
- Sparta DR, Smithuis J, Stamatakis AM, Jennings JH, Kantak PA, Ung RL, Stuber GD. Inhibition of projections from the basolateral amygdala to the entorhinal cortex disrupts the acquisition of contextual fear. Front Behav Neurosci. 2014;8:6–11. doi: 10.3389/fnbeh.2014.00129. [DOI] [PMC free article] [PubMed] [Google Scholar]
- Tao C, Zhang G, Zhou C, Wang L, Yan S, Tao HW, Zhang LI, Zhou Y, Xiong Y. Diversity in Excitation-Inhibition Mismatch Underlies Local Functional Heterogeneity in the Rat Auditory Cortex. Cell Rep. 2017;19:521–531. doi: 10.1016/j.celrep.2017.03.061. [DOI] [PMC free article] [PubMed] [Google Scholar]
- Tervo DGR, Hwang BY, Viswanathan S, Gaj T, Lavzin M, Ritola KD, Lindo S, Michael S, Kuleshova E, Ojala D, et al. A Designer AAV Variant Permits Efficient Retrograde Access to Projection Neurons. Neuron. 2016;92:372–382. doi: 10.1016/j.neuron.2016.09.021. [DOI] [PMC free article] [PubMed] [Google Scholar]
- Van Strien NM, Cappaert NLM, Witter MP. The anatomy of memory: An interactive overview of the parahippocampal- hippocampal network. Nat Rev Neurosci. 2009;10:272–282. doi: 10.1038/nrn2614. [DOI] [PubMed] [Google Scholar]
- Vinogradov OS. Functional organization of the limbic system in the process of registration of information: facts and hypotheses. In: Issacson RL, Pribram KH, editors. The hippocampus. New York, London: Springer; 1975. [Google Scholar]
- Wan H, Warburton EC, Kusmierek P, Aggleton JP, Kowalska DM, Brown MW. Fos imaging reveals differential neuronal activation of areas of rat temporal cortex by novel and familiar sounds. Eur J Neurosci. 2001;14:118–124. doi: 10.1046/j.0953-816x.2001.01625.x. [DOI] [PubMed] [Google Scholar]
- Webster DB, Popper AN, Fay RR. The Mammalian auditory pathway: neuroanatomy 1992 [Google Scholar]
- Wickersham IR, Finke S, Conzelmann KK, Callaway EM. Retrograde neuronal tracing with a deletion-mutant rabies virus. Nat Methods. 2007;4:47–49. doi: 10.1038/NMETH999. [DOI] [PMC free article] [PubMed] [Google Scholar]
- Winer JA. The functional architecture of the medial geniculate body and the primary auditory cortex. In: Webster DB, Popper AN, Fay RR, editors. The Mammalian auditory pathway: neuroanatomy. New York: Springer-Verlag; 1992. [Google Scholar]
- Winer JA, Schreiner CE, SpringerLink (Online service) The Auditory Cortex. Boston, MA: Springer Science+Business Media, LLC; 2011. p. 1. online resource. [Google Scholar]
- Wolff SBE, Gründemann J, Tovote P, Krabbe S, Jacobson GA, Müller C, Herry C, Ehrlich I, Friedrich RW, Letzkus JJ, et al. Amygdala interneuron subtypes control fear learning through disinhibition. Nature. 2014;509:453–458. doi: 10.1038/nature13258. [DOI] [PubMed] [Google Scholar]
- Xiong XR, Liang F, Li H, Mesik L, Zhang KK, Polley DB, Tao HW, Xiao Z, Zhang LI. Interaural level difference-dependent gain control and synaptic scaling underlying binaural computation. Neuron. 2013;79:738–753. doi: 10.1016/j.neuron.2013.06.012. [DOI] [PMC free article] [PubMed] [Google Scholar]
- Xiong XR, Liang F, Zingg B, Ji X, Ibrahim LA, Tao HW, Zhang LI. Auditory cortex controls sound-driven innate defense behaviour through corticofugal projections to inferior colliculus. Nat Commun. 2015;6:7224. doi: 10.1038/ncomms8224. [DOI] [PMC free article] [PubMed] [Google Scholar]
- Xu M, Chung S, Zhang S, Zhong P, Ma C, Chang WC, Weissbourd B, Sakai N, Luo L, Nishino S, et al. Basal forebrain circuit for sleep-wake control. Nat Neurosci. 2015;18:1641–1647. doi: 10.1038/nn.4143. [DOI] [PMC free article] [PubMed] [Google Scholar]
- Yao JD, Bremen P, Middlebrooks JC. Transformation of spatial sensitivity along the ascending auditory pathway. J Neurophysiol. 2015;113:3098–3111. doi: 10.1152/jn.01029.2014. [DOI] [PMC free article] [PubMed] [Google Scholar]
- Yeomans JS, Li L, Scott BW, Frankland PW. Tactile, acoustic and vestibular systems sum to elicit the startle reflex. Neurosci Biobehav Rev. 2002;26:1–11. doi: 10.1016/s0149-7634(01)00057-4. [DOI] [PubMed] [Google Scholar]
- Zhang LI, Zhou Y, Tao HW. Perspectives on: Information and coding in mammalian sensory physiology: Inhibitory synaptic mechanisms underlying functional diversity in auditory cortex. J Gen Physiol. 2011;138:311–320. doi: 10.1085/jgp.201110650. [DOI] [PMC free article] [PubMed] [Google Scholar]
- Zhou M, Li YT, Yuan W, Tao HW, Zhang LI. Synaptic mechanisms for generating temporal diversity of auditory representation in the dorsal cochlear nucleus. J Neurophysiol. 2015;113:1358–1368. doi: 10.1152/jn.00573.2014. [DOI] [PMC free article] [PubMed] [Google Scholar]
- Zhou M, Liang F, Xiong XR, Li L, Li H, Xiao Z, Tao HW, Zhang LI. Scaling down of balanced excitation and inhibition by active behavioral states in auditory cortex. Nat Neurosci. 2014;17:841–850. doi: 10.1038/nn.3701. [DOI] [PMC free article] [PubMed] [Google Scholar]
- Zhou M, Tao HW, Zhang LI. Generation of intensity selectivity by differential synaptic tuning: fast-saturating excitation but slow-saturating inhibition. J Neurosci. 2012;32:18068–18078. doi: 10.1523/JNEUROSCI.3647-12.2012. [DOI] [PMC free article] [PubMed] [Google Scholar]
- Zingg B, Hintiryan H, Gou L, Song MY, Bay M, Bienkowski MS, Foster NN, Yamashita S, Bowman I, Toga AW, et al. Neural networks of the mouse neocortex. Cell. 2014;156:1096–1111. doi: 10.1016/j.cell.2014.02.023. [DOI] [PMC free article] [PubMed] [Google Scholar]
- Zingg B, lin Chou X, gang Zhang Z, Mesik L, Liang F, Tao HW, Zhang LI. AAV-Mediated Anterograde Transsynaptic Tagging: Mapping Corticocollicular Input-Defined Neural Pathways for Defense Behaviors. Neuron. 2017;93:33–47. doi: 10.1016/j.neuron.2016.11.045. [DOI] [PMC free article] [PubMed] [Google Scholar]
Associated Data
This section collects any data citations, data availability statements, or supplementary materials included in this article.