Abstract
Motor imagery-based (MI based) brain-computer interface (BCI) using electroencephalography (EEG) allows users to directly control a computer or external device by modulating and decoding the brain waves. A variety of factors could potentially affect the performance of BCI such as the health status of subjects or the environment. In this study, we investigated the effects of soft drinks and regular coffee on EEG signals under resting state and on the performance of MI based BCI. Twenty-six healthy human subjects participated in three or four BCI sessions with a resting period in each session. During each session, the subjects drank an unlabeled soft drink with either sugar (Caffeine Free Coca-Cola), caffeine (Diet Coke), neither ingredient (Caffeine Free Diet Coke), or a regular coffee if there was a fourth session. The resting state spectral power in each condition was compared; the analysis showed that power in alpha and beta band after caffeine consumption were decreased substantially compared to control and sugar condition. Although the attenuation of powers in the frequency range used for the online BCI control signal was shown, group averaged BCI online performance after consuming caffeine was similar to those of other conditions. This work, for the first time, shows the effect of caffeine, sugar intake on the online BCI performance and resting state brain signal.
Index Terms: Brain-computer Interface, BCI, Caffeine, electroencephalography, EEG, soft drink
I. Introduction
Brain-computer interfaces (BCI) have shown promise to re-establish the connection between brain and the outside world for both healthy human subjects and patients who suffer from severe neuromuscular disorders including muscular dystrophy, stroke, and spinal cord injury [1]. MI based BCI using electroencephalography (EEG) has demonstrated to control virtual cursor [2] and virtual helicopter [3,4], as well as physical devices such as drone [5,6], wheelchair [7], and robotic arm [8]. Noninvasive EEG-based BCI has attracted many interests, including new algorithm exploration [9–13], and new paradigm designs [14–18].
The modulation of sensorimotor rhythm (SMR) through motor imagination has been studied broadly in various applications [2–10, 19, 20]. Particularly, MI based BCI have been used in the rehabilitation such as after stroke or spinal cord injury [21, 22]. However, the performance of SMR-BCI varies substantially among different subjects and among sessions for the same subject even if the same decoding algorithm is used throughout the whole process due to subjects’ learning [23, 24], inconsistent modulation strategy [25] or brain stimulation [26], as well as other non-learning factors such as the shifting of electrode position [27], and changing of skin condition [28]. Previous studies show that medication experience, motivations for the experiment as well as other factors might positively affect online BCI performance [24, 29,30]. On the contrary, fatigues and slight alteration in electrode positions, among other reasons, have shown negative effects on BCI performance [29, 30]. Previous studies show that human caffeine consumption might be beneficial on the maintenance of attention [31–33], which implies that it might somehow counteract with the detrimental fatigue to potentially maintain or increase BCI performance. However, previous studies also show that there is a global reduction in EEG power of the alpha frequency band and a global increase shift of alpha frequency accompanying consumption of caffeine during resting state [31]. The SMR includes both alpha and beta rhythms [34] and thus might be affected by both the reduction of power and shift of frequency. These factors altogether confound the effect of caffeine on the performance of BCI, which has not been investigated before, to the best of our knowledge. Preliminary results from this work were presented in IEEE EMBC conference [35]. This paper reports our completed work, extending from the conference presentation [35], with more subjects being recruited and additional experiments being added. Because caffeine is one of the world’s most commonly used stimulant [36] and a great amount of caffeine intake is consumed through soft drinks, this work aims to investigate the effect of caffeine and sugar intake on the MI based BCI performance and resting state (RS) brain signals in the alpha and beta frequency bands after soft drink consumption.
II. Methods
A. Experimental Setup
Twenty-six healthy volunteers (eleven females, one left handed) participated in this study and were divided into two groups. Their ages ranged from 18 to 38 years old with mean age of 22.8±4.1. All of the participants in this study were mild or moderate caffeine consumers (i.e. they regularly consumed 1–3 or less cups of coffee or cola equivalent daily). Twelve subjects in the first group were seated in front of a computer screen in a distance of around 90 cm..64-channel EEG signals were recorded using a Neuroscan Synamps RT system at a sampling frequency of 1000 Hz and band-pass filtered from 0.5 – 200Hz. The electrode on the vertex and forehead were used as reference and ground, respectively. All electrode impedances were maintained below 5 kΩ. A notch filter of 60Hz was applied to the raw EEG signals. Later, fourteen subjects in a second group were using 64-channel Biosemi EEG cap with active electrodes and an Active Two amplifier to record the EEG signals at a sampling frequency of 1024 Hz. Conductive gel (SignaGel, Cortech Solutions) was applied to reduce electrodes offsets to below 20 mV for EEG electrodes. Two electrodes near channel POz (CMS and DRL) were used as reference and ground.
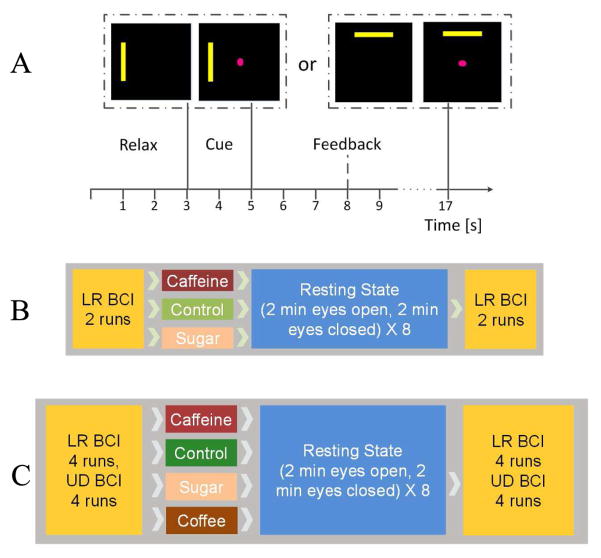
The algorithm extracted power spectrum of mu rhythm (10 –14Hz) from electrodes above the motor cortex (channel C3 and C4) by fitting an autoregressive (AR) model. The difference of power spectral signals between the two electrodes (C3 and C4) over two hemispheres was used as the control signal and normalized by a normalizer in BCI2000 [3]. In each BCI run, a one-dimensional (1D) cursor control task with Left-Right or Up-Down cursor control was tested, At the beginning of each BCI trial, a yellow rectangular target appeared on the left/right or top/bottom side of the computer screen for two seconds indicating which side of hand motor imagination the subject should perform. Then a circular cursor was displayed in the center of the screen, providing feedback and indicating that the user should begin motor imagination. Subjects were instructed to imagine movement of their left or right hand to move the cursor left or right, imagine movement of both hands versus relaxation to move the cursor up and down. In each trial subjects try to control the cursor to contact the target (hit) in an average feedback period of three seconds before the cursor incorrectly contacted an invisible target bar on the opposite side of the screen (miss). Otherwise, it was an abort if the 12 second time limit was reached but the cursor did not reach neither the correct or incorrect target. After the trial, cursor disappeared and the subject could have a short relaxing period of three seconds. The BCI trial structure was shown on Fig. 1A.
Fig. 1. Experimental design.
A. Trial structure for cursor movement BCI control using left vs. right-hand or both-hands vs. relaxation motor imagery. B. Experimental procedure during each session for group one: BCI control before soft drink ingestion, resting state EEG acquiring with eyes open and closed intermittently right after soft drink administration, and BCI control when caffeine effects are approximately maximum after soft drink ingestion. C. Similar Experimental procedure for group two with a fourth session in which regular coffee was offered to the participants.
B. Study Design
The experimental procedures involving human subjects described in the current study were approved by the Institutional Review Board (IRB) of the University of Minnesota. In the first group, each of the twelve subjects participated in three sessions of BCI online experiment over a period of one to three weeks. Their participating time of each day was mostly held constant for each subject. All of subjects were instructed not to have caffeine or a substantial amount of sugar in the four hours before their scheduled session. In each session, the subjects were asked to perform two runs of Left-Right BCI cursor control with 30 trials in each run. Between each run there was a short break of one to five minutes according to subjects’ willingness. The cursor did not move for the first trial of the first run, it was served as a calibration trial buffering data to initialize the normalizer, but subjects were still required to perform the imagination accordingly. After the first trial of the first run, the feedback was provided to subjects. Then the subjects were offered a soft drink (Coca-Cola variant) with either 46 mg caffeine, 39g sugar, or neither substance (considered as control) in each session on separate days. Since there were three types of soft drink, six drink order permutations could be generated. The type of drink for each session was randomized across the twelve subjects to fully use the permutations twice. The subjects were given around five minutes to consume the 12 oz. drink; they were blinded to the type of soft drink they consumed in each session. Then 32 minutes of resting state period were followed and EEG data were recorded during this period, where subjects were instructed to open and close their eyes every two minutes. There were both visual and audio cues to indicate when the subjects should alternate between opening and closing eyes. The reason of choosing 32 minutes resting state is that caffeine plasma concentration approach to maximum after about 30 minutes and its effect last for a few hours [31]. After the resting state when the caffeine effects approximately approached maximum, subjects performed two post-soft drink runs of Left-Right BCI cursor control [8] and the first trial of the first run was used as the calibration trial as well. The procedure of the experiment is illustrated in Fig. 1B. In the second group, each of the fourteen subjects participated in four sessions of BCI online experiments with similar requirement of time interval between sessions and no caffeine and sugar consumption four hours before the experiment as group one did. In the first three sessions, the same soft drinks and dink order permutations were given to the participants; additionally, each of them took a fourth session with a regular coffee (Green Mountain K-cup Coffee, Dark Magic (Extra Bold)) of 12 oz with about 75 –120 mg caffeine. In each session, each subject completed four runs of 20 Left-Right BCI trials and four runs of 20 Up-Down BCI trials before consuming the selected drink. Then a similar 32 minutes of resting state EEG data were collected. Finally, the L/R and U/D BCI control were repeated. The procedure of the experiment is illustrated in Fig. 1C.
C. BCI Performance Analysis
Online performance of BCI cursor task was analyzed by grouping the sessions consisted of same type of soft drink together to compare how soft drink consumption altered BCI control signals and performance. A two-way repeated measure ANOVA was used to test whether the different types of soft drink cause any significant difference of BCI online performance and whether there was any difference before and after the 32 minutes’ resting period. Percent Valid Correct (PVC) was calculated and used as the online performance metric for each run. PVC was the percent of hit trials dividing by the total number of trials excluding those trials which resulted in a abort. BCI runs before and after soft drink consumption were grouped together by the type of drink and then were averaged across subjects. In total, there were 12 PVC values were averaged for the first group to compare performance before and after soft drink consumption based on the drink type and 14 PVC values were averaged for the second group.
D. Resting State EEG Analysis
EEG data during the resting state period were analyzed to evaluate how frequency band power, especially alpha and beta rhythms - the rhythms of interest, were affected by the consumption of each drink. The MATLAB toolbox EEGLAB [37] was used to analyze the resting state EEG data. Bad channels were firstly removed; data were down sampled to 250 Hz/256 Hz for Neuroscan data and Biosemi data, respectively. Then the data were re-referenced to the common average reference and were epoched into the two minute eyes open or closed segments. Finally, these two minute segments were segmented into 2 second epochs. All of epochs were plotted sequentially to remove individual epochs contaminated by obvious artifacts through visual inspection. Epochs with obvious noise like muscle movement contamination were discarded manually. The remaining two second epochs for each of two minute eyes open and eyes closed period were used to estimate the power spectrum by autoregressive (AR) spectrum estimation individually and then averaged to get the power spectrum for each two minutes. Results in eyes open epochs were focused in the result analysis because eyes were open during the online BCI control task. The frequency power was calculated for each channel within each cleaned epoch. The power was averaged across all channels except those which were identified as bad channels by visual inspection in order to calculate the global average power. Then the power values in the alpha band (10–14 Hz) and beta band (14–26 Hz) were each extracted to yield two band power averages per 2 minute period, for each subject, and each type of soft drink consumed. The average band powers were grouped by the soft drink consumed during the session and averaged over clean epochs identified by visual inspection in each two minute epochs. The power spectra were plotted to compare the average alpha and beta band power among different drink groups and across the eyes opening periods of the resting state period. In order to calculate the channel C3 and C4 average, the previous steps were repeated but only data from channel C3 and C4 were averaged.
Resting state power during inter-trial interval of BCI control runs were calculated for runs of pre- and post-drink consumption separately with respect to channel C3 + C4. Signals of individual inter-trial interval during each BCI control trial (i.e. 3 seconds duration when the screen was blank and subjects were relaxed) went through visual inspection, removing artifact-contaminated trials. Then power spectra of remained inter-trial intervals were estimated for each subjects pre- and post-drink consumption separately in the frequency bands of 6–31 Hz including alpha (α, 10–14Hz) and beta (β, 14–26Hz) rhythms. The power spectrum was then used to calculate the power change ratio between post-drink consumption and pre-drink consumption for each subject and group results were averaged over all subjects for each condition.
Topographies of band powers in alpha and beta frequency bands of all of channels were plotted across the eyes open periods of the 32 minutes’ resting period. The band powers in alpha and beta frequency bands of all channels were calculated similarly to the previous steps. Additionally, independent component analysis (ICA) was performed on the 32 minutes’ resting state data for each subject and each session; obvious artifacts contaminated segments were removed before data was input to perform ICA. The components which were visually inspected as artifacts according to experience were removed; the signals were reconstructed from the clean ICA components and used for further analysis of topography. To get an average topography across the resting state for each condition, the topography for band powers of alpha and beta frequency bands were normalized for each subject by the maximum value of band power in three or four conditions for each individual and then averaged across subjects. The normalization was used to alleviate the bias towards the topography of those subjects showing the strongest band power activity and let each subject contribute equally for the average topography.
III. Results
Throughout the study, two primary aspects of the data were quantitatively analyzed: effects of soft drinks on BCI online performance due to the consumption of each type of soft drink or a regular coffee and the change of resting state EEG signals in the frequency band of alpha and beta bands which are highly related to the MI based BCI control signals.
A. BCI online performance
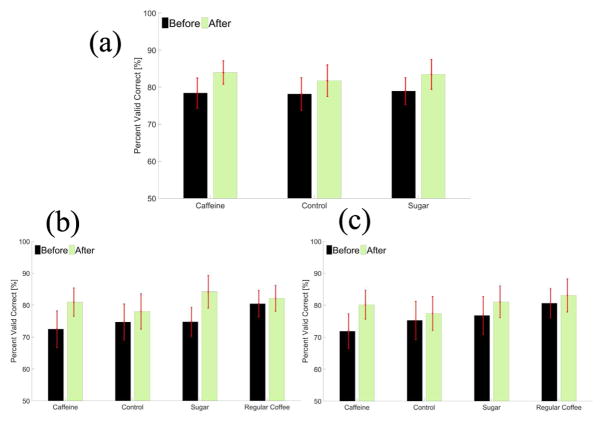
Group average PVC of L/R cursor control for all of the twenty-six subjects in two groups is shown before and after each drink in Fig. 2a. BCI average performance is increased after all of three soft drinks and a 32 minutes resting state. The group average PVC of L/R cursor control before and after consumption of each drink for only the second group is displayed in Fig. 2b. Similarly, the group average PVC of U/D cursor control before and after consumption of each drink for the second group is displayed in Fig. 2c. For the second group, a two-way repeated measures ANOVA with two within-subject factors, i.e.. drink type and test time (before or after consumption of the drinks), was performed for both L/R cursor control and U/D cursor control, respectively. For L/R cursor control, the statistics for the main effect of test time is F(1,13) = 8.20, p<0.05, n2 = 0.03 (generalized Eta-Squared measure of effect size); main effect of drink type is F(3,39) = 0.24, p = 0.87, n2 = 0.01; interaction effect of test time and drink type is F(3,39) = 0.91, p = 0.45, n2 = 0.01. For U/D cursor control, similar results were shown. The statistics for the main effect of test time is F(1,13) = 4.09, p = 0.06, n2 = 0.01; main effect of drink type is F(3,39) = 0.28, p = 0.84, n2 = 0.02; interaction effect of test time and drink type is F(3,39) = 0.54, p = 0.66, n2 = 0.01. Additionally, two-way repeated measures ANOVA was performed for the L/R cursor control in the combination of two groups, 26 subjects altogether (as shown in Fig. 2a). The statistics for the main effect of test time is F(1,25) = 7.94, p < 0.01, n2 = 0.01; main effect of drink type is F(2,50) = 0.04, p = 0.96, n2 <0.001; interaction effect of test time and drink type is F(2,50) = 0.15, p = 0.86, n2 <0.001. Thus, the statistical analysis support the hypothesis that there is no significant difference of PVC performance between before and after each type of drink, whether it contains caffeine, sugar or neither, but there is a significant difference of PVC performance before and after the resting state of 32 minutes.
Fig. 2.
(a) Average PVC performance evaluation of L/R cursor control including both group one and group two ± standard error mean (SEM) for each soft drink group before and after coke consumption. (b) Average PVC performance measure of L/R cursor control for group two ± standard error mean (SEM) for each drink group before and after drink consumption. (c) Average PVC performance measure of U/D cursor control for group two ± standard error mean (SEM) for each drink group before and after drink consumption.
B. Drink-induced BCI inter-trial interval power change ratio
In this section, the short resting state power in between each task trials (i.e. inter-trial interval) before and after the drink consumption was analyzed. The power change ratio of resting state power during BCI inter-trial interval induced by drink consumption is shown in Fig. 3. After the consumption of caffeine (red line, black line), there is a slight decrease of power spectrum between 12Hz to 29Hz. However, there are increasing change of power spectrum in control group (green line) and sugary group (blue line) for alpha rhythm (8–14Hz) and lower beta rhythm (14 – 21Hz) after the drink consumption compared to before the drink consumption. The power change ratio for the group of control shows value in between caffeine group and sugary intake group.
Fig. 3.
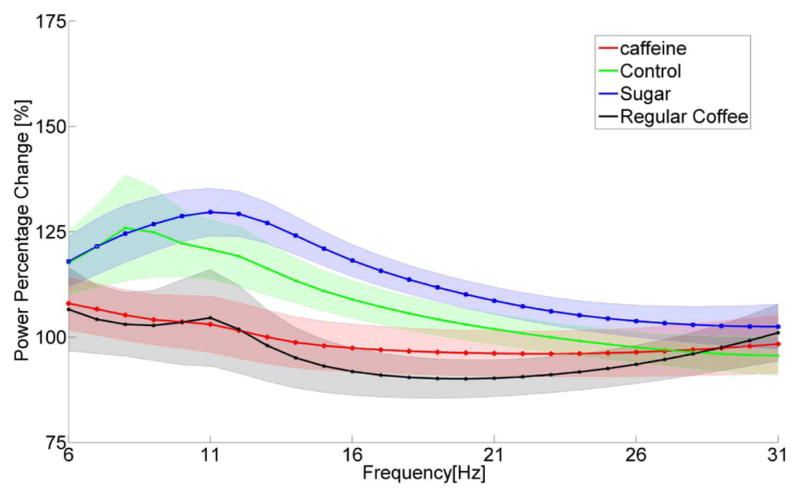
Group average power change ratio of resting state power ± standard errors of the mean (SEM) during inter-trial interval of BCI control between post and pre drink consumption with respect to channel C3 + C4. Power of inter-trial interval during BCI control is estimated by AR for each subjects pre and post drink consumption separately in the frequency bands of 6–31 Hz including alpha (α, 10–14Hz) and beta (β, 14–26Hz) rhythms. Then the power spectrum is used to calculate the power change ratio between post drink consumption and pre drink consumption for each subject and is averaged across subjects to get the group average.
C. Change of resting state power since drink consumption
The change of resting state power of alpha and beta frequency bands during those eyes open periods for the four conditions in the average of channels C3 and C4 are shown in Fig. 4, subplot (a) and subplot (b), respectively. A substantial difference between power values of caffeine/regular coffee and control/sugary group is shown for both alpha and beta frequency bands. For channels C3+C4, average alpha and beta power is substantially lower in the caffeine/regular coffee group compared to the control/sugary group. This trend seems to continue throughout the duration of the resting state period. Power values in the sugary group for channels C3+C4 show similar activities and trend in between those of two caffeine groups and those of control group.
Fig. 4.
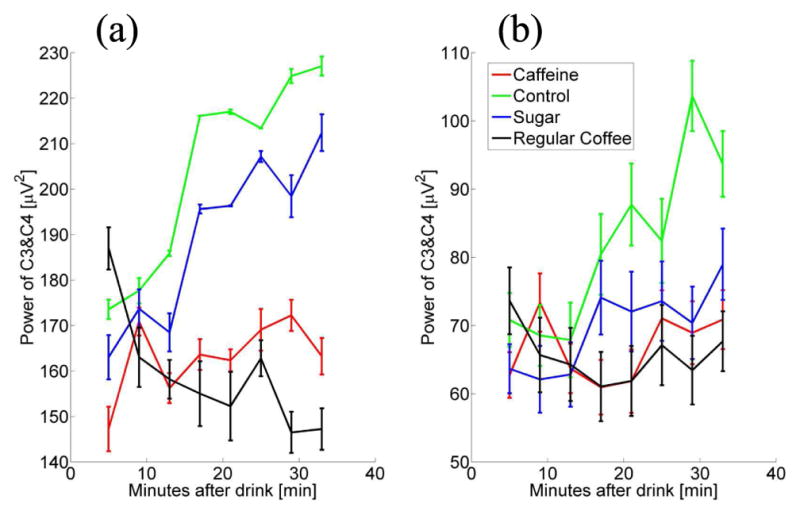
Average channel C3 +C4 resting state power for eyes open periods. Power is calculated by alpha (α, 10–14Hz) and beta (β, 14–26Hz) frequency bands separately and averaged across each two minute eyes open periods for each drink group. Power values (unit, μV2) for drink conditions are represented via color lines and organized by number of minutes since drink consumption. (a) Power in the alpha frequency band; (b) Power in the beta frequency band.
The change of resting state power in the alpha and beta frequency bands for the four conditions during the eyes open periods in both the average channels C3+C4 and global average of all the channels are shown in Fig. 5. The global average of both alpha and beta activities shows similar trend as those of only average of channels C3 + C4, but they have higher average values compared to the average of only channels C3 + C4. Similarly, the resting state power for the group of control and sugar ends up with higher values than the two caffeine groups for both alpha and beta frequency bands, in both average of channels C3 + C4 and global average. The results for the eyes closed periods are presented in Fig. 6. The general trends shown in the eyes open periods seem still hold for the eyes closed period. But since the alpha rhythm is dominating during the eye closed periods, the resting state powers for all of conditions are in general much higher than the counterparts during the eyes open periods and the trends are slightly less clear in eyes closed condition.
Fig. 5.
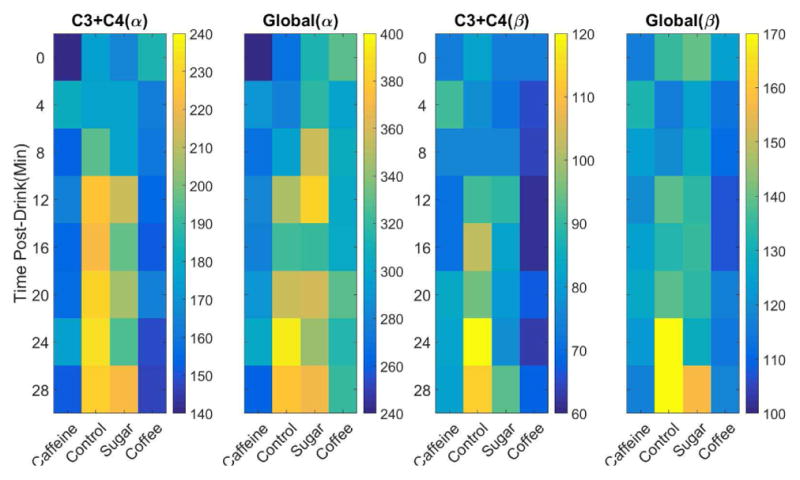
Average channel C3 + C4 and global average of resting state power for eyes open periods. Power is calculated by alpha (α, 10–14Hz) and beta (β, 14–26Hz) frequency bands separately and averaged across each two minutes eye open periods for each drink group. Power values (unit, μV2) are represented via color where a color bar shows the scale of value for each panel and ordered by number of minutes since the soft drink consumption.
Fig. 6.
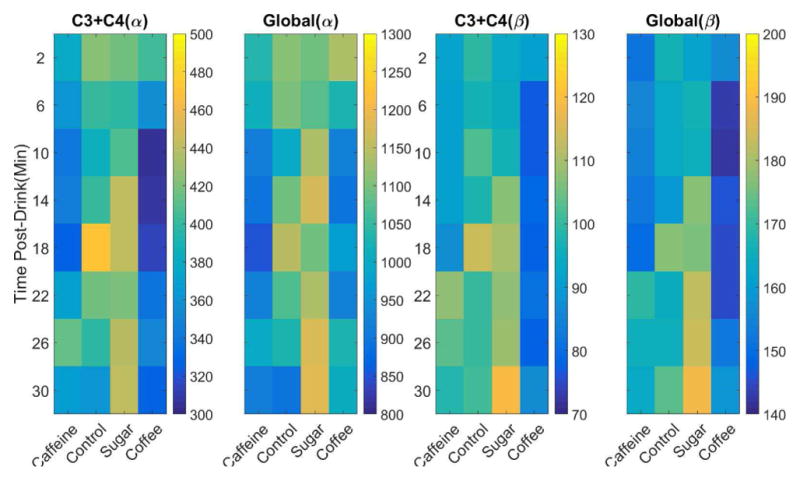
Average channel C3 + C4 and global average of resting state power for eyes closed periods. Power is calculated by alpha (α, 10–14Hz) and beta (β, 14–26Hz) frequency bands separately and averaged across each two minutes eye closed periods for each drink group. Power values (unit, μV2) are represented via color where a color bar shows the scale of value for each panel and ordered by number of minutes since the soft drink consumption.
D. Group average topographies of alpha, beta power during eyes open epochs
Group average topographies of alpha power during each two minute eyes open epochs across the resting state are displayed in Fig. 7. The alpha powers distribute similarly at the beginning (0 minute). A trend of increasing posterior alpha powers is displayed throughout the resting state period for the conditions of control and sugary consumption. Alpha power in the group of caffeine and regular coffee consumption does not show a clear trend of increasing activities relative to that of control and sugar group. This is in accordance with the previous results of change of global average of resting state power.
Fig. 7.
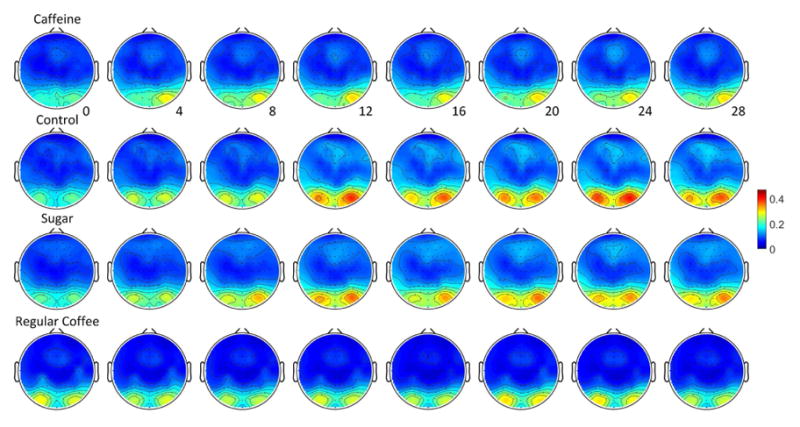
Topographies of alpha band power were averaged over all subjects and sessions for each condition. Topographies of each individual were normalized by the maximum alpha values of band power among the four drink conditions and then averaged across subjects. The top, second, third and bottom rows displayed alpha power changes (unit, normalized value) during the eyes open epochs across time (minutes) after the soft drink consumption of caffeine, no ingredient, sugar or regular coffee.
Similarly, group average topographies of beta power during each two minute eyes open epochs across the resting state are displayed in Fig. 8. The beta powers like the alpha powers distribute similarly at the beginning (0 minute). A slightly increasing posterior and frontal beta activities are displayed during the resting state period for both the control group and sugary drink group as well but does not clearly show for the caffeine and regular coffee group. The normalized average beta activities in general show similar trend as the alpha activities while the normalized beta band powers in frontal areas seems to be stronger compared to the normalized alpha band powers in the frontal area.
Fig. 8.
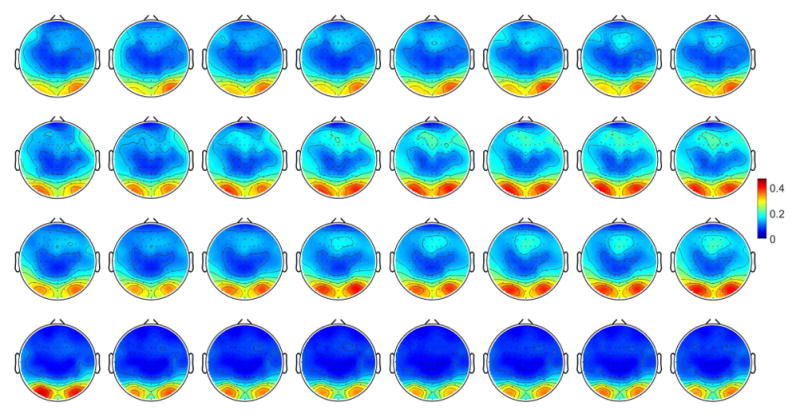
Topographies of beta band power were averaged over all of subjects and sessions for each condition. Topographies of each individual were normalized by the maximum beta values of band power among the four drink conditions and then averaged across subjects. The top, second, third and bottom rows displayed beta power changes (unit, normalized value) during the eyes open epochs across time (minutes) after the soft drink consumption of caffeine, no ingredient, sugar or regular coffee.
IV. Discussion
Altering the underlying spectral powers of brain signals could potentially improve or deteriorate the modulation of the brain rhythms like alpha rhythm (mu rhythm) and beta rhythm. This alteration could improve or hinder BCI user ability to control the peripheral device such as computer cursors or more complex systems like robotic arms. Since previous study has shown that caffeine intake significantly affect the brain signals [31] especially in the frequency range commonly used for SMR based BCI control, the effects of caffeine on BCI online performance are worthy investigating. The change of the BCI performance before and after the soft drink consumption and the alpha and beta rhythms change across the resting state are discussed below.
A. BCI Online Control Performance
Fig. 2 shows that there is no significant difference in BCI performance to either L/R or U/D cursor control after consumption of different drinks. Despite resting state data during inter-trial interval and 32 minutes eyes open and closed state showing decreased power levels after caffeine consumption, these trends do not have a significant effect on BCI performance, which are thought to be relatively intense. Since the online control signals in channel C3 and C4 depends on user modulation of the alpha rhythm around 12 Hz frequency band bilaterally, average power of channel C3 + C4 were decreased by caffeine consumption, thus the amount of possible amplitude change or modulation may be decreased by caffeine consumption which could potentially hinder the BCI performance. A previous study shows that the average power of channel C3 + C4 after removing noise floor has a significantly positive correlation to BCI feedback performance [38], which could be served as a predictor of a new subject’s SMR based BCI performance. With the assumption that noise level was not changed by the drinks, caffeine intake may negatively affect the signal to noise ratio (SNR) of the control signal and decrease task performance. But the online results support the notion that the decreased power amplitudes did not significantly alter the online behavior performance throughout the BCI task. There might be a couple of reasons to explain this difference. First, the previous study shows the correlation between the average power of channel C3 + C4 during a 2 minutes’ resting state epoch with eyes open and a subject’s performance in a group number of 80 subjects, this might not account for the dynamic property of EEG signals for an individual subject. Thus, the correlation might not be generalized to the prediction of an individual subject’s performance variation. Second, caffeine is also known to increase attention and reduce fatigue [32], which may affect positively on BCI performance in addition to decreasing power in alpha and beta rhythm. Thus these positive and negative effects may cancel out each other and result in subjects’ performing after caffeine intake similar to the control and sugary group.
Interestingly, a significant difference of BCI performance was shown before and after the 32 minutes’ resting state, which was shown in section 3.1. This might indicate that learning occurred during the post-drink BCI cursor task compared to the pre-drink BCI cursor task. The learning of BCI control or the trend of improvement on BCI performance was reported on a session-by-session basis previously [8,24], however, this result shows that learning could happen within a session.
B. Resting State EEG
Resting state period and its analysis were included in this study to verify that spectral effects altered by caffeine shown in previous literature were elicited by the design as well and to investigate the details of the spectral altering effect, especially in regard to the control signals in electrodes C3 and C4. As shown in Fig. 5–6, the caffeine consumption did causes a global decrease in alpha and beta power relative to the control and sugary group during a 32 minutes’ resting state with eyes open epochs, which is consistent with the literature [31]. The same trend occurs in the averaged EEG data from average powers of channels C3 and C4 (Fig. 4–6). This decrease of alpha and beta power holds during the BCI inter-trial intervals as well, which is shown in Fig. 3. The caffeinated drink used in this study had less than a fifth of caffeine amount and the regular coffee contained about half amount of caffeine relative to the capsules used in the previous study [31], but these results verify that this experimental design does show similar trends which were reported previously. Regarding the beta frequency band, the same caffeine, control and sugary group trends occur, but the power difference between these groups is less substantial compared to the change in alpha band. Since the power in beta frequency band is not used as BCI control signals in this study, its effect on BCI online performance is unclear. The power values of control and sugary drink conditions show an increasing trend especially in the posterior area during the resting state duration. This power increase may be attributed to subjects reaching states of fatigue or state of drowsiness slowly and gradually, which is in line with subjects’ verbal feedbacks after their experiments. Previous studies of driving fatigue during a driver simulation task do show significant increase of alpha power, but change of beta band power show inconsistent results during and after mental fatigue [39,40]. In the present study we observed gradual increasing of both normalized alpha and beta band power during the resting state for both the control and sugary drink group. In general, the sugary drink and control drink group show similar trends in the change of alpha and beta power during both inter-trial interval of BCI control between post and pre drink condition and 32 minutes’ eyes open and closed epochs. This might indicate the moderate amount of sugar used in this study does not alter the power of EEG signals in alpha and beta frequency bands significantly compared to control condition.
C. Limitations and Future Work
It has to be acknowledged that the effect of caffeine on each person varies due to several factors such as body mass and history of caffeine or caffeinated drink consumption. In this study, the caffeine amount offered to participants was equal without accounting for their weight and the subjects were not grouped according to their history of caffeine or caffeinated drink consumption. The caffeine amount provided in this study is also considerably lower than other caffeine studies [31–33]. However, the caffeinated drink or regular coffee is the most common way for people to consume caffeine, it is meaningful to study their effect on MI based BCI performance even though the amount of caffeine might be low. Another limitation is that the regular coffee session is always the last session without randomizing its sequence, thus both the consumed coffee and three previous sessions possibly affect the performance of this session. But this issue is alleviated since only the change of performance before and after coffee consumption was compared.
It is worthy to investigate whether the results of caffeine effect on MI based BCI still hold for more general BCI paradigms such as P300, SSVEP based BCI in the future. Since posterior alpha and beta are more strongly affected by the caffeine consumption based on the analysis results and the electrodes coverage at the posterior part of head are more important to the detection of P300 and SSVEP, it is interesting to see the caffeine effect on P300 and SSVEP based BCI in future investigations.
V. Conclusion
We have addressed the question if caffeinated soft drinks and caffeinated coffee would have effects on MI based BCI performance and resting state EEG in a group of 26 human subjects. Our results indicate that caffeinated drinks have seemingly negative effects on the control signal power by lowering the baseline power, in the rhythm of mu and beta bands; but it causes insignificant changes in BCI performance in online settings. Sugary drinks have no effect on both BCI performance and altering of the control signal power in alpha or beta frequency band compared to the control condition. Their effects are relatively small with the amount of moderate consumption in this study, thus consumption of caffeine or sugar through a soft drink or regular coffee does not seem to play a significant role impacting MI based BCI performance. In other words, moderate consumption of soft drink might not be a confounding factor to the variation of MI based BCI performance. The present results shed light on the effect of world’s most popular stimulant, caffeine, on BCI performance, and may have important implications in the development and optimization of BCI technology.
Acknowledgments
This work was supported in part by the NIH AT009263, and NSF CBET-1264782.
The authors would like to thank Jaron Olsoe, Nicholas Nesbitt, Eric Nagarajan, Andy Huynh, Gabriel Jacobs, Vishal Vijayakumar, Claire Zurn, Daniel Suma, Shuai Ye, Xiaodan Niu and Jenna Kelly for technical assistance, and to Dr. Haiteng Jiang for helpful discussion about data processing.
Biographies
 Jianjun Meng received his Bachelor degree from the School of Mechanical Engineering at Shanghai Jiao Tong University, China, in 2005 and his PhD degree in Mechanical Engineering from Shanghai Jiao Tong University, China, in 2013.
He is currently a Research Staff with the Department of Biomedical Engineering at the University of Minnesota, Minneapolis, MN, USA. His research interest is focused on enhancement of Brain-computer Interface (BCI) technology, decoding of motor imagination, application of BCI to control robotic arms, novel algorithms for advanced EEG signal processing, feature extraction and classification.
 John H. Mundahl (M’14) received a Bachelor’s of Science degree in biomedical engineering from the University of Minnesota, Minneapolis, MN, USA, in 2016.
From 2013 to 2016, he was a Researcher for Dr. Bin He’s Biomedical Functional Imaging and Neuroengineering Lab. In additional to the effects of stimulants on BCI, he also researched localizing epileptic activities and quantifying pain with multimodal techniques. He is currently working for Boston Scientific Corp. on the Disease State & Technology Roadmapping team to determine future medical device offerings in disease-specific realms.
Mr. Mundahl’s awards and honors include Presidential Scholar (University of Minnesota), College of Science and Engineering Academic Scholarship (University of Minnesota), and Astronaut Scholarship Foundation candidate (University of Minnesota).
 Taylor D. Streitz received the B.S. degree in 2017 and is currently working towards the M.S. degree in Biomedical Engineering from the University of Minnesota Twin Cities.
He has been a research assistant in the Biomedical Functional Imaging and Neuroengineering Laboratory at the University of Minnesota since 2015. His research has focused primarily around Brain Computer Interfaces and how they can be used in stroke rehabilitation, as well as exploring other uses. His work in the lab inspired him to change his focus to the neural field and plans to pursue this in industry after completing his schooling.
 Kaitlin Maile was born in Minneapolis, MN, USA in 1997. She is currently pursuing the B.S. degree in biomedical engineering at the University of Minnesota, Minneapolis, MN, USA.
In 2016, she was an Undergraduate Researcher in the Department of Urology and an Intern in the Medical Devices Center, both at the University of Minnesota, Minneapolis, MN, USA. Since 2017, she has been an Undergraduate Researcher in two labs within the Department of Biomedical Engineering at the University of Minnesota, Minneapolis, MN, USA and a Research and Development Engineering Intern at Boston Scientific, Maple Grove, MN, USA. Her research interests include neural engineering and machine learning.
 Nicholas S. Gulachek was born in St. Anthony Village, Minnesota, USA in 1996. He is currently pursuing a degree in biomedical engineering at the University of Minnesota, Minneapolis, MN, and expects to complete his undergraduate education in 2019.
From 2016 to 2017 he was an intern at the University of Minnesota’s Medical Devices Center. Since May 2017, he has been a research assistant at Dr. Bin He’s Biomedical Functional Imaging and Neuroengineering Laboratory at the University of Minnesota, where his research interests include neural prosthesis and developing software to improve current applications of brain-computer interface.
Jeffrey He is currently a high school student at Mounds View High School, MN, USA.
From 2014 to 2017, he was a Research Assistant in the Department of Biomedical Engineering at the University of Minnesota. His research interests include the development of brain computer interface as well as electroencephalography.
 Bin He is currently Distinguished McKnight University Professor of Biomedical Engineering at the University of Minnesota. Dr. He has made significant contributions to brain-computer interface technology and biomedical imaging, including electrophysiological source imaging and tissue electrical property imaging. Dr. He has received a number of recognitions, including the IEEE Biomedical Engineering Award, the Academic Career Achievement Award and Distinguished Service Award from the IEEE Engineering in Medicine and Biology Society, the Established Investigator Award from the American Heart Association, and the CARRER Award from the National Science Foundation, among others. He was President of the IEEE Engineering in Medicine and Biology Society and Chair of Publications Committee of the American Institute of Medical and Biological Engineering, and is Chair-Elect of the International Academy of Medical and Biological Engineering. Dr. He is an elected Fellow of International Academy of Medical and Biological Engineering, IEEE, American Institute of Medical and Biological Engineering, Biomedical Engineering Society, and is the Editor-in-Chief of IEEE Transactions on Biomedical Engineering.
Contributor Information
Jianjun Meng, Department of Biomedical Engineering, University of Minnesota, Minneapolis, MN 55455 USA.
John Mundahl, Department of Biomedical Engineering, University of Minnesota, Minneapolis, MN 55455 USA.
Taylor Streitz, Department of Biomedical Engineering, University of Minnesota, Minneapolis, MN 55455 USA.
Kaitlin Maile, Department of Biomedical Engineering, University of Minnesota, Minneapolis, MN 55455 USA.
Nicholas Gulachek, Department of Biomedical Engineering, University of Minnesota, Minneapolis, MN 55455 USA.
Jeffrey He, Mounds View High School, Mounds View, MN 55112 USA.
Bin He, Department of Biomedical Engineering, also with Institute for Engineering in Medicine, University of Minnesota, Minneapolis, MN 55455 USA.
References
- 1.He B, Gao S, Yuan H, Wolpaw JR. Neural Engineering. Springer US; 2013. Brain–computer interfaces; pp. 87–151. [Google Scholar]
- 2.Wolpaw JR, McFarland DJ. Control of a two-dimensional movement signal by a noninvasive brain-computer interface in humans. Proc Nat Acad Sci USA. 2004;101(51):17849–17854. doi: 10.1073/pnas.0403504101. [DOI] [PMC free article] [PubMed] [Google Scholar]
- 3.Royer AS, Doud AJ, Rose ML, He B. EEG control of a virtual helicopter in 3-dimensional space using intelligent control strategies. IEEE Transactions on neural systems and rehabilitation engineering. 2010;18(6):581–589. doi: 10.1109/TNSRE.2010.2077654. [DOI] [PMC free article] [PubMed] [Google Scholar]
- 4.Doud AJ, Lucas JP, Pisansky MT, He B. Continuous three-dimensional control of a virtual helicopter using a motor imagery based brain-computer interface. PloS one. 2011;6(10):e26322. doi: 10.1371/journal.pone.0026322. [DOI] [PMC free article] [PubMed] [Google Scholar]
- 5.LaFleur K, Cassady K, Doud A, Shades K, Rogin E, He B. Quadcopter control in three-dimensional space using a noninvasive motor imagery-based brain–computer interface. Journal of Neural Engineering. 2013 Aug;10:254–260. doi: 10.1088/1741-2560/10/4/046003. [DOI] [PMC free article] [PubMed] [Google Scholar]
- 6.He B, Baxter B, Edelman B, Cline C, Ye W. Noninvasive Brain-Computer Interfaces Based on Sensorimotor Rhythms. Proceedings of the IEEE. 2015 Jun;103:907–925. doi: 10.1109/jproc.2015.2407272. [DOI] [PMC free article] [PubMed] [Google Scholar]
- 7.Carlson T, Millan JR. Brain-controlled wheelchairs: a robotic architecture. IEEE Robotics & Automation Magazine. 2013;20(1):65–73. [Google Scholar]
- 8.Meng J, Zhang S, Bekyo A, Olsoe J, Baxter B, He B. Noninvasive Electroencephalogram Based Control of a Robotic Arm for Reach and Grasp Tasks. Scientific Reports. 2016;6 doi: 10.1038/srep38565. [DOI] [PMC free article] [PubMed] [Google Scholar]
- 9.Meng J, Yao L, Sheng X, Zhang D, Zhu X. Simultaneously optimizing spatial spectral features based on mutual information for EEG classification. IEEE Transactions on Biomedical Engineering. 2015;62(1):227–240. doi: 10.1109/TBME.2014.2345458. [DOI] [PubMed] [Google Scholar]
- 10.Aghaei AS, Mahanta MS, Plataniotis KN. Separable common spatio-spectral patterns for motor imagery BCI systems. IEEE Transactions on Biomedical Engineering. 2016;63(1):15–29. doi: 10.1109/TBME.2015.2487738. [DOI] [PubMed] [Google Scholar]
- 11.Cecotti H, Marathe AR, Ries AJ. Optimization of single-trial detection of event-related potentials through artificial trials. IEEE Transactions on Biomedical Engineering. 2015;62(9):2170–2176. doi: 10.1109/TBME.2015.2417054. [DOI] [PubMed] [Google Scholar]
- 12.Paris A, Atia G, Vosoughi A, Berman SA. A New Statistical Model of Electroencephalogram Noise Spectra for Real-time Brain-Computer Interfaces. IEEE Transactions on Biomedical Engineering. 2016;64(8):1688– 1700. doi: 10.1109/TBME.2016.2606595. [DOI] [PubMed] [Google Scholar]
- 13.Tomida N, Tanaka T, Ono S, Yamagishi M, Higashi H. Active data selection for motor imagery EEG classification. IEEE Transactions on Biomedical Engineering. 2015;62(2):458–467. doi: 10.1109/TBME.2014.2358536. [DOI] [PubMed] [Google Scholar]
- 14.Edelman BJ, Baxter B, He B. EEG source imaging enhances the decoding of complex right-hand motor imagery tasks. IEEE Transactions on Biomedical Engineering. 2016;63(1):4–14. doi: 10.1109/TBME.2015.2467312. [DOI] [PMC free article] [PubMed] [Google Scholar]
- 15.Yu T, Xiao J, Wang F, Zhang R, Gu Z, Cichocki A, Li Y. Enhanced motor imagery training using a hybrid BCI with feedback. IEEE Transactions on Biomedical Engineering. 2015;62(7):1706–1717. doi: 10.1109/TBME.2015.2402283. [DOI] [PubMed] [Google Scholar]
- 16.Kreilinger A, Hiebel H, Müller-Putz GR. Single Versus Multiple Events Error Potential Detection in a BCI-Controlled Car Game With Continuous and Discrete Feedback. IEEE Transactions on Biomedical Engineering. 2016;63(3):519–529. doi: 10.1109/TBME.2015.2465866. [DOI] [PubMed] [Google Scholar]
- 17.Ofner P, Müller-Putz GR. Using a noninvasive decoding method to classify rhythmic movement imaginations of the arm in two planes. IEEE Transactions on Biomedical Engineering. 2015;62(3):972–981. doi: 10.1109/TBME.2014.2377023. [DOI] [PubMed] [Google Scholar]
- 18.Valeriani D, Poli R, Cinel C. Enhancement of Group Perception via a Collaborative Brain-Computer Interface. IEEE Transactions on Biomedical Engineering. 2017;64(6):1238–1248. doi: 10.1109/TBME.2016.2598875. [DOI] [PubMed] [Google Scholar]
- 19.Yuan H, He B. Brain–computer interfaces using sensorimotor rhythms: current state and future perspectives. IEEE Transactions on Biomedical Engineering. 2014;61(5):1425–1435. doi: 10.1109/TBME.2014.2312397. [DOI] [PMC free article] [PubMed] [Google Scholar]
- 20.Daly JJ, Wolpaw JR. Brain–computer interfaces in neurological rehabilitation. The Lancet Neurology. 2008;7(11):1032–1043. doi: 10.1016/S1474-4422(08)70223-0. [DOI] [PubMed] [Google Scholar]
- 21.Ang KK, Guan C, Chua KSG, Ang BT, Kuah CWK, Wang C, Phua KS, Chin ZY, Zhang H. A large clinical study on the ability of stroke patients to use an EEG-based motor imagery brain-computer interface. Clinical EEG and Neuroscience. 2011;42(4):253–258. doi: 10.1177/155005941104200411. [DOI] [PubMed] [Google Scholar]
- 22.Rupp R, Rohm M, Schneiders M, Kreilinger A, Muller-Putz GR. Functional rehabilitation of the paralyzed upper extremity after spinal cord injury by noninvasive hybrid neuroprostheses. Proceedings of the IEEE. 2015;103(6):954–968. [Google Scholar]
- 23.Curran EA, Stokes MJ. Learning to control brain activity: a review of the production and control of EEG components for driving brain–computer interface (BCI) systems. Brain and cognition. 2003;51(3):326–336. doi: 10.1016/s0278-2626(03)00036-8. [DOI] [PubMed] [Google Scholar]
- 24.Cassady K, You A, Doud A, He B. The impact of mind-body awareness training on the early learning of a brain-computer interface. Technology. 2014 Sep;2:254–260. doi: 10.1142/S233954781450023X. [DOI] [PMC free article] [PubMed] [Google Scholar]
- 25.Jarosiewicz B, Chase SM, Fraser GW, Velliste M, Kass RE, Schwartz AB. Functional network reorganization during learning in a brain-computer interface paradigm. Proc Nat Acad Sci USA. 2008;105(49):19486–19491. doi: 10.1073/pnas.0808113105. [DOI] [PMC free article] [PubMed] [Google Scholar]
- 26.Baxter BS, Edelman BJ, Nesbitt N, He B. Sensorimotor Rhythm BCI with Simultaneous High Definition-Transcranial Direct Current Stimulation Alters Task Performance. Brain Stimulation. 2016;9(6):834–841. doi: 10.1016/j.brs.2016.07.003. [DOI] [PMC free article] [PubMed] [Google Scholar]
- 27.Park SA, Hwang HJ, Lim JH, Choi JH, Jung HK, Im CH. Evaluation of feature extraction methods for EEG-based brain–computer interfaces in terms of robustness to slight changes in electrode locations. Medical & biological engineering & computing. 2013;51(5):571–579. doi: 10.1007/s11517-012-1026-1. [DOI] [PubMed] [Google Scholar]
- 28.Ahn M, Jun SC. Performance variation in motor imagery brain–computer interface: A brief review. Journal of neuroscience methods. 2015;243:103–110. doi: 10.1016/j.jneumeth.2015.01.033. [DOI] [PubMed] [Google Scholar]
- 29.Nijber F, Birbaumer N, Kübler A. The influence of psychological state and motivation on brain–computer interface performance in patients with amyotrophic lateral sclerosis–a longitudinal study. Frontiers in Neuroscience. 2010 Jul;4 doi: 10.3389/fnins.2010.00055. [DOI] [PMC free article] [PubMed] [Google Scholar]
- 30.Myrden A, Tom C. Effects of user mental state on EEG-BCI performance. Frontiers in human neuroscience. 2015;9 doi: 10.3389/fnhum.2015.00308. [DOI] [PMC free article] [PubMed] [Google Scholar]
- 31.Barry RJ, Rushby JA, Wallace MJ, Clarke AR, Johnstone SJ, Zlojutro I. Caffeine effects on resting-state arousal. Clinical Neurophysiology. 2005;116(11):2693–2700. doi: 10.1016/j.clinph.2005.08.008. [DOI] [PubMed] [Google Scholar]
- 32.Foxe JJ, Morie KP, Laud PJ, Rowson MJ, De Bruin EA, Kelly SP. Assessing the effects of caffeine and theanine on the maintenance of vigilance during a sustained attention task. Neuropharmacology. 2012;62(7):2320–2327. doi: 10.1016/j.neuropharm.2012.01.020. [DOI] [PubMed] [Google Scholar]
- 33.Lorist MM, Tops M. Caffeine, fatigue, and cognition. Brain and cognition. 2003;53(1):82–94. doi: 10.1016/s0278-2626(03)00206-9. [DOI] [PubMed] [Google Scholar]
- 34.McFarland DJ, Wolpaw JR. Sensorimotor rhythm-based brain-computer interface (BCI): feature selection by regression improves performance. IEEE Transactions on Neural Systems and Rehabilitation Engineering. 2005;13(3):372–379. doi: 10.1109/TNSRE.2005.848627. [DOI] [PubMed] [Google Scholar]
- 35.Mundahl J, Meng J, He J, He B. Soft drink effects on sen-sorimotor rhythm brain computer interface performance and resting-state spectral power. Engineering in Medicine and Biology Society (EMBC), 2016 IEEE 38th Annual International Conference of the; 2016, August; IEEE; pp. 1520–1523. [DOI] [PubMed] [Google Scholar]
- 36.Somogyi LP. Caffeine intake by the US population. Prepared for The Food and Drug Administration and Oakridge National Laboratory. 2010 [Google Scholar]
- 37.Delorme A, Makeig S. EEGLAB: an open source toolbox for analysis of single-trial EEG dynamics including independent component analysis. Journal of neuroscience methods. 2004;134(1):9–21. doi: 10.1016/j.jneumeth.2003.10.009. [DOI] [PubMed] [Google Scholar]
- 38.Blankertz B, Sannelli C, Halder S, Hammer EM, Kübler A, Müller KR, … Dickhaus T. Neurophysiological predictor of SMR-based BCI performance. NeuroImage. 2010;51(4):1303–1309. doi: 10.1016/j.neuroimage.2010.03.022. [DOI] [PubMed] [Google Scholar]
- 39.Lal SK, Craig A. Driver fatigue: electroencephalography and psychological assessment. Psychophysiology. 2002;393:313–321. doi: 10.1017/s0048577201393095. [DOI] [PubMed] [Google Scholar]
- 40.Zhao C, Zhao M, Liu J, Zheng C. Electroencephalogram and electrocardiograph assessment of mental fatigue in a driving simulator. Accident Analysis & Prevention. 2012;45:83–90. doi: 10.1016/j.aap.2011.11.019. [DOI] [PubMed] [Google Scholar]


