

Abstract
Objective
To investigate the feasibility of microRNA (miRNA) levels in CSF as biomarkers for prodromal Huntington disease (HD).
Methods
miRNA levels were measured in CSF from 60 PREDICT-HD study participants using the HTG protocol. Using a CAG–Age Product score, 30 prodromal HD participants were selected based on estimated probability of imminent clinical diagnosis of HD (i.e., low, medium, high; n = 10/group). For comparison, participants already diagnosed (n = 15) and healthy controls (n = 15) were also selected.
Results
A total of 2,081 miRNAs were detected and 6 were significantly increased in the prodromal HD gene expansion carriers vs controls at false discovery rate q < 0.05 (miR-520f-3p, miR-135b-3p, miR-4317, miR-3928-5p, miR-8082, miR-140-5p). Evaluating the miRNA levels in each of the HD risk categories, all 6 revealed a pattern of increasing abundance from control to low risk, and from low risk to medium risk, which then leveled off from the medium to high risk and HD diagnosed groups.
Conclusions
This study reports miRNAs as CSF biomarkers of prodromal and diagnosed HD. Importantly, miRNAs were detected in the prodromal HD groups furthest from diagnosis where treatments are likely to be most consequential and meaningful. The identification of potential biomarkers in the disease prodrome may prove useful in evaluating treatments that may postpone disease onset.
Clinicaltrials.gov identifier
Huntington disease (HD) is an inherited neurodegenerative disease typically diagnosed in midlife,1 although symptoms may appear as early as age 3 and as late as age 85. The mutation responsible for HD is an expanded cytosine, adenine, guanine (CAG) trinucleotide repeat in the first exon of the huntingtin gene.2 Neuropathologic changes involving the accumulation of the huntingtin protein3 and the degeneration of neurons precede motor diagnosis, with up to half of striatal neurons lost before diagnosis.4 Volumetric changes in the striatum are evident as early as 2 decades prior to predicted diagnosis,5 indicating that neuropathologic changes occur many years prior to clinical motor manifestation and that effective therapeutics to prevent neurodegeneration would need to be administered long before clinical onset. The lack of validated biomarkers for onset and progression of neurodegeneration prior to clinical manifestation impedes the evaluation of preventive therapies.
MicroRNAs (miRNAs) are small noncoding ribose molecules with a bonded nucleotide base that negatively regulate mRNA levels in a sequence-specific manner, binding to the 3′-untranslated region to initiate cleavage or translational repression.6,7 miRNAs are abundant in the CNS, and assist in various neuronal processes such as synaptic development, maturation, and plasticity.8,9 Because they are encapsulated in small vesicles (either exosomes or microvesicles),10 and are associated with argonaute-2 (AGO2) proteins of the RNA-induced silencing complex, miRNAs resist degradation by ribonuclease. Mounting evidence suggests that disease-specific miRNA profiles can be detected in CSF in Parkinson disease (PD) and Alzheimer disease (AD).11–13
Studies of human HD prefrontal cortex identified 75 significantly altered miRNAs,14 including several that were associated with age at HD motor onset or the level of neuropathologic involvement in the striatum.15,16 Some miRNA levels were altered in brain samples of prodromal HD mHTT carriers.16 Although there is evidence of altered miRNA levels in plasma samples of prodromal HD, the changes were subtle and not sufficiently sensitive for an effective biomarker.17 We therefore sought to assess the presence of miRNAs in CSF from HD prodromal individuals as a biomarker of neurodegeneration prior to diagnosis.
Methods
Study design and participants
The PREDICT-HD study is a prospective observational study with 32 international sites conducted from September 2002 to July 2014. All PREDICT-HD participants had genetic testing prior to study enrollment. A total of 1,078 CAG-expanded (CAG >35; 64% female) individuals prior to motor diagnosis of HD were enrolled in this study. As healthy controls, 304 non-CAG-expanded siblings were also included (65% female). Annual assessments in the domains of motor, cognitive, psychiatric, functioning, and brain imaging were obtained with collection of DNA, blood, saliva, and urine. The goal of PREDICT-HD was to find predictive markers for motor manifestation (clinical diagnosis) of HD.
Standard protocol approvals, registrations, and patient consents
All participants gave informed written consent prior to study participation, and all study procedures were approved by each site's respective institutional review board.
CSF sample acquisition
CSF acquisition was added to the PREDICT-HD protocol at the end of the study at 6 sites. All participants underwent screening for the lumbar puncture (LP) the day prior to sample acquisition so that biospecimens would be collected after fasting and that screening blood sample laboratories could be conducted. Exclusion criteria for LP were (1) use of anticoagulant medication (i.e., warfarin, heparin) or antiplatelets (aspirin) within 14 days; (2) unable to fast for 8 hours; (3) any acute or chronic infection; (4) history of any chronic inflammatory disorder; (5) unstable medical or psychiatric disorder, disease, or illness; and (6) abnormalities in blood-based screening (e.g., abnormalities in prothrombin time, partial thromboplastin time, or low platelets). In a sterile environment, a Sprotte 24-G atraumatic spinal needle was used after adequate local anesthesia was administered. The site coordinator recorded the time for each component of the protocol. The first 1–2 mL of CSF from the first syringe was immediately sent at room temperature for basic CSF analyses conducted locally within 4 hours (i.e., for cell count, erythrocytes, total protein, and glucose). Remaining CSF was transferred to 15 mL conical polypropylene tubes at room temperature, mixed gently by inverting 3–4 times, and then centrifuged at 2,000 g for 10 minutes. Aliquots of 1.5 mL of supernatant were transferred to precooled 2-mL microcentrifuge tubes, and stored at −80°C until shipment on dry ice to the National Institute of Neurological Disorders and Stroke biorepository. Over 77% of the samples in this study were collected by an internist at the University of Iowa (J.S.) and the remaining samples were collected from 5 sites in the PREDICT-HD CSF ancillary study.
Samples
CSF samples for 60 participants were chosen by the PREDICT-HD Data Management Team.18,19 All samples were blinded by a unique code specific for this substudy. The samples included 15 participants clinically diagnosed with HD according to traditional criteria with diagnostic confidence level of 4 on the Unified Huntington’s Disease Rating Scale,20 30 participants determined to be prodromal gene expansion carriers for HD, and 15 healthy controls. Disease burden in the prodromal participants was determined by calculation of the CAG–Age Product (CAP = age × [CAG − 33.66]),21 developed to reflect age-adjusted cumulative exposure to the effects of mutant huntingtin.
miRNA preprocessing and quantification
Fifteen microliters of CSF was processed for miRNA levels using the HTG Molecular Diagnostics miRNA whole transcriptome protocol HTG EdgeSeq system (htgmolecular.com/products/htg-edg-system-edgeseq). This process includes specific probes for 2,083 miRNAs, producing both raw small-RNA sequencing files and prequantified data. A maximum of 24 samples can be processed in a single run and samples were randomly assigned to each of 3 batches. Raw sequencing files were processed and eventually used for differential analyses. Initial checks for sample quality, as well as adapter sequence identification, was performed using FastQC (version 0.11.3, bioinformatics.babraham.ac.uk/projects/fastqc/). For each sample, low-quality reads were removed using FastX (version 0.0.14, hannonlab.cshl.edu/fastx_toolkit/) FASTQ Quality Filter, using a quality score of 80%. TruSeq Adapter Index 2 adapter sequence 9 (5′-GATCGGAAGAGCACACGTCTGAACTCCAGTCACCGATGTATCTCGTATGCCGTCTTCTGCTTG-3′) was removed from each read using Cutadapt (version 1.7.1), removing reads with fewer than 15 remaining nucleotides. Reads with the same sequence were combined using FastX (version 0.0.14) Collapser, reporting the number of duplicated reads per sequence.22 Reads were aligned to human genome version hg19 using Bowtie (version 1.1.1), allowing for 0 mismatches.23 Bam files were converted to bed files using bedtools (version 2.25.0) bamToBed.24 miRNAs were defined as reads aligning within ±4 bases from the start coordinate of annotated miRNAs from mirBase (version 20), filtered for the 2,083 probes.25 miRNA reads were counted using GenomicRanges (version 1.22.4) R package, removing reads greater than 27 bases.26 Of the 2,083 probes, we were able to count at least one read across all samples for 2,082 miRNAs. One miRNA was removed due to low expression (mean raw counts <2 across all samples). Therefore, differential analysis includes 2,081 individual miRNAs.
Statistical analysis
All analysis was carried out using R (version 3.2.2). Counts were normalized using the DESeq2/variance stabilization transformation in DESeq2 (version 1.10.1).27 These values were then adjusted for batch effects from their sequencing run, using ComBat (version 3.18.0).28 Unless otherwise stated, expression values reported in this article are count values, after transformation on a log2 scale. Sample-level quality control was conducted across all samples. All differential expression analyses were carried out with linear models using miRNA expression as the outcome variable.
False discovery rate (FDR) q values were calculated from nominal p values using the Benjamini-Hochberg procedure, performed by first ordering the p values, where the smallest p value has a rank of 1. Each p value is then transformed by taking the product of the p value and the total number of tests, and then dividing by the p value ranking. Finally, the FDR q values are assigned as the cumulative minimum of this new set, ordered by the reverse ranking of the original p value.29 Inadequate power precluded analyses comparing expression of individual miRNAs to CAG repeat size in the 45 participants with HD.
Sample-level quality control
Outlier samples were detected via qualitative assessment of plots of the first 2 principal components of expression values across all samples. After initial outlier samples were removed, the first 2 principal components of the remaining samples were replotted and the remaining samples were reevaluated for outliers. After 2 iterations of this process, no additional samples were removed.
Diagnosed HD vs controls
Differential expression analysis between diagnosed HD and controls was performed using both the complete set of miRNAs as well as a subset of 16 miRNAs previously reported16 as differentially expressed between postmortem HD and control participants. In each model, age was included as a covariate.
Ordinal scales of prodromal HD progression
In order to explore the relationship of miRNA expression with estimated risk of clinical HD diagnosis, we assigned ordinal values to each clinical group. The following values were assigned: 0 to control, 1 to low risk, 2 to medium risk, 3 to high risk, and 4 to diagnosed manifest HD participants. Age was not included as a covariate in these models because it is a factor in assigning HD prodromal staging.
Hierarchical clustering of diagnosed HD and controls
Hierarchical clustering was carried out on diagnosed HD and controls, using a subset of miRNAs determined to be significantly differentially expressed (FDR q value <0.1) between the 2 groups. Euclidean distance with the Ward agglomerative method was used to cluster both the samples and miRNAs.
Results
Differential analysis of miRNA expression in CSF between diagnosed HD and controls
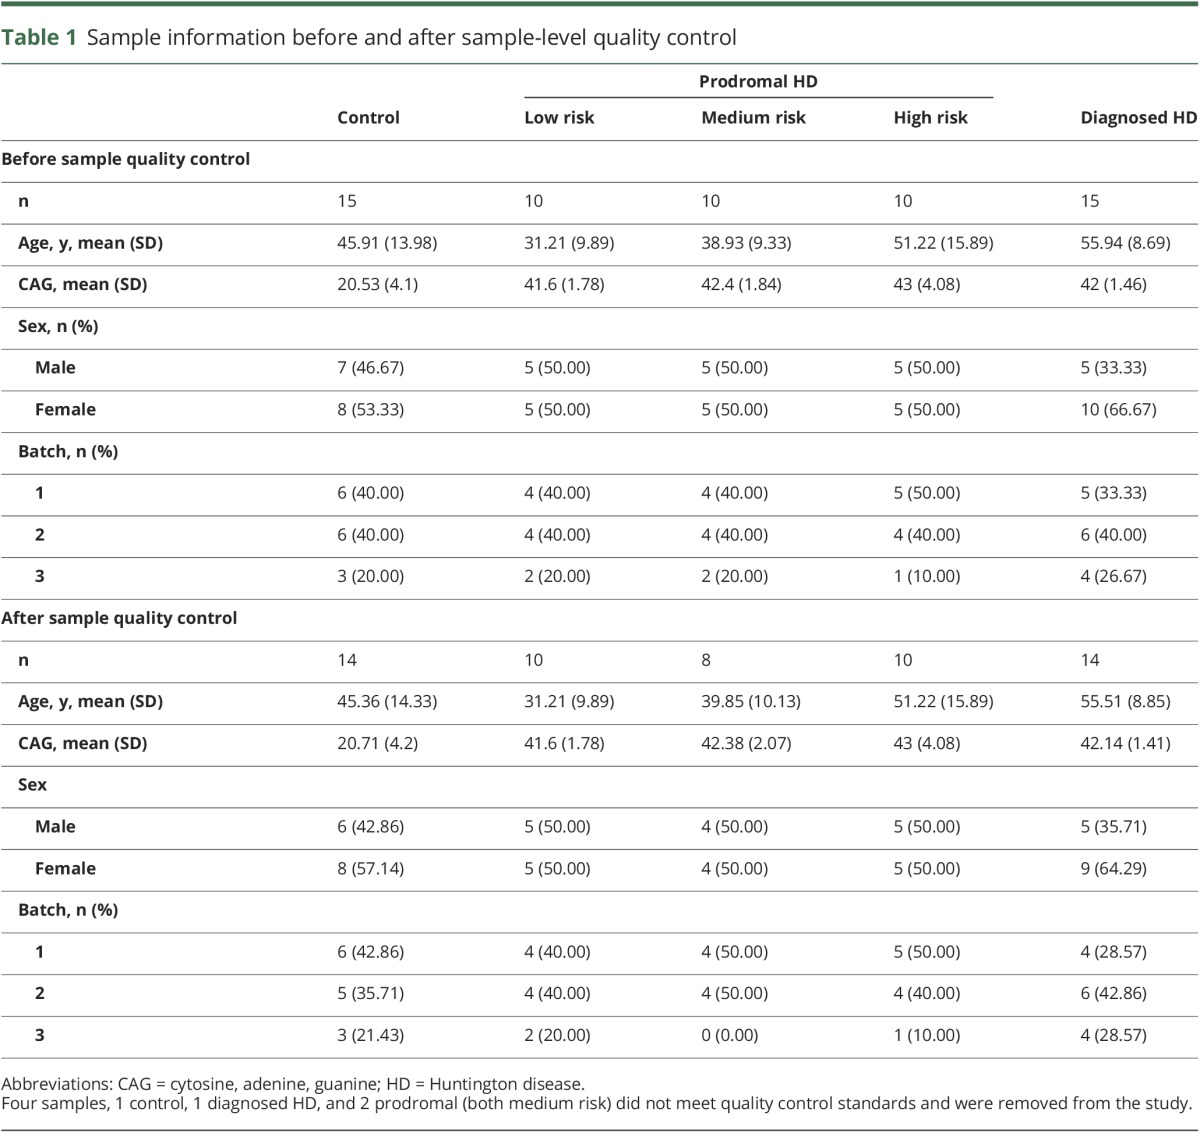
In order to evaluate altered miRNA expression in HD CSF, we performed differential expression in 2,081 miRNA probes that passed expression filtering, quantified from small-RNA sequencing using the HTG EdgeSeq system. Of the 60 samples processed, 56 passed quality control filtering, including 14 controls, 10 low risk, 8 medium risk, 10 high risk, and 14 diagnosed HD (table 1).
Table 1.
Sample information before and after sample-level quality control
The initial analysis compared diagnosed HD to controls. After normalization and batch correction, miRNAs were tested independently using multivariate linear modeling, adjusting for age. Of the 2,081 miRNAs, 25 reached FDR significance q value <0.1, and 6 reached FDR significance q value <0.05. In all 25 of these miRNAs, expression was upregulated in HD and 14 miRNAs had greater than 2-fold changes in expression (log2FC >1) in HD compared to control participants (table 2). The extent to which these 25 miRNAs separated HD cases from controls was further explored via hierarchical clustering, which revealed a clear partition between cases and controls, with all but 3 HD samples and 3 control samples clustering within their group (figure 1).
Table 2.
Differentially expressed microRNAs (miRNAs) between diagnosed Huntington disease (HD) and controls
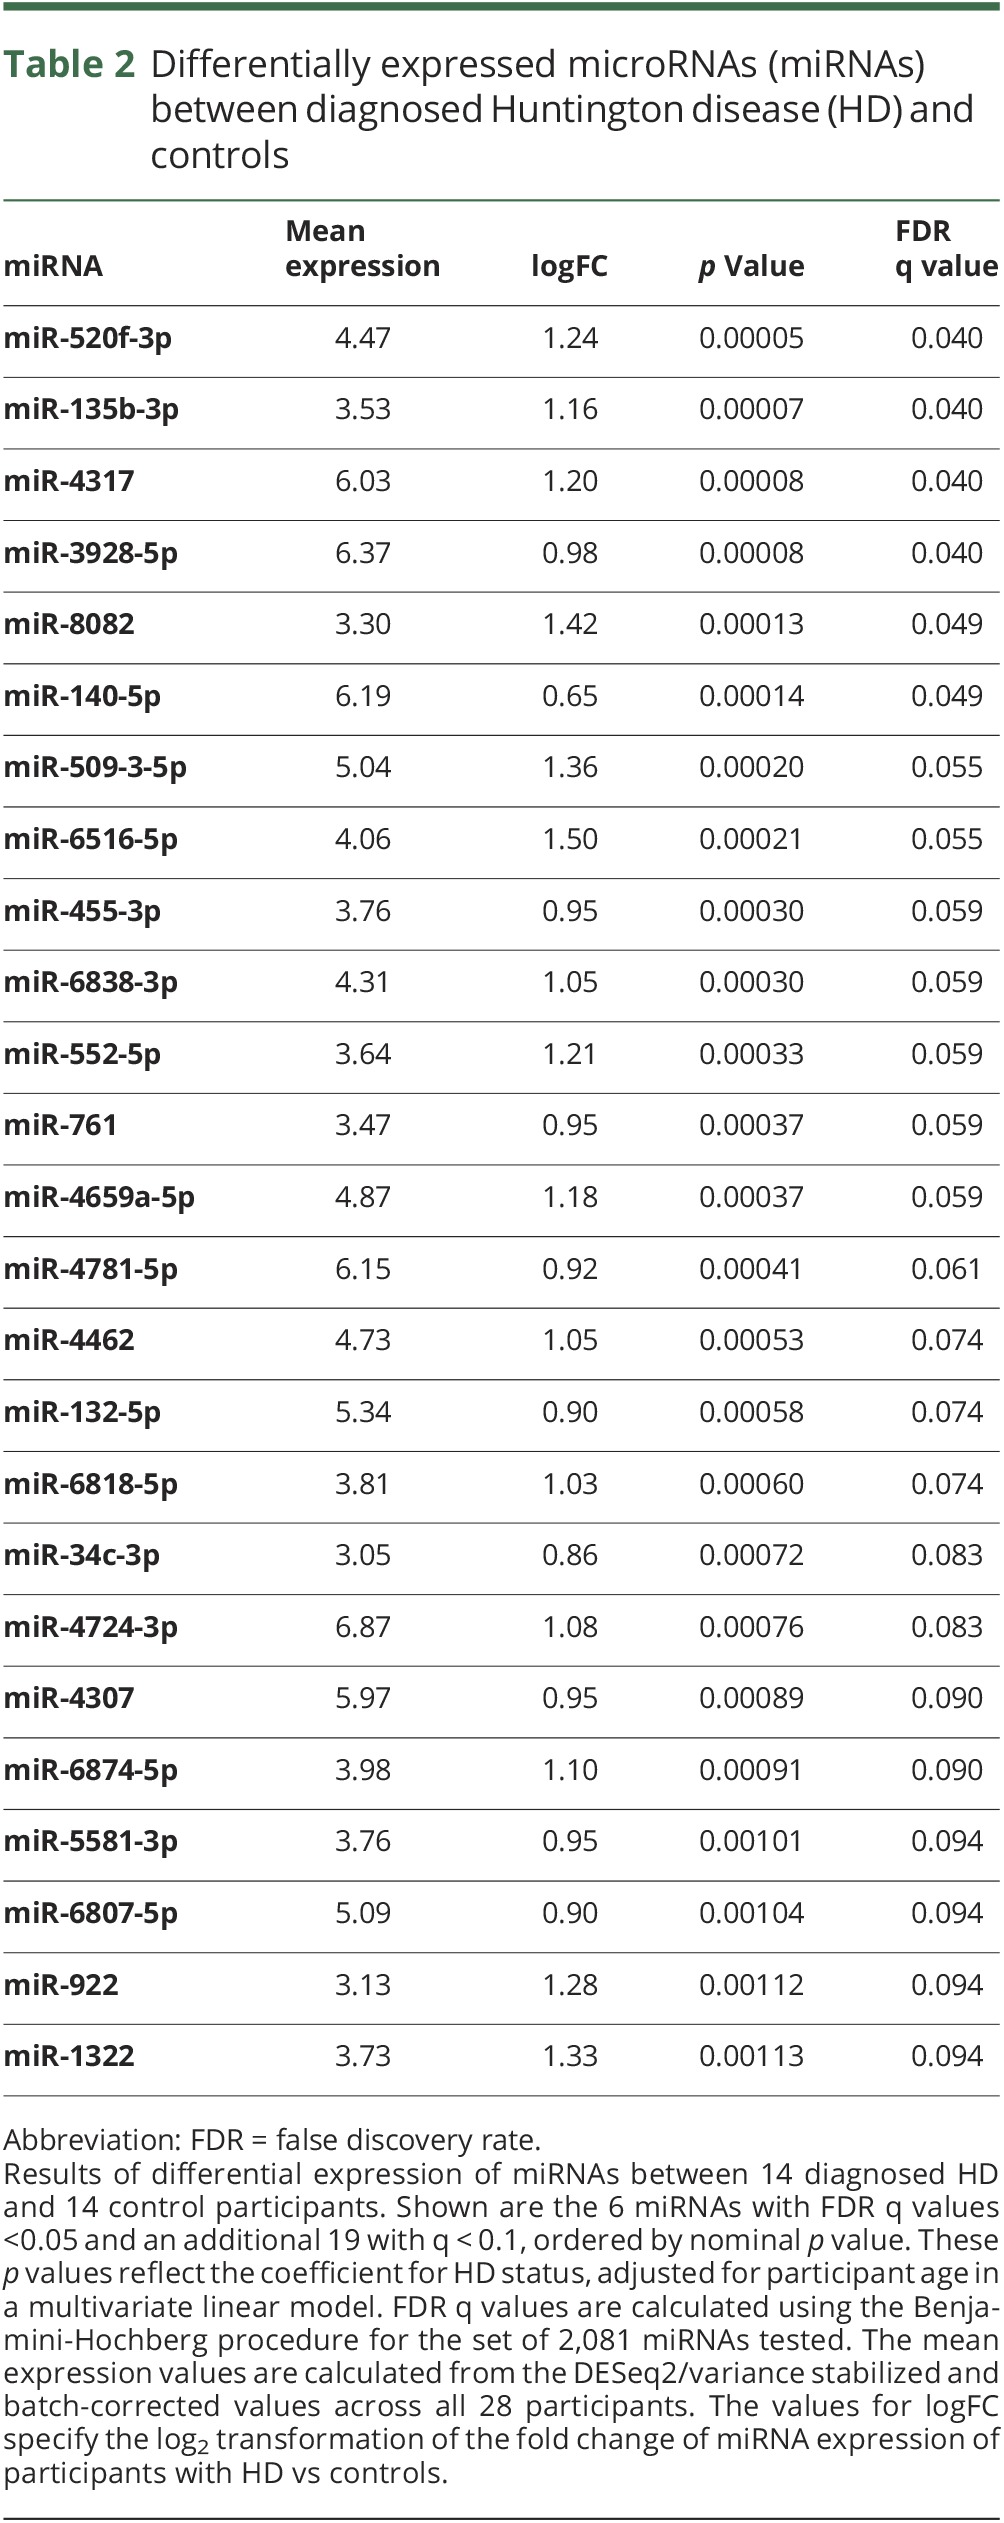
Figure 1. Hierarchal clustering of differentially expressed microRNAs (miRNAs).

Hierarchal clustering of 14 diagnosed Huntington disease cases and 14 controls presented on the X axis defined by the color at the top of the figure, using the top 25 most differentially expressed miRNAs presented on the Y axis (table 2). Samples and miRNAs have been clustered based on their normalized expression. Colors in this heatmap reflect miRNA-wise z score transformation of normalized expression where darker shades of red represent increased levels and darker shades of blue represent decreased levels.
None of the 16 miRNAs previously identified16 to be differentially expressed between postmortem HD and control brains reached statistical significance when performing FDR corrections for either the full set 2,081 miRNA or the candidate set of 16 miRNAs, though 4 miRNAs reached nominal significance (p value <0.05, table e-1, links.lww.com/WNL/A52).
Analysis of miRNA expression and estimated risk of HD diagnosis
In order to evaluate the association between miRNA expression and progression in prodromal to diagnosed HD, we assigned each group an ordinal variable, 0 to 4, where 0 was assigned to controls, 4 to diagnosed HD participants, and 1–3 to each of the prodromal groups. Linear modeling of the 2,081 expressed miRNAs across the 56 samples revealed no miRNAs that reached FDR significance, although 16 had nominal p values <0.005 (table 3). These 16 miRNAs included the top 5 significantly differentially expressed (q < 0.05) in the HD vs control analysis: miR-520f-3p, miR-135b-3p, miR-4317, miR-3928-5p, miR-8082. Boxplots of the distribution of expression across each group for all 6 miRNAs differentially expressed between HD vs control participants are shown in figure 2. For each of these miRNAs, the direction of the log2FC between adjacent nominal groups is consistent with the direction of altered expression seen between HD vs controls.
Table 3.
MicroRNA (miRNA) expression association with ordinal categories of control, prodromal, and diagnosed Huntington disease (HD)
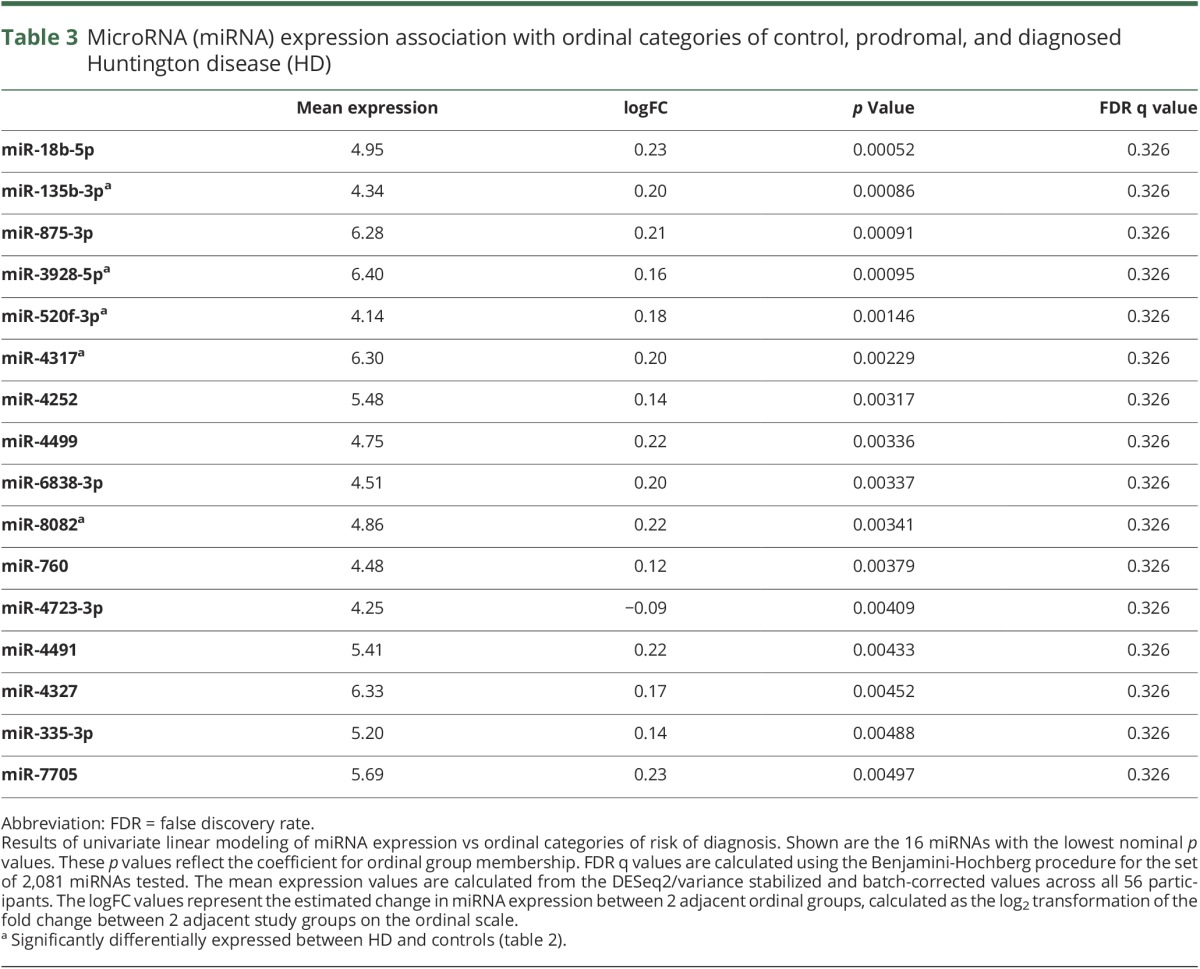
Figure 2. Plots of microRNAs (miRNAs) across categories of control, prodromal, and diagnosed Huntington disease (HD).

Boxplots of the distribution of DESeq2/variance stabilized and batch-corrected expression among the 5 ordinal groups (risk of diagnosis of HD) for each of the 6 miRNAs differentially expressed between HD and control participants (table 2; A, 50f-3p; B, 135b-3p; C, 4317; D, 3928-5p; E, 8082; F, 140-5p). p Values and logFC values are the same as in table 3. The low-risk, medium-risk, high-risk, and diagnosed HD groups are synonymous with the far from onset, middle from onset, near onset, and symptomatic HD groups.
None of the candidate miRNAs reported previously16 as differentially expressed in HD vs control prefrontal cortex reached FDR q < 0.1, and only 2 reached nominal significance (miR-132-3p, p < 0.017, miR-5695, p < 0.05, table e-2, links.lww.com/WNL/A53).
Discussion
This analysis reports the assessment of miRNAs in HD CSF as a biomarker for HD. We evaluated the differential levels of miRNAs for individuals diagnosed with HD vs controls as well as the relationship of miRNA levels among gene expansion–positive prodromal individuals with varying estimated risk of diagnosis (table 1). We first sought to distinguish miRNAs that characterize diagnosed HD using a discovery set of 2,081 miRNAs. Six miRNAs were differentially found in diagnosed HD vs control CSF (FDR q < 0.05) and an additional 19 at FDR q < 0.1 (table 2). All of the miRNAs were upregulated in HD CSF. However, none of the miRNAs that we had previously identified with differential levels in diagnosed HD vs control prefrontal cortex brain samples16 were found to be different in these early diagnosed HD CSF samples.
When examining the association of miRNA expression to an ordinal scale of diagnosis risk, or time to diagnosis, where 0 was assigned to controls, 4 to diagnosed HD participants, and 1–3 to each prodromal group with decreasing proximity to (or risk of) diagnosis, 16 miRNAs had nominal p < 0.005 (FDR <0.326), including the top 5 differentially expressed in diagnosed HD vs controls FDR q < 0.05 (table 3). When we plotted the 6 FDR significant miRNAs, we observed a consistent pattern of association between miRNA expression across prodromal groups. Specifically, miRNA increases from control to low risk and increases again from low risk to medium risk but then appears to remain elevated across the medium risk to high risk and HD diagnosed groups (figure 2).
While this study shows altered miRNA expression in HD CSF, similar studies have been performed for AD and PD. A study11 using small-RNA sequencing to quantify 2,228 miRNAs in 69 AD, 67 PD, and 78 control participants reported differential expression of 41 miRNAs in AD vs controls and 17 miRNAs in PD vs controls. A similar study13 using TaqMan low-density array human miRNA panels to quantify 746 exosomal miRNAs in CSF across 28 AD, 47 PD, and 27 control participants reported differential expression of 27 miRNAs in AD vs controls and 6 miRNAs in PD vs controls. These studies show concordance with our results, most notably miR-132-5p, identified in the PD analysis,11 as well as in both the AD and PD analyses.13 In our analysis, miR-132-5p was differentially expressed in diagnosed HD vs controls (table 2), as well as nominally associated with ordinal categorization of prodromal HD progression (p = 0.035, FDR = 0.33). miR-132-3p was included in the set of miRNAs that were differentially regulated in HD brain.16 Of these 16 miRNAs, miR-132-3p had the second lowest nominal p value when comparing diagnosed HD vs control CSF (p = 0.025, FDR = 0.15; table e-1, links.lww.com/WNL/A52), as well as the lowest nominal p value for the ordinal relationship (p = 0.020, FDR = 0.27). Also identified in the AD analysis,11 miR-760 was one of the top 16 miRNAs in our ordinal analysis (p = 0.0038, FDR = 0.36; table 3).
Several points can be made from these studies. First, we did not see a strong relationship between miRNA levels that distinguish HD from control in brain with the miRNA levels that distinguish HD from control in CSF. The process by which miRNAs are released into CSF is still not well-understood, and it may be that miRNAs released into CSF are derived from the degeneration of neurons as the integrity of the neuronal cell membrane is lost while the predominant differential miRNA levels seen in HD brain may instead reflect miRNAs found in non-neuronal cell types (microglia, astrocytes, and oligodendrocytes).
Second, the pattern for miRNA increase present for the earliest prodromal stages of HD may be important for future clinical trials as those miRNAs may reflect changes occurring in the brain that echo effects of the initial neurodegeneration seen in HD, long before clinical diagnosis. A panel of miRNAs may provide insight into whether treatments are preventing the initiation of the degenerative process in HD clinical trials that seek to prevent early damaging effects of the HTT gene on the integrity of the brain. These findings show particular promise since very few baseline/cross-sectional measures have detected differences between the low-risk/far from diagnosis prodromal group and controls. To our knowledge, only emotion recognition30 and striatal volumes31 from MRI are reportedly different between controls and prodromal participants who are furthest from HD diagnosis. Biomarkers to detect and track the earliest measures of disease will become important in future clinical trials of preventive therapies.
Finally, we recognize that the sample size of 60 studied here may not have sufficient power to detect all of the miRNAs that are altered in diagnosed or prodromal HD relative to controls. Additional studies of larger cohorts throughout the continuum of the disease spectrum, and studies of samples taken longitudinally, will almost certainly reveal additional important insights into the utility of miRNA measures in CSF as biomarkers for prodromal HD. We also recognize the imprecision of the prodromal staging variable CAP. Although research has validated the utility of this variable,19 biomarker studies are likely to improve as the prodromal stages of HD are further characterized and subjected to clinimetrics. Generalizability of our findings with regards to sex, ethnicity, race, and potential environmental factors is unknown since the PREDICT study recruited all participants with regards to HD risk. Confidence in the findings might be strengthened since the control group represented siblings whose genetic test revealed a normal CAG length, offering control for some variation in individual differences. An additional limitation of our study is that the prodromal groups are partially defined by age, with those further from diagnosis being younger than those nearer to diagnosis risk. Consequently, adjusting for age across these groups is problematic. Effects of age on the levels of miRNAs may be a source of bias that we are not able to consider in a study of this size. Finally, we recognize that 3 of the HD cases did not cluster with the others and cluster as controls in figure 1. These may be a consequence of assay failure or other unknown factors that alter the levels of miRNAs in CSF. Additional work to determine the sources of miRNA variation is likely to improve the efficacy of these measures.
Acknowledgment
The authors thank the PREDICT-HD sites, the study participants, the National Research Roster for Huntington Disease Patients and Families, the Huntington's Disease Society of America, the Huntington Study Group, and the European Huntington's Disease Network.
Glossary
- AD
Alzheimer disease
- CAG
cytosine, adenine, guanine
- CAP
CAG–Age Product
- FDR
false discovery rate
- HD
Huntington disease
- LP
lumbar puncture
- miRNA
microRNA
- PD
Parkinson disease
Footnotes
Editorial, page 151
Contributor Information
Collaborators: PREDICT-HD CSF ancillary study investigators, Isabella De Soriano, Courtney Hobart, Amanda Miller, Michael D. Geschwind, Sharon Sha, Joseph Winer, Gabriela Satris, Peter Panegyres, Joseph Lee, Maria Tedesco, Brenton Maxwell, Joel Perlmutter, Stacey Barton, Shineeka Smith, Vicki Wheelock, Lisa Kjer, Amanda Martin, Sarah Farias, David Craufurd, Judith Bek, Elizabeth Howard, Lynn Raymond, Joji Decolongon, Mannie Fan, Allison Coleman, Jane S. Paulsen, Jeffrey D. Long, Hans J. Johnson, John Kamholtz, Phil Danzer, Amanda Miller, H. Jeremy Bockholt, and Kelsey Montross
Author contributions
R.H.M. and J.S.P. conceived and designed the study. E.R.R., J.C.L., J.H.B., J.B., J.S., J.S.P., and R.H.M. acquired, analyzed, or interpreted the data. E.R.R., R.H.M., and J.S.P. drafted the manuscript. E.R.R., J.C.L., J.H.B., J.B., J.S., J.S.P., and R.H.M. provided critical revision of the manuscript for important intellectual content. E.R.R., J.C.L., and J.H.B. conducted data and statistical analysis. R.H.M. and J.S.P. obtained funding and provided study supervision.
Study funding
Supported by the Jerry McDonald HD Research Fund and by the NIH, National Institute of Neurologic Disorders and Stroke grant (3R01-NS073947) awarded to Richard H. Myers; and by the NIH, National Institute of Neurologic Disorders and Stroke grants (5R01NS040068, 5R01NS054893, 5U01NS082089) and the CHDI Foundation, Inc. (A6266; A2015) awarded to Jane S. Paulsen. This publication was supported by the National Center for Advancing Translational Sciences and the NIH. The content is solely the responsibility of the authors and does not necessarily represent the official views of the NIH.
Disclosure
The authors report no disclosures relevant to the manuscript. Go to Neurology.org/N for full disclosures.
References
- 1.Myers RH. Huntington's disease genetics. NeuroRx 2004;1:255–262. [DOI] [PMC free article] [PubMed] [Google Scholar]
- 2.MacDonald ME, Ambrose CM, Duyao MP, et al. A novel gene containing a trinucleotide repeat that is expanded and unstable on Huntington's disease chromosomes. Cell 2016;72:971–983. [DOI] [PubMed] [Google Scholar]
- 3.Gómez-Tortosa E, Macdonald ME, Friend JC, et al. Quantitative neuropathological changes in presymptomatic Huntington's disease. Ann Neurol 2001;49:29–34. [PubMed] [Google Scholar]
- 4.Vonsattel JP, Myers RH, Stevens TJ, Ferrante RJ, Bird ED, Richardson EP Jr. Neuropathological classification of Huntington's disease. J Neuropathol Exp Neurol 1985;44:559–577. [DOI] [PubMed] [Google Scholar]
- 5.Aylward EH, Sparks BF, Field KM, et al. Onset and rate of striatal atrophy in preclinical Huntington disease. Neurology 2004;63:66–72. [DOI] [PubMed] [Google Scholar]
- 6.Bartel DP. MicroRNAs: genomics, biogenesis, mechanism, and function. Cell 2004;116:281–297. [DOI] [PubMed] [Google Scholar]
- 7.Bartel DP. MicroRNAs: target recognition and regulatory functions. Cell 2009;136:215–233. [DOI] [PMC free article] [PubMed] [Google Scholar]
- 8.Schratt GM, Tuebing F, Nigh EA, et al. A brain-specific microRNA regulates dendritic spine development. Nature 2006;439:283–289. [DOI] [PubMed] [Google Scholar]
- 9.Cao X, Yeo G, Muotri AR, Kuwabara T, Gage FH. Noncoding RNAs in the mammalian central nervous system. Annu Rev Neurosci 2006;29:77–103. [DOI] [PubMed] [Google Scholar]
- 10.Arroyo JD, Chevillet JR, Kroh EM, et al. Argonaute2 complexes carry a population of circulating microRNAs independent of vesicles in human plasma. Proc Natl Acad Sci USA 2011;108:5003–5008. [DOI] [PMC free article] [PubMed] [Google Scholar]
- 11.Burgos K, Malenica I, Metpally R, et al. Profiles of extracellular miRNA in cerebrospinal fluid and serum from patients with Alzheimer's and Parkinson's diseases correlate with disease status and features of pathology. PLoS One 2014;9:e94839. [DOI] [PMC free article] [PubMed] [Google Scholar]
- 12.Kumar S, Reddy PH. Are circulating microRNAs peripheral biomarkers for Alzheimer's disease? Biochim Biophys Acta 2016;1862:1617–1627. [DOI] [PMC free article] [PubMed] [Google Scholar]
- 13.Gui Y, Liu H, Zhang L, Lv W, Hu X. Altered microRNA profiles in cerebrospinal fluid exosome in Parkinson disease and Alzheimer disease. Oncotarget 2015;6:37043–37053. [DOI] [PMC free article] [PubMed] [Google Scholar]
- 14.Hoss AG, Kartha VK, Dong X, et al. MicroRNAs located in the hox gene clusters are implicated in Huntington's disease pathogenesis. PLoS Genet 2014;10:e1004188. [DOI] [PMC free article] [PubMed] [Google Scholar]
- 15.Hadzi TC, Hendricks AE, Latourelle JC, et al. Assessment of cortical and striatal involvement in 523 Huntington disease brains. Neurology 2012;79:1708–1715. [DOI] [PMC free article] [PubMed] [Google Scholar]
- 16.Hoss AG, Labadorf A, Latourelle JC, et al. miR-10b-5p expression in Huntington's disease brain relates to age of onset and the extent of striatal involvement. BMC Med Genomics 2015;8:10. [DOI] [PMC free article] [PubMed] [Google Scholar]
- 17.Hoss AG, Lagomarsino VN, Frank S, Hadzi TC, Myers RH, Latourelle JC. Study of plasma-derived miRNAs mimic differences in Huntington's disease brain. Mov Disord 2015;30:1961–1964. [DOI] [PMC free article] [PubMed] [Google Scholar]
- 18.Paulsen JS, Hayden M, Stout JC, et al. Preparing for preventive clinical trials: the PREDICT-HD study. Arch Neurol 2006;63:883–890. [DOI] [PubMed] [Google Scholar]
- 19.Paulsen JS, Long JD, Ross CA, et al. Prediction of manifest Huntington disease with clinical and imaging measures: a 12-year prospective observational study. Lancet Neurol 2014;13:1193–1201. [DOI] [PMC free article] [PubMed] [Google Scholar]
- 20.Huntington Study Group. Unified Huntington's Disease Rating Scale: reliability and consistency. Mov Disord 1996;11:136–142. [DOI] [PubMed] [Google Scholar]
- 21.Zhang Y, Long JD, Mills JA, Warner JH, Lu W, Paulsen JS; PREDICT-HD Investigators and Coordinators of the Huntington Study Group. Indexing disease progression at study entry with individuals at risk for Huntington disease. Am J Med Genet B Neuropsychiatr Genet 2011;156:751–763. [DOI] [PMC free article] [PubMed] [Google Scholar]
- 22.Martin M. Cutadapt removes adapter sequences from high-throughput sequencing reads. EMBnet.journal 2011;17:10. [Google Scholar]
- 23.Langmead B, Trapnell C, Pop M, Salzberg SL. Ultrafast and memory-efficient alignment of short DNA sequences to the human genome. Genome Biol 2009;10:R25. [DOI] [PMC free article] [PubMed] [Google Scholar]
- 24.Quinlan AR, Hall IM. BEDTools: a flexible suite of utilities for comparing genomic features. Bioinformatics 2010;26:841–842. [DOI] [PMC free article] [PubMed] [Google Scholar]
- 25.Kozomara A, Griffiths-Jones S. MiRBase: annotating high confidence microRNAs using deep sequencing data. Nucleic Acids Res 2014;42:68–73. [DOI] [PMC free article] [PubMed] [Google Scholar]
- 26.Lawrence M, Huber W, Pagès H, et al. Software for computing and annotating genomic ranges. PLoS Comput Biol 2013;9:e1003118. [DOI] [PMC free article] [PubMed] [Google Scholar]
- 27.Love MI, Huber W, Anders S. Moderated estimation of fold change and dispersion for RNA-seq data with DESeq2. Genome Biol 2014;15:550. [DOI] [PMC free article] [PubMed] [Google Scholar]
- 28.Johnson WE, Li C, Rabinovic A. Adjusting batch effects in microarray expression data using empirical Bayes methods. Biostatistics 2007;8:118–127. [DOI] [PubMed] [Google Scholar]
- 29.Benjamini Y, Hochberg Y. Controlling the false discovery rate: a practical and powerful approach to multiple testing. J R Stat Soc 1995;57:289–300. [Google Scholar]
- 30.Stout JC, Paulsen JS, Queller S, et al. Neurocognitive signs in prodromal Huntington disease. Neuropsychology 2011;25:1–14. [DOI] [PMC free article] [PubMed] [Google Scholar]
- 31.Paulsen JS, Nopoulos PC, Aylward E, et al. Striatal and white matter predictors of estimated diagnosis for Huntington disease. Brain Res Bull 2010;82:201–207. [DOI] [PMC free article] [PubMed] [Google Scholar]