

Abstract
We use microsimulation to forecast changes in coronary heart disease (CHD) among adults 45 or above over a 20-year time horizon in Los Angeles County (N = 3.4 million), a county with 12 635 CHD deaths in 2010. We simulate individuals’ life course and calibrate CHD trends to observed trends in the past. Using the Health Forecasting Community Health Simulation Model, we simulate CHD prevalence and CHD mortality in 2 CHD prevention scenarios: (1) “comprehensive hypertension intervention” and (2) “gradual reduction of the average adult body mass index back to the year 2000 level.” We use microsimulation methodology so that nonprofit hospitals can easily use our model to forecast intervention results in their specific hospital catchment area. Our baseline model (without intervention) forecasts an increase in CHD prevalence that will reach 13.01% among those 45+ in Los Angeles County in 2030. Under scenario 1, the increase in CHD prevalence is slower (12.47% in 2030), and the prevalence in scenario 2 reaches 12.83% in 2030. The baseline scenario projects a number of 21 300 CHD deaths in 2030, whereas there will be 20 070 CHD deaths under scenario 1 and 20 970 CHD deaths under scenario 2. At the population level, the CHD mortality outcome, as compared with the metric of CHD prevalence, might be more sensitive to preventive lifestyle interventions. Both CHD prevalence and CHD mortality might be more sensitive to the hypertension intervention than to the obesity reduction in the time horizon of 20 years.
Keywords: microsimulation, prevention, public health, systems science
Introduction
Recent changes in United States federal law and health care guidelines have shifted the role of nonprofit hospitals from reactive clinical care management to proactive population health management for patients and residents living in the surrounding community.1 One of the possible desirable consequences of this shift is the reduction of preventable health care costs through minimizing the burden of disease and improving health equity. Measures outlined in the federal Affordable Care Act require nonprofit hospitals to conduct a community health needs assessment and design an implementation plan to improve community health in their catchment area.2 However, strategically identifying effective interventions for unique community-level populations and quantifying the impact of these program changes are inherently complex, given the interplay of many different factors including demographics, health behavior, environment, and so forth. For example, a proven intervention among the general population might not be effective in certain ethnic enclaves due to their unique risk profile, and an intervention that successfully slows down the increase in the prevalence of certain aging-related diseases might not be viewed as “successful” because the counterfactual scenario of a faster increase is not observable.
The emphasis on prevention through proactive hospital-initiated community benefit activities has led to a need for local health data, standardization of measurement indicators/benchmarks, as well as a mechanism or tool to inform prioritization and resource allocation decisions using evidence-based research. Simulation modeling, in particular, can be used here to “deal with detail complexity by simulating the life histories of individuals, and then estimating the population effect from the sum of the individual effects (p 61).”3 Among various simulation tools, microsimulation-based forecasting is one approach to systematically integrate disparate elements into a simulated environment to compare baseline and alternative environments. The microsimulation approach is particularly suitable for demographically diverse areas like California4 where heterogeneous groups are at different risk for suboptimal lifestyle because the modeler can assign different risk profile for different demographic groups as observed from existing data.
In this study, we use a microsimulation model to forecast the prevalence of coronary heart disease (CHD) and associated deaths for nonprofit hospital service planning areas in Los Angeles County, and we simulate the impact of CHD prevention interventions over a 20-year time horizon to inform hospital population management strategies. We choose to model CHD prevalence and CHD mortality because CHD is the leading cause of death in Los Angeles County5 as well as in the United States.6 The advantage of our microsimulation approach is its ability to simultaneously include various disease risk functions on different subpopulations by aggregating individual life course events, while accounting for the effects from each individual’s social determinants of health.7 This microsimulation model is a variant of our well-validated UCLA Health Forecasting Tool.8,9,17
One important feature of our model is its introduction of a time dimension into applied health policy simulation. The model output provides a detailed view of how changes in health unfold over time, year by year, due to duration of exposure (eg, the time between exposure to interventions and observable outcomes later in the life course) and age-dependent processes. The time horizon in our forecasting model enables population health planners to more accurately assess their local health status and impact of interventions, which, according to our published modeling work on chronic diseases and risk factor modifications,4-6,17 often take decades to manifest itself.
Methods
Research Questions
Our research questions are given as follows:
Research Question 1: Which interventions will be effective in reducing CHD prevalence among people aged 45 and above in Los Angeles County by 2030?
Research Question 2: Which interventions will be effective in reducing CHD mortality cases among people aged 45 and above in Los Angeles County by 2030?
Model Platform
To answer these 2 research questions, we use our Health Forecasting Community Health Simulation Model (CHeSMo) to project the long-term outcomes of 2 hypothetical interventions. This model was developed on the platform of a C++ superscript (“ModGen”; a tool developed by Statistics Canada, Canada’s national statistical agency). ModGen is a general simulation platform and has been used to generate population models in labor, migration, and public health.10-12 Our simulation model follows a systems approach that incorporates evidence-based causal mechanisms to link individual-level demographic and behavioral factors to health outcomes (Figure 1). By simulating the trends in chronic health risks and conditions over the life course, we use our model to forecast changes in Los Angeles County over a 20-year time horizon for the costly yet preventable health condition: CHD (Figure 2).
Figure 1.

Components of Health Forecasting Community Health Simulation Model.
Figure 2.
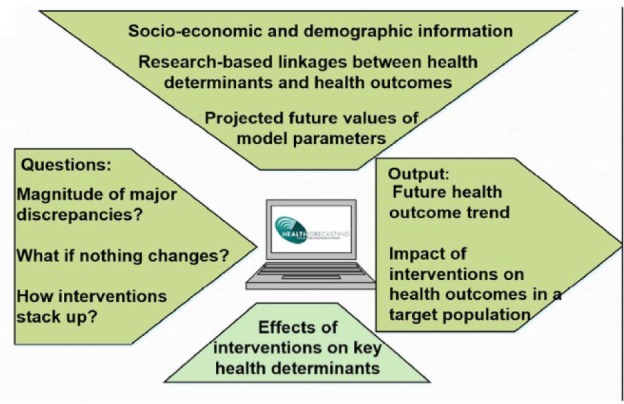
Inputs and outputs of the Health Forecasting Community Health Simulation Model.
CHeSMo is comprised of 4 main modules:
Demographic module: We simulate the births, deaths, and migration of different ethnic groups to reflect the age, gender, and ethnicity breakdown of Los Angeles County as well as its past demographic trends. One’s risk for CHD at 45 and above could have developed during his or her earlier years, and that is why we simulate the individual’s life from birth. We did not simulate any intervention for people below 45, but we still simulate the entire life course of the individuals, expecting to simulate the link between early-life interventions and CHD in future studies.
Risk factor/disease prevalence module: We simulate risk factor trends and disease trends in the population based upon data from the Los Angeles County Health Survey13 and the California Health Interview Survey.14
Forecasting module: We simulate the ethnicity-specific population growth trends based on projections made by California Department of Finance and forecast future health trends based upon the growth pattern observed in the past.
Intervention module: Evidenced-based health interventions with their intervention effect estimates were drawn from the documented literature.
Input and Output Parameters and Variables
The demographic foundation of the model’s forecasting module is based on the California Department of Finance’s population projections and methodology.15 We obtained demographic and epidemiological parameters from data sources, such as the United States Census,16 Los Angeles County Health Survey,17 California Health Interview Survey,14 and the Behavioral Risk Factor Surveillance System,18 as well as published risk factors and effect estimates from existing literature. Table 1 lays out the parameters used in this study and their sources. The output parameters are CHD prevalence and CHD mortality in a simulated calendar year.
Table 1.
Data Sources of Parameters Used in Health Forecasting Community Health Simulation Model.
| Data source | Parameters |
|---|---|
| United States Census | Demographic makeup of birth cohorts |
| Los Angeles County Health Survey | Disease prevalence (hypertension and coronary heart disease) |
| California Health Interview Survey (the Los Angeles County subsample) | Health behavior and health conditions |
| The Compressed Mortality File 1997-Current | All-cause mortality and disease-specific mortality statistics by year |
The input variables simulated in this model include hypertension status and the body mass index (BMI) of individuals, whereas the output variables in this model are (1) whether an individual has been diagnosed as having CHD and (2) whether an individual dies of CHD.
Simulation Process
Our baseline population forecasting is based upon California Department of Finance’s county-level projections of future population trends. We use these parameters to simulate individuals’ life course from childhood to death and validated our simulation approach based upon the fitting to observed CHD trends in the past (“backcasting”). Each individual “actor” is assigned a gender, race/ethnic, and year of birth based upon these variables’ frequency distribution in the Los Angeles County population, and then his or her health behavior (eg, the probability of initiating cigarette smoking at a certain age) is conditional on these demographic features. Details about our simulation flow in CHD modeling have been documented in an earlier publication4 and its technical working document (http://www.health-forecasting.org/images/pdf/Technical%20Document%20November%2014%202008%20-%20Draft.pdf).
States denoting health outcomes (hypertension incidence, CHD incidence, CHD mortality, etc) are then updated each year for the individual, based upon the individual’s health behavior and demographic characteristics in a specific year. In this study, hypertension status of an individual is modeled both as a function of health behaviors (including age, gender, race/ethnicity, obesity status, and physical activity) and a determinant of CHD incidence and mortality. CHD incidence and mortality are modeled as functions of age, gender, race/ethnicity, obesity status, physical activity, and hypertension status.
The aggregated outcome of all simulated individuals then constitutes the population-level health outcomes such as life expectancy and disease prevalence. The CHD model uses continuous-time modeling to simplify the simulation of multiple processes with myriad events, because in a discrete-time model this large number of events would result in an explosion of all possible state transitions and render the calibration work difficult.19
For the intervention module, we model 2 intervention scenarios that had been identified by our partner hospitals and the Community Preventive Services Task Force recommendations (“the Community Guide”).20 The scenarios are as follows:
“Comprehensive hypertension intervention among hypertensive and prehypertensive adults”: A hypothetical intervention was modeled after the “Dietary Approaches to Stop Hypertension” (DASH) intervention, whereby we assume that hypertensive participants receiving the intervention will have 30% probability of becoming prehypertensive and those prehypertensive participants receiving the intervention will have 15% probability of becoming nonhypertensive).21 We choose the DASH intervention because a meta-analysis of observational prospective studies has shown its prevention benefits against CHD incidence.22
“Gradual reduction of the average adult BMI back to the year 2000 level”:23 an intervention goal that aims at the risk factor of obesity instead of hypertension. This is a simulation scenario we have implemented in modeling the CHD trends in California4 when exploring the prevention potential of a state-wide BMI decrease on CHD outcomes.
For each scenario, 10 million repetitions were run to generate the aggregate output parameters of CHD prevalence and mortality in every simulated calendar. We then provide an online interface for our partner hospitals where they can assess the long-term effectiveness of these interventions on CHD incidence, prevalence, and mortality within their catchment area, as a subset of the model outputs for the Los Angeles County.
Results
Our model forecasts that by 2030, the CHD prevalence among adults aged 45 and older in Los Angeles County will reach 13.01% (95% confidence interval = [12.81%, 13.21%]; the baseline scenario where no population-wide prevention is simulated). The prevalence in 2030 will be 12.47% (95% confidence interval = [12.27%, 12.67%]) under the “comprehensive hypertension intervention” scenario and 12.83% (95% confidence interval = [12.63%, 13.03%]) under the “adult BMI decrease to the year 2000 level” scenario. Figure 3 graphs the difference in CHD prevalent cases between the baseline scenario and the 2 prevention intervention scenarios in Los Angeles County among the population aged 45 and above.
Figure 3.

Difference in CHD prevalent cases between baseline scenario and intervention scenarios in Los Angeles County among the population aged 45 and older (2010-2030).
Note. CHD = coronary heart disease; BMI = body mass index.
For the CHD mortality outcome, the baseline scenario projects a total number of 21 300 CHD deaths in 2030, and in 2030, there will be 20 070 CHD deaths under the “comprehensive hypertension intervention” scenario and 20 970 CHD deaths under the “adult BMI decrease to the year 2000 level” scenario. Figure 4 illustrates the temporal pattern of these CHD mortality reductions.
Figure 4.

Difference in number of coronary heart disease deaths between baseline scenario and intervention scenarios in Los Angeles County (2010-2030).
Note. BMI = body mass index.
Discussion
As noted by one of our earlier publications,17 a common pattern in long-term effectiveness of these prevention programs is that the prevalence level of chronic diseases does not decrease immediately after the intervention. One important reason why the prevalence does not quickly decrease is that major lifestyle-based prevention interventions usually function as a “treatment” for those who have already developed this chronic disease, thereby increasing their survival time living with that disease. Longer survival with a certain chronic disease, everything else being equal, means a higher prevalence level of the particular disease as fewer patients “exit” the pool of patients living with that disease.
Reducing obesity or hypertension among people in the hospital’s catchment area has this de facto impact of making those CHD patients live longer, and this mechanism might have offset the impact of CHD incidence reduction in terms of decreasing CHD prevalence. In this case, measuring CHD mortality as an outcome might better reflect the benefit of these lifestyle interventions in the community because it captures both the benefit in primary prevention (keeping people from developing CHD) and the benefit in secondary prevention (improving the survival of CHD patients). In this sense, our study could inform hospitals in picking good metrics in measuring their intervention outcomes in their community.
In both CHD prevalence and CHD mortality, the scenario of “comprehensive hypertension intervention” compares favorably with the BMI reduction scenario, even if the goal of decreasing average BMI back to the 2000 level is an ambitious goal in obesity prevention. This “advantage” of hypertension intervention in terms of CHD prevention is not surprising as hypertension is already a cardiovascular condition while the body weight status is still a lifestyle-related risk factor. Even though obesity reduction itself could prevent hypertension and its associated harms, it could take longer for this kind of benefit to show up in outcomes related with CHD,24 whereas decreasing blood pressure could deliver a more immediate benefit in reducing deaths from cardiovascular causes.25 Our study results, however, should not discourage any obesity intervention among the adult population, because our results only show that at the population level a comprehensive hypertension intervention might reduce the CHD burden faster than an obesity reduction program does.
Combined with graphic illustrations and training seminars for our partnering hospitals, microsimulating health outcomes for individual life courses to generate population-level health forecasts has the potential of providing nonprofit hospitals with a forward-looking time dimension to effectively anticipate, prepare, and plan for healthier communities. As an early attempt to assist nonprofit hospitals strategize their community intervention, we used localized demographic data and a population microsimulation model to compare the long-term effectiveness of various CHD prevention programs. Hospitals can use our simulated results to optimize the impact of intervention investments by identifying high-risk subpopulations and projecting the long-term effectiveness of interventions within their service planning areas. We look to evaluate the user feedback from our partnering hospitals, before expanding our efforts to nonprofit hospitals beyond the Los Angeles County.
The systems approach to population health management is a nascent field. Although microsimulation modeling has been used extensively in engineering,26 economics,27 and other fields,28,29 its use in health services research is not yet very common and has been limited primarily to epidemiological studies,30,31 not community-based prevention research. We expect that the resultant knowledge from our simulation will facilitate hospitals’ optimization of their community service programs, that is, to produce maximum health benefit for the community within their resource constraints. By better understanding these time-dependent effects at both the individual and population level, expectations of community service programs can be more realistic and can be fine-tuned to particular subpopulations where needs and potential impact are highest.
Our microsimulation approach is limited in that it does not incorporate the agent interaction between individuals in a society. In other words, in DASH intervention among hypertensive and prehypertensive patients, their behavioral change after the intervention could have spillover peer influence on the dietary behavior of those who are still normotensive (neither hypertensive nor prehypertensive) and thus lowers the transition probability from normotension to prehypertension. Moreover, patients in the United States change insurance or move out of the catchment area, which complicates plans to reap the benefits of investments in prevention years later. Agent-based modeling captures these kinds of peer influence32,33 and patient-hospital interaction34 and thus needs to be used for future modeling of cardiovascular outcomes at the population level.
It remains uncertain whether these primordial preventions can be delivered by nonprofit hospitals with the effect sizes we draw from the randomized controlled trial of DASH, which is an assumption our study has made. Further evidence from the DASH implementation under different contexts will be helpful in informing future simulations involving the DASH intervention. However, by focusing solely on the CHD outcomes, we might also have underestimated the potential of these simulated interventions, because both obesity reduction and DASH could prevent other chronic diseases such as stroke22 and diabetes.35
Finally, we are aware that the use of microsimulation raises concerns related to lack of transparency and efficiency compared with cohort simulation.36 However, we chose to use microsimulation given its capability in handling many variables simultaneously (from risk factors of hypertension to different disease states of hypertension and CHD). Moreover, one very important feature of microsimulation is that for the same intervention, it can show potentially different levels of influence among different racial–ethnic groups, making it an important advantage in planning to reduce health disparities.37 A key strength of our model is its ability to account for epidemiologic dynamics (eg, prevalence-affecting incidence) and demographic changes, as shown in our simulation of diabetes trends in California.17 Our simulation in this study has not yet explored the potentially differential patterns among different demographic groups, which will be the focus of our future efforts in model development.
Acknowledgments
The authors thank UniHealth Foundation for their generous support of this modeling effort. Dr Jonathan E Fielding led this project, and Dr Jeroen van Meijgaard conducted major modeling work for this model.
Footnotes
Declaration of Conflicting Interests: The author(s) declared no potential conflicts of interest with respect to the research, authorship, and/or publication of this article.
Funding: The author(s) received no financial support for the research, authorship, and/or publication of this article.
References
- 1. Curtis J. Community benefits and Schedule H: holding nonprofit hospitals accountable for their financial policies and practices. 141st APHA Annual Meeting; November 2-November 6, Boston, MA; 2013. [Google Scholar]
- 2. Spicer LA, Somerville MH, Mueller CH, et al. Hospital Community Benefits After the ACA: The Emerging Federal Framework. Baltimore, MD: Hilltop Institute at the University of Maryland; 2011. [Google Scholar]
- 3. Fone D, Hollinghurst S, Temple M, et al. Systematic review of the use and value of computer simulation modelling in population health and health care delivery. J Public Health Med. 2003;25:325-335. [DOI] [PubMed] [Google Scholar]
- 4. Bostean G, Roberts CK, Crespi CM, et al. Cardiovascular health: associations with race-ethnicity, nativity, and education in a diverse, population-based sample of Californians. Ann Epidemiol. 2013;23(7):388-394. [DOI] [PMC free article] [PubMed] [Google Scholar]
- 5. Office of Planning, Evaluation, and Development. Community Health Assessment 2015. Los Angeles, CA: County of Los Angeles Department of Public Health; 2015. [Google Scholar]
- 6. Miniño AM, Murphy SL, Xu J, Kochanek KD. Deaths: final data for 2008. Hyattsville, MD: US Department of Health and Human Services, CDC, National Center for Health Statistics; http://www.cdc.gov/nchs/data/nvsr/nvsr59/nvsr59_10.pdf. National Vital Statistics Report, vol. 59, no. 10 Published 2011. Accessed August 8, 2016. [PubMed] [Google Scholar]
- 7. van Meijgaard J, Fielding JE, Kominski GF. Assessing and forecasting population health: integrating knowledge and beliefs in a comprehensive framework. Public Health Rep. 2009;124(6):778-789. [DOI] [PMC free article] [PubMed] [Google Scholar]
- 8. van Meijgaard J, Fielding JE. Estimating benefits of past, current, and future reductions in smoking rates using a comprehensive model with competing causes of death. Prev Chronic Dis. 2012;9:110295. [DOI] [PMC free article] [PubMed] [Google Scholar]
- 9. Shi L, van Meijgaard J, Fielding JE. Long-term effects of health factor modification in Milwaukee County. J Public Health Manag Pract. 2013;19(2):133-138. [DOI] [PubMed] [Google Scholar]
- 10. Vasquez GE, Ponzoni I, Sanchez MC, Brignole NB. Modgen: a model generator for instrumentation analysis. Adv Eng Softw. 2001;32(1): 37-48. [Google Scholar]
- 11. Spielauer M. Ethno-cultural diversity and educational attainment: the modeling of education in the Canadian DemoSim population projection model. In 2nd General Conference of the International Microsimulation Association, Ottawa, Canada; June 2009. [Google Scholar]
- 12. Kopec JA, Finès P, Manuel DG, et al. Validation of population-based disease simulation models: a review of concepts and methods. BMC Public Health. 2010;10(1):710. [DOI] [PMC free article] [PubMed] [Google Scholar]
- 13. Simon PA, Wold CM, Cousineau MR, Fielding JE. Meeting the data needs of a local health department: the Los Angeles County Health Survey. Am J Public Health. 2001;91(12):1950-1952. [DOI] [PMC free article] [PubMed] [Google Scholar]
- 14. Ponce NA, Lavarreda SA, Yen W, Brown ER, DiSogra C, Satter DE. The California Health Interview Survey 2001: translation of a major survey for California’s multiethnic population. Public Health Rep. 2004;119(4):388-395. [DOI] [PMC free article] [PubMed] [Google Scholar]
- 15. Department of Finance. Report P-1 (County): State and County Total Population Projections, 2010-2060. Sacramento, CA: State of California; January 2013. [Google Scholar]
- 16. Copen CE, Thoma ME, Kirmeyer S. Interpregnancy intervals in the United States: data from the birth certificate and the national survey of family growth. National Vital Statistics Reports. 2015;64(3). [PubMed] [Google Scholar]
- 17. Yancey AK, Wold CM, McCarthy WJ, et al. Physical inactivity and overweight among Los Angeles County adults. Am J Prev Med. 2004;27(2):146-152. [DOI] [PubMed] [Google Scholar]
- 18. Nelson DE, Powell-Griner E, Town M, Kovar MG. A comparison of national estimates from the National Health Interview Survey and the Behavioral Risk Factor Surveillance System. Am J Public Health. 2003;93:1335-1341. [DOI] [PMC free article] [PubMed] [Google Scholar]
- 19. Shi L, van Meijgaard J, Fielding JE. Forecasting diabetes prevalence in California: a microsimulation. Prev Chronic Dis. 2011;8(4):A80. [PMC free article] [PubMed] [Google Scholar]
- 20. Briss PA, Zaza S, Pappaioanou M, et al. Developing an evidence-based guide to community preventive services—methods. Am J Prev Med. 2000;18(suppl 1):35-43. [DOI] [PubMed] [Google Scholar]
- 21. Sacks FM, Svetkey LP, Vollmer WM, et al. Effects on blood pressure of reduced dietary sodium and the Dietary Approaches to Stop Hypertension (DASH) diet. DASH-Sodium Collaborative Research Group. N Engl J Med. 2001;344(1):3-10. [DOI] [PubMed] [Google Scholar]
- 22. Salehi-Abargouei A, Maghsoudi Z, Shirani F., Azadbakht L. Effects of Dietary Approaches to Stop Hypertension (DASH)-style diet on fatal or nonfatal cardiovascular diseases—incidence: a systematic review and meta-analysis on observational prospective studies. Nutrition. 2013;29(4):611-618. [DOI] [PubMed] [Google Scholar]
- 23. Flegal KM, Carroll MD, Ogden CL, Johnson CL. Prevalence and trends in obesity among US adults, 1999-2000. JAMA. 2002;288:1723-1727. [DOI] [PubMed] [Google Scholar]
- 24. Fenske WK, Dubb S, Bueter M, et al. Effect of bariatric surgery-induced weight loss on renal and systemic inflammation and blood pressure: a 12-month prospective study. Surg Obes Relat Dis. 2003;9(4):559-568. [DOI] [PubMed] [Google Scholar]
- 25. SPRINT Research Group. A randomized trial of intensive versus standard blood-pressure control. N Engl J Med. 2015;2015(373);2103-2116. [DOI] [PMC free article] [PubMed] [Google Scholar]
- 26. Bernauer E, Boero M, Breheret L, et al. Review of Micro-Simulation Models. Leeds, UK: Institute for Transport Studies; 1997. [Google Scholar]
- 27. Bourguignon F, Spadaro A. Microsimulation as a tool for evaluating redistribution policies. J Econ Inequal. 2006;4(1):77-106. doi: 10.1007/s10888-005-9012-6. [DOI] [Google Scholar]
- 28. Malleson N, Birkin M. Analysis of crime patterns through the integration of an agent-based model and a population microsimulation. Comput Environ Urban Syst. 2012;36(6):551-561. [Google Scholar]
- 29. Nakaya T, Fotheringham A, Hanaoka K, Clarke G, Ballas D, Yano K. Combining microsimulation and spatial interaction models for retail location analysis. J Geogr Syst. 2007;9(4):345-369. [Google Scholar]
- 30. Habbema JDF, Van Oortmarssen GJ, Lubbe JTN, Van der Maas PJ. The MISCAN simulation program for the evaluation of screening for disease. Comput Methods Programs Biomed. 1985;20(1):79-93. [DOI] [PubMed] [Google Scholar]
- 31. Shi L, Tian H, McCarthy WJ, Berman B, Wu S, Boer R. Exploring the uncertainties of early detection results: model-based interpretation of mayo lung project. BMC Cancer. 2011;11(1):92. [DOI] [PMC free article] [PubMed] [Google Scholar]
- 32. Zhang D, Giabbanelli PJ, Arah OA, Zimmerman FJ. Impact of different policies on unhealthy dietary behaviors in an urban adult population: an agent-based simulation model. Am J Public Health. 2014;104(7):1217-1222. [DOI] [PMC free article] [PubMed] [Google Scholar]
- 33. Li Y, Zhang D, Pagán JA. Social norms and the consumption of fruits and vegetables across New York City neighborhoods. J Urban Health. 2016;93(2):244-255. [DOI] [PMC free article] [PubMed] [Google Scholar]
- 34. Liu P. An Agent-Based Model to Study Accountable Care Organizations [dissertation]. Los Angeles: University of Southern California; 2013. [Google Scholar]
- 35. Hamman RF, Wing RR, Edelstein SL, et al. Effect of weight loss with lifestyle intervention on risk of diabetes. Diabetes Care. 2006;29(9):2102-2107. [DOI] [PMC free article] [PubMed] [Google Scholar]
- 36. Garnett GP, Cousens S, Hallett TB, Steketee R, Walker N. Mathematical models in the evaluation of health programmes. Lancet. 2011;378(9790):515-525. [DOI] [PubMed] [Google Scholar]
- 37. Mekonnen TA, Odden MC, Coxson PG, et al. Health benefits of reducing sugar-sweetened beverage intake in high risk populations of California: results from the cardiovascular disease (CVD) policy model. PLoS One. 2013;8(12):e81723. [DOI] [PMC free article] [PubMed] [Google Scholar]