Abstract
Goal
Clinical studies identifying rotors confirming these sites for ablation in treating cardiac arrhythmias have had inconsistent results with the currently available analysis techniques. The aim of this study is to evaluate four new signal analysis approaches – multiscale frequency (MSF), Shannon entropy (SE), Kurtosis (Kt), and multiscale entropy (MSE) – in their ability to identify the pivot point of rotors.
Methods
Optical mapping movies of ventricular tachycardia were used to evaluate the performance and robustness of SE, Kt, MSF and MSE techniques with respect to several clinical limitations: decreased time duration, reduced spatial resolution, and the presence of meandering rotors. To quantitatively assess the robustness of the four techniques, results were compared to the “true” rotor(s) identified using optical mapping-based phase maps.
Results
The results demonstrate that MSF, Kt, and MSE accurately identified both stationary and meandering rotors. In addition, these techniques remained accurate under simulated clinical limitations: shortened electrogram duration and decreased spatial resolution. Artifact mildly affected the performance of MSF, Kt, and MSE, but strongly impacted the performance of SE.
Conclusion
These results motivate further validation using intracardiac electrograms to see if these approaches can map rotors in a clinical setting and whether they apply to more complex arrhythmias including atrial or ventricular fibrillation.
Significance
New techniques providing more accurate rotor localization could improve characterization of arrhythmias and, in turn, offer a means to accurately evaluate whether rotor ablation is a viable and effective treatment for chaotic cardiac arrhythmias.
Index Terms: optical mapping, pivot point, rotor, ventricular tachycardia
I. Introduction
Cardiac arrhythmias may be mediated by a variety of mechanisms, ranging from focal automaticity to macroreentry to more complex states where organized activity may be difficult or even impossible to define. In certain arrhythmias, including atrial (AF) and ventricular fibrillation (VF), the characteristic finding is global disorganization of activity in the associated chamber [1]. In the case of AF, for example, multiple hypotheses have been proposed since the 1950s regarding the pathophysiology underlying both the initiation and maintenance of the arrhythmia. One mechanism that has been of particular interest is rotors, or regions of functional reentry, as have been demonstrated using optical mapping ex vivo studies [2]. These findings have led to development of multiple methods aiming to use electrogram data to reproduce these optical mapping results and, in turn, determine potential critical ablation targets for treating AF [1],[3]-[5]. However, clinical studies have not been reproducible, thus calling into question the ability to identify rotors using traditional electrogram approaches; and whether these areas, if identified, truly reflect ablation targets.
Several techniques have previously been developed to use intracardiac electrograms to characterize rotors. These techniques include dominant frequency (DF) [11]-[14], local activation time using isochronal maps [14],[15], complex fractionated atrial electrogram mean index mapping [14],[16],[17], and phase analysis using phase singularity evaluation [14],[18],[19]. However, none of these techniques were successfully implemented in clinical settings due to various limitations [20]. Of these techniques, only the DF method has been verified using optical mapping [21] and numerical simulations [22], in which direct visualization of the rotor is possible. However, application of DF alone does not provide robust results [22]. Thus, there is a clear need for robust spatio-temporal techniques that can consistently identify rotors.
Recently, several new signal analysis approaches have been developed – Shannon entropy (SE) [20,23], multi-scale frequency (MSF) [24], Kurtosis (Kt) [25], and multi-scale entropy (MSE) [26] – to identify the pivot points of rotors in the case when rotors can be easily visualized using optical mapping techniques. These proposed techniques utilize different cardiac signal characteristics, other than local activation, to uncover the intrinsic complexity of the electrical activity in the rotors, which are not taken into account in current mapping methods. However, application of experimental data regarding the relevance of rotors has been challenging in part due to several clinical limitations associated with intracardiac mapping including short duration electrogram recordings, low spatial resolution, and the presence of meandering rotors.
In this paper, we seek to determine whether our recently developed techniques, including MSF, SE, Kt, and MSE, can be used to successfully identify rotors in arrhythmia episodes captured using optical mapping data and show potential for translation to clinical intracardiac electrograms identifying targets for ablation. Specifically, we seek to overcome the following challenges: (1) limitations in attaining simultaneous data from spatially distant locations; (2) electrogram data, which looks at local activation, fundamentally looks at different information than optical mapping, which looks at both depolarization and repolarization; and (3) temporal variability in the geographic location of rotors making interpretation of individual electrograms obtained at different points in time difficult to interpret.
Our results may help characterize the utility of different signal processing approaches to defined regions of organized activity in more complex arrhythmias.
II. Methods
Optical mapping studies were performed on two isolated rabbit hearts as described previously [27],[28] All procedures were approved by the University of Minnesota Animal Care and Use Committee and were conducted in accordance with Institutional and NIH guidelines. Episodes of VT were induced using burst pacing, and two examples of rotors were used: (1) a single stationary rotor and (2) figure-of-8 reentry with one stationary and one meandering rotor. Movies were captured for 3 seconds at a rate of 600 frames per second with 64×64 pixel resolution using voltage-sensitive dye and 12-bit CCD cameras. In each frame, the background fluorescence was subtracted and spatial (3×3 pixels) and temporal (5 frames) conical convolution filters were used to increase the signal-to-noise ratio.
The phase movies were generated using the Hilbert transform, which calculates instantaneous phase allowing for the visualization of the depolarized and repolarized tissue. Gray et al. demonstrated that phase movies allow for the clear identification of the rotor pivot point as the location at which all phases meet (phase singularity), which serve as a gold standard for locating the rotor in the examples presented [29]. Using phase maps, the singularity points were tracked, frame by frame to obtain a final pixel map representing the “true” location of the rotor pivot point. This map was used as a comparison for the identification of the pivot points for the five approaches described in Table 1. Specifically, DF and MSF were determined in the frequency domain. SE and Kt characterize the voltage intensities at each pixel. In addition, the time-series morphology and complexity were quantified using MSE. Additional information regarding these different approaches is included in the Supplemental Materials. All analysis was performed using a custom-written MATLAB™ (Mathworks, Inc., Natick, MA) program.
Table I.
Summary of signal processing techniques
| Method | Equation | Variable Definition | Description | References | |
|---|---|---|---|---|---|
|
Dominant Frequency (DF) |
|
X(f); spectrum of the voltage intensity time series | Calculates the peak frequency in the signal spectrum (0–30 Hz) of the voltage intensity time series. | 11–14 | |
|
Multiscale Frequency (MSF) |
|
ρ: local MSF estimate qi: output of the ith log-Gabor filter ρo: center frequency of the first log-Gabor filter |
Calculates the instantaneous frequency using the signal spectrum (0–30 Hz) of the voltage intensity time series | 24 | |
|
Shannon Entropy (SE) |
|
N: number of amplitude bins ρ: probability of any sample falling within a particular amplitude bin |
Quantifies the uncertainty in the voltage intensity distribution | 20, 23 | |
|
Kurtosis (Kt) |
|
E: expected value x(t): voltage intensity time series σx: variance of the voltage intensity time serie |
Quantifies the ‘peakedness’ of the voltage intensity distribution | 25 | |
|
Multiscale Entropy (MSE) |
|
A: number of matched vector pairs of length m+1 from the moving average time series B: number of matched vector pairs of length m from the moving average time series |
Calculates the moving average of the voltage intensity time series and quantifies the regularity and repetitiveness of the data | 26 |
A. Rotor Identification and Quantification
Receiver operating characteristic (ROC) curves were constructed for all techniques by using the corresponding 2D maps generated from the original 3 sec., 64×64 pixel movies. Specifically, the corresponding MSF, SE, Kt, and MSE values for each 2D map were ranged from 1% to 99%, and the optimal point on each ROC curve, corresponding to the highest sensitivity and specificity, was identified as demonstrated in Supplemental Figure S.1. These points were used to define individual thresholds for the pivot points of the rotors for each technique.
Then, the pixels in the 2D maps corresponding to the pivot point of rotor were determined based on the individual thresholds for each MSF, SE, Kt, and MSE techniques, and compared with the “true” rotor location, to calculate the accuracy of each technique. Specifically, the number of pixels, as well as their location, were identified to determine the number of true positives (TP), true negatives (TN), false positives (FP), and false negatives (FN). From this data, accuracy was calculated as:
| (1) |
The accuracy of each approach was calculated under various time series durations (3 sec, 2 sec, 1 sec, and 0.5 sec) and spatial resolutions (64×64, 32×32, 16×16, and 8×8 pixels) using the sliding window analysis, as described in the Supplemental Materials (Figure S.2, top panel). Similar process and Eqn. 1 was then used to calculate optimal thresholds and optimal accuracies for each technique, which were defined separately for each reduced time series duration and spatial resolutions.
III. Results
A. Identifying a Pivot Point of a Single Stationary Rotor
A snapshot of the phase movie from a single stationary rotor is shown in Fig. 1A, where different colors represent different phases of an action potential, and the singularity point is seen where all phases converge [26]. Fig. 1B shows the “true” location of the pivot point identified from the phase movie. Representative examples of time series, power spectrums, and voltage intensity distributions are shown in Fig. 1D for the core and periphery of the rotor (pixels ‘1’ and ‘2’ from Fig. 1A).
Fig. 1.
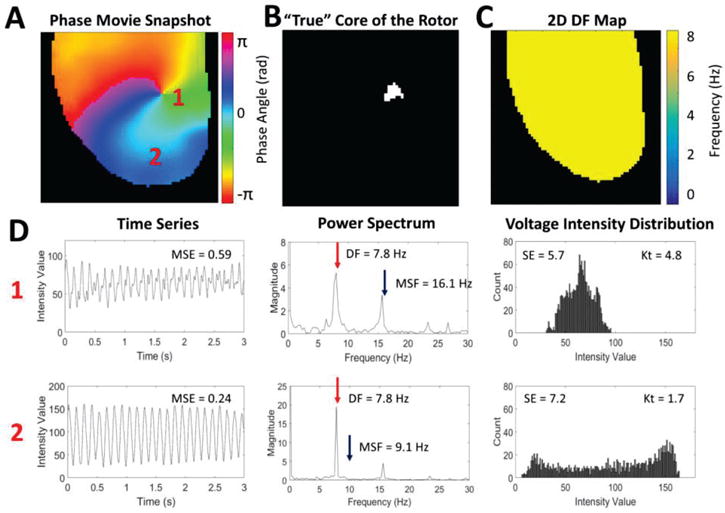
An example of a single stationary rotor from optical mapping of a rabbit heart. (A) Snapshot of the phase movie of the single stationary rotor with the depolarizing wave front shown in red. The pivot point and periphery of the rotor are identified by ‘1’ and ‘2’ respectively. (B) Pixel map showing the “true” location of the pivot point identified from the phase movie. (C) 2D DF map generated from the single stationary rotor showing a single DF of 7.8 Hz. (D) Representative examples of the time series, power spectrums, and voltage intensity distributions from the pivot point (location ‘1’) and periphery (location ‘2’) of the rotor demonstrating differences in signal characteristics.
Fig. 1C shows a corresponding 2D DF map calculated for a rotor showing a single DF= 7.8Hz. Note that the DF approach cannot distinguish between the pivot point and periphery despite the clear differences in the time series data (Fig. 1D).
The 2D maps from MSF, SE, Kt and MSE for the original stationary rotor (64×64 pixels, 3 sec) are shown in Fig. 2A. Note that each of these techniques can clearly identify the core of the rotor, which is clearly associated with maximum (for the MSF, Kt, and MSE) or minimum (for SE) values when compared with the periphery of the rotor.
Fig. 2.
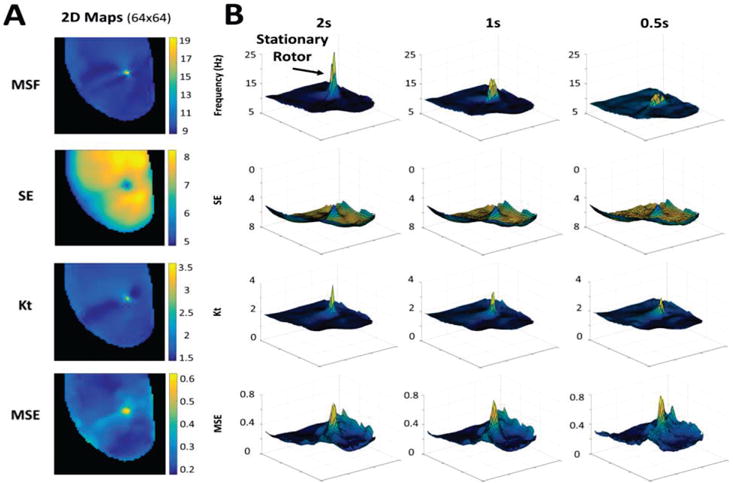
(A) 2D maps calculated for the 3 sec optical mapping video of the single stationary rotor using MSF, SE, Kt, and MSE approaches. (B) 3D contour plots demonstrate the ability of the techniques to identify the pivot point of the rotor for reduced arrhythmia durations of 2 sec, 1 sec, and 0.5 sec. The x and y coordinates correspond to (64×64) spatial resolution, and the z coordinate corresponds to the MSF, SE, Kt, and MSE values.
The ability for these new approaches to identify the core of the rotor can be explained using the properties of the signals at the core and periphery (Fig. 1D). The MSF approach accounts for various underlying physiological frequencies that are present at the core but not in the periphery. This results in a higher MSF value at the pivot point (16.1Hz) in comparison to the periphery (9Hz). The SE approach is based on the broadness of the distribution of voltage intensities at each pixel location. As is shown in Fig. 1D, the pivot point of the rotor has a narrower distribution (SE=5.7) than the periphery (SE=7.2). The Kt approach uses the same data, but assesses the “peakedness” of the distribution. The narrow distribution at the core resulted in a more peaked distribution (Kt=4.8) in comparison to the periphery (Kt=1.7). The final approach, MSE quantifies the complexity of the time series data. Regular voltage traces in the periphery result in a low MSE=0.24, while in the core of the rotor MSE=0.59 due to irregularity in the voltage signal.
1) Pivot Point Identification for Shorter Duration of Time Series
Fig. 2B evaluates the performance of MSF, SE, Kt and MSE approaches to identify the pivot point of the stationary rotor for progressively shortened durations of optical mapping data. A duration of 0.5s was the shortest duration considered, which captures approximately 4 cardiac cycles. The results are shown as 3D contour plots to highlight the magnitude of the peak identifying the rotor as well as artifacts in the periphery and its relation to the time series duration. The x and y coordinates corresponding to (64×64) spatial resolution, and the z coordinate corresponding to different MSF, SE, Kt and MSE values. As the duration of the data decreases from 3 sec down to 2, 1 and 0.5 sec, the amplitude identifying the stationary peak is reduced, however, the pivot point of the rotor is still distinguishable for all four approaches. Note that the SE and MSE approaches are associated with the presence of artifacts around the border, which may affect the performance of the approaches as the duration decreases further.
2) Pivot Point Identification for Reduced Spatial Resolution
Fig. 3 evaluates the ability of MSF, SE, Kt and MSE approaches to identify the pivot point of the stationary rotor for the progressively reduced spatial resolution. As can be seen from Fig. 3, all four techniques are able to correctly identify the pivot point of the stationary rotor.
Fig. 3.
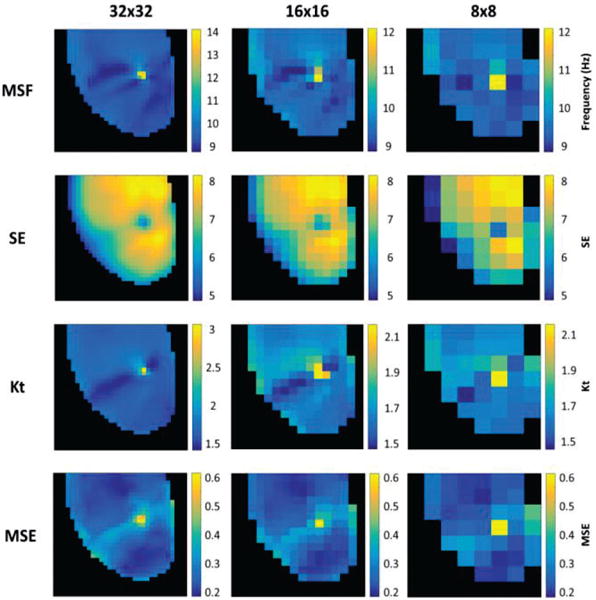
2D maps from MSF, SE, Kt, and MSE identifying the single stationary rotor for reduced spatial resolutions of 32×32 (left), 16×16 (middle), and 8×8 pixels (right).
To quantify the results presented in Figs. 2 and 3, the location associated with the pivot point were identified for MSF, SE, Kt and MSE approaches and compared with the “true” pivot point location. Figure 4 quantitatively compares the performance of mapping techniques in the identification of the pivot point of the rotor for reduced time series duration (Panel A) and spatial resolution (Panel B). The top panels show the accuracy of each technique using the individual threshold values that were determined for the original 3 second time series with 64×64 spatial resolution. These results show stable accuracy for the entropy approaches, SE and MSE. However, both MSF and Kt techniques have a large reduction in accuracy as the duration decreases. These individual thresholds were then optimized for each duration and spatial resolution to calculate optimal thresholds (middle panels) as well as corresponding optimal accuracy for each technique (bottom panels). The results in Fig. 4 bottom panels show that optimal accuracy improves the ability all techniques to identify the pivot points of the rotor both for reduced durations (2, 1 and 0.5 seconds) and spatial resolutions (32×32, 16×16 and 8×8). The MSF, Kt, and MSE had similarly high accuracies (>90%) even as duration and spatial resolution decreased. However, the performance of SE became significantly lower with an accuracy <70%.
Fig. 4.
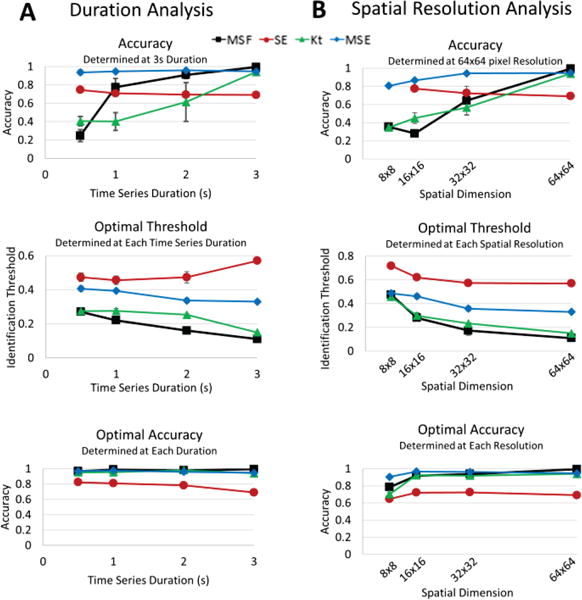
Accuracy of each technique to identify the stationary rotor from Figure 1A for reduced duration (A) and spatial resolution analysis (B). The top panels show accuracy calculated using the individual thresholds determined for the original 3s duration time series and 64×64 spatial resolution. Similar results are shown for the analysis using optimal thresholds (middle panel) and optimal accuracies (bottom panel).
B. Identification of Multiple Pivot Points in a Figure-of-8 Reentry
A snapshot of the phase movie from a figure-of-8 reentry is shown in Fig. 5A. Fig. 5B shows the locations of the singularity points (“true” location of the pivot points) identified from the phase movie. The red line indicates where the map was divided between meandering and stationary rotors. The top rotor, labeled ‘1,’ meanders while the bottom rotor remains stationary. Fig. 5D shows representative filtered time series, power spectrums, and voltage intensity distributions from the pivot point of the meandering rotor and the periphery (pixels ‘1’ and ‘2’ respectively from Fig. 5A).
Fig. 5.
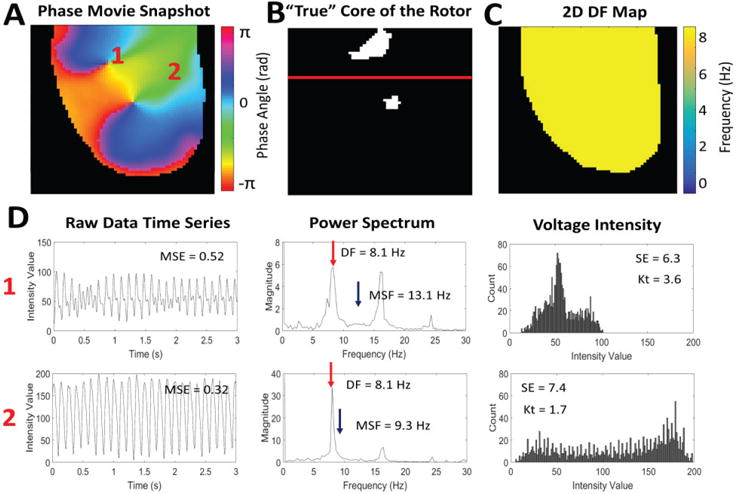
An example of multiple pivot points in a figure-of-8 reentry rotor from optical mapping of a rabbit heart. (A) Snapshot of the phase movie for the figure-of-8 reentry, with the depolarizing wave front shown in red. The pivot point of the meandering rotor and periphery of the rotor are identified by ‘1’ and ‘2’ respectively. (B) Pixel map showing the “true” location of the pivot points of the meandering and stationary rotors identified from the phase movie. The red line indicates where the map was divided between meandering and stationary rotors. (C) 2D DF map from the figure-of-8 reentry showing a single DF of 8.1 Hz. (D) Representative examples of the time series, power spectrums, and voltage intensity distributions from the pivot point of the meandering rotor (location ‘1’) and the periphery (location ‘2’) of the rotors.
Fig. 5C shows the corresponding 2D DF map calculated for the figure-of-8 reentry with a single DF= 8.1 Hz, which is unable to distinguish between the pivot points and periphery in the figure-of-8 reentry. The 2D distributions of MSF, SE, Kt and MSE for the original figure-of-8 reentry movie from Fig. 5A (64×64 pixels, 3 sec) are shown in Fig. 6A. Each of the four techniques are able to identify the meandering and stationary rotor separately from the periphery.
Fig. 6.
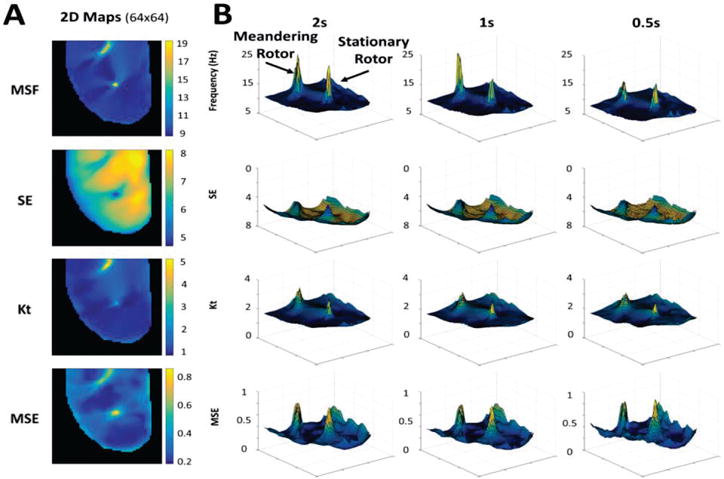
(A) 2D maps calculated for the 3 sec optical mapping video of figure-of-8 reentry using MSF, SE, Kt, and MSE approaches. (B) 3D contour plots demonstrate the ability of each technique to identify multiple pivot points, the meandering and stationary rotors, for reduced arrhythmia durations of 2 sec, 1 sec, and 0.5 sec. The x and y coordinates correspond to (64×64) spatial resolution, and the z coordinate corresponds to the MSF, SE, Kt, and MSE values.
1) Pivot Point Identification for Shorter Duration of Time Series
The 3D contour plots in Fig. 6B demonstrate the ability of MSF, SE, Kt, and MSE to identify both the meandering and stationary rotor as the duration of the optical mapping movie is decreased. Similar to the stationary rotor example presented in Fig. 2, the location of the pivot points can still be identified, but the peak becomes less prominent as the duration decreases. Note that the SE and MSE result in increased artifacts as the duration decreases, which strongly impacts the accuracy of the rotor identification for the SE and MSE approaches. From the 3D contour plots presented, both the MSF and Kt provided clear identification of both rotors with minimal artifacts, even at an acquisition duration of 0.5 sec.
2) Pivot Point Identification for Reduced Spatial Resolution
Fig. 7 evaluates the ability of each technique to accurately identify multiple rotors under the simulated clinical limitation of reduced spatial resolution. As the spatial resolution decreases, the meandering rotor can still be identified, however the stationary rotor can no longer be identified in the 8×8 pixel resolution (Fig. 7, right). For this analysis, multiple pixels from the 8×8 analysis were recorded directly from the region of the meandering rotor, while no pixels directly from the location of the stationary rotor were captured.
Fig. 7.
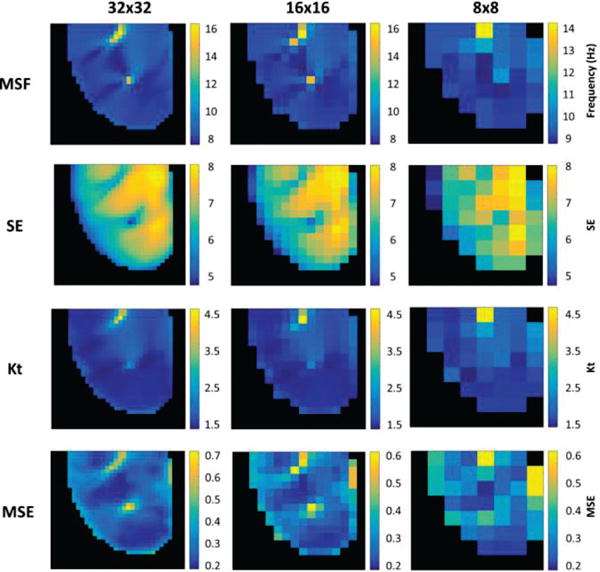
2D maps from MSF, SE, Kt, and MSE identifying the meandering and stationary rotors in the figure-of-8 reentry for reduced spatial resolutions of 32×32 (left), 16×16 (middle), and 8×8 pixels (right).
To quantitatively compare the results presented in Figs. 6 and 7, the location of the pivot points for each approach were compared to the “true” location derived from the phase map. Fig. 8 presents the optimal accuracy of each approach for a reduced time series (Fig. 8A) and spatial resolution (Fig. 8B) in which optimized thresholds were used for each time series duration and each spatial resolution. The results are presented as two rotors combined (Fig. 8, top panels) and then split into the analysis for the meandering (Fig. 8, middle panels) and stationary (Fig. 8, bottom panels) rotor separately. The MSF, Kt, and MSE approaches all resulted in high accuracies for identifying the pivot point of the rotors together and individually even under simulated clinical limitations down to 16×16 pixels. However, the results of SE were significantly reduced, with the lowest accuracies <=60% as the spatial resolution decreased.
Fig. 8.
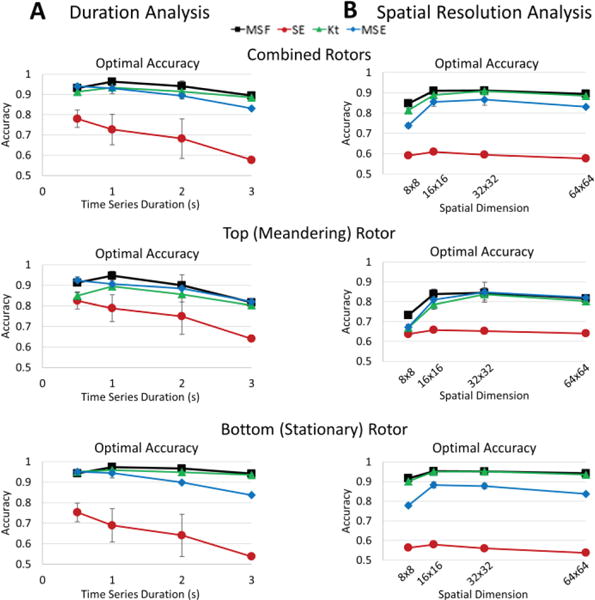
Optimal accuracy of each technique to identify the Figure-of-8 from Figure 5A for reduced duration (A) and spatial resolution analysis (B). The optimal accuracies are shown for the combined rotors (top panel), the top, meandering rotor (middle panel), and the bottom, stationary rotor (bottom panel).
IV. Discussion
In this study, we evaluated a robustness of our newly developed signal processing techniques in correctly identifying the pivot points of the rotors from optical mapping-based experiments. We also simulated several clinical limitations, specifically reduced spatial resolution and acquisition duration. We used a simplified ventricular arrhythmia model in an ex vivo heart to demonstrate the potential utility of these techniques in identifying stationary and meandering rotors. The major findings of the manuscript are the following: (1) MSF, Kt, and MSE were able to identify the rotor pivot point regardless of (i) progressively reduced acquisition time; (ii) decreased spatial resolution; (iii) the presence of meandering rotors; (2) MSE provided the highest accuracy for the single stationary rotor; (3) the MSF approach had the highest accuracy overall for identifying both the stationary and meandering rotors in the figure-of-8 reentry; (4) the performance of SE approach was clearly diminished due to the large artifacts which reduced accuracy.
The critical value of our results is that these approaches do not rely on repolarization timing information to pinpoint the rotor and its critical elements. Thus, it is possible that these mathematical approaches may be applied to clinically acquired electrogram data, which may be acquired over short time periods or with limited spatial density. Proving that data reflecting depolarization alone can be used to pinpoint rotor elements is a critical step in proving whether rotors can be accurately identified in clinical, human models of arrhythmia using currently available catheters and electrogram acquisition software.
A. Efficacy of Each Technique
In examples of both a single rotor and figure-of-8 reentry, the DF map resulted in a single frequency throughout the heart, making the pivot point of the rotor and its periphery indistinguishable. We were able to expand upon this frequency approach using MSF, which accounts for the chaotic nature at the rotor pivot point by incorporating underlying physiological frequencies in addition to the DF. This approach gave the most accurate localization of the pivot point in the event of both stationary and meandering rotors in the figure-of-8 reentry example. In addition, MSF maintained high accuracy even as the time series duration decreased.
Both SE and Kt indices are based on the voltage intensity distribution and rely on the morphology of the electrical recordings, which significantly changes at the pivot point when compared to the periphery. This difference is reflected in the narrowing of the histogram at the pivot point of the rotor with a corresponding increase in the “peakedness” of the signal. The Kt maps correctly identified the rotors in both examples, irrespective of time series duration and spatial resolution. However, the SE approach resulted in low contrast between the rotor and periphery reducing its accuracy.
The MSE approach, which relies on the complexity of the electrical signal, was able to consistently differentiate the pivot point from the periphery. In the instance of a single rotor, the accuracy was the highest of the four techniques presented. In the presence of multiple rotors, MSE was able to identify both rotors, however with a lower accuracy than the MSF approach.
The next steps in this study will include characterizing the accuracy of these techniques in more complex experimental examples. Preliminary results in Supplemental Figure S.3 show the trajectory of a meandering rotor from a numerical simulation, which can be clearly identified using the MSF and MSE techniques. In addition, applying a variety of techniques to clinical examples of ventricular or atrial arrhythmias will assist in determining the reproducibility of the localization of specific rotors. Whether a single technique or combination of processing techniques using depolarization data from intracardiac electrograms may consistently and accurately characterize the location and critical components of rotors remains to be seen, though our work provides some further data on novel processing techniques that may facilitate these results.
B. Clinical Translation
Theories about the “cause and maintenance” of AF and, in turn, identifying optimal ablation target(s) continue to be an area of active debate. The theory regarding the relevance of rotors dates back to Gordon Moe [2], who noted the presence of organized regions of functional reentry may mediate AF (as contrasted with the multiple random wavelet and other hypotheses of the time). He also stated that it is unlikely that any one of these theories of how AF occurs is unlikely to stand alone. In fact, AF is likely a reflection of a variety of pathophysiologic processes – with the manifestation of AF on ECG (as apparently random activity within the atria) being a complex process that may be subserved by any one of a number of pathophysiologic processes that may co-exist in the same individual or be the primary mediator in a given individual. Thus, the scientific process to demonstrate that (1) a rotor exists; (2) these rotors play a principal role in AF propagation; and (3) that ablating these rotors actually has relevance to “curing” AF is inherently complex, particularly if it is possible for multiple mechanisms to co-exist or for the mechanism to vary between patients with inherently different substrates.
That being said, invasive treatment of AF in humans still has major gaps. While true that data of additive approaches beyond pulmonary vein isolation (PVI) (e.g. linear lines, rotor ablation, complex fractionated electrogram ablation, autonomic ganglia ablation) have not consistently shown benefit, debates continue to abound regarding patient selection and decision making on individualized approaches to appropriate lesion set. In addition, in many cases of AF, our best case outcomes after multiple ablations in certain patients (e.g. persistent AF) continues to be in the 50-60% range.
The principal question is, thus, whether currently available techniques that are used to make sense of the signals acquired during AF are sufficient to define “relevant substrate” or whether we should accept that all patients in whom PVI is ineffective must be subject to a lifetime of incurable AF, a more “random” approach to treatment (e.g. empiric lines), or an approach that relies on targeting signals purely based on current methods of signal processing.
It is our belief that identifying better ways of processing the acquired signals during intracardiac mapping may help in further critically understanding relevant arrhythmic substrate to AF pathogenesis in individuals. Our findings demonstrates differences between various signal processing techniques in accurately and consistently defining seemingly organized zones of activity. In addition, current clinically available approaches may have limitations, such as with the DF approach, which points to the fact that the lack of success of additive approaches to AF beyond PVI may be limited not simply due to “futility” of such approaches but also to lack of tools to adequately define the relevant areas.
We further agree that any ablation, as much as it has the capacity to eliminate arrhythmia, also has the potential to create substrate for arrhythmia. Our paper does not seek to say that these rotor zones will ultimately be the sites to target for ablation – instead they may represent zones of critical activity that may be targeted by other mechanisms or point to utility of specific types of antiarrhythmic medications based on their mechanism of action due to the presence of such rotors in specific individuals.
Here, we have evaluated the potential utility of alternative signal processing approaches defining critical areas responsible for arrhythmia propagation lies. The use of less complex arrhythmia examples highlights the differences in the mathematical approaches presented here and showing potential to be further expanded to progressively more complex examples. Future work includes applying these approaches to (1) optically mapped examples of AF and VF and (2) comprehensively mapped clinical human examples of AF.
C. Limitations
Our study is characterized by several limitations. First, these analyses were performed using data acquired through optical mapping in an experimental animal model of ventricular arrhythmia. Thus, applicability of these analyses to intracardiac electrograms, which have variable filtering and localization methodologies, is unclear. In addition of the general limitations that is associated with obtaining the pivot point of the rotor is the dependence on the exact measurement locations in identifying the source of the arrhythmia. The optical mapping data has a high spatial resolution, and therefore the core of the rotor can be identified with a high accuracy. In simulating a reduction in spatial resolution, we observed that when measurements were not taken from the core, the rotor may not be identified. In the 8×8 pixel analysis of the figure-of-8 example, the 2D mapping techniques were unable to identify the stationary rotor as there were no direct measurements taken from within the core.
Another limitation of this study is the complexity of the arrhythmias analyzed. The optical mapping examples presented are on the lower end complexity with uniform propagation through the tissue. In the presence of multiple wavebreaks, as occur during AF, there will be additional complexity and irregularity in the electrical signals recorded which could affect the overall sensitivity and specificity of the mapping techniques presented. In addition, the data obtained from analysis of ventricular arrhythmias may not be directly applicable to atrial arrhythmias due to different atrial wall thickness and fundamental electrophysiological differences between these chambers. Finally, our examples of point acquisition during optical mapping are uniform. However, during intracardiac mapping, the points obtained may be affected by catheter orientation relative to the underlying myocardium, randomly distributed with clustering of points in specific areas, and include far field data from other structures. Thus, validation of these data when considering these increasing orders of complexity remains to be studied.
V. Conclusion
These results motivate further validation using intracardiac electrograms to determine if these approaches can identify pivot points in a clinical setting. It also highlights the potential utility of more experimental data in identifying which single technique or combination of techniques is necessary to accurately characterize rotors in various arrhythmia states. More accurate rotor localization could offer improved methods of characterizing arrhythmias and, in turn, offer a means by which to more accurately study whether or not rotor ablation is a viable and effective treatment.
Supplementary Material
Acknowledgments
This work was supported by the NSF CAREER PHY-125541 (E.G.T.) and NIH R21HL128790 (E.G.T. and S.K.M.) grants. Asterisk indicates corresponding author.
Contributor Information
Elizabeth M. Annoni, Biomedical Engineering Department at the University of Minnesota, Minneapolis, MN, USA
Shivaram Poigai Arunachalam, Biomedical Engineering Department at the University of Minnesota, Minneapolis, MN, USA.
Suraj Kapa, Cardiovascular Division at the Mayo Clinic, Rochester, MN, USA.
Siva K. Mulpuru, Cardiovascular Division at the Mayo Clinic, Phoenix, AZ, USA
Paul A. Friedman, Cardiovascular Division at the Mayo Clinic, Rochester, MN, USA
Elena G. Tolkachova, Biomedical Engineering Department at the University of Minnesota, Minneapolis, USA.
References
- 1.Krummen DE, et al. The role of rotors in atrial fibrillation. Journal of thoracic disease. 2015 Feb;7(2):142. doi: 10.3978/j.issn.2072-1439.2014.11.15. [DOI] [PMC free article] [PubMed] [Google Scholar]
- 2.Moe GK, Abildskov JA. Atrial fibrillation as a self sustaining arrhythmia independent of focal discharge. Am Heart J. 1959;58:59–70. doi: 10.1016/0002-8703(59)90274-1. [DOI] [PubMed] [Google Scholar]
- 3.Pandit SV, Jalife J. Rotors and the dynamics of cardiac fibrillation. Circ Res. 2013;112(5):849–62. doi: 10.1161/CIRCRESAHA.111.300158. [DOI] [PMC free article] [PubMed] [Google Scholar]
- 4.Narayan SM, et al. Direct or coincidental elimination of stable rotors or focal sources may explain successful atrial fibrillation ablation: on-treatment analysis of the CONFIRM trial (Conventional ablation for AF with or without focal impulse and rotor modulation) Journal of the American College of Cardiology. 2013;62(2):138–47. doi: 10.1016/j.jacc.2013.03.021. [DOI] [PMC free article] [PubMed] [Google Scholar]
- 5.Narayan SM, et al. Treatment of paroxysmal atrial fibrillation by targeted elimination of stable rotors and focal sources without pulmonary vein isolation: the precise rotor elimination without concomitant pulmonary vein isolation for subsequent elimination of PAF (PRECISE) trial. Heart Rhythm. 2013;10(9 Supplement):1414. [Google Scholar]
- 6.Gray RA, et al. Mechanisms of cardiac fibrillation. Science. 1995;270:1222–1223. [PubMed] [Google Scholar]
- 7.Pertsov AM, et al. Spiral waves of excitation underlie reentrant activity in isolated cardiac muscle. Circ Res. 1993;72:631–650. doi: 10.1161/01.res.72.3.631. [DOI] [PubMed] [Google Scholar]
- 8.Samie FH, et al. A mechanism of transition from ventricular fibrillation to tachycardia: effect of calcium channel blockade on the dynamics of rotating waves. Circ Res. 2000;86:684–691. doi: 10.1161/01.res.86.6.684. [DOI] [PubMed] [Google Scholar]
- 9.Davidenko JM. Spiral wave activity: a possible common mechanism for polymorphic and monomorphic ventricular tachycardia. J Cardiovasc Electrophysiol. 1993;4:730–746. doi: 10.1111/j.1540-8167.1993.tb01258.x. [DOI] [PubMed] [Google Scholar]
- 10.Samie FH, Jalife J. Mechanisms underlying ventricular tachycardia and its transition to ventricular fibrillation in the structurally normal heart. Cardiovascular research. 2001;50(2):242–50. doi: 10.1016/s0008-6363(00)00289-3. [DOI] [PubMed] [Google Scholar]
- 11.Sanders P, et al. Spectral analysis identifies sites of high-frequency activity maintaining atrial fibrillation in humans. Circulation. 2005;112(6):789–97. doi: 10.1161/CIRCULATIONAHA.104.517011. [DOI] [PubMed] [Google Scholar]
- 12.Mandapati R, et al. Stable microreentrant sources as a mechanism of atrial fibrillation in the isolated sheep heart. Circulation. 2000;101(2):194–9. doi: 10.1161/01.cir.101.2.194. [DOI] [PubMed] [Google Scholar]
- 13.Atienza F, et al. Real-time dominant frequency mapping and ablation of dominant frequency sites in atrial fibrillation with left-to-right frequency gradients predicts long-term maintenance of sinus rhythm. Heart Rhythm. 2009;6(1):33–40. doi: 10.1016/j.hrthm.2008.10.024. [DOI] [PMC free article] [PubMed] [Google Scholar]
- 14.Baumert M, et al. Quantitative-electrogram-based methods for guiding catheter ablation in atrial fibrillation. Proceedings of the IEEE. 2016;104(2):416–31. [Google Scholar]
- 15.Narayan SM, et al. Treatment of atrial fibrillation by the ablation of localized sources: CONFIRM (Conventional Ablation for Atrial Fibrillation With or Without Focal Impulse and Rotor Modulation) trial. Journal of the American College of Cardiology. 2012;60(7):628–36. doi: 10.1016/j.jacc.2012.05.022. [DOI] [PMC free article] [PubMed] [Google Scholar]
- 16.Nademanee K, et al. A new approach for catheter ablation of atrial fibrillation: mapping of the electrophysiologic substrate. Journal of the American College of Cardiology. 2004;43(11):2044–53. doi: 10.1016/j.jacc.2003.12.054. [DOI] [PubMed] [Google Scholar]
- 17.Habel N, et al. The temporal variability of dominant frequency and complex fractionated atrial electrograms constrains the validity of sequential mapping in human atrial fibrillation. Heart Rhythm. 2010;7(5):586–93. doi: 10.1016/j.hrthm.2010.01.010. [DOI] [PubMed] [Google Scholar]
- 18.Jalife J, et al. Mother rotors and fibrillatory conduction: a mechanism of atrial fibrillation. Cardiovascular research. 2002;54(2):204–16. doi: 10.1016/s0008-6363(02)00223-7. [DOI] [PubMed] [Google Scholar]
- 19.Sasaki N, et al. Localized rotors and focal impulse sources within the left atrium in human atrial fibrillation: A phase analysis of contact basket catheter electrograms. Journal of arrhythmia. 2016;32(2):141–4. doi: 10.1016/j.joa.2015.11.010. [DOI] [PMC free article] [PubMed] [Google Scholar]
- 20.Arunachalam SP, et al. Feasibility of visualizing higher regions of Shannon entropy in atrial fibrillation patients. 37th Annual International Conference of the IEEE Engineering in Medicine and Biology Society (EMBC) 2015:25–29. doi: 10.1109/EMBC.2015.7319394. [DOI] [PubMed] [Google Scholar]
- 21.Filgueiras-Rama D, et al. High-resolution endocardial and epicardial optical mapping in a sheep model of stretch-induced atrial fibrillation. Journal of visualized experiments: JoVE. 2011;53 doi: 10.3791/3103. [DOI] [PMC free article] [PubMed] [Google Scholar]
- 22.Rodrigo M, et al. Highest dominant frequency and rotor positions are robust markers of driver location during noninvasive mapping of atrial fibrillation: A computational study. Heart Rhythm. 2017;14(8):1224–1233. doi: 10.1016/j.hrthm.2017.04.017. [DOI] [PMC free article] [PubMed] [Google Scholar]
- 23.Ganesan AN, et al. Bipolar electrogram Shannon entropy at sites of rotational activation: implications for ablation of atrial fibrillation. Circ Arrhythm Electrophysiol. 2013;6:48–57. doi: 10.1161/CIRCEP.112.976654. [DOI] [PubMed] [Google Scholar]
- 24.Arunachalam SP, et al. Novel multiscale frequency approach to identify the pivot point of the rotor. Journal of Medical Devices. 2016;10(2):020948. [Google Scholar]
- 25.Arunachalam SP, et al. Kurtosis as a statistical approach to identify the pivot point of the rotor. 38th Annual International Conference of the IEEE Engineering in Medicine and Biology Society (EMBC) 2016:497–500. doi: 10.1109/EMBC.2016.7590748. [DOI] [PubMed] [Google Scholar]
- 26.Arunachalam SP, et al. Novel multiscale entropy approach for rotor pivot point identification. BMES Annual Meeting; 2016 October; Abstract. [Google Scholar]
- 27.Mironov S, et al. Role of conduction velocity restitution and short-term memory in the development of action potential duration alternans in isolated rabbit hearts. Circulation. 2008;118(1):17–25. doi: 10.1161/CIRCULATIONAHA.107.737254. [DOI] [PMC free article] [PubMed] [Google Scholar]
- 28.Matiukas A, et al. Optical mapping of electrical heterogeneities in the heart during global ischemia. 2009 Annual International Conference of the IEEE Engineering in Medicine and Biology Society. 2009:6321–6324. doi: 10.1109/IEMBS.2009.5333176. [DOI] [PMC free article] [PubMed] [Google Scholar]
- 29.Gray RA, et al. Spatial and temporal organization during cardiac fibrillation. Nature. 1998;392(6671):75–8. doi: 10.1038/32164. [DOI] [PubMed] [Google Scholar]
Associated Data
This section collects any data citations, data availability statements, or supplementary materials included in this article.


