

Abstract
Isotopically labeled enzymes (denoted as “heavy” or “Born Oppenheimer” enzymes) have been used to test the role of protein dynamics in catalysis. The original idea was that the protein's higher mass would reduce the frequency of its normal-modes without altering its electrostatics. Heavy enzymes have been used to test if the vibrations in the native enzyme are coupled to the chemistry it catalyzes, and different studies have resulted in ambiguous findings. Here the temperature-dependence of intrinsic kinetic isotope effects of the enzyme formate dehydrogenase is used to examine the distribution of H-donor to H-acceptor distance as a function of the protein's mass. The protein dynamics are altered in the heavy enzyme to diminish motions that determine the transition state sampling in the native enzyme, in accordance with a Born Oppenheimer-like effect on bond activation. Findings of this work suggest components related to fast frequencies that can be explained by Born-Oppenheimer enzyme hypothesis (vibrational) and also slower timescale events that are non-Born-Oppenheimer in nature (electrostatic), based on evaluations of protein mass dependence of donor-acceptor-distance and forward commitment to catalysis along with steady state and single turnover measurements. Together, the findings suggest that the mass modulation affected both local, fast, protein vibrations associated with the catalyzed chemistry, and the protein's macromolecular electrostatics at slower timescales, i.e., both Born Oppenheimer and non-Born Oppenheimer effects are observed. Comparison to previous studies leads to the conclusion that isotopic labeling of the protein may have different effects on different systems, however making heavy enzyme studies a very exciting technique for exploring the dynamics link to catalysis in proteins.
Introduction
Enzymes operate with a broad spectrum of motions that occur at timescales ranging from many seconds to femtoseconds (s-fs). The role of slower timescale motions (seconds – nanoseconds) has long been identified as important for enzyme catalysis and they have been correlated with conformational changes, catalytic turnover, substrate binding and product release.1-7 On the other hand the role of fast protein dynamics of femtosecond - picosecond (fs-ps) timescale is a topic of contemporary interest in enzymology.1,4-6,8-11 At the tunneling ready state (TRS – a quantum mechanically delocalized transition state)2 bond cleavage occurs at sub-picosecond timescales, and the donor-acceptor distance (DAD) sampling motions are at the fs-ps timescale.2,12,13
Perturbation of the vibrational frequencies in the enzyme should alter the chemical step if they are in fact coupled to each other. Computational studies have suggested that fast protein motions or promoting vibrations14 are involved in the chemical step, where covalent bond breaking or formation takes place.15-20 To test this hypothesis, isotopically labeled “heavy enzymes” were employed by Schramm and co-workers, followed by several other researchers.14,21-31 In those studies the protein was uniformly labeled with 13C, 15N and/or 2H at non-exchangeable positions to cause vibrational perturbations.32 While the vibrational states in the protein may change as expected when its isotopic composition and mass are altered, a minimal perturbation in the protein electrostatic potential surface is assumed. Hence such enzymes were originally referred to as “Born Oppenheimer” enzymes.21 Previous studies involving heavy enzymes have shown that mass modulation can affect the catalyzed reaction in a variety of ways: not only the chemical step that occurs in the fast timescale, but also events that occur at slower timescales, such as substrate binding or product release.14,28 For instance, in a study of heavy HIV-1 protease, reduction in the rate of the C-N bond cleavage (chemical step) of a peptide substrate had been observed along with an increase in Km for the heavy enzyme.22 Heavy enzyme studies on human purine nucleoside phosphorylase (PNP) revealed that the steady state kinetic parameters (dominated by product release) or kinetic isotope effects (KIEs) (probing geometry at the transition state) were not affected by mass modulation of the protein, while the probability of chemical barrier crossing was proportional to the mass of the protein.21,23 It was suggested that these studies reflect a decrease in the frequency of fs motions that are linked to barrier crossing and that the outcomes support the concept of “Born Oppenheimer” enzymes. Studies on bacterial and human dihydrofolate reductase (DHFR)14,28 revealed no effect of the heavy DHFR on intrinsic KIEs (at physiological temperatures); however, the mass alteration affected protein-ligand interactions, which are expected to take place at a slower timescale, and may indicate alteration of the protein potential surface.
Two other relevant studies that used heavy enzymes to test the hypothesis of fast motions coupling to chemistry were reported by Toney and co-workers27 and Scrutton and co-workers24. In the first, Alanine Racemase (AR) was compared to its heavy (perdeuterated) isozyme, and there the heavy enzyme showed reduced steady state rates.27 In the second, temperature dependence of KIEs was studied using stopped flow kinetics for pentaerythritol tetranitrate reductase (PETNR) and its heavy analog.24 The results showed a correlation between the ΔEa(D-H), difference in activation free energies between the two substrate isotopologues, and protein mass, referring temperature dependence of KIEs as vibrational coupling to H-transfer. A recent study by Longbotham et al. further investigated the contribution of cofactor to catalysis in PETNR in addition to the contributions from the protein, suggesting more local vibrational effects coupled to the hydride transfer.33 However, these studies show different effects of isotopic substitution depending on the enzymatic system. Beyond assessing the importance of protein dynamics in enzyme catalysis34-36 heavy enzyme studies have also been used in the development of inhibitors for pharmaceutical applications as well.37,38 Nevertheless, further investigation is vital to obtain a comprehensive understanding of the correlation between altered fast protein dynamics and the catalyzed reaction along with other effects of isotopic substitution on enzyme catalysis.
The model enzyme used here to test the mass effect on catalysis is formate dehydrogenase (FDH, EC 1.2.1.2) from Candida boidinii. FDH is a homodimer with a total mass of 80,620 Da.39-41 In the reaction catalyzed by FDH, a hydride is transferred from formate ion to the C-4 position of NAD+ to generate NADH and CO2, as illustrated in Scheme 1.42
Scheme 1.

Reaction catalyzed by FDH with an illustration of the transition state structure (adapted from ref 43).
FDH serves as a unique model system since both its intrinsic kinetics at the transition state and relevant protein dynamics can be probed experimentally by KIE studies and vibrational spectroscopic methods respectively.43 A transition state analog of the reactive ternary complex, (FDH-azide-NAD+) is used to experimentally probe the active site dynamics of FDH.43-46
In this study we have used temperature dependence of intrinsic KIEs to examine the DAD distribution, at the TRS of the catalyzed hydride transfer. Over the past 15 years, a model has emerged for interpreting such results. This model motivates the interpretation that thermally activated DAD sampling at the TRS in the active site of the protein determines the temperature dependence of the intrinsic KIE for the hydride transfer reaction in FDH. We refer to this model as the phenomenological activated tunneling model,5,47 but it is also known as a “Marcus like model”48-50 or “vibrationally enhanced tunneling” model.51 According to this model a narrow distribution of hydride DADs, result in temperature independent KIEs, as mostly seen for native, wild-type enzymes. A reaction coordinate with a broad ensemble of DADs, on the other hand, results in temperature dependent KIEs. Although these models do not provide a molecular basis of the reaction coordinate, a change in the temperature dependence of intrinsic KIEs reflects a vibrational modulation that samples the DAD distribution. In the context of this paper, the temperature dependence of KIEs accounts for the nature of the TRS for the FDH catalyzed C-H→C hydride transfer.41,43
We compare unlabeled FDH with uniformly labeled [13C;15N] and [13C;15N;2H] FDHs (denoted as light, half-heavy, and heavy, respectively). We evaluate their DAD distributions at the TRS, steady state kinetics and single turnover rates. There are two kinds of results; one that is in accordance with the bond activation being proportional to the protein's mass, in support of vibrational coupling of fast protein motions in the native enzyme. The other would infer alterations of the protein's conformational ensemble, ligand interactions, and overall electrostatics, indicating the complex effects of isotope labeling in proteins.
Materials and Methods
Materials
Heavy D-Glucose (U-13C6, 99% and U-13C6, 99%; 1, 2, 3, 4, 5, 6, 6-2H7, 97-98%), 15NH4Cl (15N, 99%) and 99.8% D2O were purchased from Cambridge Isotope Laboratories Inc. [Ad-14C]-NAD+ (279.0 mCi/mmol) and [3H]-formate sodium salt (5 Ci/mmol) were purchased from PerkinElmer and Moravek Biochemicals, respectively. All other chemicals were purchased from Sigma-Aldrich unless otherwise stated. All the reagent concentrations refer to final concentrations in the reaction mixture, unless otherwise specified.
Preparation of Light, Half Heavy and Heavy FDHs and Circular Dichroism Spectroscopy
Light enzyme was expressed and purified according to previously published procedures.41 Isotopically labeled FDHs were expressed in BL21 (DE3) cells deficient in the rne131 gene (Invitrogen) in standard M9 minimal media. M9 media prepared in H2O (for half heavy FDH) or 99.8% D2O (for heavy FDH), was supplemented with minimal essential medium vitamins (Thermo Fisher), and 15NH4Cl and D-glucose (U-13C6, 99% for half heavy FDH or U-13C6, 99%; 1, 2, 3, 4, 5, 6, 6-2H7, 97-98% for heavy FDH) were used as the sole nitrogen and carbon sources respectively. All enzymes were purified to homogeneity in buffered H2O using affinity chromatography according to methods described elsewhere.41,52,53 Monomeric molecular weights were determined by ESI-MS after purity check with SDS-PAGE. In addition to the intact mass, the ESI-MS of the heavy FDH treated with 8M urea (1 hr at room temperature) was also determined in order to evaluate the extent of non-exchanged labile hydrogen atoms. The enzyme solutions were dialyzed against 100 mM phosphate buffer, pH 7.5 and stored in -80 °C until use. Temperature profiles for light, half heavy and heavy FDH were obtained from circular dichroism (CD) spectroscopy by using a Jasco J-815 CD spectrophotometer. CD spectra were recorded from 190 – 260 nm with 1 nm steps for temperatures ranging from 25 to 75 °C at every 1 °C with 0.5 °C/min increment. Each enzyme was placed in a quartz cuvette with 1 mm path length and was equilibrated at each temperature for 45 seconds. The light, half heavy and heavy enzyme samples were prepared in 100 mM phosphate buffer, pH 7.5, and their final concentrations were 11, 14 and 16 μM respectively. Mean residue ellipticities (θ, units: deg.cm2.dmol-1) were calculated using the CONTIN algorithm via DichroWeb, a web based server hosted by University of London.54,55 CD spectra at 25 °C, 35 °C and 45 °C were compared and contrasted between the three FDH isotopologues. Mid-points of thermal denaturation (here defined as Tm) were also determined and compared for the three FDH isotopologues.
Measurement of Intrinsic KIEs
The observed KIEs measured, were H/T and D/T KIE on the second order rate constant kcat/KM, where H/T KIE and D/T KIE are the KIEs comparing hydride to tritiade and deuteride to tritiade transfers (denoted T(V/K)H and T(V/K)D respectively, (V/K viz. [E]Tkcat/Km). Competitive H/T and D/T KIE measurements were carried out to determine intrinsic KIEs for light, half-heavy, and heavy FDHs at 5 to 45 °C temperature-range as described elsewhere.43 Briefly, KIEs were measured using reaction mixtures of 50 mM NAD+ and 40 mM protiated or 99.8% deuterated formic acid, sodium salt (for H/T or D/T, respectively) combined with trace amounts of [Ad-14C]-NAD+ (660,000 dpm) and [3H]-formic acid (3,300,000 dpm) and 100 mM phosphate buffer (pH 7.5) to make the final volume to 1 ml. The reaction mixtures were pre-equilibrated at the desired temperature and initiated by adding enzyme. A remote carbon of the adenine ring of the cofactor labeled with 14C served as a tracer for the hydride or the deuteride being transferred from formic acid to form [Ad-14C]-NADH/D, while NADT represented the tritium being transferred. At different time points during the reaction 100 μl aliquots were removed and quenched with 20 μl of 50 mM azide, KD = 40 nM10. All quenched samples were analyzed by reverse phase HPLC followed by liquid scintillation counting to determine the depletion of tritium in the product as a function of fractional conversion. The observed KIEs were calculated using eq. 1.
| (1) |
Rt, R∞ = isotope ratio (3H/14C of NADH) at time t and infinity respectively and f is fractional conversion based on total 14C, given by eq. 2 below.
| (2) |
Intrinsic H/T KIEs were calculated from the H/T and D/T observed values using a numerical solution, to the modified Northrop equation56-58 (eq. 3).
| (3) |
where Tkhyd is the intrinsic H/T KIE, T(V/K)H and T(V/K)D are the observed H/T and D/T KIE for the second-order rate constant kcat/KM, respectively. Isotope effect on the activation parameters for the intrinsic KIEs was calculated by a non-linear fit of the data to Arrhenius equation (eq. 4).
| (4) |
where L and H stand for light (1H) and heavy (3H) isotopologues respectively, k is the rate constant, AL/AH is the isotope effect on the Arrhenius pre-exponential factors, ΔEa(H-L) is the difference in activation free energies between the two isotopologues which is given by the slope of the Arrhenius plot, R is the universal gas constant and T is the absolute temperature.
Determination of Commitment Factors
All observed primary KIEs are smaller than the intrinsic value (e.g., Tkhyd > T(V/K)H). This is due to commitment factors on the observed KIE resulting from steps other than the isotopically sensitive bond cleavage. As described in detail elsewhere56,59 Eq. 5 relates the observed KIE (T(V/K)H) to the intrinsic value on bond cleavage:
| (5) |
where T(V/K)H is observed KIE and Tkhyd is intrinsic KIE on bond cleavage, Cf and Cr are forward and reverse commitment factors respectively and EIE is equilibrium isotope effect. Cr is defined as the ratio of the net rate constant of isotopically sensitive steps in the backward direction of reaction to the net rate constant in the forward direction of reaction of isotopically insensitive steps that follow the isotopically sensitive steps.60 For the hydride transfer catalyzed by FDH, Cr is negligible as the reaction can be considered irreversible,39 especially under the experimental conditions used; i.e. carbon dioxide gets released to a pH 7.5 solution and gets trapped as bicarbonate. Therefore the concentration of product is practically negligible. Also bicarbonate does not act as an effective substrate for FDH, thus making the isotopically sensitive backward rate essentially zero. Further, the EIE is close to unity for the FDH catalyzed reaction. Thus eq. 5 above can be simplified to eq. 6 to solve for Cf from experimentally determined observed and intrinsic KIE values.
| (6) |
Single Turnover Experiments
Single turnover rate constants for the three isotopologues of FDH were determined in 100 mM phosphate buffer, pH 7.5, by following the production of NADH at 340 nm (ε = 6220 cm-1M-1) using an Applied Photophysics SX-20 stopped-flow spectrophotometer maintained at 25 °C. The enzyme (84 μM) was pre-incubated with an equal volume of 62 μM NAD+ and the reaction was initiated by mixing with sodium formate (protiated or deuterated) at a final concentration of 100 mM in the same buffer (1:1 volume ratio of NAD+ bound FDH and formate). Further, the single-turnover rate constant dependence on substrate concentration was determined to ensure saturation, using formate concentrations of 100, 200 and 400 mM. Time traces were fitted to a single exponential function, Abs = −ae−kobst + b), to yield the observed single turnover rate constants (kobs).
Steady State Kinetics
The steady state kinetic parameters (kcat, Km and kcat/Km) were determined by initial velocity studies that involved following the production of NADH at 340 nm. The kinetic parameters for NAD+ were determined using concentrations varying from 0.0 to 2 mM at a saturating formate concentration of 167 mM (Km = 2.2, 8.3 and 4.5 mM for light, half heavy and heavy FDH respectively). Similarly, kinetic parameters for formate were determined using concentrations varying from 0.0 to 125 mM at a saturating NAD+ concentration of 1.2 mM (Km = 0.021, 0.059 and 0.061 mM for light, half heavy and heavy FDH respectively). All measurements were carried out in triplicate in 100 mM phosphate buffer at pH 7.5 and 25 °C.
Results and Discussion
Protein preparation and Structure
Light, half-heavy and heavy FDHs were expressed and purified. They yielded monomeric molecular weights of 40.31, 42.54 and 44.77 kDa, respectively as determined by ESI-MS (Figure S1). Correspondingly, half-heavy and heavy FDHs were 5.5% and 11.1% heavier than the light enzyme, which were close to the theoretically expected values of 5.7% and 12.8% respectively. It should be noted that for the labeled enzymes, only non-exchangeable hydrogens are isotopically labeled (i.e., only C-H bonds). This includes all the buried hydrogens, as indicated by the same protein mass for heavy FDH following the treatment with 8M urea, as for the untreated (Figure S2). Circular dichroism (CD) spectra of the three FDH isotopologues are similar across the temperature range studied (25- 75 °C, example spectra at 25, 35 and 45 °C are presented in Figure S3). Table 1 shows the Tm data (averages of two independent measurements) for light, half heavy and heavy FDHs, and the thermal denaturation curves are given in Figure S3 of the SI.
Table 1. Melting temperatures (Tm) for light, half heavy and heavy FDH isotopologues.
| FDH | light | Half heavy | heavy |
|---|---|---|---|
| Tm (°C) | 59.5 ± 0.2 | 61.5 ± 0.3 | 59.0 ± 0.2 |
Statistically, the Tm values for the light and heavy enzymes can be regarded as similar while there is a ∼2°C difference between those of the light and half heavy FDHs. These differences, like the kinetic constants discussed later, exhibit no trend with mass. A similar study based on melting curves was carried out by Schramm et al. for DHFR.14 Their work showed a difference in the melting curves between light and heavy counterparts in which the melting curve at 230 nm shifts to lower temperatures for heavy enzyme. The ca. 2 °C difference in Tm between the half heavy and light FDHs is either related to subtle changes in electrostatics or differences in the ground state (GS) protein conformations. For FDH we do not see any significant change in the GS conformations upon isotopic substitution according to CD spectra collected at 25, 35 and 45 °C (Fig. S3), suggesting that changes in the electrostatic interactions within the protein are the most probable source for differences in Tm. Furthermore, alterations in protein Tm are likely to be the result of increased hydrophobic interactions61 (change in hydrophobicity due to isotopic labeling is discussed later in this article). Additionally, unlike in ref. 14, where the change in GS conformations was supported by the observation of a sudden change in temperature dependence of the intrinsic KIEs (KIEint), there is no such evidence of conformational change for labeled FDH. The fact that the half-heavy enzyme shows the largest perturbation to Tm is somewhat unexpected since the substitution of the C and N isotopes would not be expected to have as large an effect on electrostatic interactions as would D substitution, which suggests that this could be an interesting area for further studies. Nevertheless, the main result of the Tm measurements is that the perturbations to the intermolecular interactions and protein conformations caused by isotopic substitution appear to be modest and exhibit no trend with protein mass.
The Protein Mass Effect on the Catalyzed Chemical Step
Intrinsic KIEs on the hydride transfer reactions catalyzed by light, half-heavy, and heavy FDHs were measured to investigate the protein mass effects on the chemical step. Isotope effects on activation parameters (ΔEa (T-H)) for all isotopologues of FDH were determined and compared (Figure 1). Tables S1, S2 and S3 summarize the observed and intrinsic KIE values along with the forward commitment factors (discussed later).
Figure 1.

Temperature dependence of intrinsic H/T KIEs and their relations to the protein's mass. (A) Arrhenius plot of intrinsic H/T KIEs for the hydride transfer reaction catalyzed by lightb (green), half-heavy (red) and heavy (blue) FDHs. (B) Graphical representation of the temperature dependence from panel A as ΔEa(T-H) for the three FDH isotopologues against the corresponding inverse square root of mass (or vibrational modulations according to ν = (1/27π)(k/μ)1/2, where v is vibrational frequency, k is force constant and μ is reduced mass). The black dotted line is to aid the eye only.
ΔEa (T-H) for the three FDH isotopologues are proportional to the inverse square root of protein mass (Figure 1).
According to the activated tunneling model,5 the distribution of DADs is reflected by ΔEa between the two substrate isotopologues (ΔEa(T-H) =Ea(T) - Ea(H)). The ΔEa for light, half heavy and heavy FDHs are 0.05 ± 0.10 (from ref41), 1.65 ± 0.11 and 2.50 ± 0.07 kcal/mol respectively (Figure 1B). The findings summarized in Figure 1B delineate a proportionality between the increase in the width of the DAD sampling distribution (increased ΔEa), and increase in the protein's mass, which is accompanied by a decrease in its vibrational frequencies, to reveal the coupling between fast protein vibrations to hydride transfer.
The observed change in the (intrinsic) KIEs can be achieved in a number of ways besides isotopic labeling of protein and/or cofactor;33 eg: hydrostatic pressure,62 site-directed mutagenesis63,64 and alterations in protein solvation,65 use of un-natural (alternate) substrates,66,67 or even species variation across the evolutionary timeline (eg: variation in the intrinsic KIE values of ecDHFR and hsDHFR although both show temperature independence)28 etc. The interpretation of the temperature dependence of KIEs, however, is similar in all of these instances, i.e. the temperature dependence of the KIE reflects the temperature dependence of the DAD sampling that is required for hydrogen tunneling to take place in the TRS, which is now a well-established framework for the interpretation of these experiments.2,5,6,25,29,68-71 The current work seeks to test a model a model that has emerged recently and suggests that, for isotopically labeled proteins, the potential energy surfaces are similar and that isotope labeling shifts the vibrational frequencies of the protein as a result of the mass change leading to changes in the DAD sampling frequency and thereby giving rise to temperature-dependent KIEs.14,21 As similar correlations are precedent in a variety of other systems, e.g. PNP23 and PETNR24, the result represented in Figure 1B is notable as it contributes to a body of correlative evidence that supports a similar interpretation, i.e. that altering the mass of the protein shifts the timescales of the protein motions thereby disrupting the network of protein motions responsible for the precise alignment of the DAD.
Forward Commitment Factors
The suppression of observed KIEs from their intrinsic values by isotopically insensitive kinetic steps is a common feature in enzyme catalyzed reactions and is known as kinetic complexity.56,59,60 The formate dehydrogenase mechanism involves ordered binding of substrates, as outlined in Scheme 2:
Scheme 2.

Ordered Mechanisms of FDH Catalysis. A and B are the respective substrates NAD+ and formate; P and Q are the respective products CO2 and NADH. Note that the k7 step that for release of CO2, is irreversible, as discussed earlier in the text.
For the mechanism of Scheme 1 kcat/Km (= (V/K)/[E]T) is given by eq. 7, which shows that V/K contains rate constants from the E + A + B reactant state up to and through the first irreversible step in the mechanism, the isotopically sensitive hydride-transfer step k5.
| (7) |
Eq. 8 is the corresponding expression for the forward commitment to catalysis:
| (8) |
Hence, Cf is the ratio of the rate constant of the isotopically sensitive step to the net rate constant k4′ which leads from the EAB complex back to the E + A + B reactant state.
Since we measured observed KIEs on V/K and assessed intrinsic KIEs using the Northrop method, Cf could be calculated from Cf = (KIEobs – KIEint)/(1 – KIEobs),45 by rearranging eq. (6). Figure 2 presents an Arrhenius plot of Cf on V/K for the three FDH isotopologues. We fit the Cf to the Arrhenius equation and find an almost linear temperature dependence of Cf the reciprocal square root of the protein mass.
Figure 2.

Forward commitment factors of FDH isotopologues. (A) Arrhenius plot of forward commitment on V/K (Cf) for light (green, from ref 41) half-heavy (red) and heavy (blue) FDHs. (B) ΔEa of Cf vs. inverse square root of protein mass. The black dotted line is to aid the eye only.
The steepest temperature dependence of forward commitment factors (Cf) were seen for heavy FDH while the Cf for light FDH was temperature independent for the temperature range of 5 – 45 °C. This trend is identical pro forma to that seen for KIEint (Figure 1). The exponential behavior of the temperature dependence of Cf, presented on a logarithmic scale in y-axis (Figure 2A), suggests that it mostly reflects a single kinetic step; if it is from a linear combination of multiple such steps that occur prior to the first irreversible step in the catalytic cascade, then the exponential fitting would be non-linear72 [R values for linear regression for red (half heavy FDH) and blue (heavy FDH) lines are 0.97 and 0.93 respectively]. Further, Figure 2B shows correlation of difference in activation energy (ΔEa of Cf) to protein mass indicating that the energy of activation for the kinetic step responsible, is proportional to the mass of the protein. In a generic enzymatic C-H bond activation, Cf consists of steps that include the backward dissociation of substrates and the hydride transfer (cf. eq. 8). According to a report on Pseudomonas sp. 101 FDH, substrate dissociation rate constants are in the order of 101 s-1, for both NAD+ and formate73 in the FDH catalytic mechanism. As discussed later in this article, such long timescale events are affected by the change in electrostatics, and the changes are isotope specific rather than mass dependent. However, the activation energy difference of Cf (ΔEa_Cf) is mass dependent (Figure 2B), which suggests that it is predominantly governed by the hydride transfer step, which is the isotopically sensitive forward reaction rate constant, further proving the fact that chemistry (hydride transfer) is partially rate limiting in FDH catalysis42 (observation of non-zero Cf suggests that chemistry is not solely rate limiting). Although Cf is primarily a measure of slow timescale events – as part of steady state kinetics, interestingly though for FDH catalysis its temperature dependence shows proportionality to protein mass. Nevertheless, this further suggests that the observation of mass dependence of the chemical step catalyzed by FDH is conspicuous rather than fortuitous, since ΔEa values from intrinsic isotope effects and from Cf values are both linear functions of the reciprocal square root of the protein mass (cf. Fig. 2B and Fig 3B) However, more experimentation is needed to find out to which extent the backward isotopically insensitive rates are affected upon protein isotopic substitution.
Figure 3.
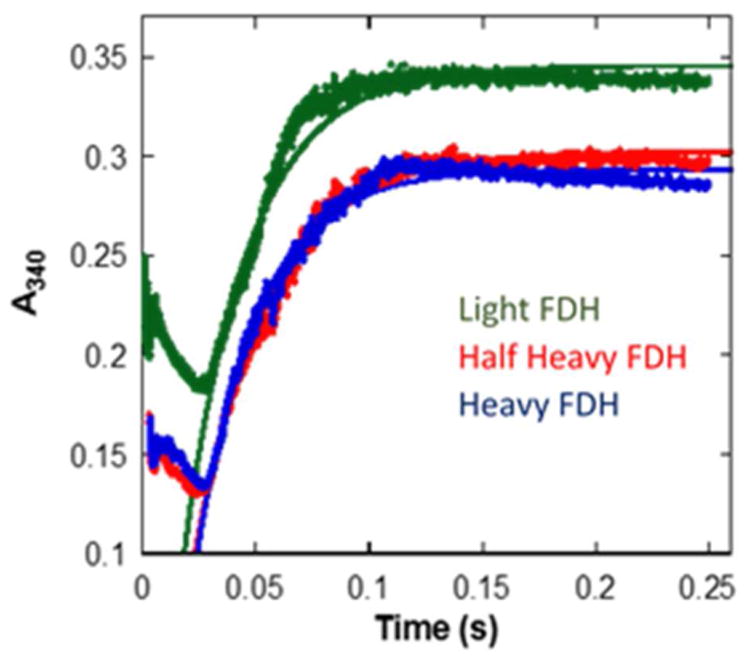
Single turnover kinetic traces for light, half heavy and heavy FDHs with 100 mM H-formate at 25 °C. (The difference in the maximum absorbance in the plots between light and labeled FDHs can be explained by the difference in Km or binding affinities for NAD+ in each FDH isotopologue).
Single Turnover Kinetics
To test if the protein isotope labeling affects the rate of the FDH catalyzed hydride transfer, we conducted single-turnover rate constant measurements using stopped flow at 25 °C. Shown in Figure 3 below are the kinetic traces with H-formate for the three FDH isotopologues. The kobs values for all isotopologues were indistinguishable within experimental error with both protiated and deuterated formate (Table 1). The use of 100 mM formate concentration was saturating for light FDH, suggested by similar kobs values at 200 and 400 mM formate concentrations (data not shown) and considering the Kmformate for the labeled FDH isotopologues (see Table 2), it is safe to assume that substrate saturation was met. These data suggest that the hydride transfer per se (as reflected by intrinsic KIEs) does not dominate kobs (single turnover rate) and that kinetic steps that determine kobs are not affected by the protein mass modulation. The initial 30 ms were not considered when fitting the data to the single exponential. This 30 ms lag phase observed prior to the exponential phase of the single turnover traces with light FDH41 was not affected by the mass modulation of the protein (i.e., it remained the same for all FDH isotopologues). This lag-phase may suggest a conformational change leading to hydride transfer after the formation of the FDH-NAD+-formate ternary complex, however, that phase is independent of both the protein mass and isotopic substitution.
Table 2. Observed Single Turnover Rate Constants kobs (s-1) for the Three FDH Isotopologues with Protiated and Deuterated Substrates.
| FDH Isotopologue | H-Formate | D-Formate |
|---|---|---|
| Light | 33 ± 2 | 32 ± 1 |
| Half Heavy | 31 ± 1 | 30 ± 3 |
| Heavy | 30 ± 2 | 33 ± 2 |
The single turnover kinetics for FDH catalyzed reaction reports on rates for steps between formation of the ternary complex and its subsequent conversion to enzyme-product complex. The fact that the substrate kinetic isotope effect (Hkobs/Dkobs) is essentially equal to one, suggests that kobs does not involve isotope sensitive steps that are rate limiting.
Steady State Kinetic Parameters
The steady state kinetic parameters for formate and NAD+ were determined with the three FDH isotopologues (Figure S4, Table 2). The findings indicate a decrease in kcat for heavy and half heavy FDHs compared to that for the light enzyme, but the decrease is not proportional to the mass or vibrational frequency of the protein (∝ (1/μ)1/2). Higher Km and smaller kcat/Km values are observed for both the substrates with the two labeled isotopologues, but again, no trend related to the protein's mass is apparent.
Isotopic labeling affects protein motions at multiple timescales, though the mechanism of those effects can differ. We observe ∼50% reduction in kcat in the half-heavy and heavy FDHs compared to that for the natural abundance (light) enzyme at saturating conditions of both formate and NAD+. Additionally, Km and kcat/Km for both substrate and cofactor show the largest differences between half heavy and light FDHs, similar to what is observed for Tm measurements (Table 1, Figure S3). The fact that the steady state parameters are perturbed but are not proportional to the protein mass changes, suggests that isotopic substitution alters the electrostatic interactions of the protein in ways that affect these kinetic parameters rather than these changes arising from mass modulation effects. Here mass modulation refers to the vibrational effect, which alters the fast timescale events (related by (1/2π)(k/μ)1/2) proportionately more because of the larger force constants involved, whereas electrostatic effects are isotope-induced changes in the bond polarity associated with the subtle changes in electronic structure that arise from the reduction in bond lengths and van der Waals radii that accompanies the reduced mass change upon isotopic substitution. Altered electrostatics make the dominant contribution to the changes in slow time scale events, s-μs, in the FDH catalytic mechanism such as substrate binding and release,73 product release and long length-scale conformational motions during hydride transfer, as the latter is partially rate limiting for the FDH mechanism. Although protein isotope labeling will slow motions at all time scales due to increased mass, the effect of mass on the slow timescale that is most relevant to the steady-state kinetic parameters is negligible because the force constant for such motions is so small that the mass change due to the isotopic labeling makes an insignificant change in the time scale of such motions. An increase of ca. 11% in protein mass results in a change of about a factor of 1.1 in the sampling frequencies.28 For example, if the frequency of some collective protein motions in the light FDH were 100 cm-1, then in the heavy FDH it would go down to about 90 cm-1, which is a substantive change in frequency for motions at this time scale. For an event that occurs on the ms timescale, however the frequency of the motion is on the order of 10-8 cm-1 and an 11% increase in protein mass would shift the frequency by an amount that is negligibly small for such a low frequency motion. Thus on long time scales, the effect of mass on dynamics is expected to be very small. In contrast, the effects of perturbations of the electrostatic interactions between residues as a result of isotopic substitution32 could be very significant for larger amplitude conformational changes that occur on long time scales. For instance, deuterium (2H) substitution on carbons is expected to have a very small but non-zero electrostatic effect due to the anharmonic nature of the C-H stretch. C-H has larger electrostatic dipole than for C-D and in the aliphatic regions, C-D becomes more hydrophobic.74 This may cause changes in electrostatic interactions of C-H bonds with their environment such as “non-classical” hydrogen bonding, e.g. C-H --- O and C-H --- π hydrogen bonding.75-77 Additionally, aromatic hydrogen substitution to 2H (D) has a 2° effect that weakens the π interactions of the ring, and makes it appear less hydrophobic.74 Each of these effects might be very small, but together these cannot be ignored, as C-H bonds are present in abundance in a protein structural assembly.75-80 The fact that both steady state and Tm measurements, which are kinetic and thermodynamic phenomena respectively, do not exhibit changes that show a trend as a function of protein mass of FDH but do show a dependence on the isotopic labeling pattern, lends support to the interpretation that the slow catalytic events are not affected by protein mass but rather by the changes in the electrostatics that result from isotopic substitutions. Interestingly, we observe the greatest effect on the kinetic parameters in the 13C;15N FDH isotopologue (half heavy) This effect likely results from perturbations in N-H hydrogen bonds, which would explain why the effect is unusually large. Consequently, we hypothesize that isotopic substitution of all nitrogens in the protein should lead to perturbations of the protein electrostatics and thus altered binding affinities and catalytic efficiencies, as prominently evident in the steady state parameters for half heavy FDH. Notably, the addition of D in the heavy FDH (C-D bonds) seems to partially alleviate this effect, on the steady state parameters relative to the 13C;15N isotopologue, as also seen in the FDH melting points (Tm). Thus the alterations in the electrostatics may be substantial and should be explored further.
Together, the combination of steady-state and single turnover kinetics suggest that V/K has been affected due to altered electrostatics upon protein isotopic labeling. The single-turnover rate constant is one of the microscopic constants that compose all steady-state parameters, namely, kcat, Km and V/K. According to the results obtained, this component is not isotopically sensitive for the FDH catalyzed reaction; steady state kinetics show altered ligand binding interactions. Overall, different events in the catalytic cycle of FDH show different dependencies of the rate on isotope labeling determined by the timescale of the motions involved, i.e. fs-ps timescale events (hydride transfer) show proportionality to the square root of the mass and s-μs timescale events are not sensitive to mass of either protein or substrate isotopes (single-turnover kinetics), but show dependence on the protein isotopic labeling pattern (steady-state parameters) due to changes in the electrostatics.
Conclusions
The use of isotopically labeled (heavy) enzymes to investigate the role of fast protein dynamics in enzyme-catalyzed reactions is gaining popularity. The reasons are that production of heavy enzymes is relatively accessible and the original promise21 of direct examination of the role of protein dynamics in catalysis is still highly valued. The ability to modulate protein vibrations without affecting electrostatics is most appealing if one wishes to test the effect of these vibrations on protein function. In the current study the stochastic fast vibrations in the enzyme FDH have been disturbed upon isotopic substitution of carbons, nitrogens, and non-exchangeable hydrogens, and the effect of this alteration on enzyme functions was examined. Three isotopologues of FDH with masses of 40.31, 42.54 and 44.77 kDa were used to investigate the role of fast protein vibrations in its catalyzed chemical bond cleavage and other kinetic steps along the catalytic cycle. Intrinsic KIE studies and their temperature dependence were used to examine the physical nature of the chemistry, and varied kinetic probes were applied to examine other kinetic steps.
The current findings suggest that the perturbation of the motions in FDH alters several kinetic events along the catalytic path, including the sampling of DADs at the TRS of the C-H→C hydride transfer (i.e., the chemical step per se). The apparent correlations of ΔEa of the intrinsic KIEs and ΔEa_of Cf between protein vibrations, are consistent with the original idea of “Born-Oppenheimer” enzymes, where the higher protein mass alters vibrations associated with the bond cleavage.21 This observation accords well with studies of PNP that also suggested proportional effects of mass modulation and kinetic parameters related to bond cleavage.23 Furthermore, this similarity is valid despite the fact that the chemical step has a different nature and involves different types of transformation in these two systems, i.e. C-H→C vs. N-C→O. These differences may explain why the nature of the chemical step was exposed on different kinetic parameters, but the critical similarity is in the mass correlation to a chemical event. In both studies of PNP and PETNR the mass-kinetics proportionality had been inferred to as the extent of decoupling of fast vibrational modes from the enzyme catalyzed chemistry, although both reported observed enzyme23 and/or co-factor24,33 KIEs rather than intrinsic values. In the current study on the other hand, the protein vibrational frequency represented by the [protein mass]-1/2 is found to be proportional to the temperature dependence of intrinsic KIEs (ΔEa). The single turnover rate constants for FDH, however, are independent of the hydride or protein masses; a possible explanation is that in both PNP and PETNR the chemical step is readily accessible by stopped flow measurements, while in FDH the single turnover rate constant represents other kinetic steps, thus only intrinsic KIEs appear to be proportional to the mass-altered vibrations.
The effects of protein isotopic substitution on the steady state parameters with FDH, however, do not accord with vibrational mass-modulation. The altered steady state parameters raises the possibility that the protein's affinity to ligands has also been modified in a way that does not correlate with its mass, suggesting that the isotopic substitution of the protein may also alter its interaction with ligands, conformations upon ligand binding, and electrostatics in general. This finding is consistent with reports that in some systems, like bacterial and human dihydrofolate reductases for example,14,28 the mass modulation had no effect on the chemical step, but did modify other kinetic and thermodynamic events along the catalytic cycle. Further, thermal denaturation temperature (Tm) for FDH does not act as supportive evidence for ground state conformational changes as for EcDHFR, where a phase change is caused in KIEint, but rather backs the relative increase in hydrophobicity in the protein due to heavier isotopes.
In conclusion, protein mass alteration in different enzymes leads to different observations and thus varied conclusions, thus it appears that the effects of isotopic substitution of enzymes are very much system dependent. However in the expedition of mass effects of FDH it became clear that in some enzymes, like in the current study, once the fast chemical event is isolated from the preceding and succeeding kinetic steps, the fast vibrations in the native enzyme indeed seem to be coupled to, or resonant with, the catalyzed chemical event and the alteration of protein dynamics by isotopic substitution further disrupted the electrostatic field modifying long timescale events in the catalytic turnover.
Supplementary Material
Table 3. Steady State Kinetic Parameters for Unlabeled and Labeled FDHs at 25 °C.
| Light FDH | Half-Heavy FDH | Heavy FDH | |
|---|---|---|---|
| kcatformate a (s-1) | 1.78 ± 0.03 | 0.85 ± 0.04 | 0.92 ± 0.02 |
| Kmformate a (mM) | 2.2 ± 0.2 | 8.3 ± 1.3 | 4.5 ± 0.4 |
| (kcat/Km)formate a (s-1 M-1) | (8.2 ± 0.6) × 102 | (1.0 ± 0.1) × 102 | (2.1 ± 0.2) × 102 |
| kcatNAD+ b (s-1) | 2.03 ± 0.05 | 0.79 ± 0.02 | 1.04 ± 0.03 |
| KmNAD+ b (mM) | (2.1 ± 0.3) × 10-2 | (5.9 ± 0.6) × 10-2 | (6.1 ± 0.7) × 10-2 |
| (kcat/Km)NAD+ b (s-1 M-1) | (9.7 ± 1.1) × 104 | (1.3 ± 0.1) × 104 | (1.7 ± 0.2) × 104 |
kcatformate, Kmformate and (kcat/Km)formate are turnover number, Michaelis constant and catalytic efficiency for formate;
kcatNAD+, KmNAD+ and (kcat/Km)NAD+ are turnover number, Michaelis constant and catalytic efficiency for NAD+.
Acknowledgments
This work was supported by grants from the NIH GM065368 and GM079368, the NSF CHE-1149023, and BSF 2012340.
Footnotes
Supporting Information: ESI mass spectra for native and heavy FDHs; Plots from steady state kinetic experiments; Tables of observed and intrinsic KIEs and Cf values at different temperatures. This material is available free of charge via the Internet at http://pubs.acs.org/.
Notes: The authors declare that they have no conflicts of interest with the contents of this article.
References
- 1.Nagel ZD, Klinman JP. Nat Chem Biol. 2009;5:543. doi: 10.1038/nchembio.204. [DOI] [PubMed] [Google Scholar]
- 2.Klinman JP, Kohen A. Annu Rev Biochem. 2013;82:471. doi: 10.1146/annurev-biochem-051710-133623. [DOI] [PMC free article] [PubMed] [Google Scholar]
- 3.Glowacki DR, Harvey JN, Mulholland AJ. Nat Chem. 2012;4:169. doi: 10.1038/nchem.1244. [DOI] [PubMed] [Google Scholar]
- 4.Hay S, Scrutton NS. Nat Chem. 2012;4:161. doi: 10.1038/nchem.1223. [DOI] [PubMed] [Google Scholar]
- 5.Kohen A. Acc Chem Res. 2015;48:466. doi: 10.1021/ar500322s. [DOI] [PMC free article] [PubMed] [Google Scholar]
- 6.Klinman JP. Acc Chem Res. 2015;48:449. doi: 10.1021/ar5003347. [DOI] [PMC free article] [PubMed] [Google Scholar]
- 7.Agarwal PK. Microb Cell Fact. 2006;5:1. doi: 10.1186/1475-2859-5-2. [DOI] [PMC free article] [PubMed] [Google Scholar]
- 8.Agarwal PK, Billeter SR, Rajagopalan PTR, Benkovic SJ, Hammes-Schiffer S. Proc Natl Acad Sci U S A. 2002;99:2794. doi: 10.1073/pnas.052005999. [DOI] [PMC free article] [PubMed] [Google Scholar]
- 9.Kamerlin SCL, Warshel A. Proteins: Struc, Funct, Bioinf. 2010;78:1339. doi: 10.1002/prot.22654. [DOI] [PMC free article] [PubMed] [Google Scholar]
- 10.Cheatum CM, Kohen A. Top Curr Chem. 2013;337:1. doi: 10.1007/128_2012_407. [DOI] [PMC free article] [PubMed] [Google Scholar]
- 11.Warshel A, Bora RP. J Chem Phys. 2016;144:180901. doi: 10.1063/1.4947037. [DOI] [PMC free article] [PubMed] [Google Scholar]
- 12.Hammes-Schiffer S, Benkovic SJ. Annu Rev Biochem. 2006;75:519. doi: 10.1146/annurev.biochem.75.103004.142800. [DOI] [PubMed] [Google Scholar]
- 13.Masterson JE, Schwartz SD. J Phys Chem A. 2013;117:7107. doi: 10.1021/jp400376h. [DOI] [PMC free article] [PubMed] [Google Scholar]
- 14.Wang Z, Singh P, Czekster CM, Kohen A, Schramm VL. J Am Chem Soc. 2014;136:8333. doi: 10.1021/ja501936d. [DOI] [PMC free article] [PubMed] [Google Scholar]
- 15.Antoniou D, Schwartz SD. J Phys Chem B. 2011;115:15147. doi: 10.1021/jp207876k. [DOI] [PMC free article] [PubMed] [Google Scholar]
- 16.Saenoon S, Quaytman-Machleder S, Schramm VL, Schwartz SD. Proc Natl Acad Sci U S A. 2008;105:16543. doi: 10.1073/pnas.0808413105. [DOI] [PMC free article] [PubMed] [Google Scholar]
- 17.Kanaan N, Martí S, Moliner V, Kohen A. J Phys Chem A. 2009;113:2176. doi: 10.1021/jp810548d. [DOI] [PMC free article] [PubMed] [Google Scholar]
- 18.Masgrau L, Roujeinikova A, Johannissen LO, Hothi P, Basran J, Ranaghan KE, Mulholland AJ, Sutcliffe MJ, Scrutton NS, Leys D. Science. 2006;312:237. doi: 10.1126/science.1126002. [DOI] [PubMed] [Google Scholar]
- 19.Schwartz SD. In: Isotope Effects in Chemistry and Biology. Kohen A, Limbach HH, editors. CRC Press; Boca Raton, FL: 2006. p. 475. [Google Scholar]
- 20.Schwartz SD. Top Curr Chem. 2013;337:189. doi: 10.1007/128_2012_412. [DOI] [PMC free article] [PubMed] [Google Scholar]
- 21.Silva RG, Murkin AS, Schramm VL. Proc Natl Acad Sci U S A. 2011;108:18661. doi: 10.1073/pnas.1114900108. [DOI] [PMC free article] [PubMed] [Google Scholar]
- 22.Kipp DR, Silva RG, Schramm VL. J Am Chem Soc. 2011;133:19358. doi: 10.1021/ja209391n. [DOI] [PMC free article] [PubMed] [Google Scholar]
- 23.Suarez J, Schramm VL. Proc Natl Acad Sci U S A. 2015;112:11247. doi: 10.1073/pnas.1513956112. [DOI] [PMC free article] [PubMed] [Google Scholar]
- 24.Pudney CR, Guerriero A, Baxter NJ, Johannissen LO, Waltho JP, Hay S, Scrutton NS. J Am Chem Soc. 2013;135:2512. doi: 10.1021/ja311277k. [DOI] [PubMed] [Google Scholar]
- 25.Luk LYP, Ruiz-Pernia JJ, Dawson WM, Roca M, Loveridge EJ, Glowacki DR, Harvey JN, Mulholland AJ, Tunon I, Moliner V, Allemann RK. Proc Natl Acad Sci U S A. 2013;110:16344. doi: 10.1073/pnas.1312437110. [DOI] [PMC free article] [PubMed] [Google Scholar]
- 26.Antoniou D, Ge X, Schramm VL, Schwartz SD. J Phys Chem Lett. 2012;3:3538. doi: 10.1021/jz301670s. [DOI] [PMC free article] [PubMed] [Google Scholar]
- 27.Toney MD, Castro JN, Addington TA. J Am Chem Soc. 2013;135:2509. doi: 10.1021/ja3101243. [DOI] [PMC free article] [PubMed] [Google Scholar]
- 28.Francis K, Sapienza PJ, Lee AL, Kohen A. Biochemistry. 2016;55:1100. doi: 10.1021/acs.biochem.5b00945. [DOI] [PMC free article] [PubMed] [Google Scholar]
- 29.Luk LYP, Loveridge EJ, Allemann RK. J Am Chem Soc. 2014;136:6862. doi: 10.1021/ja502673h. [DOI] [PMC free article] [PubMed] [Google Scholar]
- 30.Świderek K, Javier Ruiz-Pernía J, Moliner V, Tuñón I. Curr Opin Chem Biol. 2014;21:11. doi: 10.1016/j.cbpa.2014.03.005. [DOI] [PubMed] [Google Scholar]
- 31.Wang Z, Chang EP, Schramm VL. J Am Chem Soc. 2016;138:15004. doi: 10.1021/jacs.6b09049. [DOI] [PMC free article] [PubMed] [Google Scholar]
- 32.Kholodar SA, Ghosh AK, Kohen A. In: Methods in Enzymology. Harris ME, Anderson VE, editors. Vol. 596. Academic Press; 2017. p. 43. [DOI] [PubMed] [Google Scholar]
- 33.Longbotham JE, Hardman SJO, Gorlich S, Scrutton NS, Hay S. J Am Chem Soc. 2016;138:13693. doi: 10.1021/jacs.6b07852. [DOI] [PubMed] [Google Scholar]
- 34.Luk LYP, Ruiz-Pernia JJ, Adesina AS, Loveridge EJ, Tunon I, Moliner V, Allemann RK. Angew Chem, Int Ed. 2015;54:9016. doi: 10.1002/anie.201503968. [DOI] [PMC free article] [PubMed] [Google Scholar]
- 35.Ruiz-Pernia JJ, Behiry E, Luk LYP, Loveridge EJ, Tunon I, Moliner V, Allemann RK. Chem Sci. 2016;7:3248. doi: 10.1039/c5sc04209g. [DOI] [PMC free article] [PubMed] [Google Scholar]
- 36.Zoi I, Suarez J, Antoniou D, Cameron SA, Schramm VL, Schwartz SD. J Am Chem Soc. 2016;138:3403. doi: 10.1021/jacs.5b12551. [DOI] [PMC free article] [PubMed] [Google Scholar]
- 37.Schramm VL. Acc Chem Res. 2015;48:1032. doi: 10.1021/acs.accounts.5b00002. [DOI] [PMC free article] [PubMed] [Google Scholar]
- 38.Loveridge EJ, Allemann RK. Future Sci OA. 2016;2:FSO95. doi: 10.4155/fsoa.2015.0017. [DOI] [PMC free article] [PubMed] [Google Scholar]
- 39.Blanchard JS, Cleland WW. Biochemistry. 1980;19:3543. doi: 10.1021/bi00556a020. [DOI] [PubMed] [Google Scholar]
- 40.Popov VO, Lamzin VS. Biochem J. 1994;301:625. doi: 10.1042/bj3010625. [DOI] [PMC free article] [PubMed] [Google Scholar]
- 41.Guo Q, Gakhar L, Wickersham K, Francis K, Vardi-Kilshtain A, Major DT, Cheatum CM, Kohen A. Biochemistry. 2016;55:2760. doi: 10.1021/acs.biochem.6b00181. [DOI] [PMC free article] [PubMed] [Google Scholar]
- 42.Vardi-Kilshtain A, Major DT, Kohen A, Engel H, Doron D. J Chem Theory Comput. 2012;8:4786. doi: 10.1021/ct300628e. [DOI] [PubMed] [Google Scholar]
- 43.Bandaria JN, Cheatum CM, Kohen A. J Am Chem Soc. 2009;131:10151. doi: 10.1021/ja902120t. [DOI] [PMC free article] [PubMed] [Google Scholar]
- 44.Bandaria JN, Dutta S, Hill SE, Kohen A, Cheatum CM. J Am Chem Soc. 2007;130:22. doi: 10.1021/ja077599o. [DOI] [PMC free article] [PubMed] [Google Scholar]
- 45.Bandaria JN, Dutta S, Nydegger MW, Rock W, Kohen A, Cheatum CM. Proc Natl Acad Sci U S A. 2010;107:17974. doi: 10.1073/pnas.0912190107. [DOI] [PMC free article] [PubMed] [Google Scholar]
- 46.Pagano P, Guo Q, Kohen A, Cheatum CM. J Phys Chem Lett. 2016;7:2507. doi: 10.1021/acs.jpclett.6b01154. [DOI] [PMC free article] [PubMed] [Google Scholar]
- 47.Fan Y, Cembran A, Ma S, Gao J. Biochemistry. 2013;52:2036. doi: 10.1021/bi301559q. [DOI] [PMC free article] [PubMed] [Google Scholar]
- 48.Sen A, Kohen A. J Phys Org Chem. 2010;23:613. [Google Scholar]
- 49.Cleland WW. In: Isotope Effects in Chemistry and Biology. Kohen A, Limbach HH, editors. CRC Press; Boca Raton, FL: 2006. p. 915. [Google Scholar]
- 50.Roston D, Cheatum CM, Kohen A. Biochemistry. 2012;51:6860. doi: 10.1021/bi300613e. [DOI] [PMC free article] [PubMed] [Google Scholar]
- 51.Bruno WJ, Bialek W. Biophys J. 1992;63:689. doi: 10.1016/S0006-3495(92)81654-5. [DOI] [PMC free article] [PubMed] [Google Scholar]
- 52.Labrou NE, Karagouni A, Clonis YD. Biotechnol Bioeng. 1995;48:278. doi: 10.1002/bit.260480314. [DOI] [PubMed] [Google Scholar]
- 53.Labrou NE. Bioseparation. 2000;9:99. doi: 10.1023/a:1008131320571. [DOI] [PubMed] [Google Scholar]
- 54.Sreerama N, Woody RW. Anal Biochem. 2000;287:252. doi: 10.1006/abio.2000.4880. [DOI] [PubMed] [Google Scholar]
- 55.Whitmore L, Wallace BA. Biopolymers. 2008;89:392. doi: 10.1002/bip.20853. [DOI] [PubMed] [Google Scholar]
- 56.Northrop DB. In: Enzyme Mechanism from Isotope Effects. Cook PF, editor. CRC Press; Boca Raton, FL: 1991. p. 181. [Google Scholar]
- 57.Northrop DB. Biochemistry. 1975;14:2644. doi: 10.1021/bi00683a013. [DOI] [PubMed] [Google Scholar]
- 58.Swain CG, Stivers EC, Reuwer JF, Jr, Schaad LJ. J Am Chem Soc. 1958;80:5885. [Google Scholar]
- 59.Cook PF, Cleland WW. Enzyme Kinetics and Mechanism. Taylor & Francis Group; New York, NY: 2007. [Google Scholar]
- 60.Roston D, Islam Z, Kohen A. Molecules. 2013;18:5543. doi: 10.3390/molecules18055543. [DOI] [PMC free article] [PubMed] [Google Scholar]
- 61.Franzosa EA, Lynagh KJ, Xia Y. In: Experimental Standard Conditions of Enzyme Characterizations, Proceedings of the 4th International Beilstein Symposium, Rüdesheim/Rhein, Germany, September 13th – 16th, 2009. Hicks MG, Kettner C, editors. Beilstein-Institut zur Förderung der Chemischen Wissenschaften; Frankfurt: 2010. p. 99. [Google Scholar]
- 62.Hay S, Johannissen LO, Hothi P, Sutcliffe MJ, Scrutton NS. Journal of the American Chemical Society. 2012;134:9749. doi: 10.1021/ja3024115. [DOI] [PubMed] [Google Scholar]
- 63.Knapp MJ, Rickert K, Klinman JP. Journal of the American Chemical Society. 2002;124:3865. doi: 10.1021/ja012205t. [DOI] [PubMed] [Google Scholar]
- 64.Stojković V, Perissinotti LL, Willmer D, Benkovic SJ, Kohen A. J Am Chem Soc. 2012;134:1738. doi: 10.1021/ja209425w. [DOI] [PMC free article] [PubMed] [Google Scholar]
- 65.Klinman JP. Chemical physics letters. 2009;471:179. doi: 10.1016/j.cplett.2009.01.038. [DOI] [PMC free article] [PubMed] [Google Scholar]
- 66.Van Vleet JL, Reinhardt LA, Miller BG, Sievers A, Wallace Cleland W. Biochemistry. 2008;47:798. doi: 10.1021/bi701664n. [DOI] [PubMed] [Google Scholar]
- 67.Anderson VE. Biochimica et Biophysica Acta (BBA) - Proteins and Proteomics. 2015;1854:1729. doi: 10.1016/j.bbapap.2015.05.016. [DOI] [PubMed] [Google Scholar]
- 68.Nagel ZD, Klinman JP. Chemical reviews. 2010;110:PR41. doi: 10.1021/cr1001035. [DOI] [PMC free article] [PubMed] [Google Scholar]
- 69.Ruiz-Pernia JJ, Luk LYP, García-Meseguer R, Martí S, Loveridge EJ, Tuñón I, Moliner V, Allemann RK. J Am Chem Soc. 2013;135:18689. doi: 10.1021/ja410519h. [DOI] [PMC free article] [PubMed] [Google Scholar]
- 70.Luk LYP, Ruiz-Pernía JJ, Dawson WM, Loveridge EJ, Tuñón I, Moliner V, Allemann RK. J Am Chem Soc. 2014;136:17317. doi: 10.1021/ja5102536. [DOI] [PubMed] [Google Scholar]
- 71.Ghosh AK, Islam Z, Krueger J, Abeysinghe T, Kohen A. Phys Chem Chem Phys. 2015;17:30867. doi: 10.1039/c5cp01246e. [DOI] [PMC free article] [PubMed] [Google Scholar]
- 72.Singh P, Sen A, Francis K, Kohen A. J Am Chem Soc. 2014;136:2575. doi: 10.1021/ja411998h. [DOI] [PMC free article] [PubMed] [Google Scholar]
- 73.Tishkov VI, Galkin AG, Egorov AM. Biochimie. 1989;71:551. doi: 10.1016/0300-9084(89)90186-7. [DOI] [PubMed] [Google Scholar]
- 74.Turowski M, Yamakawa N, Meller J, Kimata K, Ikegami T, Hosoya K, Tanaka N, Thornton ER. J Am Chem Soc. 2003;125:13836. doi: 10.1021/ja036006g. [DOI] [PubMed] [Google Scholar]
- 75.Chamberlain AK, Bowie JU. J Mol Biol. 2002;322:497. doi: 10.1016/s0022-2836(02)00785-4. [DOI] [PubMed] [Google Scholar]
- 76.Brandl M, Weiss MS, Jabs A, Sühnel J, Hilgenfeld R. J Mol Biol. 2001;307:357. doi: 10.1006/jmbi.2000.4473. [DOI] [PubMed] [Google Scholar]
- 77.Anand S, Anbarasu A, Sethumadhavan R. Int J Biol Macromol. 2008;43:468. doi: 10.1016/j.ijbiomac.2008.09.004. [DOI] [PubMed] [Google Scholar]
- 78.Nishio M. Phys Chem Chem Phys. 2011;13:13873. doi: 10.1039/c1cp20404a. [DOI] [PubMed] [Google Scholar]
- 79.Couture JF, Hauk G, Thompson MJ, Blackburn GM, Trievel RC. J Biol Chem. 2006;281:19280. doi: 10.1074/jbc.M602257200. [DOI] [PubMed] [Google Scholar]
- 80.Horowitz S, Yesselman JD, Al-Hashimi HM, Trievel RC. J Biol Chem. 2011;286:18658. doi: 10.1074/jbc.M111.232876. [DOI] [PMC free article] [PubMed] [Google Scholar]
Associated Data
This section collects any data citations, data availability statements, or supplementary materials included in this article.