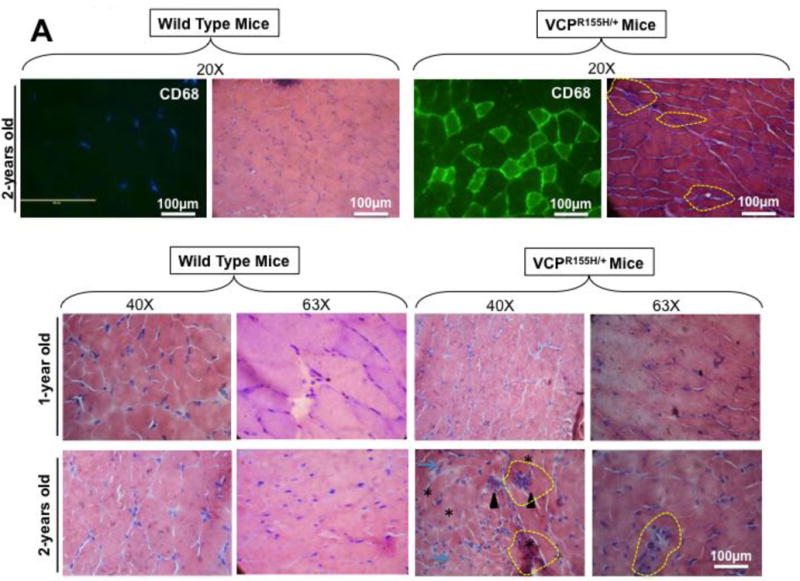
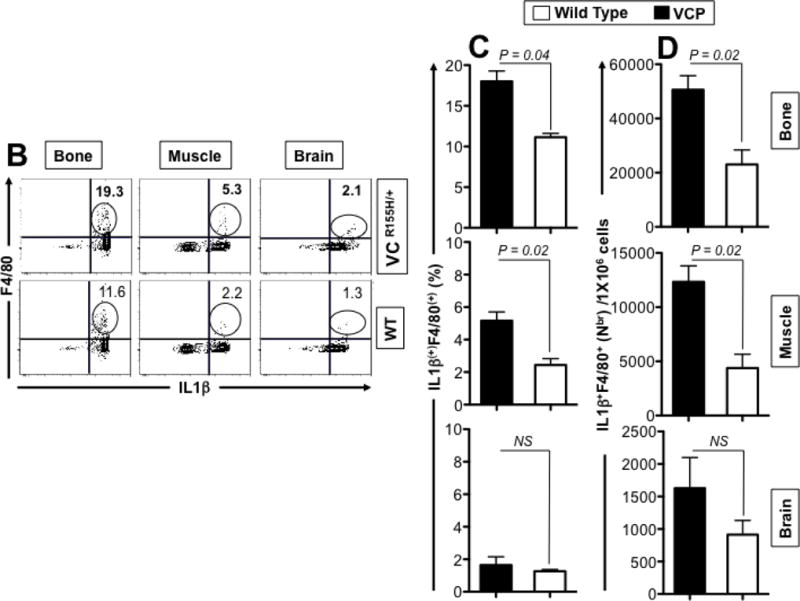
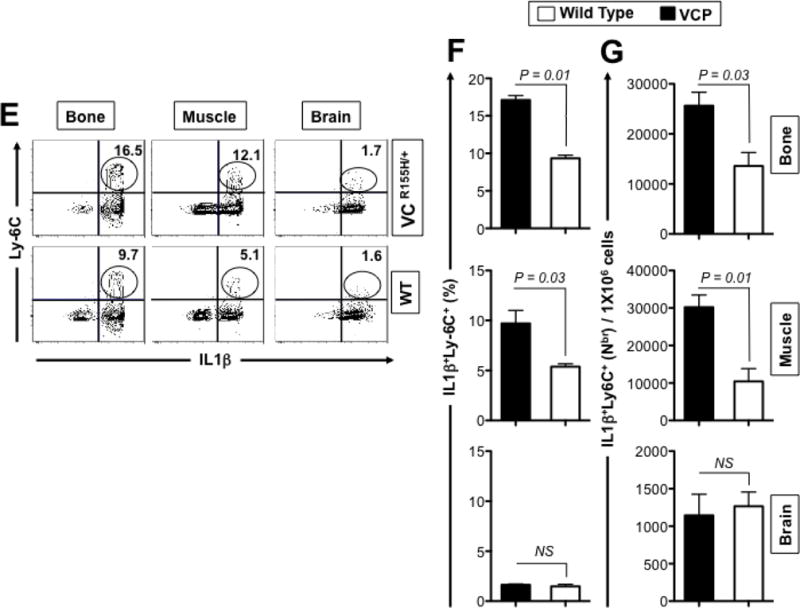
Figure 4. Histology and FACS analysis of iNOS- and IL-1β-producing inflammatory macrophages infiltrating bone, muscle and brain of VCPR155H/+ heterozygote mice.


(A) Two-years-old VCPR155H/+ heterozygote and WT littermate mice were immunostained with CD68, a glycoprotein expressed on monocytes and macrophages (Magnification at 20×) and in parallel stained with Hematoxylin and eosin (Magnification at 20×). H&E sections show cell infiltrates in muscle of 1- and 2-years-old VCPR155H/+ heterozygote and WT littermate mice (Magnifications at 40× and 63×). As depicted, triangular black arrows show fibrosis, blue arrows depict central nucleation indicating regeneration, asterisks show degenerating fibers, and yellow arrows and yellow dotted lines point to persistent neutrophils, macrophages and necrotic myocytes. (B) Cell suspensions were harvested from bones, muscles and brains of 24-month old perfused VCPR155H/+ heterozygote mice (n = 8) and double stained using a mAb specific to mouse macrophages F4/80 surface marker (clone BM8) and a mAb specific to a mouse intracellular IL-1β (clone B122). Cell suspensions from bones, muscles and brains of 24-month old wild type mice (n = 8) used as controls were stained in parallel. Representative dot plot figure showing the percentages of F4/80(+)IL-1β(+) macrophages determined in bones, muscles and brains from VCPR155H/+ heterozygote mice vs. WT mice. The bar graphs represent the means and SD of the percentages (C) and number (D) of IL-1β(+)F4/80(+) macrophages in bones, muscles and brains from a group of 8 VCPR155H/+ heterozygote mice and 8WT mice. (E) Cell suspensions were harvested from bone, muscle and brain of 24-month old perfused VCPR155H/+ heterozygote mice and double stained using a mAb specific to Ly6C activation market of mouse macrophages (clone 1A8) and a mAb specific to a mouse intracellular IL-1β (clone B122). Cell suspensions from bones, muscles and brains of 24-month old wild type mice used as controls were stained in parallel. The percentages of IL-1β(+)Ly6C(+) macrophages were determined in each compartment and compared between VCPR155H/+ heterozygote mice (n = 8) and WT mice (n = 8). (F) The bar graphs represent the means and SD of the percentages of IL-1β(+)Ly6C(+) macrophages in the muscles, brains, and bones from a group of 8 VCPR155H/+ heterozygote mice and 8 WT mice. (G) The bar graphs represent the means and SD of the absolute numbers of IL-1β(+)Ly6C(+)macrophages detected in the muscles, brains, and bones from a group of VCPR155H/+ heterozygote mice and WT mice (n = 8). Experiments shown are representative of two independently experiments. (*) Indicates P < 0.05 when comparing percentages and number of IL-1β(+)F4/80(+)and IL-1β(+)Ly6C(+)macrophages in VCPR155H/+ heterozygote mice and WT mice using the Mann-Whitney test and 2-tails analysis.
