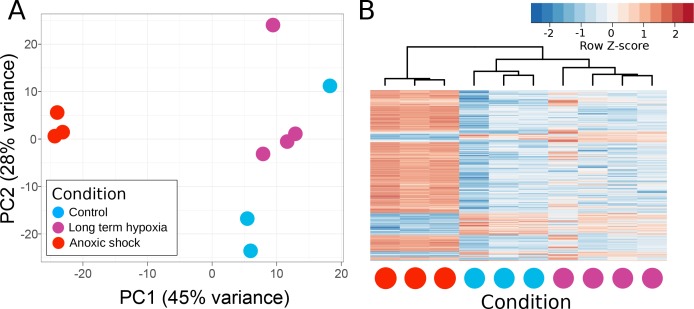
Figure 5. Principle components of T. wilhelma transcriptomes.
(A) PCA plot of variance of expressed genes, where each point represents the transcriptome from a single sponge specimen at the end of the experiment. Input data were normalized read-mapping counts per gene for each sample. Samples exposed to long term hypoxia were not significantly different (Adonis Pseudo-F = 1.6138, p=0.06) from controls. (B) Heatmap showing expression of the 739 differentially expressed genes across all samples and treatments. Red and blue intensities indicate differentially overexpressed and underexpressed genes, respectively.

