

Abstract
Annual influenza vaccinations are currently recommended for all individuals 6 months and older. Antibodies induced by vaccination are an important mechanism of protection against infection. Despite the overall public health success of influenza vaccination, many individuals fail to induce a substantial antibody response. Systems-level immune profiling studies have discerned associations between transcriptional and cell subset signatures with the success of antibody responses. However, existing signatures have relied on small cohorts and have not been validated in large independent studies. We leveraged multiple influenza vaccination cohorts spanning distinct geographical locations and seasons from the Human Immunology Project Consortium (HIPC) and the Center for Human Immunology (CHI) to identify baseline (i.e., before vaccination) predictive transcriptional signatures of influenza vaccination responses. Our multicohort analysis of HIPC data identified nine genes (RAB24, GRB2, DPP3, ACTB, MVP, DPP7, ARPC4, PLEKHB2, and ARRB1) and three gene modules that were significantly associated with the magnitude of the antibody response, and these associations were validated in the independent CHI cohort. These signatures were specific to young individuals, suggesting that distinct mechanisms underlie the lower vaccine response in older individuals. We found an inverse correlation between the effect size of signatures in young and older individuals. Although the presence of an inflammatory gene signature, for example, was associated with better antibody responses in young individuals, it was associated with worse responses in older individuals. These results point to the prospect of predicting antibody responses before vaccination and provide insights into the biological mechanisms underlying successful vaccination responses.
INTRODUCTION
Influenza infection is a serious global public health concern. Vaccination is currently the best available tool for protecting against infection. However, current estimates indicate that the vaccine is only 51% to 67% effective in adults under age 65 (1). This efficacy is further reduced in older adults who are 20% less likely to seroconvert than young adults and often fail to generate neutralizing antibodies that are critical to protection (2). A number of demographic factors have been associated with differential vaccination response, including age, gender, and smoking (3, 4). Furthermore, gene expression patterns can display different temporal patterns in young and older individuals (5), as well as in males and females after vaccination (4, 6). In addition, immune “states” can be highly variable across individuals (7). For instance, although some immune variables have strong genetic determinants (8, 9), many can be environmentally determined (10). Despite their substantial influence, preexisting molecular and cellular factors tend to account for a relatively modest fraction of the response variability (11). Reliable predictors involving a limited number of genes could provide useful information at the point of care to modify vaccination strategies or provide counseling on increased risk. Further, these signatures could provide insights into the underlying biological mechanisms that influence the immune response to vaccination and thus may offer clues on novel vaccine candidates and previously unknown vaccination strategies.
A number of systems biology studies have proposed gene expression and cellular signatures that are correlated with early vaccination response (7, 12–16). However, all but one (13) analyzed relatively small cohorts from single influenza seasons and geographic locations. Thus, these studies are not sufficiently powered to account for the substantial heterogeneity observed in the world, and their findings have yet to be validated in independent cohorts. Despite a number of systems biology studies on vaccination, only one study has found baseline predictive signatures that were based on immune cell frequencies after interrogating a large number of variables, including peripheral blood mononuclear cell (PBMC) gene expression (7), and baseline gene expression signatures were not predictive and thus remain elusive.
Here, we leveraged six influenza vaccination cohorts spanning distinct geographical locations and vaccination seasons from the Human Immunology Project Consortium (HIPC) and the Center for Human Immunology (CHI) (a National Institutes of Health intramural affiliate of HIPC) to conduct a multicenter analysis to identify baseline transcriptional signatures predictive of influenza vaccination responses. We took advantage of transcriptional profiling and antibody titer measurements across cohorts in HIPC and applied a common quantitative metric to stratify relative vaccine responses in all cohorts (7). We applied a recently developed framework designed for integrated, multicohort analysis of existing data sets. The framework has been shown to be successful in identifying robust and reproducible gene signatures by leveraging biological and technical heterogeneity present in those data sets (17) and has been successfully applied to a broad range of diseases including cancer (18, 19), organ transplants (20), and infectious diseases (4, 21–23). We applied this framework to four of our cohorts and successfully identified baseline gene expression signatures associated with responses. In addition, we used the Quantitative Set Analysis for Gene Expression (QuSAGE) (24) gene set analysis framework to identify baseline gene modules robustly associated with vaccination responses. We validated both the gene expression and module-based signatures in an independent cohort from a distinct geographic location (Fig. 1). These validated signatures were specific to young participants (below 35 years), and their effect sizes (strength of correlation with antibody responses) were inversely correlated in young and older participants.
Fig. 1. Overview of the data analysis strategy.
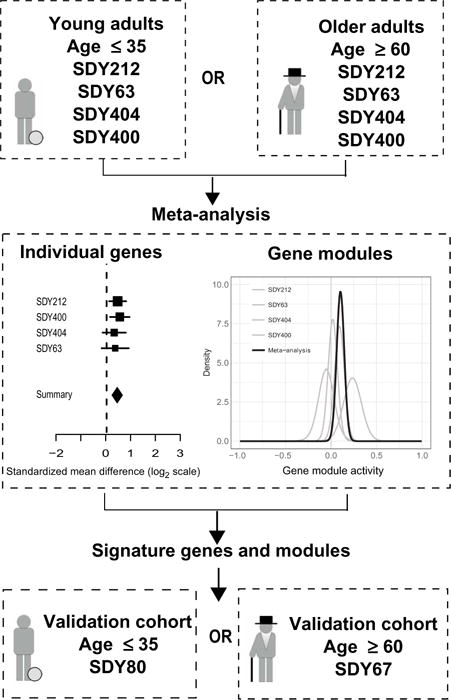
The meta-analysis was carried out on young and older influenza vaccination cohorts. Individual gene and module signatures were validated using independent cohorts.
RESULTS
We selected four large cohorts that each included both young and older adults as discovery cohorts to identify robust baseline (i.e., immediately before vaccination) gene expression signatures of influenza vaccination responses (see Fig. 2 and Methods for details). The age distribution within each cohort was bimodal (Fig. 2A), with participants either below the age of 35 or above 60 years. Before initiating this study, we further selected two independent validation cohorts for testing any signatures derived from the discovery cohorts (Fig. 2). Together, these studies include >500 individuals from four independent institutions within the United States across five consecutive vaccination seasons beginning in 2008–2009 (Fig. 2B). Basic demographic data were available for all of these individuals, along with pre- and postvaccination antibody titers from ImmPort and ImmuneSpace. In addition, genome-wide transcriptional profiling data were available from blood samples taken immediately before vaccination in a subset of 275 individuals.
Fig. 2. Vaccination cohorts used to define and validate influenza vaccination response gene and module signatures.
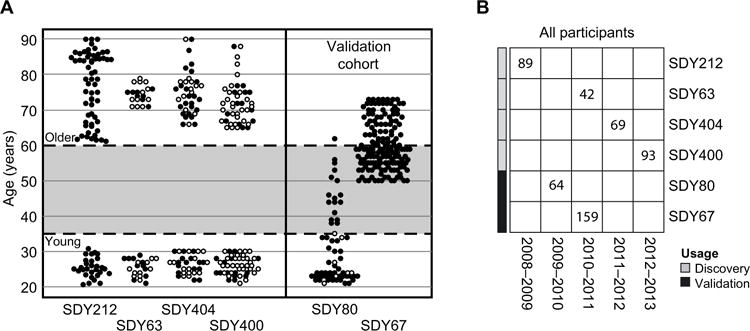
(A) The four discovery cohorts each included young and older participants. Age cutoffs are indicated by the dashed horizontal lines. In several studies, gene expression data were collected for a subset of individuals (filled circles) enriched for high and low responders, as previously described (5). Two cohorts were used to independently validate the young and older response signatures. (B) The discovery and validation cohorts spanned five vaccination seasons. Numbers indicate the total count of participants in each study. The number of participants who met the age range criteria used for the young and older groups and the subset used in the transcriptional profiling analysis are shown in fig. S1.
Categorization of individual influenza vaccination responses
Vaccination responses were quantified for each individual within each cohort using the “adjusted maximum fold change” (adjMFC) metric (7, 11). This metric reflects the vaccination-induced increase in antibody titers adjusted for differences in the prevaccination titers and was adopted as the primary end point because this measure (i) mitigates the effect of prevaccination serology on the predictive signatures given that baseline titers tend to correlate negatively with the fold change in titers after vaccination (Fig. 3A) (11), (ii) uses the maximum response across all viral strains given that none of the gene expression measurements we assessed reflected specificity to any of the individual influenza strains in the vaccine, and (iii) reflects the relative response among individuals instead of treating the titer values and their fold changes as absolute measurements and thus can potentially mitigate the effect of noise in titer measurements (25). Further details about the adjMFC calculation can be found in Methods and in (7, 11).
Fig. 3. The adjMFC end point is independent of baseline titers.
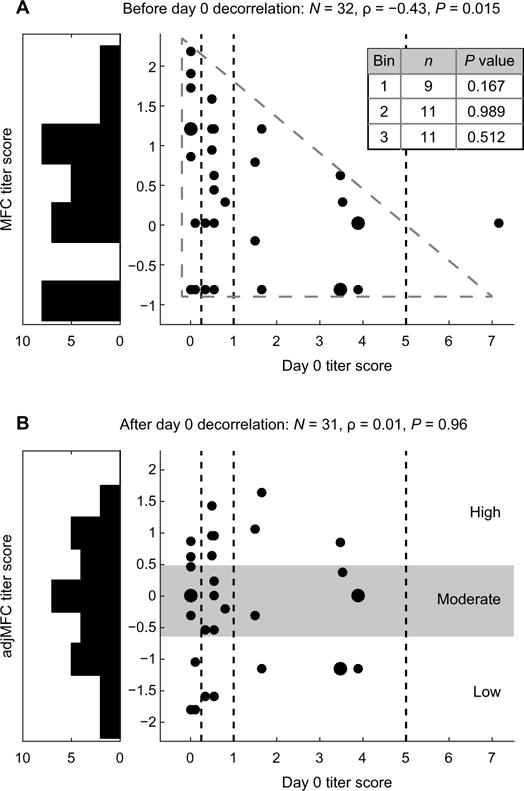
An illustration of our approach for computing adjMFC. The relationship between baseline titers and (A) MFC or (B) adjMFC in SDY404. Vertical lines separate the bins used for standardization, and the inset table indicates the P value resulting from the test for correlation. Correlation strengths and P values shown were based on Spearman’s rank correlation. Note that in this example, an outlier with high day 0 titer was removed when computing the adjMFC (see Methods).
Given the bimodal age distribution across the discovery cohorts (Fig. 2A) and the previously published observation that both the antibody and transcriptional responses to vaccination have strong age dependencies (5, 26), we opted to divide each of the cohorts into young (35 years and below) and older (60 years and above) groups and analyzed them separately. This approach allowed us to uncover signatures beyond those driven by age, which was the focus of the original studies, as well as other existing studies (3, 5, 14). It allowed us to compare response signatures in young versus older adult participants, which is an important issue that has been largely unexplored. We thus computed the adjMFC metric separately for each of the young and older adult fractions within each cohort. As expected, the adjMFC metric was uncorrelated with the prevaccination antibody titers (Fig. 3B). Following Tsang et al. (7), the participants were then stratified into “low,” “moderate,” and “high” responder classes based on the percentile of each participant’s adjMFC value (see Methods). Thus, this discretized, relative response measure delineates lower responders versus higher responders, as opposed to the absolute seroconversion status based on a fold change cutoff (i.e., “nonresponders” versus “responders”). In total, the discovery cohorts contained 66 low, 53 moderate, and 57 high responders where transcriptional profiling data were also available for signature identification (fig. S1).
Identification of baseline gene and module signatures
To identify individual genes for which baseline expression levels were associated with influenza vaccination responses, we compared high responders with low responders in the discovery cohorts. We used a previously described computational framework for integrated multi-cohort analysis of gene expression profiles (4, 19, 20, 23) to analyze 32,034 total gene symbols measured across the discovery cohorts. The analysis of young adults identified nine genes (RAB24, GRB2, DPP3, ACTB, MVP, DPP7, ARPC4, PLEKHB2, and ARRB1) with significantly increased expression and six genes (PTPN22, PURA, SP4, CASP6, NUDCD2, and PPIB) with significantly reduced expression in high responders at a false discovery rate (FDR) of <10% (Fig. 4). Only one of these genes identified by the meta-analysis would have been identified using a single cohort (RAB24 in SDY212, FDR < 10%), which demonstrates the power of multicohort analysis in leveraging evidence across multiple studies to identify robust, differentially expressed genes. We observed similar trends for these 15 genes when comparing moderate responders versus low responders, although only PTPN22 reached statistical significance (fig. S2). No significant heterogeneity among studies was observed for any of these genes (P = 0.3 by Cochran’s Q). Among older adults, there were no genes that were significantly different between low and high responders, even considering a more lenient FDR of 20%. Despite the fact that gender differences are known to affect vaccine responses (3, 4, 6), we observed no significant gender association with these signature genes at baseline (P = 0.56). To assess the ability of these genes to predict the vaccination response of individuals, we defined a “response score” as the geometric mean of the nine genes with increased expression in high responders, similar to previous analyses (4, 19, 20). This score distinguished low and high responders with high accuracy in the discovery cohorts [area under the curve (AUC) = 83 to 100% for young adults, mean AUC = 92%, fig. S3A]. Furthermore, the response score was significantly correlated with adjMFC in the discovery cohorts (R = 0.55, P = 1.63 × 10−54). In contrast, an analogous response score calculated using only the genes with decreased expression in high responders had lower classification accuracy in the discovery cohorts (AUC = 80 to 96% for young adults, mean AUC = 87%, fig. S3B). Therefore, we chose to use only the overexpressed genes as our response score for validation. Overall, this analysis identified a small gene expression signature for which the prevaccination level was predictive of the vaccine-induced antibody response for younger adults.
Fig. 4. Identification of individual genes that predict vaccination response in young individuals.
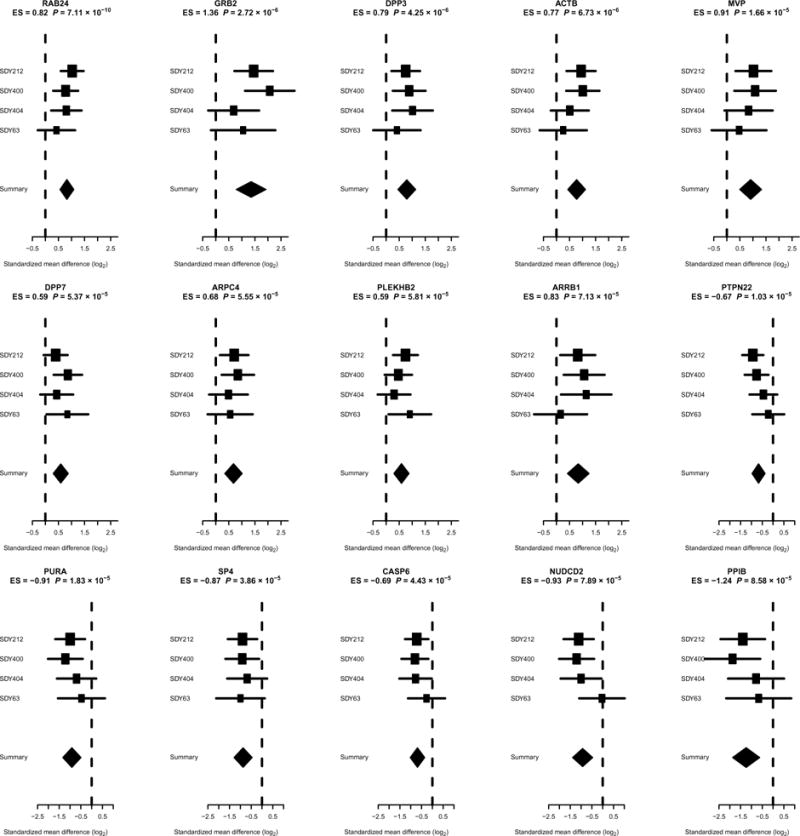
The x axes correspond to standardized mean difference, referred to as effect size (ES), between high and low responders, computed as Hedges’ g, in log2 scale. The size of the rectangles is inversely proportional to the standard error of mean (SEM) in the individual cohort. Whiskers represent the 95% confidence interval. The diamonds represent overall mean difference for a given gene with combined support across the discovery cohorts. The width of the diamonds represents the 95% confidence interval of overall mean difference.
We next sought to identify gene modules associated with the vaccination response using QuSAGE (24) on the discovery cohorts. QuSAGE quantifies gene module activity with a complete probability density function (PDF) and was designed to detect the perturbation of gene modules (i.e., coordinated, but potentially small, changes in sets of related genes). QuSAGE was originally designed to operate on a single study. To estimate a combined gene module activity for the four discovery cohorts, the QuSAGE PDFs computed for each data set were combined into one PDF for each gene module using numerical convolution (see Methods). QuSAGE analysis on blood transcription modules (BTMs) (27) identified 11 gene modules in young individuals that were significantly different between low and high responders (FDR ≤ 30% and P ≤ 0.01) (Fig. 5 and Table 1), including B cell receptor (BCR) signaling (M54) and the inflammatory response (M33). An equivalent analysis in older individuals did not detect any significant gene modules (FDR ≤ 30% and P ≤ 0.01). Even with the use of much less stringent criteria (FDR ≤ 50% and P ≤ 0.01), only two gene modules could be detected for older individuals (table S2). Overall, this analysis identified several gene modules for which activities before vaccination were associated with altered vaccination responses.
Fig. 5. Identification of gene modules that predict vaccination response in young or older individuals.
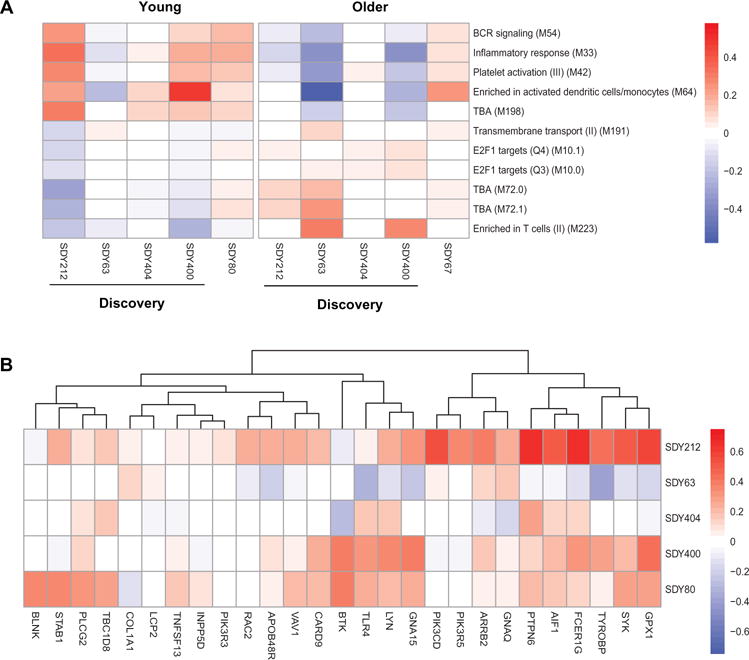
(A) The QuSAGE activity for all gene modules that were significantly different between low and high responders in the discovery cohorts. Red indicates increased average expression of genes in the module among high vaccine responders. (B) Individual genes that comprise the three gene modules that predict vaccination response and were validated in the validation cohort (FDR ≤ 10%) in young individuals. Colors indicate the log2 gene expression fold changes comparing high responders versus low responders, with red indicating increased expression among high vaccine responders.
Table 1. Validation of gene module activities that predict vaccination response in the discovery cohort for young adults.
Shaded modules were identified in the discovery cohorts and then independently validated (FDR ≤ 10% and P ≤ 0.01).
| Gene module | Discovery cohorts | Validation cohort | ||||
|---|---|---|---|---|---|---|
| P | FDR | Gene module activity | P | FDR | Gene module activity | |
| BCR signaling (M54) | 0.010 | 0.275 | 0.121 | 0.000 | 0.002 | 0.173 |
| Platelet activation (III) (M42) | 0.002 | 0.275 | 0.142 | 0.008 | 0.042 | 0.140 |
| Inflammatory response (M33) | 0.006 | 0.275 | 0.190 | 0.022 | 0.080 | 0.193 |
| Transmembrane transport (II) (M191) | 0.010 | 0.275 | −0.056 | 0.082 | 0.227 | −0.038 |
| TBA (M198) | 0.009 | 0.275 | 0.177 | 0.147 | 0.323 | 0.101 |
| TBA (M72.1) | 0.008 | 0.275 | −0.127 | 0.219 | 0.401 | 0.073 |
| TBA (M72.0) | 0.006 | 0.275 | −0.137 | 0.434 | 0.668 | 0.054 |
| E2F1 targets (Q4) (M10.1) | 0.003 | 0.275 | −0.072 | 0.486 | 0.668 | 0.035 |
| Enriched in T cells (II) (M223) | 0.002 | 0.275 | −0.162 | 0.577 | 0.684 | −0.057 |
| Enriched in activated dendritic cells/monocytes (M64) | 0.009 | 0.275 | 0.250 | 0.622 | 0.684 | 0.066 |
| E2F1 targets (Q3) (M10.0) | 0.007 | 0.275 | −0.051 | 0.908 | 0.908 | 0.005 |
Baseline signatures can predict vaccination response in young adults
To validate the gene and module signatures identified in the discovery cohorts, we tested them in independent cohorts. At the time this study was initiated, no additional large cohorts that included both young and older adults were available. Thus, we validated the young and older signatures using two different cohorts with comparable age distributions: Predictions based on the young discovery cohort were validated in SDY80, whereas predictions from the older discovery cohort were validated in SDY67.
Validation was carried out for the nine individual genes in young adults with significantly increased expression in high vaccine responders in the discovery cohorts. Because two genes (RAB24 and DPP3) were not measured in SDY80, the response score for validation in this case was composed of seven genes (GRB2, ACTB, MVP, DPP7, ARPC4, PLEKHB2, and ARRB1). Even with the use of this reduced signature, the response score showed a significant trend of increasing values when comparing low, moderate, and high responders (Fig. 6A, P = 0.02 using Jonckheere-Terpstra trend test) and was significantly correlated with the adjMFC in SDY80 (R = 0.44, P = 0.016). Further, the response score effectively distinguished low and high responders with high accuracy (AUC = 79%, P = 0.02 Fig. 6B). Low and moderate antibody responders could also be distinguished but with lower accuracy (AUC = 74%, P = 0.10; Fig. 6B), which is noteworthy because moderate responders were not included in the signature identification from the discovery cohort. However, high and moderate responders could not be distinguished (AUC = 62%, P = 0.27). Furthermore, four genes from the response signature were individually significantly more highly expressed when comparing high responders versus low responders in the validation cohort (GRB2, P = 0.036; ACTB, P = 0.002; MVP, P = 0.09; DPP7, P = 0.651; ARPC4, P = 0.031; PLEKHB2, P = 0.154; ARRB1, P = 0.027). In addition to the baseline time point (taken immediately before vaccination), the validation study included several additional time points where transcriptional profiling was carried out, including 7 days before vaccination, as well as 1, 7, and 70 days after vaccination. Consistent with the baseline analysis, we found a marginally significant difference in the response scores between low and high responders 1 week before vaccination (P = 0.06) and a significant difference at 70 days after vaccination (P = 0.05). However, the vaccination response appeared to transiently modulate these signature genes. We observed a significant increase in the response score when comparing baseline to day 1 after vaccination (Fig. 6C, P = 0.01), and there was no significant difference between low and high responders at day 1 or 7 after vaccination (day 1, P = 0.21; day 7, P = 0.37). No significant genes were identified in older adults in the discovery cohorts; thus, no additional validation of individual genes was carried out. Overall, these results identify a prevaccination gene expression signature in young adults predictive of the antibody response. This signature was also modulated by vaccination as evidenced by significant changes after vaccination.
Fig. 6. Validation of gene expression signature as a baseline predictor of the influenza vaccination response in young individuals.
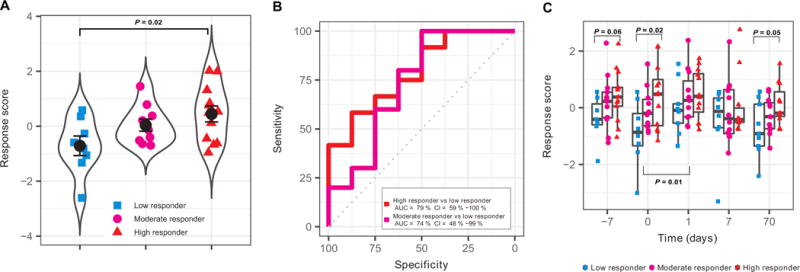
(A) The geometric mean of GRB2, ACTB, MVP, DPP7, ARPC4, PLEKHB2, and ARRB1 z-scored expression values (response score) was calculated for low, moderate, and high responders in the validation cohort (SDY80). (B) ROC curve for classifiers designed to separate individual participants as high responders versus low responders or moderate responders versus low responders in the validation cohort (SDY80). CI, confidence interval. (C) Temporal behavior of response score in the validation cohort (SDY80) for low, moderate, and high responders. Each point depicts an individual participant, and each point group is summarized by a boxplot. Significant P values are indicated above the data for comparisons of low and high responders and below the data for comparison between baseline and day 1 after vaccination.
We also carried out a validation of the gene module signatures identified in the discovery cohorts. Of the 11 gene modules associated with vaccination response in young adults, 3 were also significant in the validation cohort (FDR ≤ 10%). These included BCR signaling (M54) (Fig. 7), platelet activation (III) (M42) (fig. S4), and inflammatory response (M33) (fig. S5). Gene module activity of all three gene modules was higher in high responders in both the combined discovery and validation cohorts. If we included an additional restriction of P ≤ 0.01 (as was used in the discovery cohort analysis), then only two modules, BCR signaling (M54) and platelet activation (III) (M42), were significant. We observed that the individual genes within these signature modules tended to display a consistent pattern of association with vaccination response in each of the cohorts (Fig. 5B). Like the case for the individual gene signature, the gene modules were significantly different between low and high responders at most time points in the validation cohort (Fig. 7C and figs. 4C and 5C). This included both baseline and day 70 after vaccination for all three modules, suggesting that they were temporally stable over a course of more than 2 months. However, the vaccination response appeared to transiently modulate some of these modules. We observed significant increases in the activity of the inflammatory response (M33) and platelet activation (III) (M42) and a significant decrease in the activity of BCR signaling (M54), when comparing baseline to day 1 after vaccination (fig. S5C). Neither of the two gene modules identified in older adults was associated with vaccination response in the older validation cohort (table S2). These results show that there exist temporally stable, prevaccination states of the immune system that are significantly associated with the antibody response in young participants (7).
Fig. 7. Baseline activity of the BCR signaling gene module (M54) is associated with influenza vaccination responses in young individuals.
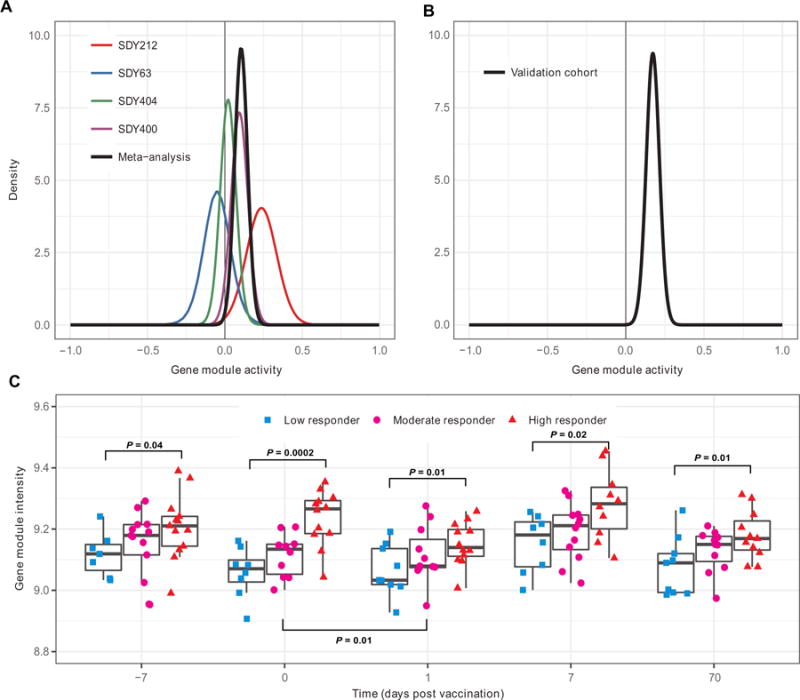
QuSAGE was used to calculate the PDF for the gene module activity using baseline data in the (A) discovery cohorts (SDY63, SDY404, SDY400, SDY212, and the combination) and (B) validation cohort (SDY80). (C) Temporal behavior of gene module in the validation cohort (SDY80) for low, moderate, and high responders. Each point depicts an individual participant, and each point group is summarized by a boxplot. Significant P values are indicated above the data for comparisons of low and high responders and below the data for comparison between baseline and day 1 after vaccination.
These analyses used the set of BTMs that are based on correlated expression patterns identified in diverse public data sets (27). To determine whether the biological functions implied by these modules were robustly correlated with vaccination response, we identified related modules from other sources. Specifically, we identified 24 modules related to inflammation, B cells or platelets from the Kyoto Encyclopedia of Genes and Genomes (KEGG) (28), Reactome (29), and the modules used in Obermoser et al. (16) (table S3). In support of the BTM analysis, we found that 13 of these modules were significantly different between high and low responders in a QuSAGE meta-analysis including both the discovery and validation cohorts (FDR ≤ 5%). Most of the modules that were not significantly different were related to platelets, and the identification of this module (M42) in the BTM analysis (Table 1) may have been due to its high overlap with the BCR signaling (M54) module (5 of the 10 genes in M42 overlap with M54 in the BTM definition). These results implicate the prevaccination status of B cell signaling and inflammation as important indicators of immune state that influence the vaccination response.
Baseline signatures remain predictive after correcting for major cell subset frequencies
The transcriptional profiling data used to identify these signatures were obtained from PBMCs or whole blood and thus can reflect both changes in cell subset proportions, as well as differences in gene expression state (30, 31). To test whether the signatures we found were simply capturing differences in cell subset frequencies, we used regression to adjust the young validation cohort data for variation in major cell subset proportions (B cells, monocytes, and CD4 and CD8 T cells measured by flow cytometry) that were measured on the same samples (see Methods). Although classification performance was decreased after this adjustment (high versus low AUC = 68%, moderate versus low AUC = 75%), the gene expression signature retained modest predictive power, suggesting that the performance cannot be attributed solely to differences in cell subset composition (fig. S6, A and B). The response score calculated on the adjusted data was not correlated with the nonadjusted data (r = −0.02). Inspection of the individual genes composing the response score showed that the predictive signal was almost entirely due to ACTB in the adjusted data. Two of the gene modules [BCR signaling (M54) and platelet activation (III) (M42)] also remained significant after correcting for major cell subset frequencies (with similar P values to the nonadjusted analysis), whereas the P value for the inflammatory response (M33) module increased from 0.02 to 0.11. Overall, these results suggest that the signatures reflect biological phenomena that are, at least in part, independent of major cell subset variation.
Inverse correlation between young and older individuals
Because our analysis of the vaccination response in older adults failed to identify any prevaccination signature that could be validated in an independent cohort, we sought to determine how the signature genes and modules identified in young individuals behaved in older adults. To do this, we correlated signature gene and module effect sizes between young and older individuals across all discovery cohorts and found that they generally exhibited opposite trends in these two age groups (Fig. 8). For instance, although the expression of the nine signature genes was significantly increased in high vaccine responders among young adults, their expression was decreased in high vaccine responders among older adults (Fig. 8A). A similar pattern was observed for signature gene modules (Fig. 8B). To determine whether this inverse relationship was restricted only to the signatures, we determined the individual gene and module effect sizes for all measured genes and BTMs. We observed a strong negative correlation between the effect sizes in young and older adults for both the individual genes (R = −0.28 and P = 2.2 × 10⁻¹⁶) and the modules (R = −0.65 and P = 2.2 × 10⁻¹⁶). This negative correlation was observed both for the summary effect sizes (calculated across the discovery cohorts, Fig. 8) and for the effect sizes in multiple individual discovery cohorts. These observations suggest that immune states that are good for the vaccination response in young individuals may actually be detrimental to the response in older individuals.
Fig. 8. Inverse correlation of baseline differences between young and older participants.
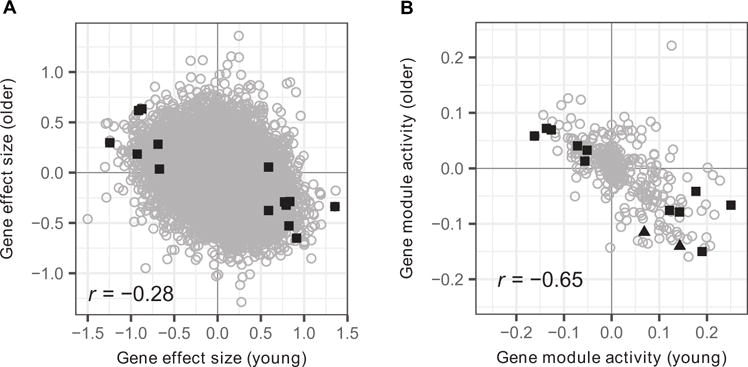
(A) Gene effect sizes and (B) module activities comparing high and low responders were calculated in young and older individuals. All values were calculated using data from the discovery cohorts. (A) Significant genes for young (squares) individuals in the discovery cohorts are highlighted in black. (B) Significant modules for young (squares) and older (triangles) individuals in the discovery cohorts are highlighted in black.
DISCUSSION
The move toward precision medicine has underscored the importance of understanding whether and how information on an individual’s immune states can help predict disease progression and treatment outcomes (11, 32). Influenza vaccination provides a model perturbation to study this issue in the context of assessing immune response quality. Healthy individuals given the influenza vaccine exhibit a wide variation in the extent of the induced antibody response. We identified and validated baseline (i.e., before vaccination) gene and module-based signatures that are associated with the vaccine-induced antibody response.
Signature validation using independent cohorts is critical, because genes associated with an outcome in one study may fail to be significantly associated with that same outcome in other studies. This lack of reproducibility may have several underlying causes. First, if the studies involve a small number of individuals or geographic sites, then random fluctuations or confounding factors may lead to spurious associations. Second, when large numbers of potential predictors are tested (e.g., the expression of every gene in the genome), a failure to properly account for statistical issues involved in multiple testing and overfitting may lead to poor specificity. Last, it is well-known that experimental measurements are subject to batch effects (33), and failure to account for these differences may hinder comparisons across studies. Although multiple studies have suggested postvaccination transcriptional signatures that are associated with titer responses to influenza vaccination (5, 12, 15, 34, 35), only a few have identified baseline signatures that are significantly associated with the antibody response (3, 7, 13, 14), and none of these baseline signatures were found and then further validated using independent cohorts. Furman et al. (14) analyzed a cohort of 91 individuals (SDY212) and identified an age- and apoptosis-related gene module that was correlated with the hemagglutination inhibition assay (HAI) response. In a separate study of the same cohort, Furman et al. (3) identified a gene module enriched for lipid biosynthesis (also containing many genes modulated by testosterone) that was associated with sex and testosterone-dependent differences in the antibody response. Nakaya et al. (13) identified several gene modules for which expression was correlated with antibody response in multiple cohorts, but this result has not yet been validated in independent cohorts. Tsang et al. (7) found that baseline transcripts robustly correlated with antibody responses were enriched for functions such as pattern recognition and interferon signaling, but baseline predictive models (as assessed by cross-validation analysis of the same cohort, SDY80) involving transcripts alone could not be built. Instead, they were able to build machine-learning models predictive of the antibody response (as reflected by the adjMFC metric) independent of age and gender by using the frequency of a few temporally stable cell populations from the baseline. Thus, our current study is distinct in identifying baseline transcriptional signatures associated with antibody responses after influenza vaccination in young adults and subsequently validating these signatures using an independent cohort.
In the analysis presented here, we attempted to identify robust signatures through several means. First, the six studies (four discovery and two validation) used were highly diverse and heterogeneous. They included data from multiple geographic areas (including California, Connecticut, Maryland, and Minnesota) using vaccines from different manufacturers, across multiple influenza vaccination seasons, and profiled different types of biological samples (PBMCs and whole blood) using multiple experimental platforms [such as Illumina and Affymetrix microarrays, and RNA sequencing (RNA-seq)]. Second, the data were strictly separated into discovery and validation cohorts, which were drawn from independent studies at different institutions. The choice of which studies to include and their designation as discovery or validation were made before the initiation of the analysis. Despite the presence of biological and technological heterogeneity, by integrating the discovery data sets and then validating in independent data, we demonstrated the robustness of the baseline transcriptional signatures that were associated with antibody responses to vaccination. Although the effect sizes we detected in individual cohorts were high, they were not statistically significant in any of the discovery cohorts due to high variance among participants within individual cohorts. Hence, despite their high effect size, these genes (with the exception of RAB24 in SDY212) would not have been found without integration of data across multiple independent cohorts. Overall, our analysis revealed temporally stable baseline signatures both at the gene expression and at the module level, as was observed in previously identified baseline predictive signatures involving peripheral immune cell subset frequencies (7). Such stable signatures are particularly attractive biomarkers for potential clinical use because they are robust to the timing of measurement and potentially reflect the inherent biological state of individuals (11).
In addition to recapitulating many known findings, the signatures identified by our analysis revealed the involvement of previously unreported genes and pathways. RAB24 is a small Ras-like guanosine triphosphatase that regulates protein trafficking and mediates autophagy (36). Autophagy is important for antiviral innate immunity, antigen presentation, and cytokine secretion. Although not directly implicated in viral responses, the RAB family of proteins has been extensively studied in the context of trafficking in immune cells, especially dendritic cells and macrophages (37). GRB2 is an adaptor protein with involvement in BCR signaling (38, 39). It has been implicated in mediating viral entry in retroviruses (40) and has also been associated with chronic leukemia, breast cancer, and Wiskott-Aldrich syndrome, a condition characterized by severe immunodeficiency and inability to clot (41). DPP3 is a metallopeptidase that is essential for the intracellular replication of the influenza virus and inhibits proapoptotic genes while promoting inflammation (42). The role of DPP3 in inflammation is consistent with our implication of the inflammatory response module in the vaccination response. Previous studies have also suggested the involvement of proapoptotic (14) and inflammation-related (13) genes with vaccine response but with an inverse relationship to that found here. It is possible that this discrepancy is caused by the inclusion of older patients in these previous studies, which we have shown to be inversely correlated with younger participants at the gene level. DPP3 is expressed in many types of immune cells, although its function in these contexts has not been described in detail (43, 44). In neutrophils, it may be involved in regulating inflammation in peripheral tissue (45). DPP7, another member of the metallopeptidase family of DPP3 (46), has been shown to exhibit similar anti-apoptotic functions in lymphocytes (47). ACTB, the gene encoding for β-actin, is a pivotal component of the cell cytoskeleton and is necessary for viral cell interactions and endocytosis across many different types of viruses (48–51). ARPC4 is a subunit of the human Arp2/3 complex, which is responsible for actin polymerization (52) and further supports the role of β-actin in promoting response to vaccine. Increased levels of these actin-associated genes can affect cell motility and may help promote antigen presentation in response to the vaccine. ARRB1 is a member of the arrestin/β-arrestin protein family expressed at high levels in peripheral blood leukocytes and implicated in regulating receptor-mediated immunological activity (53). It is also an essential gene for Marburg virus infection (54) and is further involved in dendritic cell activation and maturation in response to HIV virus-like particles (55). PLEKHB2 is involved in retrograde transport of recycling endosomes (56), a pathway exploited by many viruses throughout their life cycle (57) that may also be relevant to cross-presentation in the context of a vaccine response (58). Last, MVP is the major subunit of the vault complex, a multiprotein structure involved in nucleocytoplasmic transport. It is induced by double-stranded RNA and virus infection and is essential for the induction of interleukin-6 (IL-6) and IL-8, suggesting an important role in host proinflammatory response (59). High expression of MVP has been shown to suppress viral replication by inducing a type 1 interferon response through nuclear factor κB, establishing a further link with the inflammatory component identified in the module analysis (60). The implication of the B cell signaling module is broadly consistent with the findings of Tsang et al. (7), who identified predictive populations before vaccination that included CD20+ transitional and memory B cells that express CD38. Together, the implication of B cell signaling and inflammatory response modules suggests that overall immune status at the time of vaccination can influence the course of the vaccine response. Collectively, these findings support the idea of an active basal immunological state that can enhance antigen presentation and inflammatory response, hence resulting in a more effective vaccine response. Further studies are needed to determine whether these signatures are associated specifically with influenza vaccination or rather reflect vaccination responses in general.
The cohorts analyzed in this study included both young and older individuals, which were analyzed separately based on the observation that these groups display qualitatively different antibody and transcriptional responses to influenza vaccination. Our own analysis of the combined age groups in the discovery cohort found that the response was dominated by the young adults, and the older cohort did not provide additional insights. Although the number of individuals was similar in both age groups, significant gene and pathway signatures could only be validated for young individuals. Our superior performance in the young may be expected because of the increased heterogeneity in older adults given the presence of age-related diseases and a larger age span. Surprisingly, we found that the effect sizes of these genes were negatively correlated in young and older individuals. That is, genes that were positively associated with higher vaccination responses in young individuals tended to be negatively associated with higher vaccination responses in older individuals. Thus, increased expression levels of our gene signature before vaccination were associated with better antibody responses in the young but were inversely correlated with those in older individuals (Fig. 8). The same negative correlation was observed for gene modules. For example, although the presence of an inflammatory gene signature was associated with an improved vaccination response in young individuals, it was associated with a worse response in older individuals. There are many potential explanations for this observation, including differences in cell composition, cell activation state, the extent of chronic inflammation in older individuals, the possibility of intrinsic differences in vaccination responses of young and older adults, and the observed age-related change in transcriptional noise and cell-to-cell protein expression variation in immune cells (61–63). The underlying reason for this inverse relationship is unclear and warrants further study.
There are several potential limitations of the current study. Although the results are based on multiple independent studies, the validation of the young and older signatures was each based on a single independent cohort, and it will be important to further confirm these observations in additional studies. The integration of additional studies will also provide increased power to detect subtle differences in immune state that are associated with vaccination responses. Lack of power may be one explanation for why the current analysis failed to identify validated signatures in older adults. The failure to validate signatures identified in older adults may also be due to the fact that the average age of the validation cohort was substantially lower than that of the discovery cohort. Another concern relates to the influence of differences in cell subset frequencies. The transcriptional profiling data analyzed here were based on PBMCs and whole blood and thus reflect a mix of cell types. We used deconvolution analysis to confirm that the signatures we identified did not simply reflect variations in frequencies of major cell subsets. However, because of sample size limitations, the adjustment included only four major cell subsets (B cells, monocytes, and CD4 and CD8 T cells) and did not include potential effects conferred by cell subsets that lie deeper in the hematopoietic hierarchy.
In summary, we have integrated data from the HIPC and the CHI to conduct a multicohort analysis to identify baseline (i.e., before vaccination) predictive transcriptional signatures of influenza vaccination responses, and the effects of these signatures were inversely correlated between young and older individuals. In addition to potentially enabling the prediction of antibody responses before vaccination in the clinic and in vaccine trials, these results provide hypotheses on potential biological mechanisms underlying successful influenza vaccination responses and how these mechanisms could change with age. More broadly, the discovery of baseline signatures offers the possibility of modulating an individual’s immune state before vaccination to improve the resulting antibody response. All of the data used in this study are available from ImmPort and ImmuneSpace.
METHODS
Influenza vaccination response cohorts and data
All participants received injectable trivalent influenza vaccine. Raw and processed data are available from ImmuneSpace (https://immunespace.org), and data can also be obtained from ImmPort (http://immport.org). The discovery cohorts are identified by ImmPort study numbers SDY63, SDY400, SDY404, and SDY212. The validation cohorts are SDY80 and SDY67. To match the age composition of the discovery cohorts, we only included individuals below 35 or above 60 years of age in the analysis of the validation cohorts. The SDY212 data set was derived from whole blood, whereas all others were derived from PBMC samples. Transcriptional profiling of SDY63, SDY404, and SDY400 used HumanHT-12 V4.0 expression beadchip (Illumina), whereas SDY212 was performed on HumanHT-12 V3.0 expression beadchip (Illumina). Illumina data from the above four studies were log-transformed and quantile-normalized using the Lumi package in R. The microarray data from SDY80 was run on HuGene-1_0-st array (Affymetrix) and normalized by robust multichip average. SDY67 was an RNA-seq study run on HiSeq 2000 (Illumina), and read count data were summarized by gene and normalized using DESeq (64). The transcriptional profiling data from SDY67 were obtained in two experimental batches, and only data from the larger batch were used in this study.
Identification of low, moderate, and high vaccine responders
We adopted the adjMFC metric used in a previous systems biology study of influenza vaccination [SDY80; see the extended experimental procedure of Tsang et al. (7) for details]. This metric was adopted for three main reasons. First, this measure mitigates the effect of prevaccination serology on the predictive signatures. This is important given that preexisting titers against influenza are highly prevalent, exhibit substantial variability across individuals, and are observed to correlate in a nonlinear manner with the fold change in titers after vaccination (Fig. 3A) (11). The adjMFC metric captures the response variability among individuals with similar preexisting titers and thus “decorrelates” the initial titers from the response based on fold change to enable the identification of predictive signatures independent of initial serology (7). Second, given that none of the gene expression measurements we assessed reflected specificity to any of the individual influenza strains that comprised the vaccines, using the maximum response across all viral strains, as captured by the adjMFC metric, is more appropriate and can potentially provide better sensitivity, compared with using the response to each strain individually (7, 12). Last, the adjMFC metric reflects the relative response across individuals instead of treating the titer values and their fold changes as absolute measurements and thus can potentially mitigate the effect of noise in titer measurements (25).
Here, we provide a concise description of how adjMFC was computed. Given that the vaccines used in our cohorts contained three to four strains (usually three, but in the 2009 season, the seasonal strains were supplemented with an additional pandemic H1N1 strain), we quantitated both preexisting (baseline) and response serology by computing the maximum across all strains. Titer calculations were performed separately for each cohort and age group (young and older; see above). Titers were measured at days 0 and 28 by HAI for all studies except SDY80, which used virus neutralization assay (VNA) at days 0 and 70. A titer of half the first dilution was assigned to samples in which the first dilution was negative except for SDY404, for which the first dilution (1:8) was reported. In all studies, the largest dilution was reported if the largest dilution was positive. To help ensure that baseline titers and response fold changes of individual strains were comparable, so that the maximum is meaningful, we standardized titers for each strain at baseline (day 0) by subtracting the median and then scaling by the SD. We then defined the baseline (relative) titer for each individual as the maximum across standardized baseline values for all strains. Similarly, we used the same approach to standardize the titer response fold change (usually day 28 over day 0) and called these the MFC. In addition, we applied the inverse normal transformation to the MFC values to avoid extreme skews in the distribution. We next plotted baseline and MFC, and as previously observed, we saw a strong nonlinear inverse correlation between them in all of our data sets. To compute adjMFC (i.e., removing the nonlinear correlations), we binned the individuals based on their baseline titer so that the correlation between baseline and response titers within each bin was not statistically significant, and at the same time, we tried to keep the number of bins as low as possible so that each bin would have a reasonable number of individuals for decorrelation. Typically, two to three bins were used. In some of our cohorts, there were a few outlier individuals with extremely high baseline titers and correspondingly small response fold changes; they were removed from further analysis. For each bin, we computed the decor-related responses (adjMFC) by standardizing the MFC values within each bin, that is, subtracting the median and scaling by the SD. Last, individuals within each cohort were defined as low, moderate, and high responders using percentile cutoffs (7). To accommodate the relatively small number of individuals in some of the cohorts, we defined low, moderate, and high responders as those whose adjMFC was lower than the 30th percentile value, between the 30th and the 70th percentile values, and above the 70th percentile value, respectively. After applying the decorrelation procedure, we also performed a number of diagnostic checks to ensure that our approach had achieved the desired effects. Specifically, we confirmed the following: (i) The correlation between baseline titer and the adjMFC was removed on the basis of the Spearman rank correlation; (ii) at the individual strain level, the correlation between the baseline titer and the response fold change was statistically insignificant (i.e., before aggregation of the individual titer per strain via computing the maximum); (iii) the identity of the strain that contributed to the baseline (or response fold change) maximum did not correlate with adjMFC. In all of the above checks, two variables were considered not correlated if the Spearman correlation P value was greater than 0.1.
Integrated multicohort analysis
Gene expression data sets were analyzed using a computational framework for integrated multicohort analysis (17, 20, 23). Briefly, for each gene expression data set used as a discovery cohort, we labeled samples either as a case or as a control and then computed a Hedges’ g effect size for each gene in each data set. The individual effect sizes were then integrated into a single summary effect size per gene across all discovery data sets. Significant genes were then identified using z statistics, and P values were corrected for multiple hypothesis testing using Benjamini-Hochberg FDR correction. We generated a response score from signature genes by computing the geometric mean of the expression of the individual genes within a given individual. We then estimated the response score accuracy in discriminating high and low responders by generating a receiver operating characteristic (ROC) curve and computing the AUC. A t test was carried out to compare response scores between low and high responders at various post-vaccination time points in the validation cohort (SDY80).
Gene module analysis
The set of 346 BTMs were obtained from (27). Gene module activity was calculated using QuSAGE version 2.0.0 (24). The activity of each gene module (comparing high vaccine responders versus lower vaccine responders) was first quantified independently for each of the discovery cohorts using QuSAGE to produce a PDF. A meta-analysis was then carried out by combining the activity PDFs generated for each of the discovery cohorts into a single PDF using numerical convolution. The sizes of each cohort were used as weight factors during numeric convolution. P values for each gene module were calculated by testing whether the activity was different from zero using a two-sided test. Gene modules associated with influenza vaccination response were detected by P ≤ 0.01 and FDR ≤ 0.3. To identify related gene modules from KEGG (28) and Reactome (29) and the modules defined in Obermoser et al. (16), we used regular expressions to extract gene modules containing the keywords “inflamm,” “b[_]*cell,” and “platelet.”
Correction for cell proportion variations
Flow cytometry measurements for the validation cohort (SDY80) were obtained from http://chi.nhlbi.nih.gov/DATA/chi/09-H-0239/flow. The transcriptional profiles associated with this cohort were then adjusted for variation in four major cell subset proportions (B cells, monocytes, and CD4 and CD8 T cells) using the flow cytometry data expressed as percentage of total PBMCs. For each gene separately, we fit a linear model with intercept (using the R function lm) on the normalized non–log-transformed data, including proportions as covariates. The complete adjusted transcriptional profiling data were then computed as the sum of the intercept coefficient and the residuals, and back log2–transformed.
Availability of data in ImmPort and ImmuneSpace
The data used in this study were generated by HIPC and CHI, a National Institutes of Health intramural affiliate of HIPC. The HIPC program is a major collaborative effort that is generating large amounts of human immune profiling data—including high-dimensional data— to characterize the status of the immune system in diverse populations under both normal conditions and in response to stimuli (e.g., vaccination). Data management is an integral part of the program, and to address the issues involved with integrating and disseminating such data, HIPC has developed ImmuneSpace (https://immunespace.org), a high-quality public web interface to HIPC data. ImmuneSpace facilitates retrieval, exploration, and comparison of data across independent studies. To support the wide range of immunological experiments being carried out, HIPC is taking advantage of the considerable infrastructure already developed as part of the National Institute of Allergy and Infectious Diseases (NIAID) Immunology Database and Analysis Portal (ImmPort) system (https://immport.niaid.nih.gov), which serves as a repository of data generated by investigators funded by the NIAID Division of Allergy, Immunology, and Transplantation. Data from ImmPort are automatically loaded into ImmuneSpace and joined with basic metadata (e.g., cohort membership and treatment information) to facilitate data exploration, visualization, and analyses. ImmuneSpace also provides additional standardization to facilitate data integration. For example, gene expression data in ImmuneSpace are preprocessed using standardized pipelines ensuring that the same normalization is used, gene names are consistent, etc. ImmuneSpace also provides a “Data Finder” interface for filtering participants across assays and studies based on a set of predefined study and assay variables, making it easy to browse and search extremely large combined data sets from dozens of studies and tens of thousands of participants. An R package (ImmuneSpaceR) is also available to facilitate programmatic access to data. Using these interfaces, the studies included in the analysis presented here can easily be identified, combined, and explored to gain further insights. For details, please see https://immunespace.org/IS1.url.
Supplementary Material
Fig. S1. Distribution of low (blue), moderate (purple), and high (red) responders in the discovery and validation cohorts.
Fig. S2. Genes that predict vaccination response in young individuals when comparing moderate responders versus low responders.
Fig. S3. Performance of genes significantly different in young high versus low responders.
Fig. S4. Baseline activity of the platelet activation (III) (M42) gene module is associated with influenza vaccination responses in young individuals.
Fig. S5. Baseline activity of the inflammatory response (M33) gene module is associated with influenza vaccination responses in young individuals.
Fig. S6. Validation of GRB2, ACTB, MVP, DPP7, ARPC4, PLEKHB2, and ARRB1 as predictors of influenza vaccination response in the validation cohort (SDY80) after correction for cell subset proportions.
Table S1. Characteristics of the discovery and validation cohorts for young and older participants.
Table S2. Gene module activities that are associated with vaccination response in the discovery cohorts for older participants.
Table S3. Validation of gene modules that are associated with vaccination response in KEGG and Reactome and the modules defined in Obermoser et al. for young participants.
Acknowledgments
We thank J. Wiser, P. Dunn, and the rest of the Bioinformatics Integration Support Contract team for their work on data curation and management associated with ImmPort.
Funding: This work was funded by the NIH/NIAID HIPC through grants U19AI089987, U19AI090019, U19AI089992, U01AI089859, U19AI090023, U01AI090043, and U19AI089986 and the Intramural Programs of the following institutes that fund the CHI: NIAID; the National Cancer Institute; the National Heart, Lung, and Blood Institute; the National Institute of Arthritis and Musculoskeletal and Skin Diseases; the National Institute of Child Health and Human Development; the National Institute of Diabetes and Digestive and Kidney Diseases; the National Institute of Neurological Disorders and Stroke; the National Institute of Environmental Health Sciences; the National Eye Institute; the National Institute on Aging; the National Human Genome Research Institute; and the U.S. Food and Drug Administration.
Footnotes
SUPPLEMENTARY MATERIALS
immunology.sciencemag.org/cgi/content/full/2/14/eaal4656/DC1
Author contributions: Study conception and design: R.G., P.K., S.H.K., S.S.S.-O., and J.S.T. Acquisition of data: HIPC-I Consortium and CHI. Analysis of data: S.A., F.C., D.F., J.F., R.G., E.H., Y.K., H.M., R.S., and F.V. Interpretation of data: HIPC-CHI Signatures Project Team. Drafting of manuscript: S.A., R.G., P.K., S.H.K., Y.K., H.M., S.S.S.-O., J.S.T., and F.V. All authors read and approved the final version of the manuscript.
Competing interests: R.B.K. has received funding from Merck Research Laboratories to study waning immunity to mumps vaccine. R.B.K. holds a patent related to vaccinia virus peptide research. All other authors declare that they have no competing interests.
REFERENCES AND NOTES
- 1.Osterholm MT, Kelley NS, Sommer A, Belongia EA. Efficacy and effectiveness of influenza vaccines: A systematic review and meta-analysis. Lancet Infect Dis. 2012;12:36–44. doi: 10.1016/S1473-3099(11)70295-X. [DOI] [PubMed] [Google Scholar]
- 2.Goodwin K, Viboud C, Simonsen L. Antibody response to influenza vaccination in the elderly: A quantitative review. Vaccine. 2006;24:1159–1169. doi: 10.1016/j.vaccine.2005.08.105. [DOI] [PubMed] [Google Scholar]
- 3.Furman D, Hejblum BP, Simon N, Jojic V, Dekker CL, Thiebaut R, Tibshirani RJ, Davis MM. Systems analysis of sex differences reveals an immunosuppressive role for testosterone in the response to influenza vaccination. Proc Natl Acad Sci USA. 2014;111:869–874. doi: 10.1073/pnas.1321060111. [DOI] [PMC free article] [PubMed] [Google Scholar]
- 4.Andres-Terre M, McGuire HM, Pouliot Y, Bongen E, Sweeney TE, Tato CM, Khatri P. Integrated, multi-cohort analysis identifies conserved transcriptional signatures across multiple respiratory viruses. Immunity. 2015;43:1199–1211. doi: 10.1016/j.immuni.2015.11.003. [DOI] [PMC free article] [PubMed] [Google Scholar]
- 5.Thakar J, Mohanty S, West AP, Joshi SR, Ueda I, Wilson J, Meng H, Blevins TP, Tsang S, Trentalange M, Siconolfi B, Park K, Gill TM, Belshe RB, Kaech SM, Shadel GS, Kleinstein SH, Shaw AC. Aging-dependent alterations in gene expression and a mitochondrial signature of responsiveness to human influenza vaccination. Aging. 2015;7:38–52. doi: 10.18632/aging.100720. [DOI] [PMC free article] [PubMed] [Google Scholar]
- 6.Klein SL, Jedlicka A, Pekosz A. The Xs and Y of immune responses to viral vaccines. Lancet Infect Dis. 2010;10:338–349. doi: 10.1016/S1473-3099(10)70049-9. [DOI] [PMC free article] [PubMed] [Google Scholar]
- 7.Tsang JS, Schwartzberg PL, Kotliarov Y, Biancotto A, Xie Z, Germain RN, Wang E, Olnes MJ, Narayanan M, Golding H, Moir S, Dickler HB, Perl S, Cheung F. Global analyses of human immune variation reveal baseline predictors of postvaccination responses. Cell. 2014;157:499–513. doi: 10.1016/j.cell.2014.03.031. [DOI] [PMC free article] [PubMed] [Google Scholar]
- 8.Roederer M, Quaye L, Mangino M, Beddall MH, Mahnke Y, Chattopadhyay P, Tosi I, Napolitano L, Terranova Barberio M, Menni C, Villanova F, Di Meglio P, Spector TD, Nestle FO. The genetic architecture of the human immune system: A bioresource for autoimmunity and disease pathogenesis. Cell. 2015;161:387–403. doi: 10.1016/j.cell.2015.02.046. [DOI] [PMC free article] [PubMed] [Google Scholar]
- 9.Orrù V, Steri M, Sole G, Sidore C, Virdis F, Dei M, Lai S, Zoledziewska M, Busonero F, Mulas A, Floris M, Mentzen WI, Urru SA, Olla S, Marongiu M, Piras MG, Lobina M, Maschio A, Pitzalis M, Urru MF, Marcelli M, Cusano R, Deidda F, Serra V, Oppo M, Pilu R, Reinier F, Berutti R, Pireddu L, Zara I, Porcu E, Kwong A, Brennan C, Tarrier B, Lyons R, Kang HM, Uzzau S, Atzeni R, Valentini M, Firinu D, Leoni L, Rotta G, Naitza S, Angius A, Congia M, Whalen MB, Jones CM, Schlessinger D, Abecasis GR, Fiorillo E, Sanna S, Cucca F. Genetic variants regulating immune cell levels in health and disease. Cell. 2013;155:242–256. doi: 10.1016/j.cell.2013.08.041. [DOI] [PMC free article] [PubMed] [Google Scholar]
- 10.Brodin P, Jojic V, Gao T, Bhattacharya S, Angel CJ, Furman D, Shen-Orr S, Dekker CL, Swan GE, Butte AJ, Maecker HT, Davis MM. Variation in the human immune system is largely driven by non-heritable influences. Cell. 2015;160:37–47. doi: 10.1016/j.cell.2014.12.020. [DOI] [PMC free article] [PubMed] [Google Scholar]
- 11.Tsang JS. Utilizing population variation, vaccination, and systems biology to study human immunology. Trends Immunol. 2015;36:479–493. doi: 10.1016/j.it.2015.06.005. [DOI] [PMC free article] [PubMed] [Google Scholar]
- 12.Nakaya HI, Wrammert J, Lee EK, Racioppi L, Marie-Kunze S, Haining WN, Means AR, Kasturi SP, Khan N, Li G-M, McCausland M, Kanchan V, Kokko KE, Li S, Elbein R, Mehta AK, Aderem A, Subbarao K, Ahmed R, Pulendran B. Systems biology of vaccination for seasonal influenza in humans. Nat Immunol. 2011;12:786–795. doi: 10.1038/ni.2067. [DOI] [PMC free article] [PubMed] [Google Scholar]
- 13.Nakaya HI, Hagan T, Duraisingham SS, Lee EK, Kwissa M, Rouphael N, Frasca D, Gersten M, Mehta AK, Gaujoux R, Li GM, Gupta S, Ahmed R, Mulligan MJ, Shen-Orr S, Blomberg BB, Subramaniam S, Pulendran B. Systems analysis of immunity to influenza vaccination across multiple years and in diverse populations reveals shared molecular signatures. Immunity. 2015;43:1186–1198. doi: 10.1016/j.immuni.2015.11.012. [DOI] [PMC free article] [PubMed] [Google Scholar]
- 14.Furman D, Jojic V, Kidd B, Shen-Orr S, Price J, Jarrell J, Tse T, Huang H, Lund P, Maecker HT, Utz PJ, Dekker CL, Koller D, Davis MM. Apoptosis and other immune biomarkers predict influenza vaccine responsiveness. Mol Syst Biol. 2013;9:659. doi: 10.1038/msb.2013.15. [DOI] [PMC free article] [PubMed] [Google Scholar]
- 15.Ovsyannikova IG, Oberg AL, Kennedy RB, Zimmermann MT, Haralambieva IH, Goergen KM, Grill DE, Poland GA. Gene signatures related to HAI response following influenza A/H1N1 vaccine in older individuals. Heliyon. 2016;2:e00098. doi: 10.1016/j.heliyon.2016.e00098. [DOI] [PMC free article] [PubMed] [Google Scholar]
- 16.Obermoser G, Presnell S, Domico K, Xu H, Wang Y, Anguiano E, Thompson-Snipes L, Ranganathan R, Zeitner B, Bjork A, Anderson D, Speake C, Ruchaud E, Skinner J, Alsina L, Sharma M, Dutartre H, Cepika A, Israelsson E, Nguyen P, Nguyen QA, Harrod AC, Zurawski SM, Pascual V, Ueno H, Nepom GT, Quinn C, Blankenship D, Palucka K, Banchereau J, Chaussabel D. Systems scale interactive exploration reveals quantitative and qualitative differences in response to influenza and pneumococcal vaccines. Immunity. 2013;38:831–844. doi: 10.1016/j.immuni.2012.12.008. [DOI] [PMC free article] [PubMed] [Google Scholar]
- 17.Sweeney TE, Haynes WA, Vallania F, Ioannidis JP, Khatri P. Methods to increase reproducibility in differential gene expression via meta-analysis. Nucleic Acids Res. 2017;45:e1. doi: 10.1093/nar/gkw797. [DOI] [PMC free article] [PubMed] [Google Scholar]
- 18.Mazur PK, Reynoird N, Khatri P, Jansen PWTC, Wilkinson AW, Liu S, Barbash O, Van Aller GS, Huddleston M, Dhanak D, Tummino PJ, Kruger RG, Garcia BA, Butte AJ, Vermeulen M, Sage J, Gozani O. SMYD3 links lysine methylation of MAP3K2 to Ras-driven cancer. Nature. 2014;510:283–287. doi: 10.1038/nature13320. [DOI] [PMC free article] [PubMed] [Google Scholar]
- 19.Chen R, Khatri P, Mazur PK, Polin M, Zheng Y, Vaka D, Hoang CD, Shrager J, Xu Y, Vicent S, Butte AJ, Sweet-Cordero EA. A meta-analysis of lung cancer gene expression identifies PTK7 as a survival gene in lung adenocarcinoma. Cancer Res. 2014;74:2892–2902. doi: 10.1158/0008-5472.CAN-13-2775. [DOI] [PMC free article] [PubMed] [Google Scholar]
- 20.Khatri P, Roedder S, Kimura N, De Vusser K, Morgan AA, Gong Y, Fischbein MP, Robbins RC, Naesens M, Butte AJ, Sarwal MM. A common rejection module (CRM) for acute rejection across multiple organs identifies novel therapeutics for organ transplantation. J Exp Med. 2013;210:2205–2221. doi: 10.1084/jem.20122709. [DOI] [PMC free article] [PubMed] [Google Scholar]
- 21.Sweeney TE, Braviak L, Tato CM, Khatri P. Genome-wide expression for diagnosis of pulmonary tuberculosis: A multicohort analysis. Lancet Respir Med. 2016;4:213–224. doi: 10.1016/S2213-2600(16)00048-5. [DOI] [PMC free article] [PubMed] [Google Scholar]
- 22.Sweeney TE, Khatri P. Comprehensive validation of the FAIM3:PLAC8 ratio in time-matched public gene expression data. Am J Respir Crit Care Med. 2015;192:1260–1261. doi: 10.1164/rccm.201507-1321LE. [DOI] [PMC free article] [PubMed] [Google Scholar]
- 23.Sweeney TE, Shidham A, Wong HR, Khatri P. A comprehensive time-course–based multicohort analysis of sepsis and sterile inflammation reveals a robust diagnostic gene set. Sci Transl Med. 2015;7:287ra271. doi: 10.1126/scitranslmed.aaa5993. [DOI] [PMC free article] [PubMed] [Google Scholar]
- 24.Yaari G, Bolen CR, Thakar J, Kleinstein SH. Quantitative set analysis for gene expression: A method to quantify gene set differential expression including gene-gene correlations. Nucleic Acids Res. 2013;41:e170. doi: 10.1093/nar/gkt660. [DOI] [PMC free article] [PubMed] [Google Scholar]
- 25.Hagan T, Nakaya HI, Subramaniam S, Pulendran B. Systems vaccinology: Enabling rational vaccine design with systems biological approaches. Vaccine. 2015;33:5294–5301. doi: 10.1016/j.vaccine.2015.03.072. [DOI] [PMC free article] [PubMed] [Google Scholar]
- 26.Duraisingham SS, Rouphael N, Cavanagh MM, Nakaya HI, Goronzy JJ, Pulendran B. Systems biology of vaccination in the elderly. Curr Top Microbiol Immunol. 2013;363:117–142. doi: 10.1007/82_2012_250. [DOI] [PubMed] [Google Scholar]
- 27.Li S, Rouphael N, Duraisingham S, Romero-Steiner S, Presnell S, Davis C, Schmidt DS, Johnson SE, Milton A, Rajam G, Kasturi S, Carlone GM, Quinn C, Chaussabel D, Palucka AK, Mulligan MJ, Ahmed R, Stephens DS, Nakaya HI, Pulendran B. Molecular signatures of antibody responses derived from a systems biology study of five human vaccines. Nat Immunol. 2014;15:195–204. doi: 10.1038/ni.2789. [DOI] [PMC free article] [PubMed] [Google Scholar]
- 28.Kanehisa M, Sato Y, Kawashima M, Furumichi M, Tanabe M. KEGG as a reference resource for gene and protein annotation. Nucleic Acids Res. 2016;44:D457–D462. doi: 10.1093/nar/gkv1070. [DOI] [PMC free article] [PubMed] [Google Scholar]
- 29.Croft D, Mundo AF, Haw R, Milacic M, Weiser J, Wu G, Caudy M, Garapati P, Gillespie M, Kamdar MR, Jassal B, Jupe S, Matthews L, May B, Palatnik S, Rothfels K, Shamovsky V, Song H, Williams M, Birney E, Hermjakob H, Stein L, D’Eustachio P. The Reactome pathway knowledgebase. Nucleic Acids Res. 2014;42:D472–D477. doi: 10.1093/nar/gkt1102. [DOI] [PMC free article] [PubMed] [Google Scholar]
- 30.Whitney AR, Diehn M, Popper SJ, Alizadeh AA, Boldrick JC, Relman DA, Brown PO. Individuality and variation in gene expression patterns in human blood. Proc Natl Acad Sci USA. 2003;100:1896–1901. doi: 10.1073/pnas.252784499. [DOI] [PMC free article] [PubMed] [Google Scholar]
- 31.Shen-Orr SS, Gaujoux R. Computational deconvolution: Extracting cell type-specific information from heterogeneous samples. Curr Opin Immunol. 2013;25:571–578. doi: 10.1016/j.coi.2013.09.015. [DOI] [PMC free article] [PubMed] [Google Scholar]
- 32.Collins FS, Varmus H. A new initiative on precision medicine. N Engl J Med. 2015;372:793–795. doi: 10.1056/NEJMp1500523. [DOI] [PMC free article] [PubMed] [Google Scholar]
- 33.Leek JT, Scharpf RB, Bravo HC, Simcha D, Langmead B, Johnson WE, Geman D, Baggerly K, Irizarry RA. Tackling the widespread and critical impact of batch effects in high-throughput data. Nat Rev Genet. 2010;11:733–739. doi: 10.1038/nrg2825. [DOI] [PMC free article] [PubMed] [Google Scholar]
- 34.Bucasas KL, Franco LM, Shaw CA, Bray MS, Wells JM, Niño D, Arden N, Quarles JM, Couch RB, Belmont JW. Early patterns of gene expression correlate with the humoral immune response to influenza vaccination in humans. J Infect Dis. 2011;203:921–929. doi: 10.1093/infdis/jiq156. [DOI] [PMC free article] [PubMed] [Google Scholar]
- 35.Franco LM, Bucasas KL, Wells JM, Nino D, Wang X, Zapata GE, Arden N, Renwick A, Yu P, Quarles JM, Bray MS, Couch RB, Belmont JW, Shaw CA. Integrative genomic analysis of the human immune response to influenza vaccination. eLife. 2013;2:e00299. doi: 10.7554/eLife.00299. [DOI] [PMC free article] [PubMed] [Google Scholar]
- 36.Olkkonen VM, Dupree P, Killisch I, Lutcke A, Zerial M, Simons K. Molecular cloning and subcellular localization of three GTP-binding proteins of the rab subfamily. J Cell Sci. 1993;106(Pt. 4):1249–1261. doi: 10.1242/jcs.106.4.1249. [DOI] [PubMed] [Google Scholar]
- 37.Pei G, Bronietzki M, Gutierrez MG. Immune regulation of Rab proteins expression and intracellular transport. J Leukoc Biol. 2012;92:41–50. doi: 10.1189/jlb.0212076. [DOI] [PubMed] [Google Scholar]
- 38.Packard TA, Cambier JC. B lymphocyte antigen receptor signaling: Initiation, amplification, and regulation. F1000prime Rep. 2013;5:40. doi: 10.12703/P5-40. [DOI] [PMC free article] [PubMed] [Google Scholar]
- 39.Ackermann JA, Radtke D, Maurberger A, Winkler TH, Nitschke L. Grb2 regulates B-cell maturation, B-cell memory responses and inhibits B-cell Ca2+ signalling. EMBO J. 2011;30:1621–1633. doi: 10.1038/emboj.2011.74. [DOI] [PMC free article] [PubMed] [Google Scholar]
- 40.Chen Z, Kolokoltsov AA, Wang J, Adhikary S, Lorinczi M, Elferink LA, Davey RA. GRB2 interaction with the ecotropic murine leukemia virus receptor, mCAT-1, controls virus entry and is stimulated by virus binding. J Virol. 2012;86:1421–1432. doi: 10.1128/JVI.05993-11. [DOI] [PMC free article] [PubMed] [Google Scholar]
- 41.She HY, Rockow S, Tang J, Nishimura R, Skolnik EY, Chen M, Margolis B, Li W. Wiskott-Aldrich syndrome protein is associated with the adapter protein Grb2 and the epidermal growth factor receptor in living cells. Mol Biol Cell. 1997;8:1709–1721. doi: 10.1091/mbc.8.9.1709. [DOI] [PMC free article] [PubMed] [Google Scholar]
- 42.Meliopoulos VA, Andersen LE, Brooks P, Yan X, Bakre A, Coleman JK, Tompkins SM, Tripp RA. MicroRNA regulation of human protease genes essential for influenza virus replication. PLOS ONE. 2012;7:e37169. doi: 10.1371/journal.pone.0037169. [DOI] [PMC free article] [PubMed] [Google Scholar]
- 43.Grdisa M, Vitale L. Types and localization of aminopeptidases in different human blood cells. Int J Biochem. 1991;23:339–345. doi: 10.1016/0020-711x(91)90116-5. [DOI] [PubMed] [Google Scholar]
- 44.Abramić M, Zubanović M, Vitale L. Dipeptidyl peptidase III from human erythrocytes. Biol Chem Hoppe Seyler. 1988;369:29–38. doi: 10.1515/bchm3.1988.369.1.29. [DOI] [PubMed] [Google Scholar]
- 45.Hashimoto J, Yamamoto Y, Kurosawa H, Nishimura K, Hazato T. Identification of dipeptidyl peptidase III in human neutrophils. Biochem Biophys Res Commun. 2000;273:393–397. doi: 10.1006/bbrc.2000.2827. [DOI] [PubMed] [Google Scholar]
- 46.Chiravuri M, Agarraberes F, Mathieu SL, Lee H, Huber BT. Vesicular localization and characterization of a novel post-proline-cleaving aminodipeptidase, quiescent cell proline dipeptidase. J Immunol. 2000;165:5695–5702. doi: 10.4049/jimmunol.165.10.5695. [DOI] [PubMed] [Google Scholar]
- 47.Chiravuri M, Schmitz T, Yardley K, Underwood R, Dayal Y, Huber BT. A novel apoptotic pathway in quiescent lymphocytes identified by inhibition of a post-proline cleaving aminodipeptidase: A candidate target protease, quiescent cell proline dipeptidase. J Immunol. 1999;163:3092–3099. [PubMed] [Google Scholar]
- 48.Greene W, Gao SJ. Actin dynamics regulate multiple endosomal steps during Kaposi’s sarcoma-associated herpesvirus entry and trafficking in endothelial cells. PLOS Pathog. 2009;5:e1000512. doi: 10.1371/journal.ppat.1000512. [DOI] [PMC free article] [PubMed] [Google Scholar]
- 49.Cureton DK, Massol RH, Saffarian S, Kirchhausen TL, Whelan SPJ. Vesicular stomatitis virus enters cells through vesicles incompletely coated with clathrin that depend upon actin for internalization. PLOS Pathog. 2009;5:e1000394. doi: 10.1371/journal.ppat.1000394. [DOI] [PMC free article] [PubMed] [Google Scholar]
- 50.Brandenburg B, Lee LY, Lakadamyali M, Rust MJ, Zhuang X, Hogle JM. Imaging poliovirus entry in live cells. PLOS Biol. 2007;5:e183. doi: 10.1371/journal.pbio.0050183. [DOI] [PMC free article] [PubMed] [Google Scholar]
- 51.Terasaki M, Runft LL, Hand AR. Changes in organization of the endoplasmic reticulum during Xenopus oocyte maturation and activation. Mol Biol Cell. 2001;12:1103–1116. doi: 10.1091/mbc.12.4.1103. [DOI] [PMC free article] [PubMed] [Google Scholar]
- 52.Welch MD, DePace AH, Verma S, Iwamatsu A, Mitchison TJ. The human Arp2/3 complex is composed of evolutionarily conserved subunits and is localized to cellular regions of dynamic actin filament assembly. J Cell Biol. 1997;138:375–384. doi: 10.1083/jcb.138.2.375. [DOI] [PMC free article] [PubMed] [Google Scholar]
- 53.Parruti G, Peracchia F, Sallese M, Ambrosini G, Masini M, Rotilio D, De Blasi A. Molecular analysis of human β-arrestin-1: Cloning, tissue distribution, and regulation of expression. Identification of two isoforms generated by alternative splicing. J Biol Chem. 1993;268:9753–9761. [PubMed] [Google Scholar]
- 54.Bhattacharyya S, Hope TJ, Young JA. Differential requirements for clathrin endocytic pathway components in cellular entry by Ebola and Marburg glycoprotein pseudovirions. Virology. 2011;419:1–9. doi: 10.1016/j.virol.2011.07.018. [DOI] [PMC free article] [PubMed] [Google Scholar]
- 55.Lee Y, Kim YJ, Jung YJ, Kim KH, Kwon YM, Kim SI, Kang SM. Systems biology from virus to humans. J Anal Sci Technol. 2015;6:3. doi: 10.1186/s40543-015-0047-4. [DOI] [PMC free article] [PubMed] [Google Scholar]
- 56.Uchida Y, Hasegawa J, Chinnapen D, Inoue T, Okazaki S, Kato R, Wakatsuki S, Misaki R, Koike M, Uchiyama Y, Iemura S-i, Natsume T, Kuwahara R, Nakagawa T, Nishikawa K, Mukai K, Miyoshi E, Taniguchi N, Sheff D, Lencer WI, Taguchi T, Arai H. Intracellular phosphatidylserine is essential for retrograde membrane traffic through endosomes. Proc Natl Acad Sci USA. 2011;108:15846–15851. doi: 10.1073/pnas.1109101108. [DOI] [PMC free article] [PubMed] [Google Scholar]
- 57.Vale-Costa S, Amorim MJ. Recycling endosomes and viral infection. Viruses. 2016;8:64. doi: 10.3390/v8030064. [DOI] [PMC free article] [PubMed] [Google Scholar]
- 58.van Endert P. Intracellular recycling and cross-presentation by MHC class I molecules. Immunol Rev. 2016;272:80–96. doi: 10.1111/imr.12424. [DOI] [PubMed] [Google Scholar]
- 59.Peng N, Liu S, Xia Z, Ren S, Feng J, Jing M, Gao X, Wiemer EAC, Zhu Y. Inducible major vault protein plays a pivotal role in double-stranded RNA– or virus-induced proinflammatory response. J Immunol. 2016;196:2753–2766. doi: 10.4049/jimmunol.1501481. [DOI] [PubMed] [Google Scholar]
- 60.Liu S, Hao Q, Peng N, Yue X, Wang Y, Chen Y, Wu J, Zhu Y. Major vault protein: A virus-induced host factor against viral replication through the induction of type-I interferon. Hepatology. 2012;56:57–66. doi: 10.1002/hep.25642. [DOI] [PubMed] [Google Scholar]
- 61.Martinez-Jimenez CP, Eling N, Chen HC, Vallejos CA, Kolodziejczyk AA, Connor F, Stojic L, Rayner TF, Stubbington MJT, Teichmann SA, de la Roche M, Marioni JC, Odom DT. Aging increases cell-to-cell transcriptional variability upon immune stimulation. Science. 2017;355:1433–1436. doi: 10.1126/science.aah4115. [DOI] [PMC free article] [PubMed] [Google Scholar]
- 62.Bahar R, Hartmann CH, Rodriguez KA, Denny AD, Busuttil RA, Dolle ME, Calder RB, Chisholm GB, Pollock BH, Klein CA, Vijg J. Increased cell-to-cell variation in gene expression in ageing mouse heart. Nature. 2006;441:1011–1014. doi: 10.1038/nature04844. [DOI] [PubMed] [Google Scholar]
- 63.Lu Y, Biancotto A, Cheung F, Remmers E, Shah N, McCoy JP, Tsang JS. Systematic analysis of cell-to-cell expression variation of T lymphocytes in a human cohort identifies aging and genetic associations. Immunity. 2016;45:1162–1175. doi: 10.1016/j.immuni.2016.10.025. [DOI] [PMC free article] [PubMed] [Google Scholar]
- 64.Anders S, Huber W. Differential expression analysis for sequence count data. Genome Biol. 2010;11:R106. doi: 10.1186/gb-2010-11-10-r106. [DOI] [PMC free article] [PubMed] [Google Scholar]
Associated Data
This section collects any data citations, data availability statements, or supplementary materials included in this article.
Supplementary Materials
Fig. S1. Distribution of low (blue), moderate (purple), and high (red) responders in the discovery and validation cohorts.
Fig. S2. Genes that predict vaccination response in young individuals when comparing moderate responders versus low responders.
Fig. S3. Performance of genes significantly different in young high versus low responders.
Fig. S4. Baseline activity of the platelet activation (III) (M42) gene module is associated with influenza vaccination responses in young individuals.
Fig. S5. Baseline activity of the inflammatory response (M33) gene module is associated with influenza vaccination responses in young individuals.
Fig. S6. Validation of GRB2, ACTB, MVP, DPP7, ARPC4, PLEKHB2, and ARRB1 as predictors of influenza vaccination response in the validation cohort (SDY80) after correction for cell subset proportions.
Table S1. Characteristics of the discovery and validation cohorts for young and older participants.
Table S2. Gene module activities that are associated with vaccination response in the discovery cohorts for older participants.
Table S3. Validation of gene modules that are associated with vaccination response in KEGG and Reactome and the modules defined in Obermoser et al. for young participants.