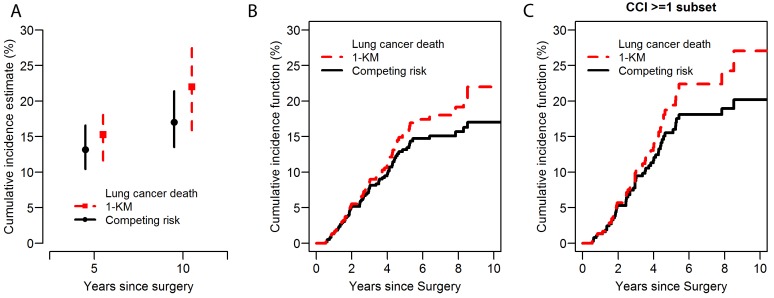
Figure 1. Lung cancer-specific cumulative incidence of death (CID) curves: a comparison between 1-Kaplan-Meier approach and the competing risk approach.
A. 5-year and 10-year lung cancer–specific cumulative incidence of death with a 95% confidence interval. Red square dot: 5-year and 10-year estimated lung cancer–specific CID based on 1-Kaplan-Meier approach with one endpoint and censorship of competing risks. Black circle dot: 5-year and 10-year estimated lung cancer–specific CID based on competing risk analysis in which noncancer–specific death are taken into account as a competing risk event. Red dashed line and black solid line represent 95% confidence intervals. B. Lung cancer–specific CID curves in all patients. Red dashed line: the classic 1-Kaplan-Meier curves with one endpoint and censorship of competing risks. Black solid line: cumulative incidence curve that takes into account non-cancer specific death as a competing risk event. C. Lung cancer–specific CID curves in patients with comorbidities (Charlson comorbidity index ≥ 1). CCI, Charlson comorbidity index; CID, cumulative incidence of death; KM, Kaplan-Meier.

