

Abstract
Combinatorial genetic screening using CRISPR-Cas9 is a useful approach to uncover redundant genes and to explore complex gene networks. However, current approaches suffer from interference between the single-guide RNAs (sgRNAs) and from limited gene targeting activity. To increase the efficiency of combinatorial screening, we employ orthogonal Cas9 enzymes from S. aureus and S. pyogenes. We used machine learning to establish S. aureus Cas9 sgRNA design rules and paired S. aureus Cas9 with S. pyogenes Cas9 to achieve dual targeting in a high fraction of cells. We also developed a lentiviral vector and cloning strategy to generate high-complexity pooled dual-knockout libraries to identify synthetic lethal and buffering gene pairs across multiple cell types, including MAPK pathway genes and apoptotic genes. Our orthologous approach enabled a screen combining gene knockouts with transcriptional activation, which revealed genetic interactions with TP53. The “Big Papi” (Paired aureus and pyogenes for intereactions) approach described here will be widely applicable for the study of combinatorial phenotypes.
Mapping the functional relationships between genes is a critical step towards understanding how disease states arise from gene dysfunction1–3. In yeast, high-throughput methods have enabled the creation of genetic networks, with 23 million double mutants identifying nearly 1 million interactions4. Network complexity is orders of magnitude greater in human cells, with ~10-fold more pairwise combinations of protein-coding genes and thousands of distinct cell types in which to examine interactions.
RNAi and CRISPR technologies can simultaneously perturb two or more genes, and thus represent a promising approach to uncover genetic interactions2,5. Initial combinatorial CRISPR screens6 were performed using lentiviral constructs. However, repetitive elements in lentiviral vectors, including the U6 promoter, lead to high levels of recombination and decrease combinatorial screen efficiency7–10. Two efforts to achieve combinatorial CRISPR screens employed orthologous U6 promoters, from mouse and human7,8, although another study found that multiple copies of the S. pyogenes tracrRNA sequence were likewise prone to recombination11. Finally, because Cpf1 enzymes process their own transcripts, they can deliver multiple sgRNAs from one transcript. However, the reported efficiency of multiple indels in the same cell is less than 10%12, too low for screening applications. In all cases, loading distinct RNAs into a common effector enzyme may result in competition between individual perturbagens and decreased overall efficiency13,14. These design challenges are accentuated when using lentivirus to deliver reagents at single-copy for large scale, pooled genetic screens.
We developed an approach that relies on orthogonal Cas9 enzymes, from S. pyogenes and S. aureus (SpCas9 and SaCas9), to overcome practical limitations of previous approaches and to achieve dual-knockout efficiencies that enable robust screening. This approach uncovers synthetic lethal and buffering relationships across multiple cell types with excellent correspondence between unique sgRNA pairs targeting the same gene pairs. As two sgRNAs independently program two different Cas9s, this approach can combine different activities in the same screen, such as knockout and overexpression (CRISPRa)15. We anticipate that screens using paired aureus and pyogenes for interaction screens to interrogate large combinatorial space at scale (dubbed Big Papi screens) will have widespread application in many cellular models.
RESULTS
Generating double knockouts using a dual Cas9 system
We aimed to develop a system with maximal on-target efficiency at two independent genomic sites, postulating that using two independent Cas9 enzymes would mitigate several sources of inefficiency (Supplementary Fig. 1). We designed a lentiviral construct, pPapi, to express SaCas9 and two sgRNAs from the U6 and H1 promoters (Fig. 1a). A flow cytometry assay assessed dual targeting of EGFP and endogenous CD81 in A375 cells engineered to stably express SpCas9 and EGFP, and we measured the effect of varying the promoter and Cas9 ortholog employed by each sgRNA. Partnering SaCas9 and SpCas9 sgRNAs achieved dual knockout in 50 - 87% of cells with 4 different combinations of sgRNAs (Fig. 1b, Supplementary Fig. 2), indicating a potential for high efficiency.
Figure 1.
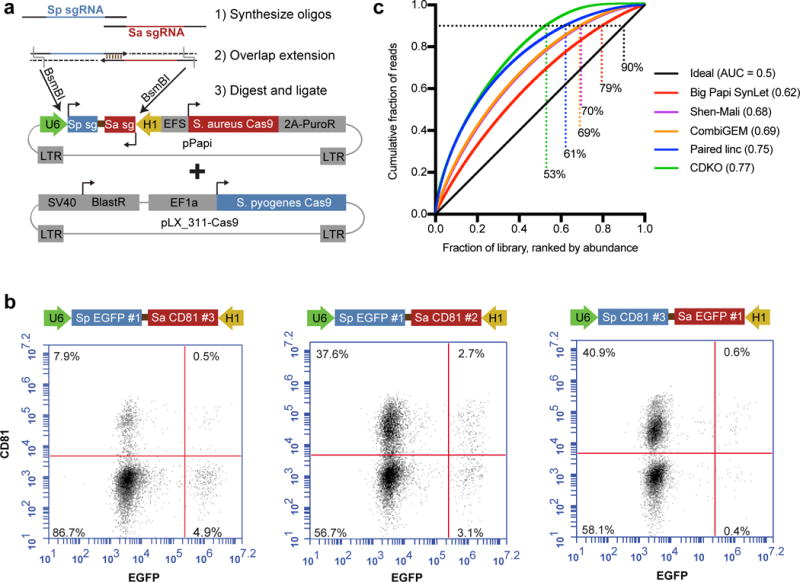
Development of a two Cas9 system for combinatorial screening. (a) Schematic of the dual sgRNA expressing lentiviral vector used in this study, pPapi, as well as the cloning scheme. Pools of oligos are annealed, extended, and ligated into the pPapi vector, and used in cells that already carry the pLX_311 vector expressing SpCas9. (b) Flow cytometry plots indicating double knockout efficiency with percentage of cells indicated in each quadrant. (c) Area-Under-the-Curve (AUC) analysis of library representation. Representation was evaluated for the pDNA library for the Big Papi and CDKO libraries. Plasmid DNA sequencing was not provided for CombiGEM or Shen-Mali libraries, so early time points of genomic DNA were used, which typically very tightly match distributions of pDNA for sgRNA libraries. A perfectly distributed library (ideal) is shown in black. Big Papi SynLet library: sequencing of plasmid DNA (pDNA); Shen-Mali: day 3 genomic DNA from HeLa cells; CombiGEM: day 5 genomic DNA; CDKO: pDNA; Paired linc: pDNA. Percentages indicate each library’s representation at 90% cumulative reads, and AUC values are noted in the key.
To enable efficient construction of pooled, multiplex libraries, we developed a cloning scheme with synthesized oligonucleotides (~140 nts), overlap extension, and a single transformation step into E. coli (Fig. 1a). A pool consisting of M SpCas9 sgRNAs and N SaCas9 sgRNAs, a total of M + N oligos, generates a pool comprising M × N pairwise combinations. We generated a Synthetic Lethal (SynLet) library, described below, with 96 unique sgRNAs cloned into each position, totaling 962 = 9,216 dual-sgRNA elements. The proximity of the sgRNAs permits them to be amplified and sequenced together in a single NextGen sequencing read. The cumulative distribution function for the pool had an area-under-the-curve (AUC) of 0.62 (Fig. 1c), comparable to our previously-described Brunello genome-wide library (AUC of 0.64; AUC = 0.5 for a perfectly uniform distribution)16. We compared this SynLet library to four other published libraries6–8,17, which all rely on two transformation steps into E. coli; AUCs for these libraries ranged from 0.68 – 0.77. Likewise, for the SynLet library, 79% of sgRNA pairs were found in the top 90% of reads, whereas the other four libraries showed more attrition, capturing 53% – 70% of elements at this threshold (Fig. 1c).
Optimizing sgRNA design for SaCas9
Previously, we determined rules to predict high-performing SpCas9 sgRNAs by coupling experimentation with machine learning16,18. We took a similar approach to optimize the design of SaCas9 sgRNAs. We developed a SaCas9-version of lentiCRISPR-v2, replacing the SpCas9 and tracrRNA scaffold with their S. aureus counterparts. We designed a pooled tiling library to compare SpCas9 and SaCas9 by targeting EEF2, a common essential gene, with all possible sgRNA sequences regardless of protospacer adjacent motif (PAM), and assayed activity by a viability screen in A375 cells. As expected for SpCas9, the set of sgRNAs utilizing an NGG PAM (n = 449) were depleted compared to those using all other PAMs (n = 4,087), with a median log2-fold-change of −2.5 relative to the plasmid DNA (Fig. 2a). For SaCas9, some sgRNAs with an NNGRRV PAM (n = 349; R = A or G; V = A, C, or G) were active, but as expected19,20, NNGRRT (n = 47) was most active, with a median log2-fold-change of −4.3. We compared sgRNAs sharing a common cut site between SaCas9 and SpCas9, and observed that SaCas9 typically had higher activity (Fig. 2b).
Figure 2.

Development of SaCas9 on-target rules. (a) Performance of tiled libraries of all possible sgRNAs targeting the essential EEF2 gene, grouped by PAM sequence. The box represents the 25th, 50th and 75th percentiles, whiskers show 10th and 90th percentiles. (b) Comparison of the activity of EEF2 sgRNAs targeting the same cut site using either SaCas9 (NNGRRT PAM) or SpCas9 (NGG PAM). (c) Spearman correlations of the activity of sgRNAs targeting essential genes across cell lines. (d) Single nucleotide features predictive of SaCas9 activity. Top 20% of sgRNA sequences were treated as highly active and a 20% versus 80% classification model was used to identify predictive features. The –log 10 p-values are plotted (two-sided Fisher’s exact test). (e) Contribution of different groups of features to the gradient boosted regression tree model for SaCas9 activity. (f) Example performance of the model. Using a version of the model in which EEF2 sgRNAs were not used in the training, sgRNA activity score is plotted versus the measured value. (g) For the model version used in (f), the fraction of sgRNAs that led to at least 4-fold depletion, binned by predicted score. The number of sgRNAs in each bin is shown above the bar. (h) Increase in model performance as more genes are used in the training set, using Spearman correlation to compare the predicted activity score to the measured value. Error bars represent standard deviation across random draws of the training genes and the held-out test gene.
We designed a second tiling library with all sgRNAs with an NNGRR PAM that targeted 9 genes with known phenotypes in viability and drug resistance assays, a total of 5,327 sgRNAs, including controls (Supplementary Fig. 3a). We performed viability screens in three cell lines (A375, 293T, MOLM13), and screened relevant cell lines for 6-thioguanine (A375, 293T) and vemurafenib resistance (A375). We observed the expected activities for sgRNAs targeting these nine genes (Supplementary Fig. 3b, Supplementary Table 1), with consistent performance across the 3 cell lines (Fig 2c), suggesting that predictive sequence features are likely to generalize across cell types.
We first used a classification model to determine sequence features correlated with high activity, examining all single and dinucleotides16. The feature most predictive of high activity was thymine immediately 3′ of the core PAM sequence, NNGRR (Fig. 2d). However, thymine is neither necessary nor sufficient for high activity: of 1,805 sgRNAs targeting viability genes in A375 cells, a non-thymine nucleotide was present in 58% of the top quintile of most-active sgRNAs, whereas 14% of sgRNAs with thymine scored in the bottom half of activity. In the RR portion of the PAM, we observed that AG is favored over other combinations of purines.
To improve predictions, we used gradient boosted regression trees on the rank-transformed activity values16. Features included position-specific and position-independent single and dinucleotides, and thermodynamic properties; position-specific dinucleotides proved the most important for predicting activity (Fig. 2e). To illustrate performance, we used a version of the model in which EEF2 sgRNAs were held out of the training set, and compared the predicted scores to the measured activities in A375 cells, observing a Spearman correlation of 0.64 (Fig. 2f). Whereas high-scoring sgRNAs (score > 0.6) represent only 12% of all EEF2 sgRNAs, they are quite likely to be active, with 77% resulting in >4-fold decrease in viability (Fig. 2g). Downsampling the number of genes used for training indicated diminishing returns for model parameter estimation with 9 genes (Fig 2h). The model developed here for SaCas9 sgRNA design, available online (http://portals.broadinstitute.org/gpp/public/analysis-tools/sgrna-design) will enable more effective application of CRISPR technology.
Combinatorial gene targeting using a dual Cas9 system
We first tested the Big Papi approach by screening for synthetic lethal gene combinations. As few such relationships have been validated across many cell lines, we assembled an ad hoc list of target genes (Supplementary Table 2). BRCA and PARP genes have a clinically-appreciated synthetic lethal relationship21,22. Likewise, for anti-apoptotic genes, the ability of expression of one to rescue inhibition of another is well-documented, necessitating combinatorial targeting23. We also selected gene families with known or potential redundancy in their function, including MAPKs, AKTs, and ubiquitins24–26. Finally, we included several genes computationally predicted to engage in multiple synthetic lethal interactions27. We designed 3 sgRNAs against these 25 genes for both SaCas9 and SpCas9 (Supplementary Table 2). Each gene pair is assessed with 18 unique sgRNA combinations (2 Cas9s × 3 gene A sgRNAs × 3 gene B sgRNAs); an ineffective individual sgRNA affects 3 of the combinations, emphasizing the importance of effective design. We targeted two control genes: EEF2 (3 sgRNAs), a core essential gene, and CD81 (10 sgRNAs), a cell surface marker with no known viability effect in most cells. We added two sets of negative controls, sgRNAs that target introns of HPRT1 (5 sgRNAs), and 3 expression cassettes that terminate transcription due to a run of 6 thymidines (6T). The resulting 96 × 96 = 9,216 member SynLet library was packaged into lentivirus for use in six diverse tumor cell lines engineered to express SpCas9: A375 (skin); Meljuso (skin); HT29 (colon); A549 (lung); 786O (kidney); and OVCAR8 (ovary).
Cells were transduced at low MOI (~0.5) in biological duplicate, selected with puromycin, and cultured for 21 days; for some, an earlier time point was also collected (Fig. 3a). We prepared genomic DNA, PCR-amplified the dual-sgRNA cassette, and quantitated library distribution by sequencing (Supplementary Table 3). We compared abundance at day 21 to the starting abundance (plasmid DNA) to determine the effect of each sgRNA pair on viability. Biological replicates were well correlated for all six cell lines (Pearson correlations of 0.89 – 0.98, Fig. 3b). We performed this same analysis for three other dual-knockout combinatorial studies, and found that replicate reproducibility was high for the CDKO screen (0.98) low for the CombiGem (0.2) and Shen-Mali (0.21 – 0.42) screens (Fig. 3b).
Figure 3.
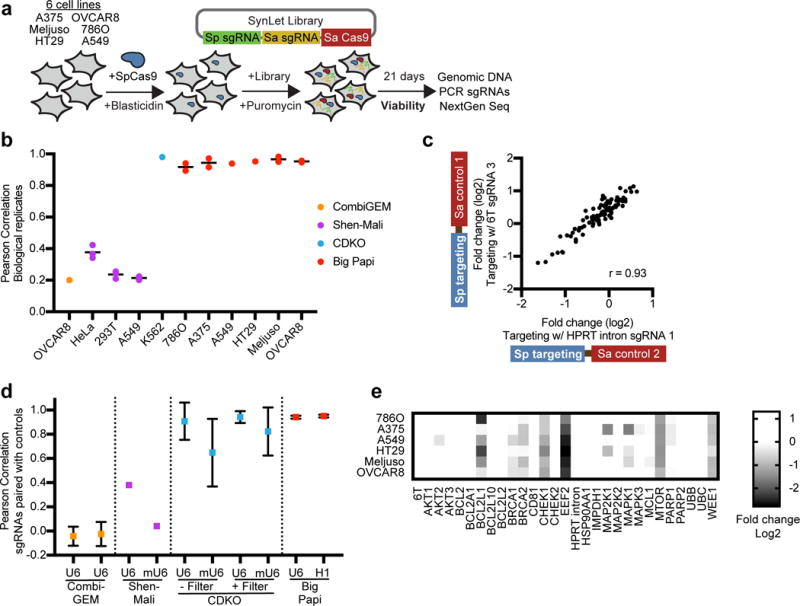
Evaluation of synthetic lethal screens. (a) Schematic of the Big Papi screens performed with the SynLet library. (b) Comparison of log2-fold-change for sgRNA pairs across biological replicates and cell lines for the Big Papi approach and other published screens. When multiple time points were assessed, each is shown as a point and the line segment represents the mean. CombiGEM: Day 20 compared to Day 15; Shen-Mali: Day 14, Day 21, and Day 28 compared to Day 3; CDKO: Day 14 compared to pDNA, drug library; Big Papi: Day 9, 11, or 21 compared to pDNA. (c) Example comparison of the activity of targeting sgRNAs in the U6 position when paired with different control sgRNAs in the H1 position for the Big Papi screening approach. This data demonstrates the correlation among subsets of distinct library constructs that all target the same genomic site. (d) Pearson correlations for all pairwise combinations of controls, as in panel (c), for both sgRNA positions for several screening approaches. The point indicates the mean, the error bars represent one standard deviation for the range of pairwise correlation values. The promoter expressing the targeting sgRNA labels the x-axis. CombiGEM (n = 3 pairwise comparisons): sgRNAs paired with 3 ‘dummy’ controls. Shen-Mali (n = 1): sgRNAs paired with the non-targeting sgRNAs #362 and #412 in the HeLa data. CDKO (n = 3,081): sgRNAs paired with 79 ‘safe’ sgRNAs. Big Papi (n = 28): sgRNAs paired with ‘6T’ and ‘HPRT intron’ controls in the Meljuso, day 21 data. (e) Assessment of the essentiality of individual genes with the Big Papi screening approach at day 21. The log2-fold-change for all six targeting sgRNAs, three with SaCas9 and three with SpCas9, were averaged to produce a gene-level score.
Our orthologous Cas9 approach seeks to diminish competition between two sgRNAs, which may arise from differences in transcription, RNA stability, or binding affinity to Cas9 (Supplementary Fig. 1). We compared performance of individual targeting sgRNAs in one position when partnered with varying control sgRNAs in the second position (Fig. 3c). For targeting sgRNAs utilizing either Cas9, the average log2-fold-changes were well-correlated regardless of the control sgRNA (Fig. 3d). In contrast, the effects of individual sgRNAs paired with different controls in the CombiGEM and Shen-Mali libraries were not well-correlated (Fig. 3d). The CDKO library, after removing 31% of sgRNA combinations (read counts below 50), showed much better correlation but the decreased consistency for sgRNAs driven from the mouse U6 promoter, evident in the unfiltered data, remained apparent in the filtered data (Fig. 3d). The Shen-Mali data showed the same trend, suggesting that lower expression from the mouse U6 promoter results in unequal competition for Cas9, an issue avoided by the dual-Cas9 approach.
We next examined phenotypic consistency at the gene level between the two Cas9s and observed good agreement, with Pearson correlations of 0.80 – 0.89 across the 6 cell lines (Supplementary Fig. 4a). Combining measurements from both Cas9s, single knockouts of EEF2, CHEK1, MTOR, and WEE1 consistently exhibited viability effects, with stronger depletion at day 21, consistent with their classification as fitness genes28; other genes showed cell line specific viability effects (Fig. 3e, Supplementary Fig. 4b). Thus, SaCas9 and SpCas9 produced mutually consistent knockout phenotypes across cell lines.
We next assessed synthetic lethal and buffering relationships. We modeled the expected log2-fold-change from sgRNA pairs as the sum of the log2-fold-change (LFC) for each individual sgRNA when partnered with controls, and then calculated the difference (ΔLFC) by comparing this expectation to the measured value (Supplementary Fig. 5a). A positive ΔLFC represents a buffering relationship and a negative ΔLFC represents synthetic lethality. The measured data matched the expectation of this model well (Pearson correlation = 0.97), suggesting this is an effective metric for gene interaction (Fig. 4a). We combined information for multiple sgRNA pairs targeting the same gene pairs, and performed the same calculations with randomized input data to generate a null distribution, allowing the calculation of a false discovery rate (FDR, Supplementary Figure 5b, Supplementary Fig. 5c). Using this framework, we analyzed all 6 cell lines harvested at the day 21 time point (Fig. 4b, Supplementary Table 4).
Figure 4.
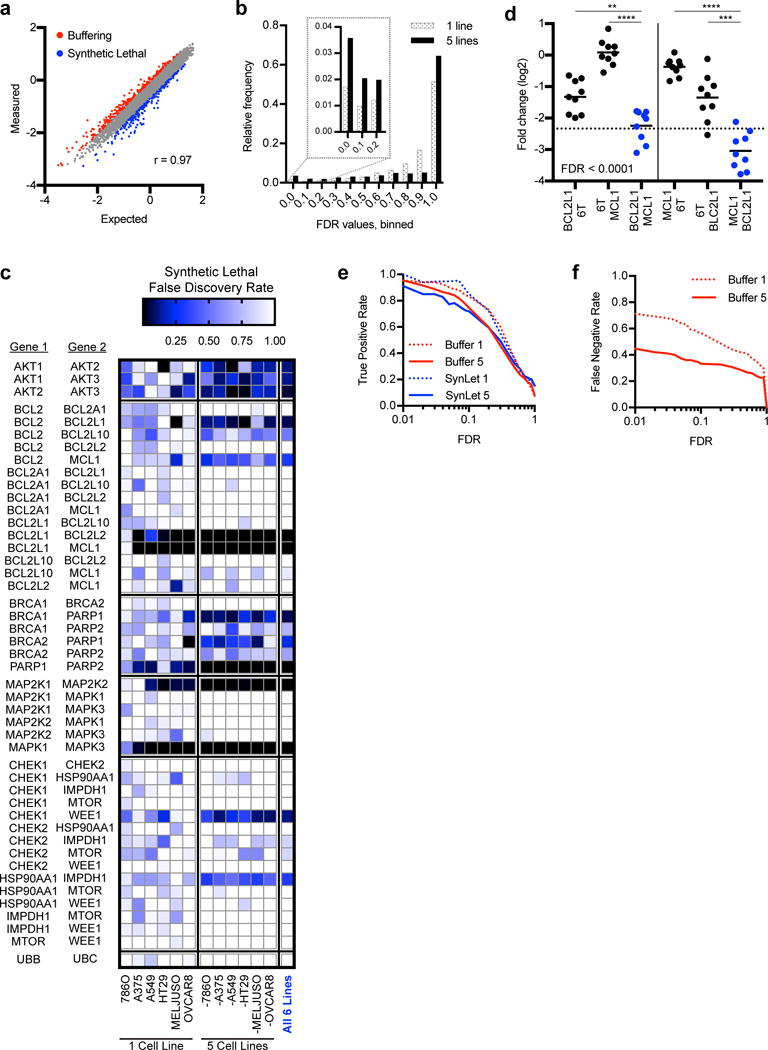
Synthetic lethal Big Papi screen. (a) Correlation between measured and expected log2-fold-change values for combinatorial targeting. Data points above (red) and below (blue) 2 standard deviations are highlighted, representing buffering and synthetic lethal interactions, respectively. Data from Meljuso cells are plotted as a representative cell line. (b) Distribution of all false discovery rates determined for buffering and synthetic lethal interactions using either data from individual cell lines (1 line) or combining data from 5 lines. When 5 lines are combined, more pairs score with either low FDRs or with an FDR = 1. (c) FDRs for synthetic lethal interactions for gene pairs within pre-defined groups at the day 21 time point. Results are shown from individual cell lines, all leave-one-out combinations, and the combination of all 6 lines. (d) Primary screening data showing the performance of sgRNAs for BCL2L1 and MCL1 when paired together or with 6T controls in Meljuso cells at day 21. Average is denoted with a line whereas each dot represents an sgRNA combination. Dotted line refers to 2 standard deviations (2SD) from the mean for individual sgRNAs paired with controls (black dots). P-values for depletion of the dual-targeting sets of sgRNA pairs are based on the Mann-Whitney test, **P<0.01; ***P<0.001; ****P<0.0001. (e) Comparisons of the estimated true positive rate to the calculated FDR for synthetic lethal and buffering interactions, using either individual cell lines or all leave-one-out combinations of 5 cell lines. (f) Estimation of the false negative rate based on analysis of same-gene buffering interactions, using either individual cell lines or all leave-one-out combinations of 5 cell lines, plotted against the FDR.
Examining interactions within the pre-defined gene groups, several expected synthetic lethal relationships emerge (Fig. 4c). For example, the anti-apoptotic genes BCL2L1 (Bcl-xL) and MCL1 scored strongly (FDR < 0.01) in 5 of 6 cell lines, with 12 of the 18 sgRNA combinations depleted more than two standard deviations from the log2-fold-change of the individual sgRNAs when paired with controls in Meljuso cells (Fig. 4d). The CDKO approach also found this interaction with strong statistical significance in the filtered data (Supplementary Fig. 6)8. In the CombiGEM and Shen-Mali screens, few sgRNA pairs exceeded two standard deviations versus control pairings, and sets of all sgRNA pairings for the top hit gene pairs showed modest statistical significance across several examples (Supplementary Fig. 6). From this analysis, we conclude that the Big Papi approach can identify hits consistently across sgRNA pairs.
Although some gene pairs, such as MAPK1 – MAPK3 and BCL2L1 – MCL1, showed strong effects in most cell lines, other interactions scored strongly in one cell line but were modest or absent in others (Fig. 4c). We hypothesized that combining information across cell lines could improve detection of weaker but generalizable interactions, minimizing technical and cell-line-specific sources of variation; this proved an effective strategy (Supplementary Table 4). For example, in OVCAR8 cells, BRCA1 – PARP1 scored with an FDR of 0.18 and the other 5 individual lines ranged from 0.46 – 0.94, whereas combining those 5 lines gave an FDR of 0.22, and all 6 cell lines gave an FDR of 0.06. The three AKT isoforms had a similar pattern. Conversely, some interactions with modest FDRs in one cell line are not supported in other lines, such as BCL2A1 and BCL2L10, which has an FDR of 0.48 in A375 cells and 1.0 in the combination of the other 5 lines; such examples may be truly cell line specific or could represent false positives. Overall, conducting primary screens across multiple cell lines is an effective strategy for discovering generalizable interactions.
By making some conservative assumptions about the correctness of particular subsets of synthetic lethal or buffering interactions, we were able to estimate in two independent ways true positive rates for the SynLet screens (Supplementary Discussion 1). Using these models, we calculated the true positive rate at different FDR thresholds for data from both individual cell lines as well as all leave-one-out iterations and obtained similar estimates whether based on synthetic lethal effects or on buffering interactions, suggesting the independent assumptions made for each were reasonable (Fig. 4e). At an FDR threshold of 0.1, the empirically-determined true positive rate ranged from 72 – 85%, not far from the theoretical value of 90% (i.e. 10% false discoveries).
Similarly, we modeled false negative rates based on conservative assumptions about same-gene buffering interactions (Supplementary Note 1). We observed a lower false negative rate when combining information from multiple cell lines (Fig. 4f); for example, at an FDR of 0.1, we determine a false negative rate of 57% when using individual cell lines, whereas combining 5 lines gives a false negative rate of 33%. Overall, the empirically determined true positive and false negative rates suggest that Big Papi is an efficient screening approach (Supplementary Figure 9), especially when assayed across multiple cell lines.
Genetic Interactions
We examined synthetic lethal interactions within the pre-defined groups across the 6 cell lines (Fig. 4c). We did not observe a relationship between the putatively-redundant genes UBB and UBC, despite analysis of buffering interactions indicating that the sgRNAs are active (Supplementary Fig. 7b). Among the set of genes computationally predicted to engage in synthetic lethal interactions we did not observe strong interactions27. We note that these genes generally performed poorly in our analysis of buffering interactions (Supplementary Fig. 7b) and thus may represent false negative findings. Combining information from all cell lines, however, identified an interaction between CHEK1 and WEE1 (FDR = 0.10), which has also been seen with small molecule inhibitors29. The other 4 pre-defined groups revealed many interactions for further analysis and study.
Anti-apoptotic genes
In addition to the interaction between BCL2L1 and MCL1, synthetic lethality between BCL2L1 and BCL2L2 (Bcl-w) was detected in Meljuso, OVCAR8, and A375 at an FDR < 0.01, HT29 (0.03) and A549 (0.31). To the best of our knowledge, this interaction has not previously been observed. BCL2L2 is less studied than BCL2L1, with ~20-fold fewer publications indexed in PubMed. BCL2 is poorly expressed in these cells, but in Meljuso, with the highest expression, BCL2 interacted with BCL2L1 (FDR < 0.01) and MCL1 (0.20) (Fig. 5a). We did not observe any strong interactions involving the anti-apoptotic proteins BCL2L10 and BCL2A1, despite high expression of the latter in some lines (Fig. 5a).
Figure 5.
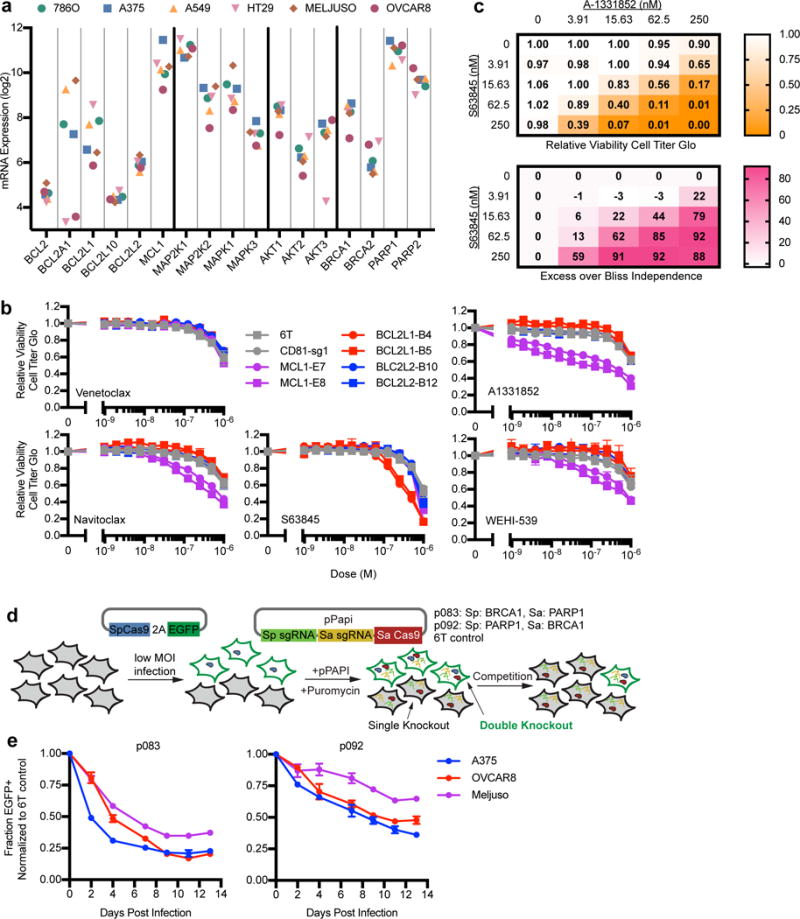
Validation of synthetic lethal interactions. (a) Gene expression values from the Cancer Cell Line Encyclopedia. (b) Validation of genetic interactions with individual gene knockout combined with small molecules. Seven days after transduction with lentivirus expressing individual sgRNAs, cells were incubated with small molecules for three days before assaying viability by Cell Titer Glo. Points represent the average and whiskers represent the maximum and minimum of two replicate wells. (c) Validation of BCL2L1 – MCL1 genetic interaction with combinations of small molecules. Cells were incubated with small molecules for three days before assaying viability by Cell Titer Glo (top). Bliss independence scores were then calculated (bottom). (d) Schematic of a competition experiment used to compare cell viability of single versus double knockout of BRCA1 and PARP1. EGFP is co-delivered with SpCas9 at a low MOI, followed by introduction of the pPapi vector, which contained SaCas9 and two sgRNAs targeting BRCA1 and PARP1 with SpCas9 and SaCas9, respectively (p083), or the reverse (p092). EGFP is thus a marker for SpCas9 delivery; EGFP+ cells are double knockouts while EGFP- cells only have knockout of the SaCas9-targeted gene. Controls, containing 6T in place of the sgRNA, were also included. (e) Fraction of EGFP+ cells over time for cells receiving the indicated vector, normalized to the population that received the 6T control construct. The pPapi vectors were infected in triplicate, and error bars represent the standard deviation of the three measurements.
We confirmed these interactions with small molecule inhibitors. Meljuso, OVCAR8, and A549 cells were transduced with single SaCas9 sgRNAs targeting MCL1, BCL2L1, or BCL2L2, or controls. Cells were treated with various inhibitors of anti-apoptotic proteins: venetoclax, an FDA-approved BCL2 inhibitor30; navitoclax, an extensively-characterized inhibitor of BCL2, BCL2L1, and BCL2L231, A-1331852 and WEHI-539, tool compounds described as BCL2L1 inhibitors32,33; and S63845, an MCL1 inhibitor in clinical development34. Cells were dosed from 1 nM to 1 μM, and cell viability assessed (Fig. 5b, Supplementary Fig. 8a). Both sgRNAs targeting MCL1 strongly synergized with navitoclax, A-1331852, and WEHI-539; conversely, sgRNAs targeting BCL2L1 synergized specifically with S63845. Dual small molecule treatment with A-1331852 and S63845 likewise synergized, with excess over Bliss independence scores of 85 or greater at combinations with 250 nM (Fig. 5c, Supplementary Fig. 8b). Thus, small molecules confirmed the synthetic lethal interaction between MCL1 and BCL2L1.
MAPK genes
We detected a strong interaction between MAPK1 (ERK2) and MAPK3 (ERK1) in A375 (FDR = 0.04), A549 (<0.01), HT29 (<0.01), Meljuso (<0.01), and OVCAR8 (<0.01) (Fig. 4c), all lines with activating mutations in the MAPK pathway (BRAF V600E; KRAS G12S; BRAF V600E; NRAS Q61L and HRASG13D; and KRAS P121H, respectively). 786O cells, with no known mutations in the MAPK pathway, showed a weaker interaction (FDR = 0.57). MAP2K1 (MEK1) and MAP2K2 (MEK2) synergized in 4 of the 5 MAPK pathway mutant cell lines: HT29 (FDR = 0.01), OVCAR8 (0.05), Meljuso (0.06), and A549 (0.11). The exception, A375 (FDR = 1.0), was sensitive to loss of MAP2K1 individually (Fig. 3e).
AKT genes
We saw a strong interaction for AKT1 – AKT2 in HT29 cells (FDR < 0.01), the only line with a known PIK3CA mutation (P449T); the CDKO library also detected this interaction8. In contrast to the other 5 lines, HT29 cells express low levels of AKT3, potentially explaining the strong interaction (Fig. 5a). Likewise, AKT1 – AKT3 scored strongly in OVCAR8 cells (FDR = 0.13), which express the lowest levels of AKT2. However, the interaction between AKT2 – AKT3 in Meljuso cells (FDR = 0.09) is not predicted based on AKT1 expression. Finally, we observe relationships across all three AKT proteins in 786O cells, with moderate FDRs ranging from 0.35 – 0.46. No AKT isoforms show low expression in this line; thus, expression of one may partially compensate for loss of the other two. The relationships between AKT proteins are well-studied and complex, and they have both redundant and unique activities dependent on cellular context35,36. Despite these differences across cell lines, combining information across all 6 lines gave FDRs of 0.04 – 0.12 (Fig. 4c).
BRCA & PARP genes
We observed a relationship between PARP1 – PARP2 in four cell lines: OVCAR8 (FDR = 0.06), A549 (0.07), A375 (0.12), and Meljuso (0.13), and across all cell lines (< 0.01). Only OVCAR8 showed a strong interaction between BRCA2 – PARP1 (FDR < 0.01); BRCA1 expression is lowest in these cells (Fig. 5a). That the interactions across these genes was most pronounced in the ovarian line may have been anticipated, as PARP inhibitors have shown clinical efficacy in BRCA-deficient ovarian cancers22, although the dissimilar strength across cell lines for BRCA1 – PARP1 may not have been expected. To further investigate, we performed a competition assay in three cell types: one that originally scored strongly (OVCAR8, FDR = 0.18), weakly (A375, 0.68), or was essentially null (Meljuso, 0.94). Here, EGFP+ cells have dual knockout, whereas EGFP- cells are single knockouts of the gene targeted by the SaCas9 sgRNA; the relative viability of these populations can be monitored over time with flow cytometry (Fig. 5d). In OVCAR8 and A375, double knockout cells were strongly depleted relative to single knockouts, however the viability effect on double knockout cells was notably weaker in Meljuso (Fig. 5e). This result validates the interaction originally detected with weaker significance in A375 and demonstrates that Meljuso are indeed less sensitive to combinatorial BRCA1 – PARP1 loss. Consistent with this, Shen-Mali classified BRCA1 – PARP1 as a “private” synthetic lethal interaction in 293T cells but not A549 or Hela cells7, and BRCA mutant cells show varying sensitivity to PARP inhibitors both in cell culture and clinical settings37,38.
Apoptosis Screen
Interaction networks for pro- and anti-apoptotic genes have been assembled by biochemical approaches, and although some interactions are consistently detected, others show less consistent results39. Because pro-apoptotic genes were robust and reproducible hits in our initial screen, we investigated the apoptotic network further with a Big Papi screen. We selected 32 genes implicated in apoptosis and targeted them each with 4 sgRNAs, for a total of 20,736 perturbations including controls (Supplementary Table 5); sequencing of plasmid DNA gave an AUC of 0.67, with 73% of combinations present in the top 90% of reads.
We screened this library in Meljuso and OVCAR8 in duplicate for 21 days in standard growth conditions; further, in Meljuso we challenged the population with various inhibitors of anti-apoptotic proteins (Fig. 6a, Supplementary Table 6). Knockout of some anti-apoptotic genes had minor growth effects, whereas knockout of pro-apoptotic genes did not decrease cell viability (Fig. 6b). We analyzed these screens for synthetic lethal and buffering interactions, and confirmed a strong synthetic lethal interaction between BCL2L1 and both MCL1 and BCL2L2 (Supplementary Fig. 9, Supplementary Table 7; this interaction was also observed above Fig. 4). In both cell lines, we observed buffering interactions between pro- and anti-apoptotic genes (Fig. 6c). The strongest interactions were detected between BCL2L1 and both BAK1 and BAX (FDR < 0.01 for combined data), multi-BH-domain proteins that direct mitochondrial outer membrane permeabilization (MOMP); interactions between these proteins have been detected biochemically39. BOK did not engage in strong interactions, potentially expected based on its low expression (Fig. 6d).
Figure 6.
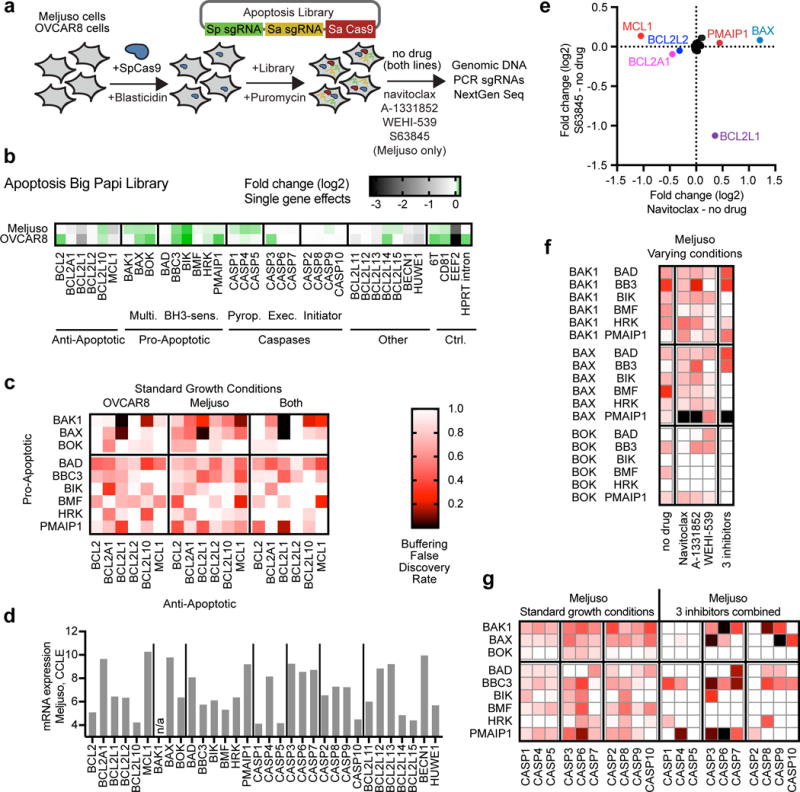
Apoptosis Big Papi screen. (a) Schematic of the screen design. (b) Genes targeted by the Apoptosis library and the viability effects caused by single gene knockout; fold change values are calculated relative to the pDNA pool for targeting sgRNAs paired with the 6T and HPRT intron controls. (c) FDRs for buffering interactions detected between pro- and anti-apoptotic genes in Meljuso and OVCAR8 cells as well as the combined data from both cell lines. (d) From the Cancer Cell Line Encyclopedia, expression levels of these genes in Meljuso cells. BAK1 was not assessed in the CCLE, indicated by an asterisk. (e) In Meljuso cells with single gene knockouts, comparison of resistance and sensitization phenotypes for two small molecules. The fold change values are calculated relative to the no drug arm for targeting sgRNAs paired with the 6T and HPRT intron controls. Genes of interest are colored and labeled. (f) Buffering interactions in Meljuso cells for combinations of multidomain apoptotic genes with BH3-only sensitizer genes in different growth conditions. Data from the three small molecules were combined for the final column. Heat map scale is the same as in panel c. (g) Buffering interactions in Meljuso cells for combinations of pro-apoptotic genes and caspase genes in standard growth conditions and the combined data from the three small molecules. Heat map scale is the same as in panel c.
We next analyzed Meljuso cells screened with inhibitors, first examining single gene effects. As expected, navitoclax and S63845 synergized with MCL1 and BCL2L1 knockout, respectively (Fig. 6e). Knockout of BCL2A1, which did not show strong interactions when screened in standard growth conditions (Fig. 4c, Supplementary Fig. 9), sensitized the cells to navitoclax. Conversely, knockout of BAX and PMAIP1 (Noxa) led to navitoclax resistance (Fig. 6d). Thus, these screening conditions identified both sensitization and resistance phenotypes.
To examine combinatorial phenotypes, we combined data across the three BCL2L1 inhibitors, to minimize effects due to molecule-specific mechanism of action. Whereas BAX – PMAIP1 knockout showed a minimal buffering interaction in standard growth conditions (FDR = 0.89), they synergized strongly to protect cells from death when treated with anti-apoptotic inhibitors (FDR < 0.01) (Fig. 6f). Similarly, caspase – pro-apoptotic knockouts produced modest buffering interactions in standard growth conditions; only PMAIP1 – CASP6 scored strongly (FDR = 0.12) (Fig. 6g). However, inhibitors led to clearer detection of specific interactions. For example, the strongest initiator and effector caspases to interact with BAK1 were CASP8 (FDR = 0.10) and CASP6 (FDR = 0.01), respectively. These two caspases directly interact with each other40. Although caspase interactions are complex, CASP8 is generally associated with the extrinsic cell death pathway41. Conversely, BAX interacted strongly with CASP9 (FDR < 0.01) and CASP3 (FDR = 0.04), caspases with a well-established relationship42, with CASP9 associated most strongly with the mitochondrial cell death pathway. Although BAK1 and BAX are generally considered functional redundant, differences in localization and binding partners have been documented43,44; to our knowledge this is the first report of differences in genetic interactions with downstream caspases in human cells.
Orthogonal activities
The Big Papi approach is readily applied to concomitant screening of orthogonal modalities (Fig. 7a), for example repressing one gene while activating another. To test the ability to combine distinct gene-targeting activities, we designed a Big Papi library to overexpress 38 annotated oncogenes with CRISPRa technology with 3 sgRNAs each, using a nuclease-dead SpCa9 (dCas9) fused to the “VPR” domain comprised of three transcriptional activators45. We employed SaCas9 to knockout 45 tumor suppressor genes, also with 3 sgRNAs each (Supplementary Table 8). With controls, the TsgOnco library totaled 19,250 constructs; pDNA sequencing gave an AUC of 0.63, and 77% of constructs were detected in the top 90% of reads. We screened HA1E cells, a kidney line immortalized by large T antigen, which inactivates TP53. After infection, cells were grown in standard conditions and on low attachment culture plates (Fig. 7b); the latter are a surrogate for soft agar and select for transformation phenotypes46. We first examined performance of targeting sgRNAs paired with control sgRNAs, and observed good consistency, with overexpression of TP53 dramatically reducing viability with all three sgRNAs (Fig. 7c, Supplementary Table 9). Likewise, SaCas9-mediated knockout of EEF2, CDK12, and ERCC2 decreased cell viability with all three sgRNAs for each gene (Fig. 7d).
Figure 7.
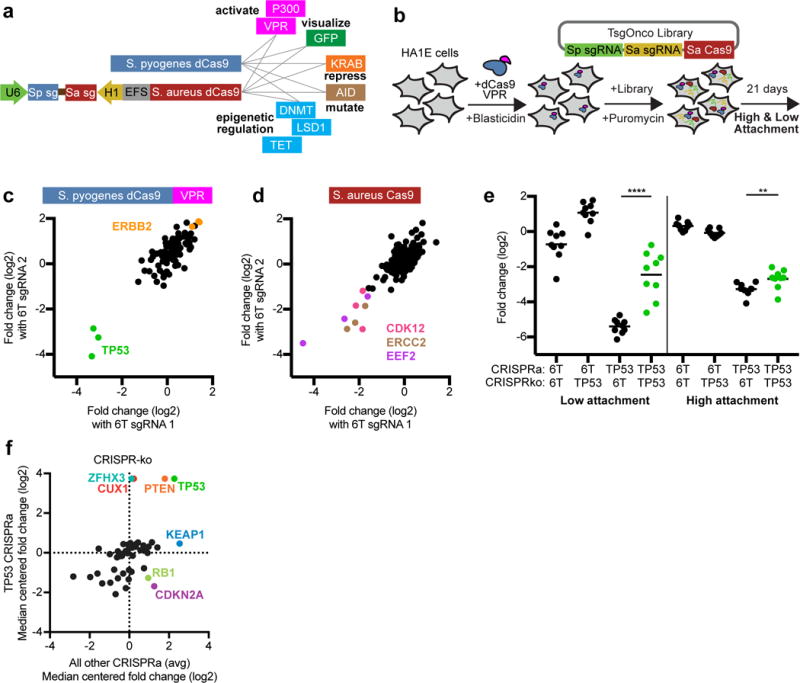
Big Papi screen with two Cas9 activities. (a) In addition to using either or both Cas9s as DNA endonucleases to inactivate genes, nuclease dead versions of Cas9 (dCas9) can be used with appended domains to manipulate DNA with multiple activities. (b) Schematic of the screen for the TsgOnco Big Papi library. (c) For the TsgOnco library in high attachment conditions in HA1E cells, comparison of the activity of CRISPRa sgRNAs when paired with control SaCas9 sgRNAs. (d) Comparison of the activity of CRISPR-knockout sgRNAs when paired with control dSpCas9-VPR sgRNAs in high attachment conditions. (e) Buffering interaction observed in HA1E cells, where knockout of TP53 protects the cells from loss of viability caused by overexpression of TP53. Data for both low and high attachment conditions are shown. P-values for depletion of the dual-targeting sets of sgRNA pairs are based on the Mann-Whitney test; significance labels: **P<0.01; ****P<0.0001. (f) Knockout of tumor suppressor genes, comparing viability upon TP53 overexpression to the average viability of all other CRISPRa target genes. Genes of interest are labeled and colored.
We next examined the data for genetic interactions (Supplementary Fig. 10). A strong interaction was observed between dSpCas9-VPR sgRNAs targeting TP53 for overexpression, which is lethal, and SaCas9 sgRNAs targeting TP53 for knockout, which buffered this lethality. This effect was stronger in low attachment conditions, and serves as technical validation that overexpression and knockout are co-active in cells (Fig. 7e). Several other interactions with TP53 overexpression were likewise more apparent in the stringent, low attachment conditions. Knockouts of both ZFHX3 (ATBF1) and CUX1, which had minimal effects on viability on their own, partially rescued the lethality caused by TP53 overexpression (Fig. 7f, Supplementary Fig. 11). ZFHX3 directly interacts with TP53 to activate the CDKN1A promoter (p21Cip1), leading to cell cycle arrest, and thus ZFHX3 loss buffers this TP53 activity47. Likewise, CUX1 deficiency activates PI3K signaling48; consistent with this observation, knockout of PTEN increased proliferation, an effect that persisted in cells overexpressing TP53. Conversely, although KEAP1 knockout generally led to increased cell viability, this effect was muted upon TP53 overexpression (Fig. 7f), which is consistent with the opposing actions of KEAP1 and TP53 on the transcription factor NFE2L2 (Nrf2). Normally, KEAP1 degrades NFE2L2, so KEAP1 loss leads to NFE2L2 stabilization; TP53 suppresses the metabolic target genes of NFE2L2, thereby nullifying the effect of KEAP1 knockout49. Notably, knockout of both CDKN2A (p16) and RB1 gave increased viability in the absence of TP53, but overexpression of TP53 reversed this phenotype. That these two genes are immediately upstream and downstream, respectively, of the cell cycle kinases CDK4 and CDK6 suggests this counterintuitive observation merits further exploration. These results serve as proof-of-principle that the Big Papi approach can combine multiple Cas9 activities in a single screen to reveal genetic interactions.
DISCUSSION
We developed a dual-Cas9 system to identify genetic interactions. This system is efficient, cost effective, and supports pooled library generation and screening. Synthetic lethal screens using our system identified interactions within several groups of functionally related genes, including the MAPK pathway, AKT signaling, DNA damage repair, and apoptosis, with high statistical confidence. We also applied this system to map buffering interactions between genes involved in apoptosis, both in standard growth conditions and in the presence of small molecules, which revealed additional genetic interactions. Finally, we combined CRISPR-mediated knockout and overexpression to uncover interactions with TP53.
SaCas9 has been utilized previously for in vivo gene editing19,20 and in an orthologous, chemically induced CRISPRa and CRISPRi system, although it was noted to have lower efficiency than SpCas9 in that study, most likely due to suboptimal sgRNA selection50. To increase SaCas9 utility, we assessed the activity of thousands of sgRNAs to define rules enabling selection of highly-active sgRNAs. GUIDE-Seq results have shown that SaCas9 has fewer off-target effects than SpCas9, based on the modest sampling of sgRNAs assessed thus far by this technique51. These performance properties and the design rules provided here, coupled with its smaller size (~1 kilobase shorter than SpCas9), highlight SaCas9 as an attractive genome editing tool.
The number of genes that can be screened is typically limited by the scale of cell culture, which dictates the size of the library; generally, genome-wide single-gene sgRNA libraries contain ~100,000 perturbations and require 1,000 cells per perturbation. The Big Papi approach achieves reasonable performance with only 2 sgRNAs per gene (Supplementary Figure 12), and thus a screen to examine pairwise combinations of 158 genes with 2 sgRNAs per gene would have a similar number of perturbations: (158 × 2) × (158 × 2) = 99,856.
Our results highlight the importance of cell context in detecting interactions. With the SynLet library, no gene pair scored strongly (FDR < 0.01) in all 6 cell lines, and some showed strong interactions in only one line. One outlier was 786O, a renal clear cell carcinoma line with VHL deletion, in which we identified no synthetic lethal gene pairs at an FDR < 0.01. Biological replicates of the 786O screen were well-correlated, and we also detected buffering interactions when targeting the same gene with both Cas9s, suggesting that the screen was well-executed and the reagents were active. Heterogeneity of small molecules on different cell lines is well-documented and it is reasonable to expect the same heterogeneity across cell lines for genetic interactions. Although mutation status and mRNA expression could be used post facto to rationalize why some interactions were detected more strongly in some lines compared to others, combining information across cell lines proved a useful strategy for detecting generalizable interactions with increased confidence.
In summary, the Big Papi approach described here for dual-gene perturbation screens represents a powerful means to map genetic interactions in mammalian cells that can be applied across many biological questions and model systems.
ONLINE METHODS
Vectors
Plasmids were cloned by synthesis and assembly (Genscript) and are available to the academic research community through Addgene:
pPapi (also known as pXPR_207): U6 and H1 promoters express two sgRNAs; short EF1a promoter (EFS) expresses SaCas9-2A-PuromycinR (Addgene 96921).
pXPR_034: U6 promoter expresses SaCas9 sgRNAs; EFS expresses SaCas9-2A-PuromycinR. An updated version of this plasmid with more convenient restriction sites, pXPR_206, has been deposited in Addgene (96920).
pLX_311-Cas9: SV40 promoter expresses blasticidin resistance; EF1a promoter expresses SpCas9 (generated by Sefi Rosenbluh, Hahn lab, Addgene 96924).
pXPR_120: EF1a promoter expresses dSpCas9-VPR-2A-BlasticidinR (Addgene 96917).
Library production
Pooled libraries for expression of single sgRNAs were made as previously described, with oligonucleotide pools obtained from CustomArray16. For cloning of Big Papi pools, oligonucleotide inserts (Ultramers, IDT) were designed with 5′ BsmBI sites followed by 20 or 21 nt crRNA, 82 nt tracrRNA, 6 nt barcode, and 17 nt complementary sequence (Fig. 1a, Supplementary Note 2). The oligonucleotides for SpCas9 sgRNAs and SaCas9 sgRNAs were separately mixed together at a concentration of 5 μM each. 10 μL of each pool of oligonucleotides was then combined in a 100 μL reaction and extended using NEBNext (New England Biolabs) with an annealing temperature of 48°C. The resulting dsDNA was purified by spin-column then ligated into the BsmBI-digested pPapi vector using 100 cycles of Golden Gate assembly with 100 ng insert and 500 ng vector using Esp3I and T7 ligase, as we have done previously for single sgRNA pools. The DNA was isopropanol precipitated and electroporated into STBL4 cells. A zero-generation (G0) plasmid DNA pool was then amplified by a second electroporation into STBL4 cells to create the G1 plasmid DNA pool, which was then used for virus production. We note that individual constructs to express two sgRNAs can be constructed either by the overlap-extension of individual oligonucleotides or by the use of gBlocks (IDT), which may be a more cost-effective option.
Virus production
For individual virus production: 24 hours before transfection, HEK293T cells were seeded in 6-well dishes at a density of 1.5 × 10⁶ cells per well in 2 mL of DMEM + 10% FBS. Transfection was performed using TransIT-LT1 (Mirus) transfection reagent according to the manufacturer’s protocol. In brief, one solution of Opti-MEM (Corning, 66.25 μL) and LT1 (8.75 μL) was combined with a DNA mixture of the packaging plasmid pCMV_VSVG (Addgene 8454, 1250 ng), psPAX2 (Addgene 12260, 1250 ng), and the sgRNA-containing vector (e.g. pPapi, 1250 ng). The two solutions were incubated at room temperature for 20–30 minutes, during which time the HEK293T cells were replenished with fresh media. After this incubation, the transfection mixture was added dropwise to the surface of the HEK293T cells, and the plates were centrifuged at 1000×g for 30 minutes. Following centrifugation, plates were transferred to a 37°C incubator for 6–8 hours, then the media was removed and replaced with media supplemented with 1% BSA. A larger-scale procedure was used for production of the sgRNA library; 24 hours before transfection, 18 × 106 HEK293T cells were seeded in a 175cm2 tissue culture flask, with transfection performed as described above using 6mL of Opti-MEM and 300μL of LT1. Flasks were transferred to a 37°C incubator for 6–8 hours, then media aspirated and replaced with BSA-supplemented media. Virus was harvested 36 hours after this media change.
Cell culture
A375, HT29, OVCAR8, 786O, A549, and Meljuso cells were obtained from the Cancer Cell Line Encyclopedia; HA1E cells were obtained from the Connectivity Map; HEK293T cells were obtained from ATCC (CRL-3216). All cell lines were routinely tested for mycoplasma contamination and maintained in a 37°C humidity-controlled incubator with 5.0% CO2. Cells were maintained in exponential phase growth by passaging every 2 or 3 days. Cell lines were maintained without antibiotics and supplemented with 1% penicillin/streptomycin during screens. Cas9 derivatives were made by transducing with the lentiviral vector pLX_311-Cas9, which expresses blasticidin resistance from the SV40 promoter and Cas9 from the EF1α promoter, as described previously18. The following list includes, respectively, cell line, media, and concentration of puromycin, blasticidin, and polybrene:
A375; RPMI + 10% FBS; 1 μg/ml; 5 μg/ml; 1 μg/ml.
HEK293T; DMEM + 10% FBS; 1 μg/ml; 5 μg/ml; 1 μg/ml.
HT29; DMEM + 10% FBS; 2 μg/ml; 5 μg/ml; 1 μg/ml.
MOLM13; RPMI + 10% FBS; 2 μg/ml; 5 μg/ml; 4 μg/ml.
Meljuso; RPMI + 10% FBS; 1 μg/mL; 2 μg/mL; 4 μg/mL
A549; DMEM + 10% FBS; 1.5 μg/mL; 5 μg/mL; 1 μg/mL
OVCAR8; RPMI + 10% FBS; 2 μg/mL; 3 μg/mL; 4 μg/mL
786O; RPMI + 10% FBS; 1 μg/mL; 2 μg/mL; 4 μg/mL
HA1E; MEM-alpha + 10% FBS; 1 μg/mL; 8 μg/mL; 4 μg/mL
Flow Cytometry
For experiments carried out in Fig. 1 and Supplementary Fig. 2, A375 cells stably expressing SpCas9 and GFP were transduced at an MOI of ~1 in 12-well plates. Two days after transduction, cells were selected with puromycin (1μg/mL) for five days. Cells were stained with APC-conjugated CD81 antibody (Biolegend 349510) diluted 1:100 in flow buffer (PBS, 2% FBS, 5μM EDTA) for 30 minutes on ice. Residual antibody was removed with two flow buffer washes, and cells were re-suspended in flow buffer. Flow cytometry was performed on the BDAccuri C6 Sampler system or Live cell populations were gated using forward and side scatter to exclude debris. CD81+ and EGFP+ gates were set using non-transduced A375-SpCas9-EGFP cells.
SaCas9 activity rules
Computational modeling for SaCas9 activity was done as previously for SpCas916. In contrast to our previous work, we did not use the NGGX interaction feature (which is SpCas9 PAM-specific). Also, previously we generated two models for SpCas9, one which used gene positional features (nucleotide cut, percent peptide), and one that omitted them. We have since found the latter to be used more frequently, as it does not assume the target DNA encodes a protein, and thus we did not use gene positional features for the derivation of the SaCas9 activity model.
SynLet library screening
To determine lentiviral titer, cell lines were transduced in 12-well plates with 150, 300, 500, and 800 μL virus with 3.0 × 10⁶ cells per well in the presence of polybrene. The plates were centrifuged at 640×g for 2 hours then transferred to a 37°C incubator for 4–6 hours. Each well was then trypsinized, and an equal number of cells seeded into each of two wells of a 6-well dish. Two days post-transduction, puromycin was added to one well out of the pair. After 5 days, both wells were counted for viability by trypan exclusion. A viral dose resulting in 30 – 50% transduction efficiency, corresponding to an MOI of ~0.35 – 0.70, was used for subsequent library screening. Prior to screening-scale transduction, Cas9-expressing cell lines were selected with blasticidin then transduced in two or three biological replicates; puromycin selection began two days post-transduction. Transductions were performed with enough cells to achieve a representation of at least 500 cells per sgRNA per replicate, taking into account a 30 – 50% transduction efficiency. Puromycin selection was maintained for 5 – 7 days. Throughout the screen, cells were split at a density to maintain a representation of at least 500 cells per sgRNA. Cell counts were taken at each passage to monitor growth. After this screen, cells were pelleted by centrifugation, resuspended in PBS, and frozen promptly for genomic DNA isolation.
Genomic DNA preparation and sequencing
Genomic DNA (gDNA) was isolated using the QIAamp DNA Blood Midi Kit (Qiagen) as per the manufacturer’s instructions. The concentration of these preparations was determined by UV spectroscopy (Nanodrop). PCR of single sgRNA expressing vectors was as described16. For the pPapi vector, dual sgRNA cassettes and plasmid DNA were PCR-amplified and barcoded with sequencing adaptors using ExTaq DNA Polymerase (Clontech), following the same procedure. Primer sequences (IDT) can be found in Supplementary Note 1. Amplified samples were then purified with Agencourt AMPure XP SPRI beads (Beckman Coulter, A63880) according to manufacturer’s instructions and sequenced on a NextSeq sequencer (Illumina) with 300 nt single-end reads, with a 10% spike-in of PhiX DNA. Deconvolution of single sgRNA expressing vectors was as described16. For the pPapi vector, reads of the first sgRNA were counted by first searching in the sequencing read for CACCG, the part of the vector sequence that immediately precedes the 20-nucleotide U6 promoter-driven SpCas9 sgRNA. The sgRNA sequence following this search string was mapped to a reference file with all sgRNAs in the library. To find the H1 promoter-driven SaCas9 sgRNA, two 21-nucleotide sequences were compared: the sequence beginning 194 nucleotides after the SpCas9 sgRNA and the sequence following the S. aureus tracr sequence (CTTAAAC). If the sequences matched, the 21 nt sequence was then mapped to the reference file with all SaCas9 sgRNA. For some sequencing lanes with poorer quality, the reference file with the SaCas9 sgRNAs sequences was shortened, such that fewer than 21 nts were needed to match in order to determine the identity of the sgRNA in that position. See also Supplementary Note 1. Reads were then assigned to the appropriate experimental condition based on the 8-nucleotide P7-appended barcode. The resulting matrix of read counts was normalized to reads per million (rpm) within each condition by the following formula: reads per sgRNA/total reads per condition × 106. A pseudocount of 1 was added, and the rpm was then log2-transformed.
Validation of Hits in the Apoptosis Pathway
Gene pairs associated with a synthetic lethal phenotype in the library screen were validated using combinatorial viability screening of sgRNA perturbations with 5 small molecule inhibitors: navitoclax (ABT-263, Active Biochem A-1001), A1331852 (Active Biochem A-6048); venetoclax (ABT-199, Active Biochem A-1231); WEHI539 (MedChem Express, HY-15607A); and the MCL1 inhibitor S63845 (a gift from Guo Wei, Golub lab). Meljuso cells were transduced in 12-well plates, as described above, with lentivirus containing a single sgRNA targeting one of the anti-apoptotic genes (BCL2L1, BCL2L2, MCL1) or a control sgRNA either targeting CD81 or containing a run of 6 thymidines. Two days after transduction, cells were selected using puromycin at 1 μg/mL for five days. After puromycin selection, 3,000 cells were seeded into 96-well plates. Across each row of the 96-well plate, a different small molecule was added at 11 log2-dilutions ranging from 1 μM to approximately 1 nM in duplicate for each of the cell lines. The last well in the row did not receive small molecule. After 3 days in the presence of the small molecule, viability of the cell population was assayed by CellTiterGlo (Promega) according to the manufacturer’s instructions.
BRCA1/PARP1 competition assay
A375, OVCAR8, and Meljuso cells were transduced with in a 24-well plate with 10 μL Cas9-2A-EGFP virus (Dharmacon, VCAS11862), with 2.0 × 10⁵ cells per well with 1 μg/mL of polybrene. The plates were centrifuged at 2250 rpm for 2 hours and then transferred to a 37°C incubator for 4 hours before changing media. The day after transduction, each well was trypsinized and passaged into a T75 flask. The population was confirmed to be a mixture of EGFP+ and EGFP- cells (~30% EGFP+ for each cell line) and then transduced with the pPapi BRCA1/PARP1 constructs. The vector p083 contains SpCas9 BRCA1 sgRNA B07 and SaCas9 PARP1 sgRNA F01; p092 contains SpCas9 PARP1 sgRNA F06 and SaCas9 BRCA1 sgRNA C02; sgRNAs sequences are listed in Supplementary Table 2. The plates were centrifuged at 2250 rpms for 2 hours and then transferred to a 37°C incubator for 4–6 hours. Two days post-transduction, puromycin was added to wells for the duration of the assay. Cells were passaged and flow cytometry measurements were taken on the BDAccuri C6 Sampler system at days 0, 2, 4, 7, 9, 11, and 13 post-infection with the pPapi vector.
Apoptosis library screen
Infections were conducted as described above for the SynLet library. OVCAR8 cells were passaged in standard growth conditions for 21 days post-infection. In Meljuso cells, each of three biological replicates was split into five arms 7 days post-infection: Navitoclax, A-1331852, S63845, WEHI-539 and no drug (standard growth conditions). All small molecules were screened at 250 nM with an on/off dosing schedule, in which cells were treated with small-molecule for 4 days and then grown in standard growth conditions for 3 days, and then this cycle was repeated for an additional week. All arms were collected at 21 days post-infection. For Meljuso cells, all three replicates were prepared and sequenced separately. In OVCAR8 cells, one replicate was lost during genomic DNA preparation, and the remaining two replicates were combined prior to sequencing.
CRISPRa/CRISPRko Tsg/Onco screen
Oncogenes and tumor suppressors were selected for screening based on their high frequency of mutation in patient tumor samples52 and their annotation in the COSMIC database53. HA1E cells were infected with pXPR_120 and selected with blasticidin. For the pooled screen, cells were seeded into 7 T175 flasks at 30% confluence and infected with the TSG/Onco library in biological replicate. After 48 hours, puromycin was added, and cells were maintained under puromycin for 5 days. Cells were then split into two conditions. For the High-Attachment conditions, cells were seeded into standard tissue culture treated T225 flasks; for the Low-Attachment conditions, cells were seeded into a 1-layer untreated low-attachment cell stacker (Costar 3303). The High-Attachment conditions was passaged and maintained, and the cells were harvested on Day 14. The Low-Attachment conditions received media changes until cells that adhered reached confluence, and the cells were harvested on Day 19.
DATA AVAILABILITY
All screening data generated in this study are included in this published article and its supplementary information files. Data for small scale experiments that support the findings of this study are available from the corresponding author upon reasonable request.
ACCESSION CODE AVAILABILITY
Sequencing reads are available at the Sequence Read Archive, Project ID SRP106649. Scripts to deconvolute and analyze combinatorial screens are provided on Github, https://github.com/mhegde
Supplementary Material
Supplementary Table 1 List of sgRNAs and their measured activity values for the tiling library used as the input for training the model of SaCas9 activity rules.
Supplementary Table 2 List of sgRNAs in the SynLet library, annotated by their pre-defined functional group. The well positions are used to identify sgRNAs in figure legends.
Supplementary Table 3 Primary screening data for the SynLet library. Read counts and subsequent normalization for each of two or three biological replicates are provided, as well as the expected values for each individual sgRNA in the pair based on performance with control sgRNAs.
Supplementary Table 4 False discovery rate calculations for gene pairs in the SynLet library for individual cell lines, all leave-one-out combinations, and the combination of all 6 lines
Supplementary Table 5 List of sgRNAs in the Apoptosis Library.
Supplementary Table 6 Primary screening data for the Apoptosis library. Read counts and subsequent normalization for each of two or three biological replicates are provided, as well as the expected values for each individual sgRNA in the pair based on performance with control sgRNAs.
Supplementary Table 7 False discovery rate calculations for gene pairs in the Apoptosis library for individual cell lines and small molecule conditions, as well as combinations of conditions.
Supplementary Table 8 List of sgRNAs in the Tumor Suppressor – Oncogene (TsgOnco) library.
Supplementary Table 9 Primary screening data for the Tumor Suppressor – Oncogene library. Read counts and subsequent normalizations for each of the two biological replicates are provided.
Acknowledgments
We thank S. Elmore and G. Wei for helpful discussions; E. Sukharevsky, R. Hanna, and I. Sebenius for experimental assistance and comments on the manuscript; D. Ortiz for emotional uplift. We thank T. Hart and other anonymous referees for helpful comments during the review process.
F.J.N. is supported by a cellular and developmental biology training grant (NIH T32GM007226-41). J.G.D. is supported by the Next Generation Fund at the Broad Institute of MIT and Harvard. This work was supported by the Functional Genomics Consortium (D.E.R.).
Footnotes
AUTHOR CONTRIBUTIONS
F.J.N., C.S., K.F.D., K.R.S., Z.K., E.W.V., M.E.S., E.H., and J.G.D designed and performed experiments.
N.F. and J.L. performed the computational modeling of SaCas9 activity.
M.H., S.T.Y., and J.G.D. analyzed screening data.
B.E.B. and D.E.R. provided senior guidance.
F.J.N., D.E.R., and J.G.D. wrote the manuscript with assistance from other authors.
COMPETING FINANCIAL INTERESTS
J.L. and N.F. are employed by Microsoft Research. J.G.D. consults for Tango Therapeutics.
References
- 1.Roguev A, et al. Quantitative genetic-interaction mapping in mammalian cells. Nature Methods. 2013;10:432–437. doi: 10.1038/nmeth.2398. [DOI] [PMC free article] [PubMed] [Google Scholar]
- 2.Horn T, et al. Mapping of signaling networks through synthetic genetic interaction analysis by RNAi. Nature Methods. 2011;8:341–346. doi: 10.1038/nmeth.1581. [DOI] [PubMed] [Google Scholar]
- 3.Tong AHY, et al. Global mapping of the yeast genetic interaction network. Science. 2004;303:808–813. doi: 10.1126/science.1091317. [DOI] [PubMed] [Google Scholar]
- 4.Costanzo M, et al. A global genetic interaction network maps a wiring diagram of cellular function. Science. 2016;353:aaf1420–aaf1420. doi: 10.1126/science.aaf1420. [DOI] [PMC free article] [PubMed] [Google Scholar]
- 5.Bassik MC, et al. A systematic mammalian genetic interaction map reveals pathways underlying ricin susceptibility. Cell. 2013;152:909–922. doi: 10.1016/j.cell.2013.01.030. [DOI] [PMC free article] [PubMed] [Google Scholar]
- 6.Wong ASL, et al. Multiplexed barcoded CRISPR-Cas9 screening enabled by CombiGEM. Proceedings of the National Academy of Sciences. 2016;113:201517883–6. doi: 10.1073/pnas.1517883113. [DOI] [PMC free article] [PubMed] [Google Scholar]
- 7.Shen JP, et al. Combinatorial CRISPR–Cas9 screens for de novo mapping of genetic interactions. Nature Methods. 2017;17:10–9. doi: 10.1038/nmeth.4225. [DOI] [PMC free article] [PubMed] [Google Scholar]
- 8.Han K, et al. Synergistic drug combinations for cancer identified in a CRISPR screen for pairwise genetic interactions. Nat Biotechnol. 2017;6:2781–15. doi: 10.1038/nbt.3834. [DOI] [PMC free article] [PubMed] [Google Scholar]
- 9.terBrake O, et al. Lentiviral vector design for multiple shRNA expression and durable HIV-1 inhibition. Mol Ther. 2008;16:557–564. doi: 10.1038/sj.mt.6300382. [DOI] [PubMed] [Google Scholar]
- 10.Vidigal JA, Ventura A. Rapid and efficient one-step generation of paired gRNA CRISPR-Cas9 libraries. Nature Communications. 2015;6:8083. doi: 10.1038/ncomms9083. [DOI] [PMC free article] [PubMed] [Google Scholar]
- 11.Adamson B, et al. A Multiplexed Single-Cell CRISPR Screening Platform Enables Systematic Dissection of the Unfolded Protein Response. Cell. 2016;167:1867–1882.e21. doi: 10.1016/j.cell.2016.11.048. [DOI] [PMC free article] [PubMed] [Google Scholar]
- 12.Zetsche B, et al. Multiplex gene editing by CRISPR–Cpf1 using a single crRNA array. Nat Biotechnol. 2016;35:31–34. doi: 10.1038/nbt.3737. [DOI] [PMC free article] [PubMed] [Google Scholar]
- 13.McIntyre GJ, Arndt AJ, Gillespie KM, Mak WM, Fanning GC. A comparison of multiple shRNA expression methods for combinatorial RNAi. Genet Vaccines Ther. 2011;9:9. doi: 10.1186/1479-0556-9-9. [DOI] [PMC free article] [PubMed] [Google Scholar]
- 14.Stockman VB, et al. A High-Throughput Strategy for Dissecting Mammalian Genetic Interactions. PLoS ONE. 2016;11:e0167617–13. doi: 10.1371/journal.pone.0167617. [DOI] [PMC free article] [PubMed] [Google Scholar]
- 15.Gilbert LA, et al. Genome-Scale CRISPR-Mediated Control of Gene Repression and Activation. Cell. 2014;159:647–661. doi: 10.1016/j.cell.2014.09.029. [DOI] [PMC free article] [PubMed] [Google Scholar]
- 16.Doench JG, et al. Optimized sgRNA design to maximize activity and minimize off-target effects of CRISPR-Cas9. Nat Biotechnol. 2016;34:184–191. doi: 10.1038/nbt.3437. [DOI] [PMC free article] [PubMed] [Google Scholar]
- 17.Zhu S, et al. Genome-scale deletion screening of human long non-coding RNAs using a paired-guide RNA CRISPR-Cas9 library. Nat Biotechnol. 2016;34:1279–1286. doi: 10.1038/nbt.3715. [DOI] [PMC free article] [PubMed] [Google Scholar]
- 18.Doench JG, et al. Rational design of highly active sgRNAs for CRISPR-Cas9–mediated gene inactivation. Nat Biotechnol. 2014;32:1262–1267. doi: 10.1038/nbt.3026. [DOI] [PMC free article] [PubMed] [Google Scholar]
- 19.Ran FA, et al. In vivo genome editing using Staphylococcus aureus Cas9. Nature. 2015;520:186–191. doi: 10.1038/nature14299. [DOI] [PMC free article] [PubMed] [Google Scholar]
- 20.Friedland AE, et al. Characterization of Staphylococcus aureus Cas9: a smaller Cas9 for all-in-one adeno-associated virus delivery and paired nickase applications. Genome Biol. 2015;16:1–10. doi: 10.1186/s13059-015-0817-8. [DOI] [PMC free article] [PubMed] [Google Scholar]
- 21.Hanzlikova H, Gittens W, Krejcikova K, Zeng Z, Caldecott KW. Overlapping roles for PARP1 and PARP2 in the recruitment of endogenous XRCC1 and PNKP into oxidized chromatin. Nucleic Acids Research. 2017;45:2546–2557. doi: 10.1093/nar/gkw1246. [DOI] [PMC free article] [PubMed] [Google Scholar]
- 22.Farmer H, et al. Targeting the DNA repair defect in BRCA mutant cells as a therapeutic strategy. Nature. 2005;434:917–921. doi: 10.1038/nature03445. [DOI] [PubMed] [Google Scholar]
- 23.van Delft MF, et al. The BH3 mimetic ABT-737 targets selective Bcl-2 proteins and efficiently induces apoptosis via Bak/Bax if Mcl-1 is neutralized. Cancer Cell. 2006;10:389–399. doi: 10.1016/j.ccr.2006.08.027. [DOI] [PMC free article] [PubMed] [Google Scholar]
- 24.Sun C, Bernards R. Feedback and redundancy in receptor tyrosine kinase signaling: relevance to cancer therapies. Trends Biochem Sci. 2014;39:465–474. doi: 10.1016/j.tibs.2014.08.010. [DOI] [PubMed] [Google Scholar]
- 25.Buscà R, Pouysségur J, Lenormand P. ERK1 and ERK2 Map Kinases: Specific Roles or Functional Redundancy? Front Cell Dev Biol. 2016;4:53. doi: 10.3389/fcell.2016.00053. [DOI] [PMC free article] [PubMed] [Google Scholar]
- 26.Uzgare AR, Isaacs JT. Enhanced redundancy in Akt and mitogen-activated protein kinase-induced survival of malignant versus normal prostate epithelial cells. Cancer Research. 2004;64:6190–6199. doi: 10.1158/0008-5472.CAN-04-0968. [DOI] [PubMed] [Google Scholar]
- 27.Srivas R, et al. A Network of Conserved Synthetic Lethal Interactions for Exploration of Precision Cancer Therapy. Mol. Cell. 2016;63:1–13. doi: 10.1016/j.molcel.2016.06.022. [DOI] [PMC free article] [PubMed] [Google Scholar]
- 28.Hart T, et al. High-Resolution CRISPR Screens Reveal Fitness Genes and Genotype-Specific Cancer Liabilities. Cell. 2015;163:1515–1526. doi: 10.1016/j.cell.2015.11.015. [DOI] [PubMed] [Google Scholar]
- 29.Chaudhuri L, et al. CHK1 and WEE1 inhibition combine synergistically to enhance therapeutic efficacy in acute myeloid leukemia ex vivo. Haematologica. 2014;99:688–696. doi: 10.3324/haematol.2013.093187. [DOI] [PMC free article] [PubMed] [Google Scholar]
- 30.Souers AJ, et al. ABT-199, a potent and selective BCL-2 inhibitor, achieves antitumor activity while sparing platelets. Nat Med. 2013;19:202–208. doi: 10.1038/nm.3048. [DOI] [PubMed] [Google Scholar]
- 31.Oltersdorf T, et al. An inhibitor of Bcl-2 family proteins induces regression of solid tumours. Nature. 2005;435:677–681. doi: 10.1038/nature03579. [DOI] [PubMed] [Google Scholar]
- 32.Leverson JD, et al. Exploiting selective BCL-2 family inhibitors to dissect cell survival dependencies and define improved strategies for cancer therapy. Sci Transl Med. 2015;7:279ra40–279ra40. doi: 10.1126/scitranslmed.aaa4642. [DOI] [PubMed] [Google Scholar]
- 33.Lessene G, et al. Structure-guided design of a selective BCL-X(L) inhibitor. Nat Chem Biol. 2013;9:390–397. doi: 10.1038/nchembio.1246. [DOI] [PubMed] [Google Scholar]
- 34.Kotschy A, et al. The MCL1 inhibitor S63845 is tolerable and effective in diverse cancer models. Nature. 2016;538:477–482. doi: 10.1038/nature19830. [DOI] [PubMed] [Google Scholar]
- 35.Dummler B, et al. Life with a Single Isoform of Akt: Mice Lacking Akt2 and Akt3 Are Viable but Display Impaired Glucose Homeostasis and Growth Deficiencies. Molecular and Cellular Biology. 2006;26:8042–8051. doi: 10.1128/MCB.00722-06. [DOI] [PMC free article] [PubMed] [Google Scholar]
- 36.Nitulescu GM, et al. Akt inhibitors in cancer treatment: The long journey from drug discovery to clinical use (Review) Int J Oncol. 2016;48:869–885. doi: 10.3892/ijo.2015.3306. [DOI] [PMC free article] [PubMed] [Google Scholar]
- 37.Stordal B, et al. BRCA1/2 mutation analysis in 41 ovarian cell lines reveals only one functionally deleterious BRCA1 mutation. Mol Oncol. 2013;7:567–579. doi: 10.1016/j.molonc.2012.12.007. [DOI] [PMC free article] [PubMed] [Google Scholar]
- 38.Helleday T. The underlying mechanism for the PARP and BRCA synthetic lethality: clearing up the misunderstandings. Mol Oncol. 2011;5:387–393. doi: 10.1016/j.molonc.2011.07.001. [DOI] [PMC free article] [PubMed] [Google Scholar]
- 39.Rooswinkel RW, et al. Antiapoptotic potency of Bcl-2 proteins primarily relies on their stability, not binding selectivity. Blood. 2014;123:2806–2815. doi: 10.1182/blood-2013-08-519470. [DOI] [PubMed] [Google Scholar]
- 40.Cowling V, Downward J. Caspase-6 is the direct activator of caspase-8 in the cytochrome c-induced apoptosis pathway: absolute requirement for removal of caspase-6 prodomain. Cell Death Differ. 2002;9:1046–1056. doi: 10.1038/sj.cdd.4401065. [DOI] [PubMed] [Google Scholar]
- 41.Kroemer G, Galluzzi L, Brenner C. Mitochondrial membrane permeabilization in cell death. Physiol Rev. 2007;87:99–163. doi: 10.1152/physrev.00013.2006. [DOI] [PubMed] [Google Scholar]
- 42.Li P, et al. Cytochrome c and dATP-dependent formation of Apaf-1/caspase-9 complex initiates an apoptotic protease cascade. Cell. 1997;91:479–489. doi: 10.1016/s0092-8674(00)80434-1. [DOI] [PubMed] [Google Scholar]
- 43.Ma SB, et al. Bax targets mitochondria by distinct mechanisms before or during apoptotic cell death: a requirement for VDAC2 or Bak for efficient Bax apoptotic function. Cell Death Differ. 2014;21:1925–1935. doi: 10.1038/cdd.2014.119. [DOI] [PMC free article] [PubMed] [Google Scholar]
- 44.Sarosiek KA, et al. BID preferentially activates BAK while BIM preferentially activates BAX, affecting chemotherapy response. Mol. Cell. 2013;51:751–765. doi: 10.1016/j.molcel.2013.08.048. [DOI] [PMC free article] [PubMed] [Google Scholar]
- 45.Chavez A, et al. Highly efficient Cas9-mediated transcriptional programming. Nature Methods. 2015;12:326–328. doi: 10.1038/nmeth.3312. [DOI] [PMC free article] [PubMed] [Google Scholar]
- 46.Rotem A, et al. Alternative to the soft-agar assay that permits high-throughput drug and genetic screens for cellular transformation. Proceedings of the National Academy of Sciences. 2015;112:5708–5713. doi: 10.1073/pnas.1505979112. [DOI] [PMC free article] [PubMed] [Google Scholar]
- 47.Miura Y, et al. Susceptibility to killer T cells of gastric cancer cells enhanced by Mitomycin-C involves induction of ATBF1 and activation of p21 (Waf1/Cip1) promoter. Microbiol Immunol. 2004;48:137–145. doi: 10.1111/j.1348-0421.2004.tb03491.x. [DOI] [PubMed] [Google Scholar]
- 48.Wong CC, et al. Inactivating CUX1 mutations promote tumorigenesis. Nat Genet. 2014;46:33–38. doi: 10.1038/ng.2846. [DOI] [PMC free article] [PubMed] [Google Scholar]
- 49.Faraonio R, et al. p53 suppresses the Nrf2-dependent transcription of antioxidant response genes. Journal of Biological Chemistry. 2006;281:39776–39784. doi: 10.1074/jbc.M605707200. [DOI] [PubMed] [Google Scholar]
- 50.Gao Y, et al. Complex transcriptional modulation with orthogonal and inducible dCas9 regulators. Nature Methods. 2016;13:1043–1049. doi: 10.1038/nmeth.4042. [DOI] [PMC free article] [PubMed] [Google Scholar]
- 51.Kleinstiver BP, et al. Broadening the targeting range of Staphylococcus aureus CRISPR-Cas9 by modifying PAM recognition. Nat Biotechnol. 2015;33:1293–1298. doi: 10.1038/nbt.3404. [DOI] [PMC free article] [PubMed] [Google Scholar]
METHODS-ONLY REFERENCES
- 52.Lawrence MS, et al. Discovery and saturation analysis of cancer genes across 21 tumour types. Nature. 2014;505:495–501. doi: 10.1038/nature12912. [DOI] [PMC free article] [PubMed] [Google Scholar]
- 53.Forbes SA, et al. COSMIC: somatic cancer genetics at high-resolution. Nucleic Acids Research. 2017;45:D777–D783. doi: 10.1093/nar/gkw1121. [DOI] [PMC free article] [PubMed] [Google Scholar]
Associated Data
This section collects any data citations, data availability statements, or supplementary materials included in this article.
Supplementary Materials
Supplementary Table 1 List of sgRNAs and their measured activity values for the tiling library used as the input for training the model of SaCas9 activity rules.
Supplementary Table 2 List of sgRNAs in the SynLet library, annotated by their pre-defined functional group. The well positions are used to identify sgRNAs in figure legends.
Supplementary Table 3 Primary screening data for the SynLet library. Read counts and subsequent normalization for each of two or three biological replicates are provided, as well as the expected values for each individual sgRNA in the pair based on performance with control sgRNAs.
Supplementary Table 4 False discovery rate calculations for gene pairs in the SynLet library for individual cell lines, all leave-one-out combinations, and the combination of all 6 lines
Supplementary Table 5 List of sgRNAs in the Apoptosis Library.
Supplementary Table 6 Primary screening data for the Apoptosis library. Read counts and subsequent normalization for each of two or three biological replicates are provided, as well as the expected values for each individual sgRNA in the pair based on performance with control sgRNAs.
Supplementary Table 7 False discovery rate calculations for gene pairs in the Apoptosis library for individual cell lines and small molecule conditions, as well as combinations of conditions.
Supplementary Table 8 List of sgRNAs in the Tumor Suppressor – Oncogene (TsgOnco) library.
Supplementary Table 9 Primary screening data for the Tumor Suppressor – Oncogene library. Read counts and subsequent normalizations for each of the two biological replicates are provided.
Data Availability Statement
All screening data generated in this study are included in this published article and its supplementary information files. Data for small scale experiments that support the findings of this study are available from the corresponding author upon reasonable request.