

Abstract
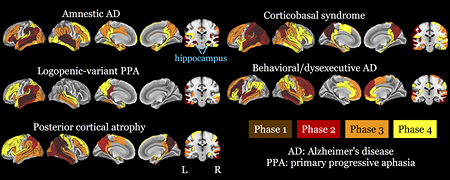
Amnestic Alzheimer’s disease is characterized by early atrophy of the hippocampus and medial temporal lobes before spreading to neocortex. In contrast, non-amnestic Alzheimer’s patients have relative sparing of the hippocampus, but the pattern in which disease spreads is unclear. We examined spreading disease in non-amnestic Alzheimer’s disease using a novel magnetic resonance imaging-based analysis adapted from pathologic staging studies, applied here to cross-sectional imaging data. We selected 240 T1-weighted scans from 129 patients with pathology confirmed by autopsy or cerebrospinal fluid, and atrophy maps were computed relative to 238 scans from 115 elderly controls. For each phenotype, the frequency of atrophy in 116 brain regions was used to infer the anatomical origin of disease and its progression across 4 phases of atrophy. Results from the amnestic cohort were used to determine appropriate parameter settings for the phase assignment algorithm, based on correspondence to Braak pathology staging. Phase 1 regions, which represent the origin of disease, included hippocampus for the amnestic group (comprising 33 scans); left lateral temporal lobe for logopenic-variant primary progressive aphasia (88 scans); occipito-parietal cortex for posterior cortical atrophy (51 scans); temporo-parietal cortex for corticobasal syndrome (31 scans); and fronto-temporal cortex for behavioral/dysexecutive variant Alzheimer’s disease (37 scans). In non-amnestic patients atrophy spread to other neocortical areas in later phases, but the hippocampus exhibited only late-phase atrophy in posterior cortical atrophy and corticobasal syndrome. Region-specific phase values were also associated with regional measures of tau, amyloid-beta, neuronal loss, and gliosis for the subset of patients (n=17) with neuropathology findings; this comparison represented a first validation of the phase assignment algorithm. We subsequently assigned a phase to each patient scan based on the similarity of regional atrophy patterns with atrophy predicted for the corresponding phenotype at each phase. Scan-specific phases were correlated with disease duration as well as global and domain-specific cognition, supporting these phase values as global estimates of patients’ disease progression. Logistic regression models based on spatial overlap with model-predicted atrophy patterns reliably discriminated non-amnestic phenotypes from each other and from amnestic Alzheimer’s disease. The frequency-based phase assignment algorithm employed in the current study thus represents a promising approach for studying the neocortical origin and spread of disease in non-amnestic Alzheimer’s disease.
Graphical Abstract
1 Introduction
The Braak model (Braak and Braak, 1991; Braak et al., 2006) defines distinct stages of pathology in typical, amnestic Alzheimer’s disease (aAD) based on postmortem examination. Corresponding in vivo neuroimaging measures of progression including grey matter (GM) atrophy (Scahill et al., 2002; Whitwell et al., 2013) and tau PET imaging (Schwarz et al., 2016) parallel these postmortem results. However, atypical, non-amnestic AD (naAD) phenotypes differ from aAD patients both in patterns of underlying pathology (Gefen et al., 2012; Giannini et al., 2017; Josephs et al., 2013; Murray et al., 2011; Whitwell et al., 2012) and neuroimaging atrophy (Ossenkoppele et al., 2015a). These differences highlight a greater burden of neocortical disease and relative sparing of the hippocampus and medial temporal lobes (MTL) in naAD (Murray et al., 2011; Ossenkoppele et al., 2015a). In this study, we examine unique patterns of progressive disease in naAD phenotypes.
NaAD phenotypes are characterized by an initial non-amnestic presentation, phenotype-specific cognitive impairment, and focal disease in associated neocortical areas (Alladi et al., 2007; DuBois et al., 2014; Mendez et al., 2012). Postmortem studies have found primary AD pathology in approximately 70% of patients with logopenic-variant primary progressive aphasia (lvPPA; Giannini et al., 2017; Mesulam et al., 2014a,b), which is marked by left-lateralized atrophy in parietal and posterior temporal areas; recent evidence indicates that tau and amyloid accumulation are similarly lateralized in lvPPA (Martersteck et al., 2016; Ossenkoppele et al., 2016; Xia et al., 2017). These anatomical markers are accompanied by deficits in lexical access and repetition (Bonner et al., 2010; Gorno-Tempini et al., 2008, 2011). AD pathology is also found in approximately 70% of patients with posterior cortical atrophy (PCA; Crutch et al., 2017; Tang-Wai et al., 2004); these patients are distinguised by deficits in vision and visuospatial function, which may manifest as Balint’s syndrome and visuospatial neglect or agnosia (Dubois et al., 2014). Indeed, this variant has been recognized as an atypical presentation of AD pathology since it was first described by Benson et al. (1988). PCA patients exhibit atrophy in bilateral or right-hemisphere parietal, posterior temporal, and occipital lobes (Crutch et al., 2017). AD pathology is the primary cause in approximately 40% of patients with corticobasal syndrome (CBS; Murray et al, 2007; Burrell et al., 2013; Lee et al., 2011; Ouchi et al., 2014), characterized by widespread, often asymmetric atrophy in frontal, temporal and parietal lobes (McMillan et al., 2016). Clinically, CBS patients exhibit disturbances of motor function, spatial cognition, number processing, and other cortically-mediated cognitive functions (Medaglia et al., 2017; Morgan et al., 2011; Spotorno et al., 2014). CBS and PCA thus share clinical features and have an overlapping distribution of atrophy. Finally, a fourth naAD variant consists of a behavioral/dysexecutive syndrome (bvAD; also referred to as frontal-variant AD; Dubois et al., 2014; Johnson et al., 1999). BvAD patients have disturbances of social behavior (including apathy and disinhibition) or executive function coupled with atrophy in bilateral temporoparietal and frontal cortices (Blennerhassett et al., 2014; Dubois et al., 2014; Ossenkoppele et al., 2015b).
To date, differences between aAD and naAD have principally been investigated through cross-sectional comparisons. Consequently, most studies do not attempt to model the spread of disease over time. Understanding this progression in naAD is critical for diagnosis, clinical trial selection, and elucidating how AD pathology spreads throughout the brain. In the present study, we present models of disease progression in aAD and naAD based on T1-weighted MRI data, validated with comparison to pathological and neuropsychological data. The current analysis infers the anatomical origin of disease from the frequency of atrophy in each region within a patient cohort. Our model is inspired by autopsy staging studies of neurodegenerative patients pioneered by Braak and colleagues (Braak and Braak, 1991; Braak et al., 2003; Brettschneider et al., 2013), in which cross-sectional autopsy data is used to construct a hypothetical model of disease progression based on patterns of pathology across individuals. Here areas with the highest frequency of atrophy are interpreted as representing the origin of disease; areas with progressively lower frequencies of atrophy are interpreted as reflecting later stages of disease. Comparative investigation of the anatomical progression of disease in naAD phenotypes additionally allowed us to assess commonalities and differences in regional atrophy across these naAD variants. We predicted that the most frequently atrophied regions would be unique for each naAD phenotype and would correspond to previously reported loci of atrophy for each naAD variant, suggesting phenotypic differences in the anatomical origin of atrophy. Additionally, we expected that naAD variants would continue to display relatively less MTL atrophy and thus differ from aAD throughout the course of disease.
2 Materials and methods
2.1 Participant characteristics
A retrospective query was performed using the Integrated Neurodegenerative Disease Biobank (INDD, Toledo et al., 2014), a database from the Center for Neurodegenerative Disease Research (CNDR) of the University of Pennsylvania that gathers data from almost 15,000 subjects. A first gross selection was performed for patients recruited through the Penn Frontotemporal Degeneration Center (FTDC) or the Penn Memory Center with at least one MRI scan and either a confirmation of Alzheimer’s disease pathology through autopsy or no autopsy data at all (thus excluding different primary neuropathological diagnoses); this initial cohort numbered 3322 patients. Of these patients, 2060 also lacked cerebrospinal fluid (CSF) biomarker results and were excluded; and 432 patients had CSF data not consistent with AD pathology (total tau/beta-amyloid 1–42 ratio less than 0.34). The remaining 830 had either neuropathological or biomarker evidence of AD. We then reviewed the clinical diagnoses of these 830 patients, retaining only those with potentially relevant clinical syndromes (including aAD; non-amnestic mild cognitive impairment; lvPPA or an unspecified PPA variant; PCA, CBS or progressive supranuclear palsy (PSP); and frontal-variant AD, behavioral-variant frontotemporal dementia, or an unspecified behavioral/dysexecutive syndrome). This step resulted in the exclusion of 256 patients with clinical phenotypes of no interest for our research. Of the remaining 574 patients, we retained only those with scans performed on the same scanner (3.0-Tesla Siemens TIM Trio scanner) and with the same MRI protocol; this selection resulted in the final cohort of 129 patients. A detailed breakdown of the rates of AD pathology in phenotypes of interest (irrespective of MRI availability) is given in Supplementary Table 1.
Research protocols were approved by the Institutional Review Board of the University of Pennsylvania, and all patients or caregivers acting on their behalf gave informed written consent in accordance with the principles of the Declaration of Helsinki. All patients were clinically diagnosed by experienced neurologists from April 2001 to June 2016. Diagnoses were confirmed in consensus meetings by clinicians with expertise in dementia. General selection criteria included native English speaking ability; age of 45+ years; no evidence of major cerebrovascular disease, history of stroke or head trauma; and no comorbid psychiatric, neurodegenerative, or developmental disorders. Additional criteria included insidious onset, gradually progressive cognitive symptoms, and (for naAD patients) relatively preserved episodic memory. Patient MRIs were reviewed for cerebrovascular disease, hydrocephalus, or white matter lesions; however, GM atrophy was not considered in diagnosis in order to avoid circularity with imaging analyses. AD pathology was confirmed through autopsy (n=22) or cerebrospinal fluid (CSF) total tau/beta-amyloid 1–42 ratio greater than 0.34 (n=107); this cutoff discriminates AD pathology from normal cognition (Shaw et al., 2009) and frontotemporal lobar degeneration (FTLD) (Irwin et al., 2012) with high sensitivity and specificity. CSF protein quantification was performed using the Luminex platform or by enzyme-linked immunosorbent assay (ELISA); ELISA measurements were harmonized with Luminex values using published methods (Irwin et al., 2012).
Criteria for aAD followed McKhann et al. (2011) and included primary memory impairment plus deficits in one or more additional cognitive domains. Patients were classified as aAD if they followed an amnestic course across all observations; 6 patients initially diagnosed with amnestic mild cognitive impairment (aMCI) subsequently progressed to AD. Conversely, all scans for a patient with an initial non-amnestic presentation were analyzed as the same naAD phenotype, even if that patient subsequently developed memory deficits. Criteria for lvPPA were based on Gorno-Tempini et al. (2011): 24 of 41 cases met full criteria, while 17 of 41 met relaxed criteria allowing the presence of additional semantic or grammatical impairments or the preservation of sentence repetition abilities (Giannini et al., 2017). PCA diagnosis required visuospatial disturbances (e.g., deficits in object and spatial perception, visual neglect, or oculomotor apraxia) and preservation of other cognitive abilities (Crutch et al., 2017; Tang-Wai et al., 2004). CBS was diagnosed on the basis of asymmetric extrapyramidal symptoms, corticosensory loss, ideomotor apraxia, and deficits in spatial cognition (as well as other cognitive domains). Finally, bvAD cases were diagnosed on the basis of deficits in executive function or social behavior.
Demographic characteristics and Mini-Mental Status Exam (MMSE) total scores are shown in Table 1. The Philadelphia Brief Assessment of Cognition (PBAC; Avants et al., 2014a; Libon et al., 2011) was used to support patient diagnoses (Supplementary Figure 1). Demographic differences were assessed using analyses of variance (ANOVAs) with subsequent Tukey’s tests for pairwise comparisons (for continuous variables) and Χ2 tests (for dichotomous data). The threshold for statistical significance was p<0.05 (two-tailed) for all tests; post-hoc tests were Bonferroni-adjusted for multiple comparisons. Differences in age, disease duration, and Mini-Mental Status Exam (MMSE) score at time of baseline MRI scan were marginally significant [F(4, 124)=2.3, p<0.07; F(4,124)=2.0, p<0.1; and F(4,110)=2.4, p<0.06, respectively]; no pairwise differences on these variables were statistically significant (all p<0.1, corrected for multiple comparisons). Education did not differ between groups [F(4, 124)=1.1, p<0.4], nor did sex [Χ2(4)=0.8, p>0.95]. The aAD cohort’s mean age of 64.9 years facilitates comparison with naAD patients, who tend to have a younger disease onset, but it may limit generalization of aAD results to late-onset AD patients.
Table 1.
Participant characteristics at time of first scan. All continuous variables are reported as means (SD).
| Group | N (NMRI) | Age | Sex (% male) | Education | MMSE | Disease duration |
|---|---|---|---|---|---|---|
| Control | 115 (238) | 62.7 (8.2) | 41 | 15.9 (3.0) | — | — |
| aAD | 22 (33) | 64.9 (9.7) | 45 | 15.9 (2.8) | 18.3 (6.4) | 3.8 (2.3) |
| lvPPA | 41 (88) | 62.5 (7.2) | 39 | 16.2 (3.2) | 22.4 (5.8) | 3.0 (1.7) |
| PCA | 27 (51) | 59.4 (7.3) | 41 | 16.0 (2.5) | 22.2 (4.3) | 2.7 (2.0) |
| CBS | 17 (31) | 59.9 (7.0) | 41 | 14.5 (2.4) | 18.6 (6.7) | 3.9 (2.8) |
| bvAD | 22 (37) | 64.3 (8.2) | 50 | 15.8 (3.1) | 19.6 (8.4) | 4.0 (2.1) |
Patients were characterized on cognitive assessments within 6 months of MRI dates (Supplementary Table 4). Global cognition was evaluated by two multidomain assessment scales: the MMSE (Folstein et al., 1975) and the PBAC. Additionally, we analyzed multiple domain-specific cognitive tasks, including the Philadelphia Verbal Learning Test (PVLT; Libon et al., 2011), from which trials 1–5 total recall, delayed free recall, and recognition discrimination were analyzed; animal category fluency (Weintraub et al., 2009); F-letter fluency (Spreen and Strauss, 1998); forward and reverse digit span (Wechsler et al., 1987); the Rey Figure (Osterrieth, 1944; Rey, 1944) copy score; and Pyramids and Palm Trees (Howard and Patterson, 1992).
2.2 Neuroimaging sample selection
We retrospectively selected 279 T1-weighted anatomical MRI scans from cognitively normal seniors (controls) and 414 patient scans on the same 3.0-Tesla Siemens TIM Trio scanner. We limited the sample to T1-weighted scans acquired with a uniform protocol; this criterion excluded 39 scans. Quality scores were assigned on a 5-point scale by two raters blinded to each other (JP and FDR); an average score of 3/5 was required for inclusion. Cases in which these ratings resulted in differing opinions about whether to include a scan were resolved by consensus. This quality check excluded 117 scans, primarily due to patient head motion and poor tissue contrast. A single rater (FDR) similarly evaluated control scans, excluding 41 images. Patients could contribute multiple observations; however, in order to prevent overrepresentation of any individual, no patient could contribute more than three scans or 5% of the scans for a given phenotype, whichever was more inclusive. For patients with more than the allowable number of available scans, we first removed scans acquired within 3 months of each other; if the remaining scans still exceeded this limit, timepoints with an excessive amount of outliers (i.e., ROIs whose standardized volumes differed from the control mean by 3+ SD) were removed; and for those few patients who still exceeded the allowable number of scans at this point, we selectively removed scans to keep the widest temporal span between patient’s timepoints. These procedures excluded 18 scans. No additional constraints were placed on the time interval between scans; however, this interval was generally 6–12 months, and the mean interval between scans was 405.9 (SD=220.8) days; only 8 scans occurred within 3 months of another scan. The final sample comprised 238 scans from 115 controls and 240 scans from 129 patients (Table 1).
The frequency-based algorithm for phase assignment (section 2.4, “MRI phase assignment algorithm”) treated each scan as an independent observation, as this novel non-parametric method did not allow us to model patient-specific random effects. We thus performed supplementary analyses using only the first scan available for each patient (Supplementary Tables 6–7, Supplementary Figure 10). Analyses of associations with neuropathology and clinical variables (sections 2.6–2.7) used mixed-effects modeling to account for the inclusion of multiple observations from individual patients.
2.3 Neuroimaging acquisition and processing
All T1-weighted images were acquired axially with voxels of 0.98 mm × 0.98 mm × 1 mm in a 256 × 192 matrix, a repetition time of 1620 ms, inversion time of 950 ms, and flip angle of 15. Images were processed using the ANTsCorticalThickness function implemented in Advanced Normalization Tools (ANTS; Avants et al., 2014b; Tustison et al., 2014), which implements a symmetric diffeomorphic algorithm (Avants et al., 2011; Klein et al., 2009) with N4 bias-field correction (Sled et al., 1998; Tustison et al., 2010). Images were segmented into 6 classes (cortical GM, subcortical GM, deep white matter, CSF, brainstem, and cerebellum) using template-based priors. We selected 116 regions of interest (ROIs) from the Mindboggle label set (Klein et al., 2012), which were aligned to each T1-weighted image and intersected with GM probability maps to obtain GM volume estimates for each ROI. Volume was computed from voxels in each ROI with a GM probability greater than 50 percent. GM volumes were normalized by intracranial volume and converted to z-scores based on GM volume in control images. To control for changes over time in scanner hardware and acquisition methods, control groups were created for 3 acquisition periods: 2003–2008, 2008–2012 and 2012–2016. Patients and controls were pair-matched in each subgroup based on age at MRI, education, sex, race, and ethnicity. ROI volumes were statistically adjusted for age at MRI. We then performed outlier checks (i.e., z-scores with an absolute value > 3.0) to identify extreme values due to segmentation error or other artifacts. One scan with outlier values in more than 29 ROIs (representing 25% of the data for that scan) was excluded on this basis.
2.4 MRI phase assignment algorithm
We used a frequency-based phase assignment algorithm (Figure 1) to model disease progression in each cohort. Paralleling the approach of histopathology staging studies, areas with more frequent atrophy were assumed to represent areas of earlier disease. Areas with a normalized grey matter volume below a z-score threshold (see below) were considered atrophied. First, the ROI with the highest frequency of atrophy was found for each phenotype, and ROIs with atrophy between 90% (inclusive) and 100% of this value were designated Phase 1 regions. Similarly, Phases 2–4 comprised ROIs with atrophy rates of 80–90%, 70–80%, and 60–70% of this highest atrophy rate. Higher ROI phases thus represented late or inconsistent atrophy across participants. Regions that did not appear in Phases 1–4 represent a hypothetical “Phase 5”, i.e., regions expected to atrophy in more advanced stages of disease. ROI phase values were subsequently compared to regional measures of pathology (section 2.5, “Parameter choice based on comparison to Braak stages”, and section 2.6, “Associations with neuropathological measures”). Each MRI scan was then compared to the cumulative atrophy patterns predicted in Phases 1–4 for the corresponding phenotype. A scan was assigned the highest phase value for which it exhibited atrophy in at least 75% of the ROIs associated with that phase (as well as all preceding phases). This scan-specific phase value (hereafter referred to as “MRI phase” to distinguish from region-specific ROI phase values) was interpreted as a global measure of disease progression for that individual at the time of the scan; higher MRI phases thus indicated more severe global atrophy (Figure 1d). If a scan did not meet criteria for MRI Phase 1, it was classified as a “Phase 0” image.
Figure 1.

Frequency-based MRI phase assignment algorithm. Within each patient group, ROIs were ranked by frequency of atrophy. Phase 1 comprised ROIs with an atrophy frequency of 90–100 percent of the maximum frequency; Phase 2 represented ROIs atrophied in 80–90 percent of the maximum; Phase 3 included ROIs atrophied in 70–80 percent of the maximum; and Phase 4 included ROIs atrophied in 60–70 percent of the maximum. ROIs with less frequent atrophy constituted a hypothetical Phase 5, i.e., they were assumed to be atrophic only in late disease stages. Each scan was subsequently assigned the highest phase value for which it exhibited atrophy in at least 75 percent of the corresponding ROIs. Scans that did not meet criteria for Phase 1 are classified as “Phase 0” and assumed to reflect very mild disease progression.
2.5 Parameter choice based on comparison to Braak stages
The focus of the current study was disease progression in naAD; thus, the aAD group was used to determine appropriate parameters for ROI phase assignment. The chief parameter tested in this analysis was the z-score threshold used to classify regions as atrophic, which indicates GM volume in units of standard deviation relative to controls, adjusting for intracranial volume and age at time of scan. Threshold values of −2.0, −1.5, −1.0, −0.5, and 0 were assessed; we additionally varied the interval used to delineate one phase from another over values of 5, 10, and 15 percent. We determined the combination of parameters that maximized the association (measured by Spearman’s correlation) between ROI phases in the aAD model and Braak staging of AD pathology. Each ROI was assigned a Braak stage based on the earliest appearance of tau neurofibrillary tangle (NFT) pathology in that region, as described by Braak and colleagues (Braak and Braak, 1991, 1995; Braak et al., 2006). Because Braak stages 1–2 are generally thought to correspond to an asymptomatic state, and all patients in the current sample were symptomatic, Stages 1–2 regions were collapsed with Stage 3. The z-score threshold (−1.0) and frequency interval (10%) that produced the highest correlation (ϱ=0.35, p<0.001) were applied to the phasing analysis of naAD phenotypes (Figure 2).
Figure 2.

Scatterplot of ROI phases for the optimal aAD model vs. the stage in which tau neurofibrillary tangle pathology first appears, according to the Braak model. Numbers within each black circle indicate the number of data points overplotted in that circle. The blue line is the best-fit regression line. The optimal aAD model used a Z-score threshold of −1 to determine atrophy and a frequency interval of 10% to distinguish ROI phases. ROI phase was correlated with Braak stage (ϱ=0.35, p<0.001).
2.6 Associations with neuropathological measures
The MRI phase assignment algorithm was evaluated by assessing associations between ROI phase and postmortem histopathologic ratings from the Integrated Neurodegenerative Disease Database (Toledo et al., 2014). These ordinal ratings assessed phosphorylated tau (evaluated using anti-PHF1 antibody), β-amyloid plaques (stained with thioflavin-s), neuronal loss severity, and gliosis (both visually assessed) (Irwin et al., 2016; Montine et al., 2012). Amnestic AD patients were excluded from this analysis to avoid potential bias introduced by the parameter-fitting analysis described in the previous section. Histopathology was performed by expert neuropathologists (EBL and JQT) from the Center for Neurodegenerative Disease Research; data were available for 6 lvPPA, 3 PCA, 4 CBS, and 4 bvAD patients. All measures were represented by scores from 0 (absence of pathology) to 3 (most severe grade) with 6–9 distinct levels, sampled from 11 different regions from a single, randomly-selected hemisphere. The 11 rated regions were the amygdala, hippocampus (average of dentate gyrus and CA1/subiculum ratings), enthorinal area, middle frontal gyrus, angular gyrus, superior/middle temporal gyri, cingulate gyrus, occipital cortex, caudate/putamen, globus pallidus, and thalamus. We used linear mixed effects models (Laird and Ware, 1982) to test associations between these scores and ROI phases for corresponding regions in the same hemisphere. A random intercept term was included in the mixed-effects model to account for correlations among pathology measures from multiple regions. Additionally, we used general estimating equations (GEEs; Zeger et al., 1988) with a logit link function and exchangeable correlation structure to test the hypothesis that higher ROI phase (indicating later regional onset of atrophy) was associated with lower pathology scores. In this analysis, each pathology variable was binarized such that scores of 2 or higher represented a null outcome, while scores less than 2 represented a positive outcome. This coding scheme was used in order to yield an intuitively interpretable odds ratio (OR) from GEE models. The GEE method accounts for correlations among the binary pathology measures from multiple regions. ORs were computed by exponentiating the ROI phase coefficient from each GEE model; 95% confidence intervals (CIs) were computed by exponentiating the coefficient +/− 1.96 times its standard error. Finally, we compared the strength of association with ROI phase for each pair of pathology variables using GEEs that additionally included a factor of pathology measure (e.g., tau vs. amyloid) as well as its interaction with ROI phase. Due to the scarcity of autopsy data, all associations with pathology measures were analyzed by collapsing over phenotypes; each patient’s histopathology data were compared to ROI phases for the appropriate phenotype. In both linear mixed effects models and GEEs, disease duration at death was included as a covariate. For mixed effects and GEE models, the threshold for statistical significance was p<0.0125, corresponding to a threshold of p<0.05 with Bonferroni correction for tests of the 4 pathology measures.
2.7 Associations with clinical measures
Linear mixed-effects models were used to assess associations of MRI phase with age, disease duration, and neuropsychological performance. Fixed effects included MRI phase, phenotype, and (for cognitive measurements only) patients’ baseline values for each outcome, while a random effect of patient was used to model the dependency between repeated measurements collected for each participant across time.
2.8 Model-based discrimination of clinical phenotypes
To assess the similarity of atrophy patterns across naAD phenotypes, we first computed each scan’s similarity to model-predicted atrophy patterns for all phenotypes using the Sørensen-Dice coefficient (Yushkevich et al., 2010). In pairwise phenotype contrasts, we computed each scan’s similarity to both the true and contrasting phenotypes in the MRI phase associated with that scan. We then used logistic regression to classify each scan based on these similarity values; discrimination was assessed in terms of sensitivity and specificity. The analyses presented in Figure 6 included patients from all MRI phases; Supplementary Figures 8–9 present separate analyses in early and late disease (MRI phases 1–2 and 3–4, respectively). In each model, the phenotype represented by more scans formed the reference group of the regression model (i.e., the “control” outcome), while the phenotype with the smaller sample formed the positive outcome (i.e., “cases”). Clinically similar phenotypes were expected to exhibit more similar patterns of atrophy, resulting in poorer discrimination; clinically dissimilar phenotypes were expected to be well differentiated by patterns and thus have good discriminability.
Figure 6.

Phenotype discriminability based on disease progression models. Each panel represents a logistic regression model trained to discriminate between two AD phenotypes. Each point represents a single scan from a patient with one of the two clinical phenotypes. The x- and y-axes represent spatial overlap (expressed by Sorensen-Dice coefficients) between the binary atrophy map for a single scan and the model-predicted atrophy map for the appropriate phenotype and MRI phase. Sen: sensitivity, indicating proportion of scans correctly identified for the phenotype on the y-axis; Spec: specificity, indicating scans correctly identified for the phenotype on the x-axis.
Sample sizes did not permit testing in an independent validation cohort. Furthermore, methods such as leave-one-out or k-fold cross-validation were not well suited to our frequency-based algorithm, as each iteration of cross-validation would generate a new phase model for each phenotype, with substantial variation in the number of classificatory features (i.e., the number of ROIs newly atrophied in each phase). We thus present discrimination results for the study cohort, with the caveat that discrimination performance in independent datasets must be assessed in future research. Supplementary Figure 10 illustrates discrimination results when the dataset was restricted to the first scan available for each patient, thus eliminating possible patient-specific bias.
3 Results
3.1 Atrophy originates in and progresses throughout the neocortex in naAD
We observed a unique distribution of atrophy for each phenotype. As in autopsy studies of pathology, which assume that areas commonly affected across the brains of both mild and more advanced patients are chronologically the first to develop such pathology, Phase 1 ROIs are interpreted as the anatomical origin of atrophy (Figure 3 and Supplementary Figures 2–6). Over phases 1–4, the aAD group showed severe involvement of medial and lateral temporal lobes with slight right lateralization. Phase 1 ROIs for the aAD group included right hippocampus and superior temporal gyrus (STG) as well as bilateral middle temporal gyrus (MTG), left anterior insula, and left supramarginal gyrus (SMG). In subsequent phases, this atrophy appeared to spread to the left hippocampus and bilateral MTL; left lateral temporal, parietal, and ventral prefrontal lobes; right temporal and dorsal prefrontal lobes; and bilateral medial parietal regions. In comparison, naAD groups exhibited unique profiles of progression that differed from aAD. The lvPPA cohort exhibited strong asymmetry, with frequent atrophy in Phase 1 focused on left MTG and STG. The lvPPA model indicated progression to ipsilateral parietal and frontal lobes and the contralateral temporal lobe. The PCA model indicated an asymmetric onset in Phase 1 in right angular (ANG) gyrus, superior parietal lobule (SPL), precuneus, SMG, and MTG; subsequent progression was notable throughout left parietal and bilateral temporal, occipital, and (to a lesser extent) frontal lobes. The CBS group exhibited a left-dominant atrophy onset, with Phase 1 involving left ANG, SMG, MTG, precuneus, and planum temporale as well as bilateral SPL; disease progression heavily involved the remaining neocortex, from lateral occipito-parietal regions to temporal and frontal cortices. Finally, Phase 1 ROIs in the bvAD model included left MFG, left anterior insula, and right MTG. This model indicated a subsequent spread of atrophy to bilateral prefrontal, temporal, and inferior parietal cortices. Notably, aAD was the only phenotype that showed early involvement of the hippocampus and MTL, which were relatively spared in the other phenotypes. Indeed, only the CBS and PCA groups exhibited hippocampal atrophy, which occurred in Phases 3–4. Atrophy patterns increasingly overlapped across phenotypes as disease progressed (Supplementary Figure 7), as indicated by a main effect of phase on model-based atrophy predictions [t(38)=−7.6, p<0.001]. Furthermore, ROIs with lower phase values were more severely atrophied: across phenotypes, mean adjusted volume for Phase 1 ROIs was −2.7 (1.3); for Phase 2, −2.1 (1.4); for Phase 3, −1.8 (1.4); for Phase 4, −1.5 (1.4); and for Phase 5, −0.5 (1.3). These means reflected a significant linear relationship between ROI phase and adjusted ROI volume [β=−0.32, t(27710)=−58.8, p<0.001]. Supplementary Table 5 shows the number of MRIs per phase by phenotype. Additionally, restricting the dataset to include only the first available scan for each patient yielded highly similar ROI phase assignments, particularly for Phase 1 (Supplementary Tables 6–7, Supplementary Figure 10).
Figure 3.

Results of the MRI phase assignment algorithm for each phenotype indicate a continuous anatomical progression of atrophy from early- to late-phase regions. Phase 1 (brown): putative anatomical origins of atrophy. Phase 2: red; Phase 3: orange; Phase 4: yellow. Left: cortical surface views of atrophic regions. Right: coronal slices through the hippocampus and precuneus. Hypothetical Phase 5 regions, comprising the remainder of the brain, are left uncolored.
3.2 ROI phase is associated with multiple histopathologic measures
In each phenotype, Phase 1 ROIs were few in number, consistent with a relatively focal disease origin; in contrast, the Phase 5 ROI category represented the largest category for each phenotype. Among early-phase brain areas, which begin to atrophy early in the disease course, nearly all exhibited severe pathology in postmortem examination. Conversely, late-phase brain areas, which were presumed to be atrophied only late in the disease course, had a wider distribution of pathology scores, including a higher proportion of regions with minimal pathology. In linear mixed effects models, all four neuropathological measurements were thus inversely associated with ROI phase in naAD phenotypes (Figure 4): tau burden [β=−0.14, t(168)=−3.2, p<0.005], β-amyloid plaque burden [β=−0.22, t(168)=−4.2, p<0.001], neuronal loss severity [β=−0.21, t(155)=−3.7, p<0.001], and gliosis [β=−0.20, t(162)=−3.8, p<0.001]. Similarly, analysis of binarized pathology outcomes indicated that higher ROI phase was associated with lower scores for all measures. The greatest effect based on OR magnitude was observed for tau pathology (OR=2.2, 95% CI=1.1, 4.1), followed by amyloid pathology (OR=1.7, 95% CI=1.1, 2.5), neuronal loss (OR=1.4, 95% CI=1.1, 1.8), and gliosis (OR=1.4, 95% CI=1.1, 1.7). In direct comparisons, however, associations with ROI phase did not significantly differ for any of the pathology variables analyzed (i.e., no interactions of ROI phase and variable type, all z<1.3, p>0.17).
Figure 4.

Associations between ROI phase and regional micropathology ratings. Top left: tau neurofibrillary tangle (NFT) burden; top right: β-amyloid burden; bottom left: neuronal loss; and bottom right: gliosis burden. Each data point represents one of 11 brain areas in one of 17 naAD patients. Numbers within each circle indicate the number of observations overplotted in that circle. The dashed black line in each plot is plotted from the slope and intercept terms of the corresponding linear mixed effects model.
3.3 Clinical profile is associated with MRI phase
Across the entire cohort, MRI phase was associated with disease duration [β = 0.71, t(109)=9.4, p<0.001], indicating that a 1-phase increment was associated with approximately 8.5 months of disease duration. Additionally, MRI phase was associated with two multidomain cognitive measures (Figure 5b–c): MMSE [β=−0.92, t(74)=−4.2, p<0.001] and PBAC [β=−1.1, t(17)=−2.7, p<0.05]. Figures 5d–i illustrate associations with MRI phase for domain-specific neuropsychological assessments: associations included measures of verbal learning and recall, lexicosemantic retrieval, executive control, short term and working memory, and visuospatial cognition (see regression coefficients in figure). MRI phase was not associated with recognition [β=−0.01, t(37)=−1.2, p<0.3], letter fluency [β=−0.3, t(51)=−2.0, p<0.06], or the Pyramids and Palm Trees task (word stimuli, even trials only) [β=−0.3, t(21)=−2.0, p<0.06].
Figure 5.

Associations between MRI phase and (a) disease duration or (b–i) neuropsychological performance. Each data point represents a single observation associated with a single scan. All phenotypes are plotted together; the x-axis indicates the MRI phase associated with each scan, as a measure of disease progression. Each plot title includes the regression coefficient for the association with MRI phase, the number of observations in each analysis, and the p-value for the MRI phase regression coefficient.
3.4 Logistic regression based on MRI phase models discriminates clinical phenotypes
Logistic regression models accurately distinguished AD phenotypes based on similarity to atrophy patterns predicted by phase models (Figure 6). Moreover, sensitivity and specificity varied with the clinical similarity of AD phenotypes. Perfect separation was observed for comparison of bvAD scans (which most frequently exhibited prefrontal and temporal atrophy) to both PCA and CBS scans (which exhibited frequent parietal and posterior temporal atrophy). The contrast of PCA and CBS yielded the poorest performance of all 10 models, reflecting similar atrophy in these two phenotypes. Atrophy patterns in aAD and naAD became more similar with higher MRI phases (Supplementary Figure 7), reflecting the convergence of phenotypes in advanced disease; however, sensitivity and specificity values remained high in late phases (3–4) and did not differ from discrimination performance in early (1–2) disease phases (both t<1.2, p>0.2; see Supplementary Figures 8–9). When disease progression models were calculated based on a restricted dataset, including only the earliest observation for each patient, the resulting discrimination analyses (Supplementary Figure 10) produced decreased sensitivity (mean change: 11.8%; SD: 12.5%) and specificity (mean change: 3.8%; SD: 5.2%). However, model performance remained well above chance (mean accuracy: 87.1%; range: 66.7–100%).
4 Discussion
4.1 Anatomical progression of disease in non-amnestic AD
The present study demonstrates unique atrophy signatures for each phenotype in the earliest stages of naAD. Furthermore, in one of the largest neuroimaging samples of naAD assembled to date, we provide a detailed model of spreading disease in each phenotype based on methods derived from autopsy studies. Our findings corroborate the hypothesis that naAD patients have a neocortical origin of disease that differs according to clinical phenotype, and that this disease progresses over time throughout the neocortex while leaving the hippocampus and MTL relatively intact. This patterns contrasts with aAD, where the hippocampus and MTL are involved early in disease. Although these profiles of disease progression converge over time, MRI-based phase models allowed us to distinguish between similar clinical phenotypes even in advanced disease.
In each naAD phenotype, Phase 1 regions encompassed unique and canonical areas of degeneration associated with clinical features that distinguish these syndromes, as reported in autopsy studies of patients with each phenotype: left temporal and inferior parietal areas for lvPPA (Gefen et al., 2012; Giannini et al., 2017); right temporo-parietal and bilateral occipital regions for PCA (Crutch et al., 2017; Tang Wai et al., 2004); bilateral posterior parietal and left temporal areas in CBS (McMillan et al., 2016); and prefrontal and temporal cortices in bvAD (Blennerhassett et al., 2014; Ossenkoppele et al., 2015b). As disease progressed, moreover, many areas of neocortex exhibited atrophy in common across phenotypes.
Importantly, the hippocampus and medial temporal lobes were relatively preserved in naAD: hippocampal atrophy was observed only in the PCA (Phase 4) and CBS (Phases 3–4) groups, and the parahippocampal gyrus did not appear among Phases 1–4 in any of the naAD phenotypes. These models thus support an association between naAD phenotypes and a hippocampal-sparing pattern of disease reported in some patients with AD pathology (Murray et al., 2011; Whitwell et al., 2012). This previous work demonstrated neuroimaging and clinical differences between AD subtypes; the current study not only corroborates those differences but demonstrates how distinct disease courses in naAD phenotypes can all lead to this hippocampal-sparing end stage.
4.2 Pathological evaluation of frequency-based ROI phases
The algorithm used to construct MRI-based progression models was validated by multiple pathological measures. ROI phases for the aAD model were significantly associated with the Braak stages in which these areas first exhibited NFT pathology (Braak and Braak, 1991, 1995; Braak et al., 2006). This association supports the inference that the most commonly atrophied ROIs reflect the anatomical origins of atrophy; these areas are also assumed to represent areas of initial pathology accumulation. Furthermore, we evaluated disease progression models by comparing them with available histopathology results. ROI phase values for each phenotype model were significantly associated with multiple markers of pathology, including not only NFT burden but also amyloid plaques, gliosis, and neuronal loss. These findings support the biological validity of the phase assignment algorithm, including the assumption that atrophy frequency reflects the chronology of disease. Determining the optimal pathologic predictors of atrophy and disease progression will be valuable for translating imaging results into predictions of pathology accumulation and disease risk.
The role of ROIs included in the hypothetical Phase 5 warrants closer investigation. These regions, which are presumed to represent areas of later involvement during the disease, account for the largest part of the brain map in each phenotype group. Analysis of associations with neuropathology indicated that Phase 5 regions were more likely than early-phase ROIs to have lower pathology scores, although high tau and amyloid burdens were still observed in a significant proportion of Phase 5 regions. The relative sparing of these ROIs from atrophy (and in some cases pathology) is intriguing and could indicate a protected status within the brain. In such a case, our assumption that all Phase 5 ROIs will (given indefinite time) develop atrophy may not be valid. An extended discussion of such possibilities is beyond the scope of the current study; nevertheless, the current findings raise further questions about the differential involvement of brain regions in naAD.
4.3 Clinical associations with MRI phase estimates
The clinical relevance of the MRI phases assigned to individual scans is supported by associations with multiple clinical measures, including disease duration as well as tests of general cognition, episodic memory, lexical retrieval, executive function, phonological short-term memory, and visuospatial function (Figure 5). These associations suggest that MRI phase represents the severity of patients’ clinical symptoms. Episodic memory recall was associated with MRI phase despite minimal hippocampal atrophy in naAD patients. In this context, we note that episodic recall depends on multiple brain regions for lexical retrieval, maintaining retrieval targets and instructions in working memory, and monitoring retrieval (e.g., Cruse and Wilding, 2009; Phillips et al., 2009; Wolk and Dickerson, 2011). No association between MRI phase and recognition memory was found. Indeed, recognition is often preserved in individuals with impaired recall; aAD patients had the lowest mean recognition score of the analyzed phenotypes (Supplementary Table 4). Similarly, semantic retrieval did not decline with increased MRI phase; however, this null result may reflect the fact that none of the naAD phenotypes investigated here is characterized by specific semantic deficits. Phase values were associated not only with cognition but also with disease duration, which can be difficult for clinicians to estimate due to omissions or inaccuracies in patient histories. These histories may be particularly flawed for naAD patients, who are often misdiagnosed in primary and secondary care facilities. In contrast, the MRI phase estimates described here are derived from imaging data; thus, they may offer an empirical measure of disease progression.
4.4 Comparison to extant findings in naAD
Prior analyses of atrophy in naAD have relied on standard cross-sectional analysis methods (e.g., between-group contrasts in case-control designs) because of the relative scarcity of naAD cases and the difficulty of assembling longitudinal imaging datasets in these phenotypes, particularly as many patients are diagnosed later in their disease course than aAD patients. Like the current study, one previous study employed a frequency-based method to identify clusters of co-atrophying ROIs in a cross-sectional dataset (Duara et al., 2013). In another study, MRI scans from mild naAD patients were ranked by the spatial extent of atrophy to represent greater or lesser progression of disease and were analyzed by quartiles to infer disease spread in key brain networks (Ossenkoppele et al., 2015a). In contrast to previous work, the current study incorporates data across a range of disease durations and severities. This variation facilitates the detection of linear associations between MRI-based phase scores and clinical measures.
Phenotype-specific results in the current study were consistent with previous findings. Recent work has confirmed the strong left-lateralization of disease in lvPPA with PET imaging measures of tau and amyloid pathology (Martersteck et al., 2016; Ossenkoppele et al., 2016; Xia et al., 2017); these pathologic accumulations are accompanied by asymmetric atrophy (Rogalski et al., 2016). In our atrophy progression model, atrophy originated in the left middle and superior temporal gyri, subsequently spreading to adjacent portions of inferior temporal and parietal cortices as well as medially to the posterior cingulate gyrus. Atrophy appeared in the right temporal lobe only in Phase 3, suggesting that bilateral atrophy is a marker of relatively advanced disease.
Conversely, atrophy in the PCA group was right-lateralized in Phase 1; Phase 2 included left superior and inferior parietal cortices. Recent consensus criteria for PCA describe a common bilateral parietal presentation (Crutch et al., 2017). However, PCA patients vary in the lateralization of hypoperfusion (Andrade et al., 2013; Kas et al., 2011), and at least one study has found biparietal atrophy with more severe involvement of the right hemisphere (Whitwell et al., 2007). Crutch et al. (2017) interpret heterogeneous PCA presentations in terms of variability along multiple dimensions of a single phenotype rather than as reflecting distinct subtypes of the disease. A larger, multi-site replication of the current analysis may thus find more symmetric progression of atrophy in PCA patients, originating in bilateral temporoparietal areas. Future analyses should also investigate the possibility of a different progression pattern in the less-frequent ventral occipitotemporal presentation of PCA (Crutch et al., 2017).
Phase 1 regions in CBS-AD patients included bilateral superior parietal lobes as well as the left precuneus, supramarginal gyrus, and temporal areas. Similar patterns of atrophy were observed by Medaglia et al. (2017) relative to elderly controls, and the authors reported greater left precuneus atrophy in CBS due to AD than in CBS due to other pathologies. The marked involvement of parietal cortex is also consistent with Whitwell et al.’s (2010) report that CBS due to AD was associated with greater parietal atrophy than CBS due to other pathologies. CBS typically involves asymmetric disease patterns (Boeve, 2011; Whitwell et al., 2010); thus, the leftward asymmetry observed in the current sample may be reduced or reversed in other cohorts.
Phase 1 regions for bvAD patients in the current study included both left prefrontal and right temporal cortices, with parietal involvement in later phases. Consistent with these results, Dronse et al. (2017) reported that bvAD patients have greater hypometabolism in prefrontal than posterior cortices, and that this pattern distinguishes bvAD patients from other AD phenotypes. Single-center autopsy studies assessing pathological heterogeneity in behavioral/dysexecutive patients are scarce; however, one of the largest such studies (Blennerhassett et al., 2014) confirmed that patients with AD pathology had a higher ratio of frontal:occipital pathology than in typical AD, and that this atypical distribution was associated with a behavioral/dysexecutive phenotype irrespective of the type of pathology (AD vs. FTLD). In contrast, one recent study of AD patients with behavioral and dysexecutive presentations (Ossenkoppele et al., 2015b) found that each of these groups exhibited atrophy primarily in posterior temporal and parietal cortices (although the combined behavioral/dysexecutive group had prefrontal atrophy in contrasts with controls and typical amnestic AD). These varied results suggest heterogeneity among bvAD patients that future studies may be able to resolve by distinguishing between initial behavioral vs. dysexecutive presentations (e.g., Ossenkoppele et al., 2015b) and by using uniform selection criteria.
4.5 Model-based discrimination of clinical phenotypes
Discrimination analyses allowed us to effectively distinguish naAD phenotypes from aAD and from each other. Clinically dissimilar phenotypes, such as bvAD and PCA or lvPPA and PCA, could be effectively distinguished from one another on the basis of atrophy alone, even in advanced disease (Figure 6 and Supplementary Figure 9). The efficacy of our disease progression models for distinguishing these phenotypes is likely to result from the fact that disease originates and spreads differently in these phenotypes: for example, bvAD and PCA patients have more anterior and posterior disease origins, respectively, while lvPPA and PCA patients differed in the lateralization of early-phase disease. Conversely, clinically similar syndromes such as PCA and CBS, which have similar profiles of cognitive impairment, have similar patterns of disease progression which make them more difficult to distinguish.
We caution that these discrimination analyses were implemented primarily to quantify the similarity of atrophy patterns across phenotypes. Due to sample size limitations, results could not be validated in an independent cohort, although such validation is a primary goal for future research. Discrimination for independently acquired scans (e.g., those collected on different scanners or with different MRI protocols) is likely to be lower than that observed in the current study. We note that in supplementary analyses including only the first available scan from each patient, both the sensitivity and specificity of model-based classification were reduced. These reductions may reflect an overall reduction in sample size (leading to greater noise in both disease progression models and the subsequent discrimination analyses); the elimination of patient-specific biases created by the inclusion of longitudinal data for a subset of patients; or a combination of the two factors.
Nevertheless, we demonstrate potential clinical applications of MRI-based disease progression models. A major challenge of clinical neuroscience research is translating group-average results to the individual patient. The current study provides a proof of concept for determining clinical phenotype from competing alternatives based on atrophy patterns. Although some phenotypes are easily distinguished from clinical observation without recourse to neuroimaging, in other cases they are more ambiguous. In such cases, disease progression models such as those presented in the current study can generate specific atrophy predictions conditioned upon disease severity.
4.6 Limitations
The present study focuses on naAD phenotypes that have different clinical and pathological characteristics than in aAD; thus, it is fundamentally more exploratory than an investigation of a well-studied disease phenotype. Moreover, although the current study includes one of the largest naAD imaging datasets to date, the cohort remains relatively small. Furthermore, the aAD reference group comprised patients with a relatively young age of onset, which facilitated comparison to naAD phenotypes but limits generalization to typical, late-onset aAD. Additionally, we note that the algorithm employed here is an inherently cross-sectional method, and a longitudinal dataset would be preferable for confirming correlations with clinical outcomes. However, the low incidence of naAD phenotypes complicates this goal, as acquiring a sufficiently large dataset requires many years, during which scanner hardware, software, and pulse sequences may undergo multiple changes, adding variability to the underlying data. Although ROI phases were significantly associated with histopathology, autopsy data were available for relatively few participants. As a consequence, pathological associations were computed across phenotypes. A larger clinical-pathological sample would allow us to evaluate these associations independently for each naAD phenotype and would additionally help us to better understand the relationship between gross atrophy and pathology, which is likely to be complex. Finally, sample sizes did not permit us to train and test discrimination models in separate cohorts. Future studies will investigate the replicability of these discrimination analyses in independently-acquired scans from naAD and aAD patients.
4.7 Future directions
By including information concerning disease progression over time, we hope that models such as those presented in the current study can be used to improve neuroimaging-based diagnosis and prognosis, e.g., by extending the current models to distinguish between naAD and clinically-overlapping phenotypes caused by non-AD pathology. Such an application would be consistent with the recommendation of Rogalski and colleagues (2016) to incorporate biomarker evidence into diagnosis of PPA subtypes: for example, non-fluent/agrammatic PPA (naPPA) is difficult to distinguish clinically from lvPPA but is typically due to non-AD pathology (Grossman, 2012; Rogalski et al., 2016). Giannini et al. (2017) found that impaired forward digit span was 94% sensitive and 62% specific for lvPPA due to AD relative to lvPPA due to other causes; it is likely that combining this clinical marker of AD pathology with an atrophy-based classification could improve patient diagnosis even further. Additionally, although we have focused on naAD in the current project, disease progression models are still needed for investigation of aAD. The present approach could be easily adapted to tau or amyloid PET imaging rather than grey matter atrophy; such PET-based models will be valuable for informing continuing debates regarding the temporal sequence of regional tau and amyloid accumulation in aAD.
5 Conclusion
Our disease progression models not only corroborate a neocortical disease origin in naAD, with preservation of the hippocampus and MTL, but additionally provide anatomically specific predictions of disease spread over time. Furthermore, we found that MRI-based phase models allowed us to distinguish naAD phenotypes from each other and aAD with high accuracy not only in early disease, when naAD phenotypes had highly distinct atrophy patterns, but also in later phases, when atrophy patterns became more similar between phenotypes. Continued research into spreading disease patterns is critical for evaluating how AD pathology propagates throughout the brain. Future clinical applications of such research could include using model-based phenotype discrimination to aid physicians in determining patients’ eligibility for treatment trials; however, such translational applications would first require extensive model validation in independent cohorts supported by gold-standard histopathology results. Further research is also required to identify genetic or environmental factors that contribute to the heterogeneity of disease patterns and clinical phenotypes in naAD.
Supplementary Material
Disease spread in non-amnestic Alzheimer’s disease (naAD) is not well understood.
We defined phases of atrophy in naAD from 240 structural brain images.
Neocortical atrophy patterns distinguished naAD variants, even in advanced disease.
Phase values were associated with clinical and histopathological disease measures.
In contrast to amnestic patients, naAD patients’ hippocampi remained largely intact.
Acknowledgments
This work was supported by grants from the Alzheimer’s Association (AARF-16-443681), National Institutes of Health (AG017586, AG010124, AG043503, and NS088341), BrightFocus Foundation (A2016244S), Dana Foundation, Newhouse Foundation, Wyncote Foundation, Arking Family Foundation, and the Italian Ministry of Education, University, and Research.
Footnotes
Disclosures: All authors confirm that they have no conflicts of interest to disclose.
Publisher's Disclaimer: This is a PDF file of an unedited manuscript that has been accepted for publication. As a service to our customers we are providing this early version of the manuscript. The manuscript will undergo copyediting, typesetting, and review of the resulting proof before it is published in its final citable form. Please note that during the production process errors may be discovered which could affect the content, and all legal disclaimers that apply to the journal pertain.
References
- Alladi S, Xuereb J, Bak T, Nestor P, Knibb J, Patterson K, Hodges JR. Focal cortical presentations of Alzheimer’s disease. Brain. 2007;130(10):2636–2645. doi: 10.1093/brain/awm213. https://doi.org/10.1093/brain/awm213. [DOI] [PubMed] [Google Scholar]
- Andrade K, Kas A, Samri D, Sarazin M, Dubois B, Habert MO, Bartolomeo P. Visuospatial deficits and hemispheric perfusion asymmetries in posterior cortical atrophy. Cortex. 2013;49(4):940–947. doi: 10.1016/j.cortex.2012.03.010. https://doi.org/10.1016/j.cortex.2012.03.010. [DOI] [PubMed] [Google Scholar]
- Avants BB, Libon DJ, Rascovsky K, Boller A, McMillan CT, Massimo L, … Grossman M. Sparse canonical correlation analysis relates network-level atrophy to multivariate cognitive measures in a neurodegenerative population. NeuroImage. 2014a;84:698–711. doi: 10.1016/j.neuroimage.2013.09.048. https://doi.org/10.1016/j.neuroimage.2013.09.048. [DOI] [PMC free article] [PubMed] [Google Scholar]
- Avants BB, Tustison NJ, Song G, Cook PA, Klein A, Gee JC. A reproducible evaluation of ANTs similarity metric performance in brain image registration. NeuroImage. 2011;54(3):2033–2044. doi: 10.1016/j.neuroimage.2010.09.025. http://doi.org/10.1016/j.neuroimage.2010.09.025. [DOI] [PMC free article] [PubMed] [Google Scholar]
- Avants BB, Tustison NJ, Stauffer M, Song G, Wu B, Gee JC. The Insight ToolKit image registration framework. Frontiers in Neuroinformatics. 2014b:8. doi: 10.3389/fninf.2014.00044. https://doi.org/10.3389/fninf.2014.00044. [DOI] [PMC free article] [PubMed]
- Benson DF, Davis RJ, Snyder BD. Posterior cortical atrophy. Archives of Neurology. 1988;45(7):789–793. doi: 10.1001/archneur.1988.00520310107024. [DOI] [PubMed] [Google Scholar]
- Blennerhassett R, Lillo P, Halliday GM, Hodges JR, Kril JJ. Distribution of pathology in frontal variant Alzheimer’s disease. Journal of Alzheimer’s Disease: JAD. 2014;39(1):63–70. doi: 10.3233/JAD-131241. https://doi.org/10.3233/JAD-131241. [DOI] [PubMed] [Google Scholar]
- Boeve BF. The Multiple Phenotypes of Corticobasal Syndrome and Corticobasal Degeneration: Implications for Further Study. Journal of Molecular Neuroscience. 2011;45(3):350. doi: 10.1007/s12031-011-9624-1. https://doi.org/10.1007/s12031-011-9624-1. [DOI] [PubMed] [Google Scholar]
- Bonner MF, Ash S, Grossman M. The New Classification of Primary Progressive Aphasia into Semantic, Logopenic, or Nonfluent/Agrammatic Variants. Curr Neurol Neurosci Rep. 2010;10:484–490. doi: 10.1007/s11910-010-0140-4. https://doi.org/10.1007/s11910-010-0140-4. [DOI] [PMC free article] [PubMed] [Google Scholar]
- Braak H, Alafuzoff I, Arzberger T, Kretzschmar H, Del Tredici K. Staging of Alzheimer disease-associated neurofibrillary pathology using paraffin sections and immunocytochemistry. Acta Neuropathologica. 2006;112(4):389–404. doi: 10.1007/s00401-006-0127-z. https://doi.org/10.1007/s00401-006-0127-z. [DOI] [PMC free article] [PubMed] [Google Scholar]
- Braak H, Braak E. Neuropathological stageing of Alzheimer-related changes. Acta Neuropathologica. 1991;82(4):239–259. doi: 10.1007/BF00308809. [DOI] [PubMed] [Google Scholar]
- Braak H, Braak E. Staging of Alzheimer’s disease-related neurofibrillary changes. Neurobiology of aging. 1995;16(3):271–278. doi: 10.1016/0197-4580(95)00021-6. [DOI] [PubMed] [Google Scholar]
- Braak H, Del Tredici K, Rüb U, de Vos RAI, Jansen Steur ENH, Braak E. Staging of brain pathology related to sporadic Parkinson’s disease. Neurobiology of Aging. 2003;24(2):197–211. doi: 10.1016/s0197-4580(02)00065-9. https://doi.org/10.1016/S0197-4580(02)00065-9. [DOI] [PubMed] [Google Scholar]
- Brettschneider J, Del Tredici K, Toledo JB, Robinson JL, Irwin DJ, Grossman M, … Trojanowski JQ. Stages of pTDP-43 pathology in amyotrophic lateral sclerosis. Annals of Neurology. 2013;74(1):20–38. doi: 10.1002/ana.23937. https://doi.org/10.1002/ana.23937. [DOI] [PMC free article] [PubMed] [Google Scholar]
- Burrell JR, Hornberger M, Villemagne VL, Rowe CC, Hodges JR. Clinical Profile of PiB-Positive Corticobasal Syndrome. PLoS ONE. 2013;8(4) doi: 10.1371/journal.pone.0061025. https://doi.org/10.1371/journal.pone.0061025. [DOI] [PMC free article] [PubMed] [Google Scholar]
- Cruse D, Wilding EL. Prefrontal cortex contributions to episodic retrieval monitoring and evaluation. Neuropsychologia. 2009;47(13):2779–2789. doi: 10.1016/j.neuropsychologia.2009.06.003. https://doi.org/http://dx.doi.org/10.1016/j.neuropsychologia.2009.06.003. [DOI] [PubMed] [Google Scholar]
- Crutch SJ, Schott JM, Rabinovici GD, Murray M, Snowden JS, van der Flier WM, … Fox NC. Consensus classification of posterior cortical atrophy. Alzheimer’s & Dementia. 2017 doi: 10.1016/j.jalz.2017.01.014. https://doi.org/10.1016/j.jalz.2017.01.014. [DOI] [PMC free article] [PubMed]
- Dronse J, Fliessbach K, Bischof GN, von Reutern B, Faber J, Hammes J, … Drzezga A. In vivo Patterns of Tau Pathology, Amyloid-β Burden, and Neuronal Dysfunction in Clinical Variants of Alzheimer’s Disease. Journal of Alzheimer’s Disease: JAD. 2017;55(2):465–471. doi: 10.3233/JAD-160316. https://doi.org/10.3233/JAD-160316. [DOI] [PubMed] [Google Scholar]
- Duara R, Loewenstein DA, Shen Q, Barker W, Greig MT, Varon D, … Dickson DW. Regional patterns of atrophy on MRI in Alzheimer’s disease: Neuropsychological features and progression rates in the ADNI cohort. Advances in Alzheimer’s Disease. 2013;02(04):135–147. https://doi.org/10.4236/aad.2013.24019. [Google Scholar]
- Dubois B, Feldman HH, Jacova C, Hampel H, Molinuevo JL, Blennow K, … Cummings JL. Advancing research diagnostic criteria for Alzheimer’s disease: the IWG-2 criteria. The Lancet Neurology. 2014;13(6):614–629. doi: 10.1016/S1474-4422(14)70090-0. https://doi.org/10.1016/S1474-4422(14)70090-0. [DOI] [PubMed] [Google Scholar]
- Folstein MF, Folstein SE, McHugh PR. “Mini-mental state”: a practical method for grading the cognitive state of patients for the clinician. Journal of Psychiatric Research. 1975;12(3):189–198. doi: 10.1016/0022-3956(75)90026-6. [DOI] [PubMed] [Google Scholar]
- Gefen T, Gasho K, Rademaker A, Lalehzari M, Weintraub S, Rogalski E, … Mesulam M-M. Clinically concordant variations of Alzheimer pathology in aphasic versus amnestic dementia. Brain. 2012;135(5):1554–1565. doi: 10.1093/brain/aws076. https://doi.org/10.1093/brain/aws076. [DOI] [PMC free article] [PubMed] [Google Scholar]
- Giannini LAA, Irwin DJ, McMillan CT, Ash S, Rascovsky K, Wolk DA, … Grossman M. Clinical marker for Alzheimer disease pathology in logopenic primary progressive aphasia. Neurology. 2017;88(24):2276–2284. doi: 10.1212/WNL.0000000000004034. https://doi.org/10.1212/WNL.0000000000004034. [DOI] [PMC free article] [PubMed] [Google Scholar]
- Gorno-Tempini ML, Brambati SM, Ginex V, Ogar J, Dronkers NF, Marcone A, … Miller BL. The logopenic/phonological variant of primary progressive aphasia. Neurology. 2008;71(16):1227–1234. doi: 10.1212/01.wnl.0000320506.79811.da. https://doi.org/10.1212/01.wnl.0000320506.79811.da. [DOI] [PMC free article] [PubMed] [Google Scholar]
- Gorno-Tempini ML, Hillis AE, Weintraub S, Kertesz A, Mendez M, Cappa SF, … Grossman M. Classification of primary progressive aphasia and its variants. Neurology. 2011;76(11):1006–1014. doi: 10.1212/WNL.0b013e31821103e6. https://doi.org/10.1212/WNL.0b013e31821103e6. [DOI] [PMC free article] [PubMed] [Google Scholar]
- Grossman M. The non-fluent/agrammatic variant of primary progressive aphasia. Lancet Neurology. 2012;11(6):545–555. doi: 10.1016/S1474-4422(12)70099-6. https://doi.org/10.1016/S1474-4422(12)70099-6. [DOI] [PMC free article] [PubMed] [Google Scholar]
- Howard D, Patterson K. Pyramids and Palm Trees: A Test of Semantic Access from Pictures and Words. Bury St. Edmonds, UK: Thames Valley Test Company; 1992. [Google Scholar]
- Irwin DJ, Byrne MD, McMillan CT, Cooper F, Arnold SE, Lee EB, … Trojanowski JQ. Semi-Automated Digital Image Analysis of Pick’s Disease and TDP-43 Proteinopathy. Journal of Histochemistry & Cytochemistry. 2016;64(1):54–66. doi: 10.1369/0022155415614303. https://doi.org/10.1369/0022155415614303. [DOI] [PMC free article] [PubMed] [Google Scholar]
- Irwin DJ, McMillan CT, Toledo JB, Arnold SE, Shaw LM, Wang LS, … Grossman M. Comparison of cerebrospinal fluid levels of tau and Aβ 1–42 in Alzheimer disease and frontotemporal degeneration using 2 analytical platforms. Archives of Neurology. 2012;69(8):1018–1025. doi: 10.1001/archneurol.2012.26. http://doi.org/10.1001/archneurol.2012.26. [DOI] [PMC free article] [PubMed] [Google Scholar]
- Johnson JK, Head E, Kim R, Starr A, Cotman CW. Clinical and pathological evidence for a frontal variant of Alzheimer disease. Arch Neurol. 1999;56:1233–1239. doi: 10.1001/archneur.56.10.1233. [DOI] [PubMed] [Google Scholar]
- Josephs KA, Dickson DW, Murray ME, Senjem ML, Parisi JE, Petersen RC, … Whitwell JL. Quantitative neurofibrillary tangle density and brain volumetric MRI analyses in Alzheimer’s disease presenting as logopenic progressive aphasia. Brain and Language. 2013;127(2):127–134. doi: 10.1016/j.bandl.2013.02.003. https://doi.org/10.1016/j.bandl.2013.02.003. [DOI] [PMC free article] [PubMed] [Google Scholar]
- Kas A, Souza D, Cruz L, Samri D, Bartolomeo P, Lacomblez L, … Sarazin M. Neural correlates of cognitive impairment in posterior cortical atrophy. Brain. 2011;134(5):1464–1478. doi: 10.1093/brain/awr055. https://doi.org/10.1093/brain/awr055. [DOI] [PubMed] [Google Scholar]
- Klein A, Andersson J, Ardekani BA, Ashburner J, Avants B, Chiang MC, … Hellier P. Evaluation of 14 nonlinear deformation algorithms applied to human brain MRI registration. Neuroimage. 2009;46(3):786–802. doi: 10.1016/j.neuroimage.2008.12.037. [DOI] [PMC free article] [PubMed] [Google Scholar]
- Klein A, Tourville J. 101 labeled brain images and a consistent human cortical labeling protocol. Frontiers in Brain Imaging Methods. 2012;6:171. doi: 10.3389/fnins.2012.00171. dx.doi.org/10.3389/fnins.2012.00171. [DOI] [PMC free article] [PubMed] [Google Scholar]
- Laird NM, Ware JH. Random-effects models for longitudinal data. Biometrics. 1982;38(4):963–974. [PubMed] [Google Scholar]
- Lee SE, Rabinovici GD, Mayo MC, Wilson SM, Seeley WW, DeArmond SJ, … Miller BL. Clinicopathological correlations in corticobasal degeneration. Annals of Neurology. 2011;70(2):327–340. doi: 10.1002/ana.22424. https://doi.org/10.1002/ana.22424. [DOI] [PMC free article] [PubMed] [Google Scholar]
- Libon DJ, Bondi MW, Price CC, Lamar M, Eppig J, Wambach DM, … Penney DL. Verbal Serial List Learning in Mild Cognitive Impairment: A Profile Analysis of Interference, Forgetting, and Errors. Journal of the International Neuropsychological Society. 2011;17(05):905–914. doi: 10.1017/S1355617711000944. https://doi.org/10.1017/S1355617711000944. [DOI] [PMC free article] [PubMed] [Google Scholar]
- Martersteck A, Murphy C, Rademaker A, Wieneke C, Weintraub S, Chen K, … Rogalski E. Is in vivo Amyloid Distribution Asymmetric in Primary Progressive Aphasia? Annals of Neurology. 2016;79(3):496–501. doi: 10.1002/ana.24566. https://doi.org/10.1002/ana.24566. [DOI] [PMC free article] [PubMed] [Google Scholar]
- McKhann GM, Knopman DS, Chertkow H, Hyman BT, Jack CR, Jr, Kawas CH, … Phelps CH. The diagnosis of dementia due to Alzheimer’s disease: Recommendations from the National Institute on Aging-Alzheimer’s Association workgroups on diagnostic guidelines for Alzheimer’s disease. Alzheimer’s & Dementia. 2011;7(3):263–269. doi: 10.1016/j.jalz.2011.03.005. https://doi.org/10.1016/j.jalz.2011.03.005. [DOI] [PMC free article] [PubMed] [Google Scholar]
- McMillan CT, Boyd C, Gross RG, Weinstein J, Firn K, Toledo JB, et al. Multimodal imaging evidence of pathology-mediated disease distribution in corticobasal syndrome. Neurology. 2016;87(12):1227–1234. doi: 10.1212/WNL.0000000000003119. http://doi.org/10.1212/WNL.0000000000003119. [DOI] [PMC free article] [PubMed] [Google Scholar]
- Medaglia JD, Huang W, Segarra S, Olm C, Gee J, Grossman M, Ribeiro A, McMillan CT, Bassett DS. Brain network efficiency is influenced by the pathologic source of corticobasal syndrome. Neurology. 2017;89:1373–1381. doi: 10.1212/WNL.0000000000004324. https://doi.org/10.1212/WNL.0000000000004324. [DOI] [PMC free article] [PubMed] [Google Scholar]
- Mendez MF, Lee AS, Joshi A, Shapira JS. Nonamnestic presentations of early-onset Alzheimer’s disease. American Journal of Alzheimer’s Disease and Other Dementias. 2012;27(6):413–420. doi: 10.1177/1533317512454711. https://doi.org/10.1177/1533317512454711. [DOI] [PMC free article] [PubMed] [Google Scholar]
- Mesulam MM, Rogalski EJ, Wieneke C, Hurley RS, Geula C, Bigio EH, … Weintraub S. Primary progressive aphasia and the evolving neurology of the language network. Nature Reviews Neurology. 2014;10(10):554–569. doi: 10.1038/nrneurol.2014.159. https://doi.org/10.1038/nrneurol.2014.159. [DOI] [PMC free article] [PubMed] [Google Scholar]
- Mesulam MM, Weintraub S, Rogalski EJ, Wieneke C, Geula C, Bigio EH. Asymmetry and heterogeneity of Alzheimer’s and frontotemporal pathology in primary progressive aphasia. Brain: A Journal of Neurology. 2014;137(4):1176–1192. doi: 10.1093/brain/awu024. https://doi.org/http://dx.doi.org/10.1093/brain/awu024. [DOI] [PMC free article] [PubMed] [Google Scholar]
- Montine TJ, Phelps CH, Beach TG, Bigio EH, Cairns NJ, Dickson DW, … Hyman BT. National Institute on Aging-Alzheimer’s Association guidelines for the neuropathologic assessment of Alzheimer’s disease: a practical approach. Acta Neuropathologica. 2012;123(1):1–11. doi: 10.1007/s00401-011-0910-3. https://doi.org/10.1007/s00401-011-0910-3. [DOI] [PMC free article] [PubMed] [Google Scholar]
- Morgan B, Gross RG, Clark R, Dreyfuss M, Boller A, Camp E, Liang T-W, Avants B, McMillan CT, Grossman M. Some is not enough: quantifier comprehension in corticobasal syndrome and behavioral variant frontotemporal dementia. Neuropsychologia. 2011;49:3532–3541. doi: 10.1016/j.neuropsychologia.2011.09.005. https://doi.org/10.1016/j.neuropsychologia.2011.09.005. [DOI] [PMC free article] [PubMed] [Google Scholar]
- Murray ME, Graff-Radford NR, Ross OA, Petersen RC, Duara R, Dickson DW. Neuropathologically defined subtypes of Alzheimer’s disease with distinct clinical characteristics: a retrospective study. The Lancet Neurology. 2011;10(9):785–796. doi: 10.1016/S1474-4422(11)70156-9. https://doi.org/10.1016/S1474-4422(11)70156-9. [DOI] [PMC free article] [PubMed] [Google Scholar]
- Murray R, Neumann M, Forman MS, Farmer J, Massimo L, Rice A, … Grossman M. Cognitive and motor assessment in autopsy-proven corticobasal degeneration. Neurology. 2007;68(16):1274–1283. doi: 10.1212/01.wnl.0000259519.78480.c3. https://doi.org/10.1212/01.wnl.0000259519.78480.c3. [DOI] [PubMed] [Google Scholar]
- Ossenkoppele R, Cohn-Sheehy BI, La Joie R, Vogel JW, Möller C, Lehmann M, … Rabinovici GD. Atrophy Patterns in Early Clinical Stages Across Distinct Phenotypes of Alzheimer’s Disease. Human Brain Mapping. 2015a;36(11):4421–4437. doi: 10.1002/hbm.22927. https://doi.org/10.1002/hbm.22927. [DOI] [PMC free article] [PubMed] [Google Scholar]
- Ossenkoppele R, Pijnenburg YAL, Perry DC, Cohn-Sheehy BI, Scheltens NME, Vogel JW, … Rabinovici GD. The behavioural/dysexecutive variant of Alzheimer’s disease: clinical, neuroimaging and pathological features. Brain. 2015b;138(9):2732–2749. doi: 10.1093/brain/awv191. https://doi.org/10.1093/brain/awv191. [DOI] [PMC free article] [PubMed] [Google Scholar]
- Ossenkoppele R, Schonhaut DR, Schöll M, Lockhart SN, Ayakta N, Baker SL, … Rabinovici GD. Tau PET patterns mirror clinical and neuroanatomical variability in Alzheimer’s disease. Brain. 2016:aww027. doi: 10.1093/brain/aww027. https://doi.org/10.1093/brain/aww027. [DOI] [PMC free article] [PubMed]
- Osterrieth PA. Archives de Psychologie. 1944. Le test de copie d’une figure complexe; contribution à l’étude de la perception et de la mémoire. [Google Scholar]
- Ouchi H, Toyoshima Y, Tada M, Oyake M, Aida I, Tomita I, … Shimohata T. Pathology and sensitivity of current clinical criteria in corticobasal syndrome. Movement Disorders. 2014;29(2):238–244. doi: 10.1002/mds.25746. https://doi.org/10.1002/mds.25746. [DOI] [PubMed] [Google Scholar]
- Phillips JS, Velanova K, Wolk DA, Wheeler ME. Left posterior parietal cortex participates in both task preparation and episodic retrieval. NeuroImage. 2009;46(4):1209–1221. doi: 10.1016/j.neuroimage.2009.02.044. https://doi.org/10.1016/j.neuroimage.2009.02.044. [DOI] [PMC free article] [PubMed] [Google Scholar]
- Rey A. Rey-Osterrieth Complex Figure Test. Lutz, FL: Psychological Assessment Resources; 1944. [Google Scholar]
- Rogalski E, Sridhar J, Rader B, Martersteck A, Chen K, Cobia D, … Mesulam M-M. Aphasic variant of Alzheimer disease: Clinical, anatomic, and genetic features. Neurology. 2016;87(13):1337–1343. doi: 10.1212/WNL.0000000000003165. https://doi.org/10.1212/WNL.0000000000003165. [DOI] [PMC free article] [PubMed] [Google Scholar]
- Scahill RI, Schott JM, Stevens JM, Rossor MN, Fox NC. Mapping the evolution of regional atrophy in Alzheimer’s disease: Unbiased analysis of fluid-registered serial MRI. Proceedings of the National Academy of Sciences. 2002;99(7):4703–4707. doi: 10.1073/pnas.052587399. https://doi.org/10.1073/pnas.052587399. [DOI] [PMC free article] [PubMed] [Google Scholar]
- Schwarz AJ, Yu P, Miller BB, Shcherbinin S, Dickson J, Navitsky M, … Mintun MS. Regional profiles of the candidate tau PET ligand 18F-AV-1451 recapitulate key features of Braak histopathological stages. Brain. 2016;139(5):1539–1550. doi: 10.1093/brain/aww023. https://doi.org/10.1093/brain/aww023. [DOI] [PubMed] [Google Scholar]
- Sled JG, Zijdenbos AP, Evans AC. A nonparametric method for automatic correction of intensity nonuniformity in MRI data. IEEE Transactions on Medical Imaging. 1998;17(1):87–97. doi: 10.1109/42.668698. https://doi.org/10.1109/42.668698. [DOI] [PubMed] [Google Scholar]
- Spreen O, Strauss E. Administration, norms, and commentary. Oxford University Press; Oxford: 1998. A compendium of neuropsychologial tests. [Google Scholar]
- Tang-Wai DF, Graff-Radford NR, Boeve BF, Dickson DW, Parisi JE, Crook R, … Petersen RC. Clinical, genetic, and neuropathologic characteristics of posterior cortical atrophy. Neurology. 2004;63(7):1168–1174. doi: 10.1212/01.wnl.0000140289.18472.15. https://doi.org/http://dx.doi.org/10.1212/01.WNL.0000140289.18472.15. [DOI] [PubMed] [Google Scholar]
- Toledo JB, Van Deerlin VM, Lee EB, Suh E, Baek Y, Robinson JL, … Trojanowski JQ. A platform for discovery: The University of Pennsylvania Integrated Neurodegenerative Disease Biobank. Alzheimer’s & Dementia: The Journal of the Alzheimer’s Association. 2014;10(4):477–484. e1. doi: 10.1016/j.jalz.2013.06.003. https://doi.org/10.1016/j.jalz.2013.06.003. [DOI] [PMC free article] [PubMed] [Google Scholar]
- Tustison NJ, Avants BB, Cook PA, Zheng Y, Egan A, Yushkevich PA, Gee JC. N4ITK: improved N3 bias correction. IEEE Transactions on Medical Imaging. 2010;29(6):1310–1320. doi: 10.1109/TMI.2010.2046908. https://doi.org/10.1109/TMI.2010.2046908. [DOI] [PMC free article] [PubMed] [Google Scholar]
- Tustison NJ, Cook PA, Klein A, Song G, Das SR, Duda JT, … Avants BB. Large-scale evaluation of ANTs and FreeSurfer cortical thickness measurements. NeuroImage. 2014;99:166–179. doi: 10.1016/j.neuroimage.2014.05.044. https://doi.org/10.1016/j.neuroimage.2014.05.044. [DOI] [PubMed] [Google Scholar]
- Wechsler D. Wechsler Memory Scale–Revised. San Antonio: The Psychological Corporation; 1987. [Google Scholar]
- Weintraub S, Salmon D, Mercaldo N, Ferris S, Graff-Radford NR, Chui H, Cummings J, DeCarli C, Foster NL, Galasko D, Peskind E, Dietrich W, Beekly DL, Kukull WA, Morris JC. The Alzheimer’s Disease Centers’ Uniform Data Set (UDS): the neuropsychologic test battery. Alzheimer Dis Assoc Disord. 2009;23:91–101. doi: 10.1097/WAD.0b013e318191c7dd. https://doi.org/10.1097/WAD.0b013e318191c7dd. [DOI] [PMC free article] [PubMed] [Google Scholar]
- Whitwell JL, Jack CR, Boeve BF, Parisi JE, Ahlskog JE, Drubach DA, Senjem ML, Knopman DS, Petersen RC, Dickson DW, Josephs KA. Imaging correlates of pathology in corticobasal syndrome. Neurology. 2010;75:1879–1887. doi: 10.1212/WNL.0b013e3181feb2e8. https://doi.org/10.1212/WNL.0b013e3181feb2e8. [DOI] [PMC free article] [PubMed] [Google Scholar]
- Whitwell J, Dickson D, Murray M, Senjem M, Gunter J, Spychalla A, … Josephs K. Rates of atrophy differ across pathologically defined subtypes of Alzheimer’s disease: A longitudinal MRI study. Alzheimer’s & Dementia: The Journal of the Alzheimer’s Association. 2013;9(4):P600. https://doi.org/10.1016/j.jalz.2013.05.1196. [Google Scholar]
- Whitwell JL, Dickson DW, Murray ME, Weigand SD, Tosakulwong N, Senjem ML, … Josephs KA. Neuroimaging correlates of pathologically defined subtypes of Alzheimer’s disease: a case-control study. The Lancet Neurology. 2012;11(10):868–877. doi: 10.1016/S1474-4422(12)70200-4. https://doi.org/10.1016/S1474-4422(12)70200-4. [DOI] [PMC free article] [PubMed] [Google Scholar]
- Whitwell JL, Jack CR, Kantarci K, Weigand SD, Boeve BF, Knopman DS, … Josephs KA. Imaging correlates of posterior cortical atrophy. Neurobiology of Aging. 2007;28(7):1051–1061. doi: 10.1016/j.neurobiolaging.2006.05.026. https://doi.org/10.1016/j.neurobiolaging.2006.05.026. [DOI] [PMC free article] [PubMed] [Google Scholar]
- Wolk DA, Dickerson BC. Fractionating verbal episodic memory in Alzheimer’s disease. NeuroImage. 2011;54(2):1530–1539. doi: 10.1016/j.neuroimage.2010.09.005. https://doi.org/10.1016/j.neuroimage.2010.09.005. [DOI] [PMC free article] [PubMed] [Google Scholar]
- Xia C, Makaretz SJ, Caso C, McGinnis S, Gomperts SN, Sepulcre J, … Dickerson BC. Association of In Vivo [18F]AV-1451 Tau PET Imaging Results With Cortical Atrophy and Symptoms in Typical and Atypical Alzheimer Disease. JAMA Neurology. 2017 doi: 10.1001/jamaneurol.2016.5755. https://doi.org/10.1001/jamaneurol.2016.5755. [DOI] [PMC free article] [PubMed]
- Yushkevich PA, Wang H, Pluta J, Das SR, Craige C, Avants BB, Weiner MW, Mueller S. Nearly Automatic Segmentation of Hippocampal Subfields in In Vivo Focal T2-Weighted MRI. Neuroimage. 2010;53:1208–1224. doi: 10.1016/j.neuroimage.2010.06.040. https://doi.org/10.1016/j.neuroimage.2010.06.040. [DOI] [PMC free article] [PubMed] [Google Scholar]
- Zeger SL, Liang KY, Albert PS. Models for longitudinal data: a generalized estimating equation approach. Biometrics. 1988;44(4):1049–1060. [PubMed] [Google Scholar]
Associated Data
This section collects any data citations, data availability statements, or supplementary materials included in this article.