

Abstract
Therapeutic ex vivo T cell expansion is limited by low rates, and T-cell products of limited functionality. Here we describe a system that mimics natural antigen-presenting cells (APCs) and consists of a fluid lipid bilayer supported by mesoporous silica micro-rods. The lipid bilayer presents membrane-bound cues for T-cell receptor stimulation and costimulation, while the micro-rods enable sustained release of soluble paracrine cues. Using anti-CD3, anti-CD28 and interleukin-2, we show that the APC-mimetic scaffolds (APC-ms) promote two- to ten-fold greater polyclonal expansion of primary mouse and human T cells compared with commercial expansion beads (Dynabeads). The efficiency of expansion depends on the density of stimulatory cues and amount of material in the starting culture. Following a single stimulation, APC-ms enables antigen-specific expansion of rare cytotoxic T-cell subpopulations at a much greater magnitude than autologous monocyte-derived dendritic cells after two weeks. APC-ms support over 5-fold greater expansion of restimulated CD19 CAR-T cells than Dynabeads, with similar efficacy in a xenograft lymphoma model.
Introduction
T cell-based therapies are a promising approach to treat various diseases1–3, and have shown unprecedented clinical success for the treatment of B-cell acute lymphoblastic leukemia4–7 and non-Hodgkin’s lymphoma8. However, the rapid ex vivo expansion of functional T cells, a key step in the production of T cells for ACT, remains a challenge. T-cell activation requires three signals: (1) T-cell receptor (TCR) stimulation, (2) costimulation, and (3) pro-survival cytokines9. In the body, these signals are provided by antigen-presenting cells (APCs), which present these cues to T cells in specific spatiotemporal patterns9–12.
Various approaches are used to expand T cells ex vivo for ACT1,13,14. Among these, synthetic artificial APCs (aAPCs) are particularly convenient for polyclonal T cell expansion15–24. Currently, commercial microbeads (Dynabeads) functionalized with activating antibodies for CD3 (αCD3; TCR stimulus) and CD28 (αCD28; costimulatory cue) represent one of the most commonly used and clinically relevant synthetic systems14,25. These beads promote polyclonal T cell activation with exogenous interleukin-2 (IL-2) supplementation. Although these cultures provide T cells with the three critical signals, the context in which these signals are presented is not representative of how they are naturally presented by APCs. This can lead to suboptimal T cell expansion rates16,20 and T cell products with limited or dysregulated functions26,27. In addition, these beads are non-degradable and must be separated from the cell product prior to infusion, which can increase cost and manufacturing challenges25, and they are not amenable to the presentation of larger sets of co-stimulatory cues, which may be important for the generation of highly functional therapeutic T cells13,28. Autologous monocyte-derived dendritic cells (moDCs) represent another common system for the antigen-specific expansion of naïve and memory T cells. While their expanded T cell products have shown clinical success in cancer29–31, the use of moDCs are limited by lengthy cell manufacturing procedures, high variability among donor moDCs, and a need for routine restimulation32,33.
Here, we developed a composite material comprised of supported lipid bilayers (SLBs) formed on high aspect ratio mesoporous silica micro-rods (MSRs). The SLBs enabled the presentation of combinations of T cell activation cues at predefined densities on a fluid lipid bilayer. Functionalized SLBs have been used to study T cell activation and signaling34, and MSR have been used for drug delivery and vaccination35,36. MSR-SLBs facilitated the sustained paracrine release of soluble cues to nearby T cells, and following functionalization, enabled the presentation both surface and soluble cues to T cells in a context analogous to natural APCs. In cell culture, the rods formed a 3D scaffold, and these scaffolds formed from MSR-SLBs functionalized with T cell activation cues are termed APC-mimetic scaffolds (APC-ms). APC-ms promoted greater polyclonal and antigen-specific expansion of primary mouse and human T cells, and CD19 CAR-T cells, than conventional expansion systems, and represent a flexible and tunable platform technology that could enable the rapid expansion of highly functional T cells for ACT.
Results
Assembly and characterization of APC-ms
APC-ms were prepared (Fig. 1a) for 1) polyclonal T cell expansion using activating antibodies against CD3 (αCD3) and CD28 (αCD28), and for 2) antigen-specific T cell expansion using peptide-loaded MHC (pMHC) and αCD28 (Fig. 1b). High aspect ratio MSRs (70 μm length, 4.5 μm diameter, and 10.9 nm pores) were synthesized35,36 and adsorbed with IL-2 (Supplementary Fig. 1a). Liposomes (140 nm; Supplementary Fig. 1b) containing predefined amounts of a biotinylated-lipid were prepared, and coated onto IL-2-laden MSRs, forming MSR-SLBs. Biotinylated cues for TCR activation and costimulation were attached to the MSR-SLB surfaces via a streptavidin intermediate. In cell culture, 3D scaffolds spontaneously formed through the settling and random stacking of the rods, making APC-ms (Supplementary Video 1). T cells infiltrated the interparticle space of the scaffolds (Supplementary Video 2). APC-ms present cues for TCR-activation and costimulation on the surface of the lipid bilayer, and sustained release of soluble IL-2 to infiltrating T cells, similar to how these cues are presented to T cells by natural APCs9.
Figure 1. Antigen-presenting cell-mimetic scaffolds (APC-ms).
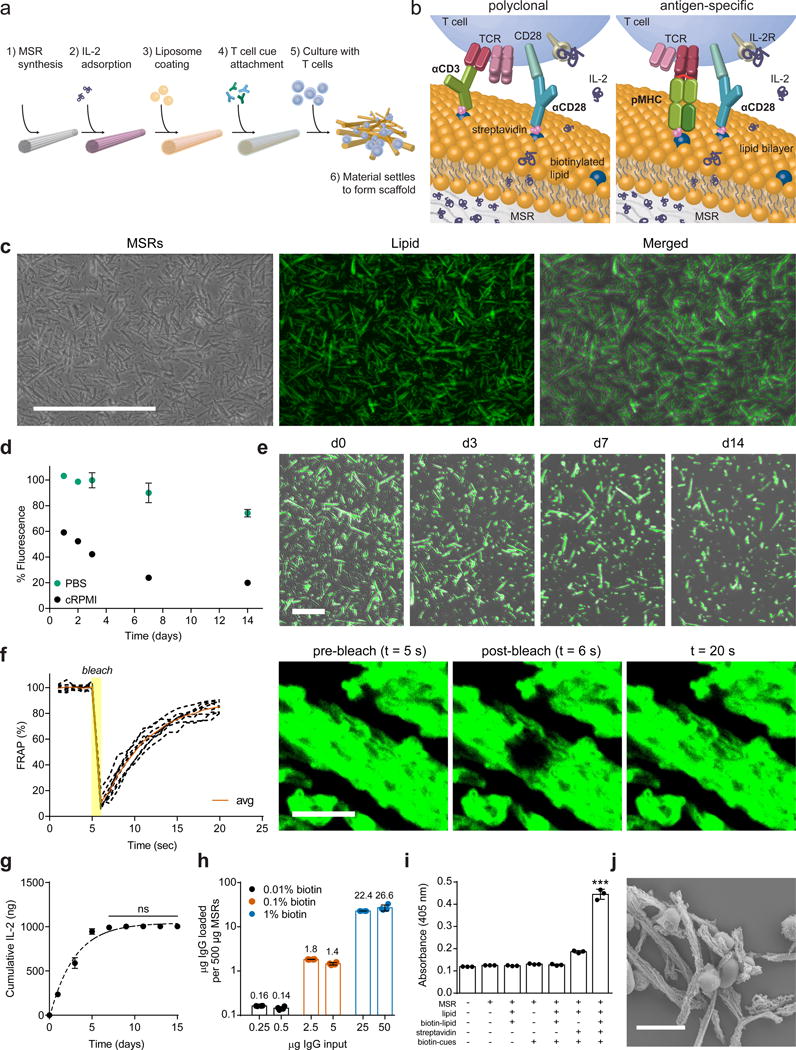
(a) Process for preparing APC-ms from mesoporous silica micro-rods (MSRs). (b) For polyclonal T cell expansion, activating antibodies against CD3 (αCD3) and CD28 (αCD28) are attached (left). For antigen-specific T cell expansion, peptide-loaded MHC (pMHC) and αCD28 are attached (right). In both, IL-2 was released over time, resulting in paracrine delivery to local T cells. (c) Representative microscopy of MSRs (left), fluorophore-tagged phospholipid (middle), and co-localization of MSRs and lipids (right). Scale bar=200 μm. (d) Retention of lipid on MSRs over time in either PBS or RPMI-1640 containing 10% serum (cRPMI) to mimic cell culture. (e) Representative images of lipid-coated MSRs maintained in cRPMI over time. Scale bar=100 μm. (f) Recovery of fluorescence over time in a photobleached region of MSRs coated with a lipid. Quantification of eight MSR-SLB samples (left). Confocal fluorescence microscopy images at various timepoints from representative experiment (right). Scale bar=10 μm. (g) IL-2 release in vitro (data points) with one phase exponential fit (dashed line; R2=0.98; ns, p≥0.9686). (h) Attachment of various inputs of biotinylated IgG onto 500 μg lipid-coated MSRs containing 0.01 mol%, 0.1 mol%, or 1 mol% biotinylated lipid. Values above bars indicate μg of IgG. (i) β-galactosidase activity as a measure of B3Z reporter T cell activation in response to culture with complete APC-ms, or material missing one or more components. ***p<0.001. (k) SEM image of primary human T cells with APC-ms. Scale bar=10 μm. Data in (d), (f-i) represent mean ± s.d. of at least three experimental replicates and are representative of at least two independent experiments. (g) analyzed using a repeated measures one-way ANOVA, followed by Tukey’s HSD post-hoc test. (i) analyzed using a one-way ANOVA, followed by Tukey’s HSD post-hoc test.
The liposomes used to coat MSRs were formed from phospholipid 1-palmitoyl-2-oleoyl-sn-glycero-3-phosphocholine (POPC), which is commonly used as a model for mammalian cell membranes37,38. At low lipid-to-MSR ratios (e.g. 1:20 w/w), the lipid-MSR suspensions underwent substantial aggregation (Supplementary Fig. 1c), while at higher lipid-to-MSR ratios (e.g. 1:4 w/w), lipid-MSR structures maintained a well dispersed, single-particle state (Fig. 1c). At this higher ratio, 34.1 ± 0.9% of the input POPC was initially associated with the MSRs. The POPC coating was slowly lost over time (Fig. 1d–e), corresponding to degradation of the MSRs. MSRs were also successfully coated with 1,2-dioleoyl-sn-glycero-3-phosphocholine (DOPC) and 1,2-distearoyl-sn-glycero-3-phosphocholine (DSPC). The amount of lipid associated with MSRs was directly related to the saturation of the lipid, (Supplementary Fig. 1d), likely due to tighter packing of more highly saturated lipids. No substantial differences were observed in the stability of various lipid coatings (Supplementary Fig. 1e–g). Fluorescence recovery after photobleaching (FRAP) studies revealed rapid recovery, demonstrating that the MSR lipid coatings were continuous, fluid SLBs (Fig. 1f).
We next characterized the loading and release of soluble cues, and the loading of surface cues, on MSR-SLBs. When 500 μg of MSRs were loaded with 2 μg of IL-2 and coated with lipid, 50 ± 1% of the input IL-2 was retained. The loaded IL-2 was subsequently released in a controlled manner over 7 days. The trend could be well-approximated using a one phase exponential function (R2=0.98), indicating that the release followed first-order kinetics (Fig. 1g). The cytokines IL-21 and TGF-β, could also be loaded into MSR-SLBs with high efficiency and subsequently released in a sustained manner (Supplementary Fig. 1h).
The attachment of surface cues was next quantified as we varied the amount of the biotinylated lipid species in the formulation. Streptavidin was added at 30% of the molar amount of biotinylated lipid groups on the respective MSR-SLBs, and biotinylated IgG was added as a surface cue proxy. At saturation, the maximal amount of biotinylated IgG that could be loaded onto the various MSR-SLB formulations differed by a factor of ~10 (Fig. 1h), consistent with the relative differences in the amounts of biotinylated lipid in the various MSR-SLB formulations, indicating precise control of IgG surface density by changing the amount of biotinylated lipid. In all subsequent experiments, MSR-SLBs were saturated with surface cues as described (forming APC-ms), using various formulations (Table 1).
Table 1.
Summary of APC-ms formulations.
| APC-ms formulation | Fraction of lipid presenting activating stimulus (mol%) | APC-ms in initial cell culture (μg/ml) | Activating stimulus presented on formulation (nM) | IL-2 loaded into formulation (μM) |
|---|---|---|---|---|
| A1 | 1 | 333 | 100 | 40 |
| A2 | 1 | 33 | 10 | 4 |
| A3 | 0.1 | 333 | 10 | 40 |
| A4 | 0.1 | 33 | 1 | 4 |
| A5 | 0.01 | 333 | 1 | 40 |
| A6 | 0.01 | 33 | 0.1 | 4 |
To confirm that surface cues attached in this way remained functional, either complete APC-ms (presenting αCD3 and αCD28) or MSR-SLBs missing one or more components, were cultured with B3Z reporter T cells, which provide a readout for T cell activation. Maximal activation of the B3Z cells required input of all the components (Fig. 1i). Lastly, to confirm that presentation of activation cues promoted T cell interactions, T cells were cultured either with APC-ms or MSR-SLBs without cues. Whereas T cells largely ignored MSR-SLBs without surface T cell cues, they interacted strongly with APC-ms, forming extensive, high density cell-material clusters (Fig. 1j, Supplementary Fig. 2).
Polyclonal expansion of primary mouse T cells
APC-ms formulations were benchmarked against commercial CD3/CD28 T cell expansion beads (Dynabeads) for the polyclonal expansion of primary mouse T cells isolated from C57BL/6J mice. Four permutations of APC-ms were generated by varying the density of surface cues and the amount of material input into the starting cell culture, as summarized in Table 1. To evaluate whether higher Dynabead doses would promote increased T-cell expansion, a dose response study was conducted, in which APC-ms formulations (A1-A4) were compared to Dynabeads added at either the manufacturer-recommended dose of a 1:1 bead-to-cell-ratio (D1), or at a 5:1 (D2) or 25:1 (D3) bead-to-cell ratio. By day 4, progressively larger bead-cell clusters were noted in Dynabead conditions as a function of increasing Dynabead dose, but these clusters did not persist past day 7 (Fig 2a). Culture with APC-ms similarly led to the formation of large cell-material clusters. The size, frequency, and persistence of these clusters was greater in APC-ms cultures than in Dynabead cultures, although these attributes varied depending on surface cue density and material input (Fig. 2b). Within the dose range tested, no substantial difference in expansion efficiency was observed among the various Dynabead conditions after 13 days of culture (Fig. 2c). In contrast, culture with the various APC-ms formulations yielded between three- to five-fold greater T cell expansion than all Dynabead conditions tested, with expansion efficiency dependent on the particular APC-ms formulation (Fig. 2c). T cells expanded in all conditions were highly viable (>80%; Supplementary Fig. 3a) and APC-ms lacking activation cues αCD3/αCD28 did not promote the activation and expansion of T cells (Supplementary Fig. 3b). Notably, despite promoting nearly 5-fold greater expansion than all Dynabead conditions tested after 13 days of culture, APC-ms formulation A4 yielded T cells that co-expressed the exhaustion markers PD-1 and LAG-3 at a frequency comparable to the Dynabead products (<9%; Fig. 3d).
Figure 2. Polyclonal expansion of primary mouse T cells.
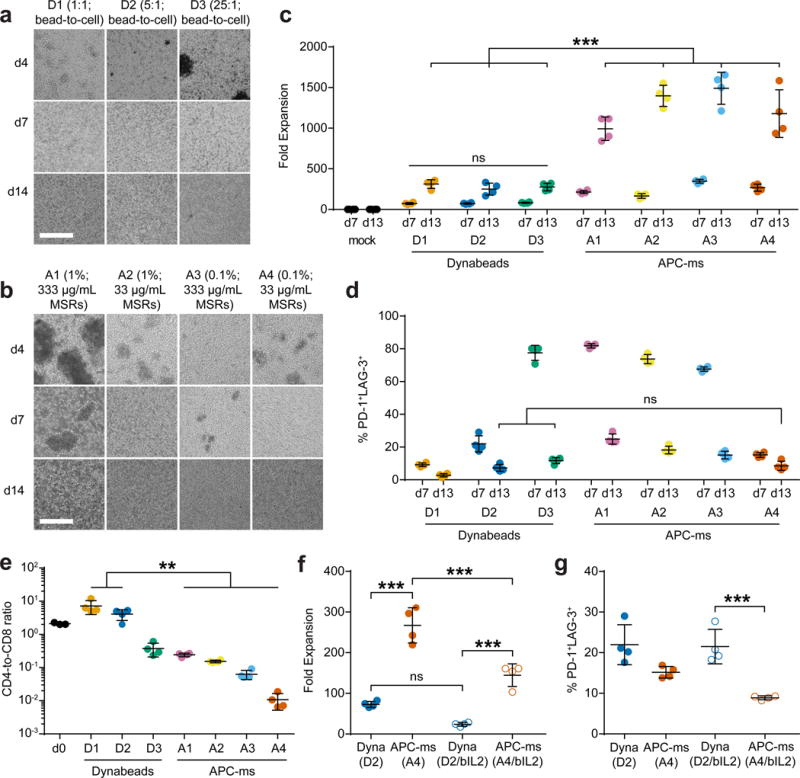
Representative brightfield microscopy images of primary mouse T cells cultured with (a) αCD3/αCD28 Dynabeads of varying doses (D1, D2, D3), or (b) APC-ms of varying formulations (A1, A2, A3, A4), at various timepoints (see Table 1). Scale bars=100 μm. (c) Expansion of primary mouse T cells that were either untreated (mock), or cultured with Dynabeads or APC-ms. ***p≤0.0001; ns, p≥0.9902. (d) FACS quantification of cells co-expressing PD-1 and LAG-3 among live CD3+ cells in samples cultured with Dynabeads or APC-ms. ns, p≥0.6163. (e) CD4-to-CD8 ratio of CD4+ and CD8+ single-positive cells among CD3+ cells cultured with Dynabeads or APC-ms, evaluated using FACS. *p≤0.0091. (f-g) Comparison of Dynabead (D2) and APC-ms (A4) formulations with matched αCD3/αCD28 dose, or Dynabead (D2/bIL2) and APC-ms (A4/bIL2) formulations with matched αCD3/αCD28 and IL-2 dose. A4/bIL2 was not pre-loaded with IL-2. D2/bIL2 and A4/bIL2 cultures were supplemented with the same amount of IL-2 as is typically loaded into APC-ms formulation A4 as a soluble bolus at the start of culture. (f) Day 7 expansion of primary mouse T cells cultured with either Dynabeads or APC-ms with matched doses of T cell cues. ***p≤0.001; ns, p=0.0843. (g) Quantification of cells co-expressing PD-1 and LAG-3 among CD3+ cells in samples cultured with Dynabeads or APC-ms with matched doses of T cell cues. ***p=0.0009. Data in (c-g) represent mean ± s.d. of n=4 mice and are representative of at least two independent experiments. (c-d) analyzed using a two-way ANOVA, followed by Tukey HSD post-hoc test. (e-g) analyzed using a one-way ANOVA, followed by Tukey HSD post-hoc test.
Figure 3. Polyclonal expansion of primary human T cells.
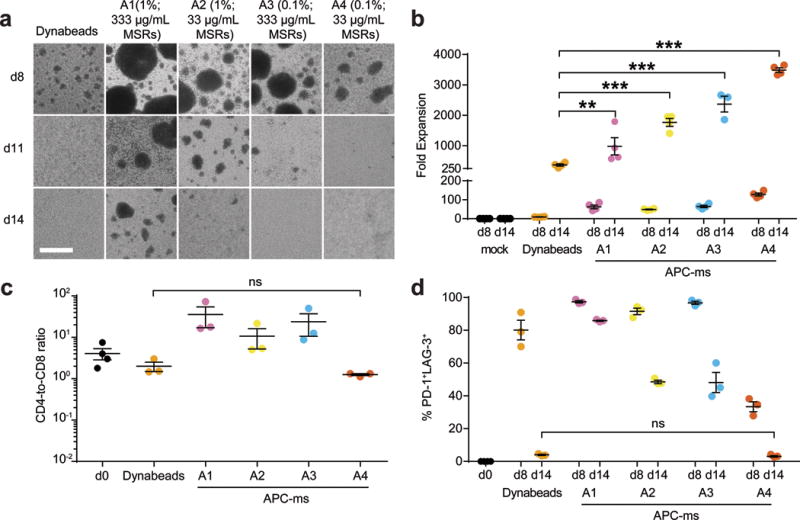
(a) Representative brightfield microscopy images of primary human T cells cultured with αCD3/αCD28 Dynabeads (1:1 bead-to-cell ratio) or APC-ms of varying formulations (A1, A2, A3, A4), at various timepoints (see Table 1). Scale bar=100 μm. (b) Expansion of primary human T cells that were either untreated (mock), or cultured with Dynabeads or with various APC-ms formulations. **p=0.0039, ***p≤0.0001. (c) CD4-to-CD8 ratio of CD4+ and CD8+ single-positive cells among live CD3+ cells cultured with Dynabeads or APC-ms of varying formulations, evaluated using FACS. ns, p>0.9999. (d) FACS quantification of cells co-expressing PD-1 and LAG-3 among CD3+ cells in samples cultured with Dynabeads or APC-ms of varying formulations. ns, p=0.9998. Data in (b-d) represent mean ± s.e.m. of different donor samples and are representative of at least two independent experiments. For (b): n=4. For (c) and (d): mock, n=4; Dynabeads and A1-A4, n=3. (b-d) analyzed using a two-way ANOVA, followed by Tukey HSD post-hoc test.
The CD4-to-CD8 T cell ratio was dependent on the Dynabead dose and the APC-ms formulation (Fig. 2e, Supplementary Fig. 3c). All tested APC-ms formulations promoted rapid and substantial CD8-biased skewing, with A3 and A4 promoting greater than 95% CD8+ T cells by day 13 of culture. In contrast, Dynabeads generally promoted primarily CD4-biased skewing except at very high Dynabead doses. We obtained similar results with T cells isolated from BALB/c mice (Supplementary Fig. 2d–e). CD8+ T cells expanded using APC-ms and Dynabeads upregulated Granzyme B to a comparable extent (Supplementary Fig. 3f). No expansion of CD4+ FoxP3+ regulatory T cells was observed with either Dynabead or APC-ms (Supplementary Fig. 3g).
To compare more rigorously Dynabeads and APC-ms, we quantified the amount of αCD3/αCD28 presented by Dynabeads to match the dose of T cell stimuli in APC-ms. We found that Dynabead dose D2 and APC-ms formulation A4 represented conditions in which the same total amount of αCD3/αCD28 was presented per cell (Supplementary Fig. 4). Under these αCD3/αCD28-matched conditions, APC-ms promoted substantially greater expansion of T cells than Dynabeads after 7 or 13 days of culture (Fig. 2c). To better understand the effect of IL-2 dose and loading IL-2 into APC-ms, we compared Dynabeads at dose D2 to a variant of APC-ms formulation A4 that was not pre-loaded with IL-2. These cultures were supplemented with the same amount of IL-2 as is typically loaded into A4 as a soluble bolus at the start of culture (D2/bIL2 and A4/bIL2, respectively). Under these matched conditions, APC-ms still promoted greater expansion of T cells than Dynabeads (Fig. 2f), while promoting similar or less upregulation of exhaustion marker co-expression (Fig. 2g). APC-ms also supported greater T-cell expansion when IL-2 was pre-loaded into the material (A4) than added as a soluble bolus (A4/bIL2), demonstrating the value of loading and release of IL-2 from the material (Fig. 2f).
Polyclonal expansion of primary human T cells
Next, we evaluated APC-ms for the polyclonal expansion of primary human T cells. Because we did not observe a dose-dependent effect with Dynabeads within the dose range tested for mouse T cell expansion, Dynabeads were used at the manufacturer-recommended dose of a 1:1 bead-to-cell ratio in all subsequent studies. Culture of primary human T cells led to the formation of consistently larger clusters in APC-ms than in Dynabead cultures, and the stability and persistence of clusters was dependent on surface cue density and material input (Fig. 3a). Culture with all the tested APC-ms formulations led to between two- to ten-fold greater expansion than with Dynabeads (Fig. 3b), with greater than 95% of cells viable at 14 days (Supplementary Fig. 5a). APC-ms formulations A1-A3, which presented relatively higher amounts of activating stimuli, promoted substantial CD4-biased skewing after 14 days. In contrast, formulation A4, which presented a relatively lower amount of activating stimuli, promoted more balanced CD4+ and CD8+ T cell expansion, comparable to Dynabeads (Fig. 3c). Despite promoting nearly 10-fold greater expansion than Dynabeads, APC-ms formulation A4 yielded a low frequency of PD-1 and LAG-3 co-expressing cells (<5%; Fig. 3d), similar to Dynabeads. No differences were observed between Dynabead- or APC-ms-expanded T-cell products in the co-expression of lymphoid homing molecules CCR7 and CD62L (Supplementary Fig. 5b), which has been shown to be important for function after in vivo transfer39.
Antigen-specific expansion of primary mouse T cells
We next investigated whether APC-ms would enable antigen-specific expansion of primary mouse CD8+ T cells. Anti-CD3 was replaced with a biotinylated H-2K(b) MHC class I monomer presenting SIINFEKL to afford the antigen-specific expansion of OT-1 cells. When OT-1 cells were cultured with these APC-ms formulations, extensive cell-material clusters formed (Fig. 4a). APC-ms formulations presenting SIINFEKL promoted robust expansion of OT-I CD8+ T cells, even with surface cues as low as 0.01 mol% of the lipids (formulations A5 and A6; Fig. 4b). When cultured with B16-F10 melanoma cells pulsed with SIINFEKL peptide, the expanded T cells recognized their cognate antigen and secreted IFNγ (Fig. 4c), upregulated the co-expression of IFNγ and TNFα (Fig. 4d), and killed target cells in vitro (Fig. 4e).
Figure 4. Antigen-specific expansion of primary mouse T cells.
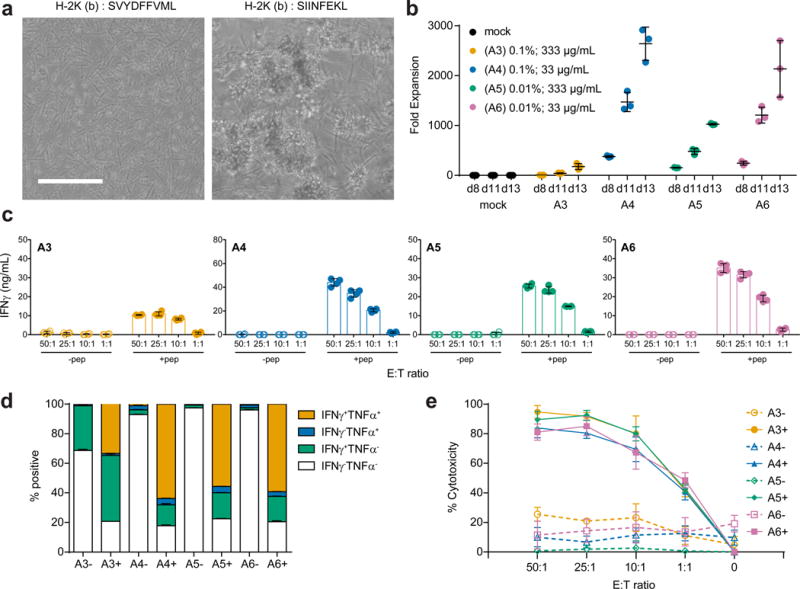
(a) Representative brightfield microscopy images of primary CD8+ OT-I T cells cultured for two days with APC-ms presenting an irrelevant peptide (SVYDFFVWL; left) or the relevant peptide (SIINFEKL; right) in H-2K(b). Scale bar=100 μm. (b) Expansion of primary CD8+ OT-I T cells that were either untreated (mock), or cultured with various APC-ms formulations (A3, A4, A5, A6; see Table 1). (c) Quantification of IFNγ secretion by CD8+ OT-I T cells expanded for 13 days with various APC-ms formulations in response to co-culture at various effector-to-target cell ratios with B16-F10 cells that were either mock pulsed (-pep), or pulsed with SIINFEKL peptide (+pep). (d) FACS quantification of IFNγ and TNFα expression by live CD8+ OT-I T cells expanded for 13 days with various APC-ms formulations and then co-cultured with B16-F10 cells that were either mock pulsed (-), or pulsed with SIINFEKL peptide (+). (e) Quantification of in vitro killing of mock-pulsed (-) or SIINFEKL-pulsed (+) B16-F10 target cells by CD8+ OT-I T cells that were expanded for 13 days with various APC-ms formulations, and then co-cultured at various effector-to-target cell ratios. Data in (b-e) represent mean ± s.d. of three experimental replicates and are representative of at least two independent experiments.
Antigen-specific expansion of primary human T cells
We next assessed whether APC-ms could be used for the antigen-specific enrichment and expansion of rare human T cell subpopulations, which could be useful for the selective expansion of rare cancer antigen-specific T cells from tumors40 or blood40,41, when relevant epitopes of interest are known. APC-ms (formulation A3) presenting one of two peptides (CLGGLLTMV or GLCTLVAML, abbreviated as CLG and GLC, respectively), from different Epstein-Barr virus (EBV)-associated proteins in the context of HLA-A*0201, were compared to autologous monocyte-derived dendritic cells (moDCs). moDCs are used clinically for antigen-specific expansion of therapeutic T cells29 and are considered the gold standard for such applications. CD8+ T cells were isolated from leukapheresis samples from EBV- experienced, HLA-A2+ donors and cultured with autologous moDCs or APC-ms that presented CLG or GLC, resulting in comparable expansion of the relevant CD8+ T cell subpopulations after 7 days of culture. Whereas frequencies of the relevant antigen-specific subpopulations decreased from days 7 to 14 in moDC-stimulated cultures, they continued to increase in APC-ms-stimulated cultures (Fig. 5a–d, Supplementary Fig. 6a–b). When cultured with CLG-presenting APC-ms, the frequency of CLG-specific CD8+ T cells increased from 0.12% at day 0 to 1.85% by day 7, and to 8.41% by day 14, corresponding to a ~31 and ~1,500-fold expansion, respectively (Fig. 5a–b, Supplementary Fig. 6a–b). When cultured with GLC-presenting APC-ms, the frequency of GLC-specific CD8+ T cells increased from 1.0% at day 0 to 1.3% by day 7, and to 15% by day 14, corresponding to a ~3.40 and ~355-fold expansion, respectively (Fig. 5c–d, Supplementary Fig. 6a–b). Within each donor, the expansion of the relevant subpopulation was consistently greater than the expansion of the irrelevant subpopulation, indicating antigen-specific T cell activation. Total cell numbers did not vary substantially (including non CLG- or GLC-specific CD8+ T cells) between APC-ms and moDC cultures (Supplementary Fig. 6c). Data from these experiments are summarized in Supplementary Table 1. CD8+ T cells expanded with either CLG- or GLC-presenting APC-ms responded strongly to T2 cells presenting their cognate antigen, as indicated by IFNγ secretion (Supplementary Fig. 7a), IFNγ and TNFα co-expression (Fig. 5e, Supplementary Fig. 7b), and the in vitro killing of peptide-loaded target cells (Fig. 5f).
Figure 5. Antigen-specific expansion of primary human T cells from donor leukapheresis samples (a-f) and from PBMCs (g-j).
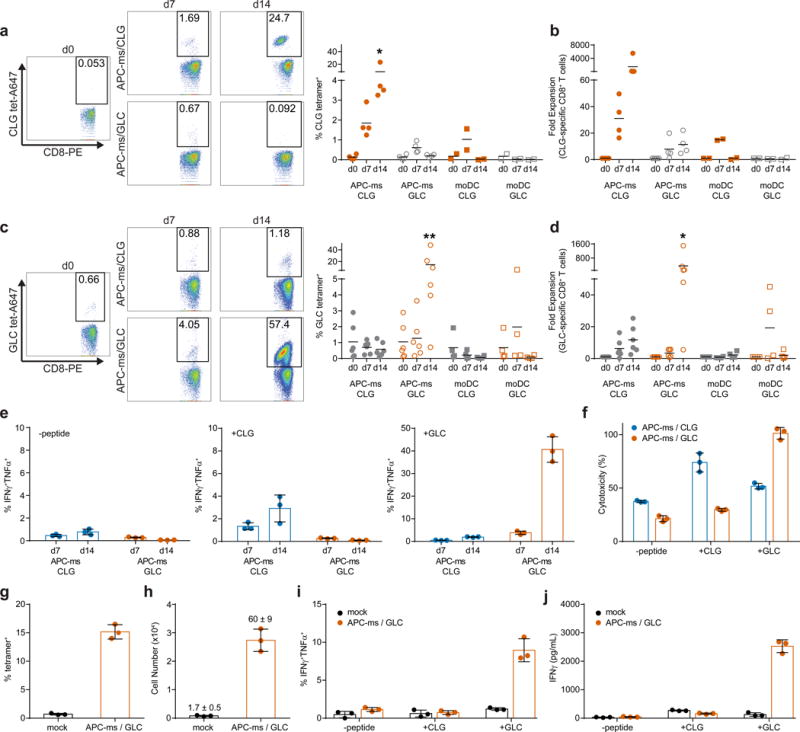
(a) and (c) Enrichment of live CD8+ cells specific for peptides CLGGLLTMV (CLG; a) and GLCTLVAML (GLC; c). *p≤0.0484, **p≤0.0018. Representative plots (left), and quantification (right), from HLA-A2+ donor T cells cultured with APC-ms presenting either CLG or GLC, or autologous moDCs pulsed with either CLG or GLC. (b) and (d) Fold expansion of CD8+ T cells specific for CLG (b) or GLC (d) cultured with APC-ms presenting CLG or GLC, or with autologous moDCs. *p≤0.0240. (e) Frequencies of IFNγ+TNFα+CD8+ T cells cultured with APC-ms presenting CLG or GLC, following co-culture with T2 target cells either unpulsed (-peptide; left), pulsed with CLG (+CLG; middle), or pulsed with GLC (+GLC; right). (f) In vitro killing of T2 target cells unpulsed (-peptide), or pulsed with CLG (+CLG) or GLC (+GLC), by CD8+ T cells expanded with APC-ms presenting CLG or GLC. (g-j) Frequency (g) and number (h) of GLC-specific cells among CD8+ T cells from PBMCs cultured in 30 U/ml IL-2 (mock), or with APC-ms presenting GLC. Values above bars in (g) denote fold expansion (mean ± s.d.). (i-j) Frequency of IFNγ+TNFα+CD8+ T cells (i), and IFNγ secretion (j), from PBMCs cultured in 30 U/ml IL-2 (mock), or with APC-ms presenting GLC, following co-culture with T2 cells that were unpulsed (-peptide), pulsed with CLG (+CLG), or pulsed with GLC (+GLC). Data in (a-d) are from different donor samples and are representative of at least three independent experiments. APC-ms/CLG, n=4; APC-ms/GLC, n=6; moDC/CLG, n=2; moDC/GLC, n=4. (a-d) analyzed using a two-way ANOVA, followed by Tukey’s HSD post-hoc test. Data in (e-j) represent mean ± s.d. of three experimental replicates and are representative of two independent experiments with n=2 donor samples.
Next, we investigated whether APC-ms could be used to expand specific T cell subpopulations directly from heterogeneous cell mixtures, such as PBMCs, obviating the need for T cell isolation. PBMCs from EBV+ HLA-A2+ donors were cultured with APC-ms that presented GLC. The frequency of GLC-specific CD8+ T cells in APC-ms-treated PBMC cultures increased rapidly from 0.66% to 15% at day 7, with minimal changes in mock-treated samples (Fig. 5g), corresponding to a 60-fold expansion of GLC-specific CD8+ T cells (Fig. 5h). These APC-ms-expanded responded robustly to T2 cells presenting their cognate antigen. Quantification of the frequency of cells co-expressing IFNγ and TNFα (Fig. 5i), and IFNγ secretion (Fig. 5j), demonstrated that CD8+ T cell populations expanded from PBMCs with GLC-presenting APC-ms responded robustly only to T2 cells that presented GLC.
To confirm that antigen-specific T cell expansion in APC-ms-treated PBMC cultures was not due to peptide presentation by PBMC-derived APCs, we depleted CD14+ cells from PBMCs and cultured these monocyte-depleted populations with APC-ms presenting CLG or GLC. Rapid, antigen-specific T cell expansion was again observed in these monocyte-depleted cultures, demonstrating that antigen-specific T cell expansion was not due to antigen presentation by endogenous APCs. Similar to the experiments with CD8+ T cell isolates, robust expansion of the relevant subpopulations was observed to continue from days 7 to 14 of culture (Supplementary Fig. 8a–b). Taken together, these data demonstrate the ability of APC-ms to robustly expand functional human T cells in an antigen-specific manner from either purified CD8+ T cells or heterogeneous cell populations such as PBMCs.
In vivo efficacy of APC-ms-expanded CAR T cells
Finally, to evaluate whether T cells expanded with APC-ms are functional in vivo, human T cells expressing a chimeric antigen receptor (CAR) specific for CD19 (19BBz T cells) were polyclonally re-stimulated with APC-ms (formulation A4) or Dynabeads, which are used clinically for the expansion of CAR T cells25. Following restimulation, APC-ms promoted over 5-fold greater expansion of 19BBz T cells than Dynabeads after 7 or 14 days of culture (Fig. 6a). After 7 days, the proportion of CAR+ T cells was higher with Dynabead expansion (59% versus 39%, Dynabeads vs. APC-ms), but there was no difference after 14 days (15% versus 12%, Dynabeads vs. APC-ms), presumably due to more efficient expansion of non-CAR+ T cells in the Dynabead condition (Fig. 6b). Whereas Dynabead-expanded 19BBz T cells underwent CD4-biased skewing, APC-ms-expanded 19BBz T cells preserved their initial CD4-to-CD8 ratio prior to restimulation (Fig. 6c, Supplementary Fig. 9a).
Figure 6. In vivo efficacy of re-stimulated 19BBz CAR T cells in a disseminated lymphoma xenograft model.
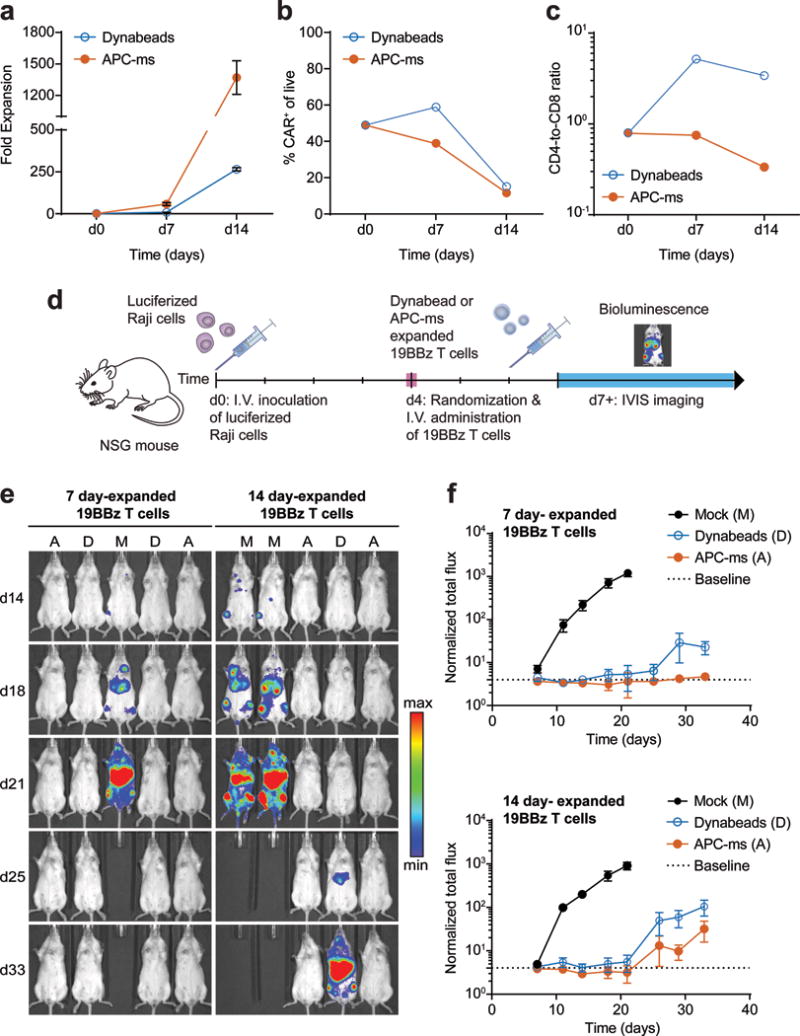
(a) Expansion of 19BBz T cells cultured with Dynabeads (dose D1) or with APC-ms (formulation A4; see Table 1). (b) FACS quantification of CAR expression among live cells in the final infusion product cultured with Dynabeads or APC-ms. (c) Frequencies of CD4 and CD8 single-positive cells among live CD3+ cells in the final infusion product cultured with Dynabeads or APC-ms. (d) Experimental overview of disseminated Raji xenograft model. (e-f) Bioluminescent imaging of NSG mice inoculated with luciferized Raji cells, and then either mock treated (M), or treated with 19BBz T cells expanded for either 7 or 14 days with Dynabeads (D) or APC-ms (A). The dotted line denotes the average luminescence of mice not administered luciferin at the first measured timepoint (d7) and represents baseline. Representative bioluminescent images (e) and quantification of bioluminescent signal (f). Data in (a) represent mean ± s.d. of three experimental replicates. Data in (f) represent mean ± s.e.m. For 7 day-expanded 19BBz T cells: mock, n=6; Dynabeads, n=6; APC-ms, n=6. For 14 day-expanded 19BBz T cells: mock, n=6; Dynabeads, n=7; APC-ms, n=7.
We tested the in vivo functionality of APC-ms-expanded 19BBz T cells in a disseminated xenograft model of Burkitt’s lymphoma using luciferized Raji cells (Fig. 6d). Prior to infusion of Dynabead-expanded 19BBz T cells, Dynabeads in the cell product had to be magnetically removed, whereas evaluation of silicon content in cell culture pellets over time confirmed the degradation of APC-ms prior to the time of cell infusion (Supplementary Fig. 9b). No adverse effects were observed in any of the mice treated with either 7 day or 14 day APC-ms-expanded 19BBz T cells. The anti-tumor efficacy of the cells was comparable (Fig. 6e–f, Supplementary Fig. 9c–d).
Discussion
Here, we demonstrate a multifunctional material that presents both surface and soluble cues to T cells in a manner that mimics how these cues are naturally presented in vivo. High aspect-ratio particles were used to form APC-ms, which contrasts with most previously described synthetic aAPC materials19–24. These particles spontaneously formed high surface area 3D scaffolds, which infiltrating T cells remodeled to form dense cell-material clusters, creating a microenvironment where T cells lie in close proximity to the material. The relatively large size and high aspect ratio of the rods likely contributed to the formation of the larger clusters observed in APC-ms versus Dynabead cultures, since many more T cells could interact with each individual rod (~ 70μm length, ~ 4.5 μm diameter) than with the smaller spherical Dynabeads (4.5 μm diameter). The persistence of these clusters in APC-ms cultures was dependent on surface cue density and the amount of material in the culture, which likely contributed to the different phenotypes observed in the various APC-ms conditions.
In the present study we show that loading IL-2 into APC-ms is superior to adding the same amount of IL-2 into the media as a soluble bolus. This is consistent with prior work which demonstrated that delivering cytokines such as IL-2 to T cells in a paracrine manner potentiates the effects of the cytokine19,20. Current synthetic aAPC systems emphasize TCR clustering and subsequent T cell activation via the static, high-density presentation of stimuli16,20,22. Here we show that by presenting T cell stimuli across the surface of a fluid lipid bilayer, emulating how these cues are presented on an APC plasma membrane, relatively lower surface cue densities can promote more rapid expansion rates and generate T cells with a more functional and less exhausted phenotype. The clustering of TCRs is only one step in a dynamic process and serves not only to enhance T cell activation, but also to limit the duration of TCR signaling to protect against T cell overstimulation9–11.
In polyclonal mouse T cell expansion studies, APC-ms promoted substantial CD8-biased skewing with the degree dependent on the particular APC-ms formulation. This is consistent with previous observations that paracrine delivery of IL-2 enhanced the proliferation of mouse CD8+ T cells, but promoted activation-induced cell death in mouse CD4+ T cells24. In contrast, formulations that presented higher amounts of T cell stimuli promoted substantial CD4-biased skewing in polyclonal human T cell expansion, while a lower amount of T cell stimuli promoted a more balanced CD4-to-CD8 ratio. Consistent with this observation, human CD19 CAR T cells (19BBz T cells) expanded with APC-ms retained a more balanced CD4-to-CD8 ratio, similar to that of the starting population, whereas 19BBz T cells expanded with Dynabeads underwent substantial CD4-biased skewing. The discrepancy in CD8 versus CD4 bias observed between mouse and human T cells could indicate fundamental differences in mouse and human biology. A better understanding of this behavior could enable material formulations that bias mixed T cell populations toward specific CD4-to-CD8 ratios, a property that has recently been shown to be important for the function of adoptively transferred T cells7.
The expansion of rare antigen-specific populations of T cells is a critical but challenging step in various disease treatments1–3. Although autologous moDCs represent the gold standard for expanding antigen-specific T cells, the need to isolate and culture moDCs on a donor-specific basis increases the resources and cost required to manufacture T cell products. High donor-to-donor variability also makes it challenging to standardize the production process, and the initial frequency and relative ease of expanding even the same T cell subpopulation could be vastly different. Following a single stimulation, APC-ms promoted antigen-specific expansion of rare T cell subpopulations comparable to moDCs after one week of culture, but by the second week of culture, whereas a decrease was observed in moDC cultures, a marked increase was observed over this same period in APC-ms cultures. Although the precise reasons underlying this observation are unclear, it is likely related to differences in the persistence of antigen presentation by APC-ms, for which the duration of antigen presentation is controlled by its degradation kinetics, compared to live moDCs which only transiently present exogenously-loaded short peptides42. Protocols employing moDCs frequently involve multiple restimulations to promote substantial enrichment of rare T cell subpopulations33.
We demonstrated that upon restimulation, APC-ms promoted more rapid expansion of 19BBz T cells than Dynabeads. We further demonstrate that 19BBz T cells expanded with these different materials showed no substantial functional differences in vivo in a disseminated lymphoma xenograft model. Notably, processes for CAR T cell production that involve the use of Dynabeads require the beads be removed prior to administration. Although simple in theory, this can be challenging and inconsistent in practice, with at least one reported instance of an out-of-specification CAR T cell manufacturing failure due to incomplete Dynabead removal25.
The need to rapidly generate therapeutically relevant numbers of functional T cells ex vivo is a significant challenge in personalized T cell therapies43,44, and this study demonstrates that APC-ms provide a significant advancement towards meeting this need. APC-ms represents a novel, multifunctional material platform that promotes more efficient polyclonal- and antigen-specific T cell expansion than widely-used T cell expansion systems (e.g. Dynabeads and moDCs). APC-ms is a modular platform technology that can be adapted to present diverse repertoires of cues, and change the spatial and temporal context in which cues are presented. For example, MSR properties could be varied to tune the scaffold microenvironment or degradation kinetics. The lipid formulation could be altered to tune SLB stability45, fluidity46, or surface cue partitioning47–49, or enable the attachment of cues via different chemistries38,50–52. We envision that future iterations of APC-ms could present larger sets of both surface and soluble cues, enabling the generation of further optimized T cells for ACT18,28.
Online Methods
Cells and Reagents
The B16-F10 murine melanoma cell line was obtained from ATCC, and confirmed to be negative for mycoplasma. Cells were cultured in Dulbecco’s modified Eagle’s medium (DMEM) supplemented with 10% heat-inactivated fetal bovine serum (HI-FBS) and 1% penicillin-streptomycin. The T2 (174 × CEM.T2) human lymphoblast cell line, was cultured in T cell media (RPMI 1640 supplemented with 10% HI-FBS, 2 mM L-glutamine, 1 mM sodium pyruvate, 50 μM beta-mercaptoethanol, 0.1 mM non-essential amino acids, 1 mM sodium pyruvate, 10 mM HEPES, and 1% penicillin-streptomycin). The B3Z murine T cell hybridoma cell line was cultured in T cell media without HEPES and non-essential amino acids. Primary mouse and human T cells, and CD19 CAR T cells were cultured in T cell media supplemented with 30 U/ml recombinant mouse- or human-IL-2, respectively, unless otherwise stated. Luciferized Raji cells, were cultured in RPMI 1640 supplemented with 10% HI-FBS, 2 mM L-glutamine, 1% penicillin-streptomycin and 1% puromycin.
Cell culture reagents were obtained from Gibco (e.g., DMEM, HI-FBS, penicillin-streptomycin), Lonza (e.g., RPMI 1640, L-glutamine, sodium pyruvate, non-essential amino acids), or Sigma (e.g., beta-mercaptoethanol, HEPES). Murine and human recombinant IL-2, IL-21, and TGF-β were purchased from Biolegend. All chemical reagents for MSR synthesis were purchased from Sigma-Aldrich. All lipids were purchased from Avanti Polar Lipids, including: DOPC (850375C), POPC (850457C), DPSC (850365C), PE-cap-biotin (870273C), PE-carboxyfluorescein (810332C). FoxP3 antibodies were from eBioscience. All other antibodies were purchased from Biolegend. Biotinylated peptide-loaded MHC monomers and fluorophore-labeled tetramers were obtained from the National Institutes of Health Tetramer Core Facility and MBL International. Mouse and human CD3/CD28 T cell expansion Dynabeads were purchased from ThermoFisher Scientific. The ovalbumin-derived peptide SIINFEKL was purchased from Anaspec. The EBV-derived peptides CLGGLLTMV and GLCTLVAML were purchased from Proimmune.
Synthesis of Mesoporous Silica Micro-Rods (MSRs)
MSRs were synthesized as previously reported27, 28. Briefly, Pluronic P123 surfactant (average Mn ~5,800) was dissolved in 1.6 M HCl solution and stirred with tetraethyl orthosilicate (TEOS, 98%) at 40 °C, followed by aging at 100 °C. Subsequently, surfactant was removed by extraction in 1% HCl/ethanol (v/v). Particles were recovered by running the suspension through a 0.22μm filter, washed with ethanol, and dried.
Animals
All procedures involving animals were done in compliance with National Institutes of Health and Institutional guidelines with approval of Harvard University’s Institutional Animal Care and Use Committee. Animals were purchased from The Jackson Laboratory, female and between 6 and 9 weeks old at the start of the experiment. Animals were maintained on 12-hr light cycles and fed chow and water ad libitum.
Primary T cell Isolation
C57BL/6J and BALB/c mice were used as primary mouse T cell donors for polyclonal T cell expansion studies and C57BL/6-Tg(TcraTcrb)1100Mjb/J (OT-I) mice were used for antigen-specific T cell expansion studies. T cells were obtained from the spleen and isolated using pan T cell or CD8a+ T cell isolation MACS kits (Miltenyi Biotec) to obtain CD3+ T cells or CD8+ T cells for polyclonal and antigen-specific studies T cell expansion studies, respectively.
Primary human T cells were obtained from de-identified leukoreduction collars (Brigham and Women’s Hospital Specimen Bank) and used within 24 hours of initial collection (stored at RT). PBMCs were enriched from leukoreductions in a Ficoll gradient, then isolated using pan T cell or CD8+ T cell isolation MACS kits to obtain CD3+ or CD8+ T cells for polyclonal or antigen-specific studies, respectively.
Preparation of Antigen-Presenting Cell-Mimetic Scaffolds (APC-ms)
MSRs and liposomes were prepared prior to APC-ms assembly. To prepare monodisperse liposomes, lipid films composed of predefined lipid formulations were first prepared by mixing lipid-chloroform suspensions, evaporating the bulk chloroform under nitrogen, and removing residual chloroform overnight in a vacuum chamber. For all functional studies, POPC was used as the primary lipid, and lipid formulations were doped with between 0.01-1 mol% of either carboxyfluorescein-tagged or biotin-capped PE. For some characterization studies, DOPC and DSPC were alternatively used as the primary lipid. Lipid films were rehydrated in PBS and subsequently extruded through 100 nm polycarbonate filters using a Mini-Extruder (Avanti Polar Lipids). Liposome suspensions were stored at 4°C and used within a week. To prepare APC-ms, MSRs (10 mg/ml) were incubated with recombinant IL-2 (0.04 mg/ml) in PBS for 1 hour at room temperature (RT). Liposomes were added at lipid-to-MSR 1:4 (w/w), and incubated for 1 hour at RT with pipetting every 10 minutes to form MSR-SLBs. The material was washed and blocked with 0.25% bovine serum albumin (BSA) in PBS (w/v). Streptavidin was subsequently added at 30% theoretical molar saturation of the biotinylated lipid in the formulation (assuming 34% lipid retention for POPC) and the suspension was mixed. Biotinylated T cell activating cues (1:1 molar ratio of TCR-activating cue-to-αCD28) were added at a 80% molar saturation of the added streptavidin, and the suspension was mixed at RT. The material was washed and resuspended in cell culture media for in vitro assays. APC-ms was used immediately for T cell expansion experiments, or stored at 4°C and used within a week for characterization studies.
Characterization of MSR-Supported Lipid Bilayer (MSR-SLB) Structure and Stability
Brightfield and fluorescence microscopy, used to evaluate MSR-SLB lipid coating, dispensability, and degradation, were performed with an EVOS FL Cell Imaging System. Confocal microscopy was performed using a Zeiss LSM 710 confocal system. Lipid retention was evaluated using MSRs coated with lipid formulations containing 1 mol% fluorophore-tagged lipid, and quantified using a plate reader. Cultured material was recovered by centrifuging at 700 rcf for 5 minutes, and fluorescence intensity was normalized to the fluorescence intensity prior to culture. Fluorescence recovery after photobleaching (FRAP) experiments were carried out on MSRs coated with lipid formulations containing 10 mol% fluorophore-tagged lipid. Photobleaching was performed on the 488 nm laser line and images were taken every 1 second for at least 20 seconds. Fluorescence recovery was analyzed using ImageJ by normalizing the fluorescence intensity within the photobleached region to the fluorescence intensity in an unbleached region on a different rod.
Cytokine (IL-2, IL-21, and TGF-β) loading and release was quantified by loading 500 μg of MSRs with 2 μg of the specified cytokine, followed by coating with lipid as described. Cytokine-loaded MSR-SLBs were resuspended in release buffer (1% BSA in PBS (w/v)). At various timepoints, samples were spun down and supernatants collected and quantified via ELISA (IL-2 ELISA from Biolegend, IL-21 and TGF-β ELISA from R&D Systems). Subsequently, MSRs were resuspended in fresh release buffer and returned to culture. The total amount of cytokine cumulatively released upon reaching the asymptote of the release curve was assumed to be the loaded amount of cytokine. Cytokine loading efficiency was calculated as total mass of cytokine release divided by mass of cytokine input.
To quantify loading, MSR-SLB samples were prepared using lipid formulations containing 0.01, 0.1, or 1 mol% biotinylated lipid. Streptavidin, at a 30% theoretical molar saturation of the retained biotinylated lipid (assuming 34% lipid retention for POPC), was added, followed by the addition of biotinylated IgG at 40% or 80% molar saturation of the added streptavidin. As controls, samples containing the same amount of biotinylated IgG but no material were also prepared. All samples were pelleted, and the amount of IgG in the supernatant fractions were quantified via ELISA (eBioscience). The biotinylated IgG stock was also used to prepare standard curves. The amount of IgG loaded onto the material was calculated by subtracting the amount of IgG detected in control sample supernatants from the amount of IgG detected in respective material sample supernatants.
Characterization of APC-ms
For scanning electron microscopy, cells were cultured with APC-ms overnight, fixed in 4% paraformaldehyde, and then spun down. Fixed samples were serially transitioned through a gradient of 0, 30, 50, 75, 90, 100% ethanol in water. Samples were submerged in hexamethyldisilazane (Electron Microscopy Sciences) and placed in a benchtop desiccator overnight. Dried coverslips were mounted on stubs, sputter coated with 5 nm of platinum-palladium, and imaged using secondary electron detection (Carl Zeiss Supra 55 VP field emission scanning electron microscope).
For degradation studies, APC-ms was synthesized as described, and cultured with primary mouse T cells. At indicated timepoints, the mixture was harvested, and pelleted. Supernatant was removed and pellets washed, lyophilized, and prepared for inductive coupled plasma atomic emission spectrometry (ICP-AES) to determine silicon (Si) content. ICP-AES was performed by Galbraith Laboratories. Percent detectable Si was calculated by normalizing the mass of Si at each timepoint to the mass of Si at 0 hours. The reported limit of detection was 6.8 μg/sample.
In vitro Polyclonal T cell Expansion Studies
Isolated primary mouse and human T cells were mixed with activation stimuli (i.e., Dynabeads or APC-ms), and cultured for up to two weeks. Media was added to maintain the cells below a density of 2.5×10⁶ cells/ml throughout the culture period. All mock-treated samples in polyclonal T cell expansion experiments were cultured in basal T cell media without IL-2 supplementation.
Commercial Dynabeads (ThermoFisher Scientific) were used according to the manufacturer-optimized protocol included with the kit. In some experiments, T cells were stimulated with Dynabeads at a bead-to-cell ratio of 5:1 or 25:1, or the manufacturer-recommended bead-to-cell ratio of 1:1. For Dynabead cultures, 1×10⁵ cells were seeded in the starting culture with pre-washed Dynabeads at the indicated bead-to-cell ratio in T cell media supplemented with 30 U/ml recombinant IL-2. Cells were counted every third day and fresh IL-2-supplemented media was added to bring the cell suspension to a density of 0.5-1×10⁶ cells/ml. In some studies, Dynabead cultures were supplemented with IL-2 only at the start of culture as a soluble bolus.
For mouse and human polyclonal T cell expansion studies, APC-ms were prepared that presented surface cues (αCD3/αCD28) on between 0.1-1 mol% of the lipids at a 1:1 molar ratio, and added into the starting culture at 33 μg/ml or 333 μg/ml. For APC-ms cultures, 2.5×10⁴ cells were seeded in the starting culture in basal T cell media without IL-2 supplementation. Starting on day 7, fresh media supplemented with 30U/mL IL-2 was added as necessary to maintain cells below a density of 2.5×10⁶ cells/ml. In some studies, APC-ms was prepared without pre-loaded IL-2 and IL-2 was instead added into the media at the start of culture as a soluble bolus.
Images of the T cell cultures were taken and live cells manually enumerated with a hemocytometer using Trypan blue exclusion. Fold expansion was calculated by dividing the number of cells at the respective timepoint by the number of cells seeded at the start of culture. After enumeration, cell phenotype was evaluated using flow cytometry. Gates were set for each timepoint and sample independently based on fluorescence minus one (FMO) controls.
In vitro Antigen-Specific T Cell Expansion Studies
Antigen-specific mouse T cell expansion experiments were carried out using primary CD8+ T cells isolated from OT-I mice. Antigen-specific human T cell expansion experiments were carried out using either CD8+ T cells, PBMCS, or CD14+ monocyte-depleted PBMCs derived from de-identified donor leukapheresis samples. Mouse T cells were mixed with APC-ms while human T cells, PBMCs, or CD14-depleted PBMCs were mixed with either APC-ms or autologous monocyte-derived dendritic cells (moDC). Prior to culture, donor samples were assayed for HLA-A*0201 expression via FACS, and prior EBV exposure via anti-EBV VCA ELISA (IBL International) of serum. Only HLA-A2+, EBV-experienced donors were used for expansion studies. Baseline frequencies of CLG- and GLC-specific CD8+ T cells in these samples were also assessed. Donors in which the baseline frequency was below 0.01% in 10000 live single CD8+ events were excluded from further analyses for the respective peptide (two incidences occurred).
For mouse antigen-specific studies, APC-ms were prepared that presented surface cues (SVYDFFVWL/H-2K(b) or SIINFEKL/H-2K(b) and αCD28) on either 0.01 mol% or 0.1 mol% of the lipids at a 1:1 molar ratio, and added into the starting culture at 33 μg/ml or 333 μg/ml. For human antigen-specific studies, APC-ms were prepared that presented surface cues (CLGGLLTMV/HLA-A2 or GLCTLVAML/HLA-A2 and αCD28) on 0.1 mol% of the lipids at a 1:1 molar ratio, and added into the starting culture at 333 μg/ml. For mouse studies, 2.5×10⁴ T cells were seeded with the specified amount of material in non-IL-2 supplemented media. For human studies, 5×10⁵ T cells, PBMCs, or CD14-depleted PBMCs were cultured with the specified amount of material in media without IL-2. Starting on day 7, additional media that was added to APC-ms cultures was supplemented with 30 U/ml IL-2. Additional IL-2-supplemented media was added throughout the remainder of the culture period to maintain cells below a density of 2.5×10⁶ cells/ml. Mock-treated samples in mouse expansion experiments were cultured in T cell media without IL-2. Mock-treated samples in human antigen-specific expansion experiments were cultured in media with IL-2 supplementation.
For human antigen-specific moDC cultures, moDCs were generated via the Mo-DC generation toolbox I, human (Miltenyi Biotec). Mature moDCs were either unpulsed or pulsed with 10 μg/ml peptide (mouse, SIINFEKL; human, CLGGLLTMV or GLCTLVAML) for 6 hours at 37°C. moDCs were washed and cultured with donor-matched, freshly-isolated CD8+ T cells in IL-2-supplemented media. 5×10⁵ CD8+ T cells were seeded with 3.3×10⁵ autologous, peptide-pulsed or unpulsed moDCs in 96 well U-bottom plates. Media with IL-2 was added throughout the culture period to maintain cells below a density of 2.5×10⁶ cells/ml.
Images of the T cell cultures were taken and live cells manually enumerated with a hemocytometer using Trypan blue exclusion. After enumeration, frequencies of antigen-specific T cells were evaluated using tetramer staining and flow cytometry. Antigen-specific fold expansion was calculated as follows: (live cell number×percent CD8+×percent tetramer+)timepoint X / (number of cells seeded×percent CD8+×percent tetramer+)timepoint 0.
In vitro T Cell Functional Studies
Stimulator cells (mouse, B16-F10; human, T2) were either unpulsed or pulsed with 1 μg/ml peptide (mouse, SIINFEKL; human, CLGGLLTMV or GLCTLVAML) for 30 minutes at 37 °C. Subsequently, 1×10⁵ expanded cells were cultured with 2×10⁴ stimulator cells for one hour before adding Brefeldin A (BD Biosciences) to inhibit cytokine secretion, and then cultured for another four hours. Cells were stained and evaluated for IFNγ and TNFα using FACS.
Killing assays were carried out by incubating target cells (mouse, B16-F10; human, T2) in 20 μg/ml Calcein AM (Biotium) for 30 minutes at 37 °C. Target cells were either unpulsed or pulsed with 1 μg/ml peptide (mouse, SIINFEKL; human, CLGGLLTMV or GLCTLVAML) for 30 minutes at 37 °C. 5×10³ target cells were cultured with expanded effector cells at effector cell-to-target cell (E:T) ratios of 0, 1, 10, 25, or 50 for 4 hours. Cells were pelleted and fluorescence intensity of supernatant samples quantified using a plate reader. IFNγ concentrations in supernatant samples were quantified via ELISA (Biolegend).
19BBz CAR T cell Restimulation Studies
19BBz CAR T cells were obtained from Unum Therapeutics. 19BBz T cells were generated using the commercial vector pLenti6.4/R4R2/V5-DEST (Invitrogen) with an EF1α promoter added and the PGK promoter and blasticidin S deaminase genes removed. The CD19 CAR was cloned downstream of the EF1α promoter. The 19BBz CAR was previously described53 and is composed of a CD8α signal peptide, a CD19-targeting scFv, a CD8α hinge and transmembrane domain, a 4-1BB costimulatory domain, and a CD3ζ signaling domain. The CD19 CAR protein sequence is as follows: MALPVTALLLPLALLLHAARPDIQMTQTTSSLSASLGDRVTISCRASQDISKYLNWYQQKPDGTVKLLIYHTSRLHSGVPSRFSGSGSGTDYSLTISNLEQEDIATYFCQQGNTLPYTFGGGTKLEITGGGGSGGGGSGGGGSEVKLQESGPGLVAPSQSLSVTCTVSGVSLPDYGVSWIRQPPRKGLEWLGVIWGSETTYYNSALKSRLTIIKDNSKSQVFLKMNSLQTDDTAIYYCAKHYYYGGSYAMDYWGQGTSVTVSSTTTPAPRPPTPAPTIASQPLSLRPEACRPAAGGAVHTRGLDFACDIYIWAPLAGTCGVLLLSLVITLYCKRGRKKLLYIFKQPFMRPVQTTQEEDGCSCRFPEEEEGGCELRVKFSRSADAPAYQQGQNQLYNELNLGRREEYDVLDKRRGRDPEMGGKPRRKNPQEGLYNELQKDKMAEAYSEIGMKGERRRGKGHDGLYQGLSTATKDTYDALHMQALPPR. 19BBz T cells were polyclonally re-stimulated with APC-ms or Dynabeads as described above. CAR expression was evaluated by primary staining with biotin-Protein L (Genscript) and secondary staining with APC-streptavidin (Biolegend).
Xenograft B cell Lymphoma Model
Female, NOD.Cg-Prkdcscid Il2rgtm1Wjl/SzJ mice (NSG) mice (6 wks, ~15 g; Jackson Laboratories), were used for all in vivo studies involving re-stimulated 19BBz T cells. NSG mice were inoculated with 1×10⁵ luciferized Raji cells intravenously (day 0). On day 4, mice were randomized into treatment groups within each cage and intravenously administered vehicle (RPMI-1640) or 107 19BBz T cells re-stimulated with either APC-ms or Dynabeads for 7 or 14 days. The investigator performing the 19BBZ T cell infusions was blinded to the treatment group. Prior to cell infusion, cells were collected, washed twice with T cell media and with RPMI-1640, and then resuspended at the appropriate concentration in RPMI-1640. Dynabeads were magnetically removed (Dynal) and cell products were visually inspected for Dynabead contamination prior to injection. 19BBz T cells restimulated with APC-ms were used without additional purification steps. Tumor burden was evaluated over time by intraperitoneal Luciferin (Gold Biotechnology) injection and luminescence measurements 10 minutes post-injection via IVIS (Perkin Elmer). Total flux (p/s) per mouse was quantified in regions-of-interest (ROI) defined around individual mice. A single ROI with the same dimensions was placed below the mice as a measure of background luminescence in the image field, due to substantial bleed-over from mice with high tumor burden within the chamber, and used to normalize the signal of all mice imaged within the chamber. Luminescence signal of each individual mouse was reported as normalized total flux, calculated as (total flux)mouse ROI/(total flux)background ROI. One animal was excluded from analysis as it was accidently administered a different dose. Mice were monitored daily for signs of discomfort and euthanized upon losing more than 10% of initial body weight, the development of hind-limb paralysis, or when graft-versus-host disease was evident (hair loss, behavioral changes, decline in overall health).
Statistical Analysis
All values were expressed as mean ± s.d., unless otherwise indicated. The required sample size varied depending on the experiment, and for in vivo experiments was determined in G*Power using an a priori analysis, set at significance level 0.05 and power 0.9. The F-test was used to determine the equality of variances. For samples of equal variance, the significance between groups was measured using appropriate two-tailed, parametric tests (e.g., Student’s t-test, two-way ANOVA). For samples of unequal variance, the significance between groups was measured using appropriate two-tailed non-parametric tests (e.g., Mann-Whitney U test). Statistical testing was performed using GraphPad Prism and detailed statistical methods are stated in the text. In all cases, p<0.05 was considered significant.
Data Availability Statement
The authors declare that the data supporting the findings of this study are available within the main manuscript, the supplemental figures, and the tables. A life sciences and flow cytometry reporting summary for this article are available.
Supplementary Material
Acknowledgments
This work was supported by the National Institutes of Health (NIH) (1R01EB015498) and the Wyss Institute for Biologically Inspired Engineering at Harvard University. D.K.Y.Z. was supported by the Canadian Institutes of Health Research (CIHR-DFSA). S.T.K. was supported by an HHMI ISRF. This work was performed in part at the Center for Nanoscale Systems (CNS), a member of the National Nanotechnology Coordinated Infrastructure Network (NNCI), which is supported by the National Science Foundation under NSF award no. 1541959. CNS is part of Harvard University. We thank the National Institutes of Health (NIH) Tetramer Core Facility for the SIINFEKL/H-2K(b) biotinylated monomer, Alexa Fluor 647-labeled SIINFEKL/H-2K(b) tetramer, CLGGLLTMV/HLA-A*0201 biotinylated monomer, Alexa Fluor 647-labeled CLGGLLTMV/HLA-A*02:01 tetramer, GLCTLVAML/HLA-A*02:01 biotinylated monomer, and Alexa Fluor 647-labeled GLCTLVAML/HLA-A*0201 tetramer, Dr. N. Shastri for the B3Z cell line, and Dr. G. Freeman for the T2 cell line. We thank Unum Therapeutics for the luciferized Raji cell line and the 19BBz CAR T cells. We also thank Dr. C. Stamoulis from Boston Children’s Hospital and the Harvard Catalyst for her help with statistical analysis; Harvard Catalyst is supported, in part, by the NIH (UL1 TR001102). Lastly, we thank R. Bates, M. Pezone, Dr. B. Schultes, Dr. L. Edwards, Dr. G. Motz, Dr. T. Barnitz, T. Hickman, Dr. K. McGinness, Dr. J. Ritz, Dr. M. Maus, Tracy Snyder, and Dr. W.A. Li for valuable scientific discussions.
Footnotes
Author Contributions
A.S.C. and D.J.M. conceived and designed the experiments. A.S.C., D.K.Y.Z., and S.T.K. performed the experiments. A.S.C., D.K.Y.Z., and D.J.M. analyzed the data. A.S.C., D.K.Y.Z., and D.J.M. wrote the manuscript. All authors discussed the results and commented on the manuscript. The principal investigator is D.J.M.
Competing Financial Interests
The authors declare no competing financial interests.
ED SUM: T cells are readily expanded in culture using a system that presents membrane-bound and soluble cues in a natural context.
References
- 1.Rosenberg SA, Restifo NP. Adoptive cell transfer as personalized immunotherapy for human cancer. Science. 2015;348:62–68. doi: 10.1126/science.aaa4967. [DOI] [PMC free article] [PubMed] [Google Scholar]
- 2.June CH, Riddell SR, Schumacher TN. Adoptive cellular therapy: A race to the finish line. Sci Transl Med. 2015;7:280ps7–280ps7. doi: 10.1126/scitranslmed.aaa3643. [DOI] [PubMed] [Google Scholar]
- 3.Fesnak AD, June CH, Levine BL. Engineered T cells: the promise and challenges of cancer immunotherapy. Nat Rev Cancer. 2016;16:566–581. doi: 10.1038/nrc.2016.97. [DOI] [PMC free article] [PubMed] [Google Scholar]
- 4.Maude SL, et al. Chimeric Antigen Receptor T Cells for Sustained Remissions in Leukemia. N Engl J Med. 2014;371:1507–1517. doi: 10.1056/NEJMoa1407222. [DOI] [PMC free article] [PubMed] [Google Scholar]
- 5.Lee DW, et al. T cells expressing CD19 chimeric antigen receptors for acute lymphoblastic leukaemia in children and young adults: a phase 1 dose-escalation trial. Lancet. 2015;385:517–528. doi: 10.1016/S0140-6736(14)61403-3. [DOI] [PMC free article] [PubMed] [Google Scholar]
- 6.Brentjens RJ, et al. Safety and persistence of adoptively transferred autologous CD19-targeted T cells in patients with relapsed or chemotherapy refractory B-cell leukemias. Blood. 2011;118:4817–4828. doi: 10.1182/blood-2011-04-348540. [DOI] [PMC free article] [PubMed] [Google Scholar]
- 7.Turtle CJ, et al. CD19 CAR–T cells of defined CD4+: CD8+ composition in adult B cell ALL patients. J Clin Invest. 2016;126 doi: 10.1172/JCI85309. [DOI] [PMC free article] [PubMed] [Google Scholar]
- 8.Neelapu SS, et al. Kte-C19 (anti-CD19 CAR T Cells) Induces Complete Remissions in Patients with Refractory Diffuse Large B-Cell Lymphoma (DLBCL): Results from the Pivotal Phase 2 Zuma-1. Blood. 2016;128 [Google Scholar]
- 9.Huppa JB, Davis MM. T-cell-antigen recognition and the immunological synapse. Nat Rev Immunol. 2003;3:973–983. doi: 10.1038/nri1245. [DOI] [PubMed] [Google Scholar]
- 10.Lee KH, et al. The immunological synapse balances T cell receptor signaling and degradation. Science. 2003;302:1218–1222. doi: 10.1126/science.1086507. [DOI] [PubMed] [Google Scholar]
- 11.Alarcón B, Mestre D, Martínez‐Martín N. The immunological synapse: a cause or consequence of T‐cell receptor triggering? Immunology. 2011;133:420–425. doi: 10.1111/j.1365-2567.2011.03458.x. [DOI] [PMC free article] [PubMed] [Google Scholar]
- 12.Minguet S, Swamy M, Alarcón B, Luescher IF, Schamel WWA. Full activation of the T cell receptor requires both clustering and conformational changes at CD3. Immunity. 2007;26:43–54. doi: 10.1016/j.immuni.2006.10.019. [DOI] [PubMed] [Google Scholar]
- 13.Hasan AN, Selvakumar A, O’Reilly RJ. Artificial Antigen Presenting Cells: An Off the Shelf Approach for Generation of Desirable T-Cell Populations for Broad Application of Adoptive Immunotherapy. Adv Genet Eng. 2015;2015 [PMC free article] [PubMed] [Google Scholar]
- 14.Hollyman D, et al. Manufacturing validation of biologically functional T cells targeted to CD19 antigen for autologous adoptive cell therapy. J Immunother (Hagerstown, Md 1997) 2009;32:169. doi: 10.1097/CJI.0b013e318194a6e8. [DOI] [PMC free article] [PubMed] [Google Scholar]
- 15.Maus MV, et al. Ex vivo expansion of polyclonal and antigen-specific cytotoxic T lymphocytes by artificial APCs expressing ligands for the T-cell receptor, CD28 and 4-1BB. Nat Biotechnol. 2002;20:143–148. doi: 10.1038/nbt0202-143. [DOI] [PubMed] [Google Scholar]
- 16.Zappasodi R, et al. The effect of artificial antigen-presenting cells with preclustered anti-CD28/-CD3/-LFA-1 monoclonal antibodies on the induction of ex vivo expansion of functional human antitumor T cells. Haematologica. 2008;93:1523–1534. doi: 10.3324/haematol.12521. [DOI] [PubMed] [Google Scholar]
- 17.Perica K, et al. Enrichment and expansion with nanoscale artificial antigen presenting cells for adoptive immunotherapy. ACS Nano. 2015;9:6861–6871. doi: 10.1021/acsnano.5b02829. [DOI] [PMC free article] [PubMed] [Google Scholar]
- 18.Mandal S, et al. Polymer-Based Synthetic Dendritic Cells for Tailoring Robust and Multifunctional T Cell Responses. ACS Chem Biol. 2014;10:485–492. doi: 10.1021/cb500455g. [DOI] [PubMed] [Google Scholar]
- 19.Steenblock ER, Fahmy TM. A comprehensive platform for ex vivo T-cell expansion based on biodegradable polymeric artificial antigen-presenting cells. Mol Ther. 2008;16:765–772. doi: 10.1038/mt.2008.11. [DOI] [PubMed] [Google Scholar]
- 20.Fadel TR, et al. A carbon nanotube-polymer composite for T-cell therapy. Nat Nanotechnol. 2014;9:639–47. doi: 10.1038/nnano.2014.154. [DOI] [PubMed] [Google Scholar]
- 21.Sunshine JC, Perica K, Schneck JP, Green JJ. Particle shape dependence of CD8+ T cell activation by artificial antigen presenting cells. Biomaterials. 2014;35:269–277. doi: 10.1016/j.biomaterials.2013.09.050. [DOI] [PMC free article] [PubMed] [Google Scholar]
- 22.Fadel TR, et al. Enhanced cellular activation with single walled carbon nanotube bundles presenting antibody stimuli. Nano Lett. 2008;8:2070–2076. doi: 10.1021/nl080332i. [DOI] [PubMed] [Google Scholar]
- 23.Meyer RA, et al. Biodegradable Nanoellipsoidal Artificial Antigen Presenting Cells for Antigen Specific T‐Cell Activation. Small. 2015;11:1519–1525. doi: 10.1002/smll.201402369. [DOI] [PMC free article] [PubMed] [Google Scholar]
- 24.Steenblock ER, Fadel T, Labowsky M, Pober JS, Fahmy TM. An artificial antigen-presenting cell with paracrine delivery of IL-2 impacts the magnitude and direction of the T cell response. J Biol Chem. 2011;286:34883–34892. doi: 10.1074/jbc.M111.276329. [DOI] [PMC free article] [PubMed] [Google Scholar]
- 25.Novartis CTL019 Oncologic Drugs Advisory Committee Briefing Document. 2017 [Google Scholar]
- 26.Li Y, Kurlander RJ. Comparison of anti-CD3 and anti-CD28-coated beads with soluble anti-CD3 for expanding human T cells: differing impact on CD8 T cell phenotype and responsiveness to restimulation. J Transl Med. 2010;8:1. doi: 10.1186/1479-5876-8-104. [DOI] [PMC free article] [PubMed] [Google Scholar]
- 27.Jin C, et al. Allogeneic lymphocyte-licensed DCs expand T cells with improved antitumor activity and resistance to oxidative stress and immunosuppressive factors. Mol Ther Clin Dev. 2014;1 doi: 10.1038/mtm.2014.1. [DOI] [PMC free article] [PubMed] [Google Scholar]
- 28.Hendriks J, et al. CD27 is required for generation and long-term maintenance of T cell immunity. Nat Immunol. 2000;1:433–440. doi: 10.1038/80877. [DOI] [PubMed] [Google Scholar]
- 29.Hunder NN, et al. Treatment of Metastatic Melanoma with Autologous CD4+ T Cells against NY-ESO-1. N Engl J Med. 2008;358:2698–2703. doi: 10.1056/NEJMoa0800251. [DOI] [PMC free article] [PubMed] [Google Scholar]
- 30.Mackensen A, et al. Phase I study of adoptive T-cell therapy using antigen-specific CD8 + T cells for the treatment of patients with metastatic melanoma. J Clin Oncol. 2006;24:5060–5069. doi: 10.1200/JCO.2006.07.1100. [DOI] [PubMed] [Google Scholar]
- 31.Rooney CM, et al. Infusion of cytotoxic T cells for the prevention and treatment of Epstein-Barr virus-induced lymphoma in allogeneic transplant recipients. Blood. 1998;92:1549–1555. [PubMed] [Google Scholar]
- 32.Satthaporn S, et al. Dendritic cells are dysfunctional in patients with operable breast cancer. Cancer Immunol Immunother. 2004;53:510–518. doi: 10.1007/s00262-003-0485-5. [DOI] [PMC free article] [PubMed] [Google Scholar]
- 33.Wölfl M, Greenberg PD. Antigen-specific activation and cytokine-facilitated expansion of naive, human CD8+ T cells. Nat Protoc. 2014;9:950–66. doi: 10.1038/nprot.2014.064. [DOI] [PMC free article] [PubMed] [Google Scholar]
- 34.Grakoui A, et al. The immunological synapse: a molecular machine controlling T cell activation. Science. 1999;285:221–7. doi: 10.1126/science.285.5425.221. [DOI] [PubMed] [Google Scholar]
- 35.Kim J, et al. Injectable, spontaneously assembling, inorganic scaffolds modulate immune cells in vivo and increase vaccine efficacy. Nat Biotechnol. 2014;33:61–69. doi: 10.1038/nbt.3071. [DOI] [PMC free article] [PubMed] [Google Scholar]
- 36.Li WA, et al. The effect of surface modification of mesoporous silica micro-rod scaffold on immune cell activation and infiltration. Biomaterials. 2016;83:249–256. doi: 10.1016/j.biomaterials.2016.01.026. [DOI] [PMC free article] [PubMed] [Google Scholar]
- 37.Jerabek H, Pabst G, Rappolt M, Stockner T. Membrane-mediated effect on ion channels induced by the anesthetic drug ketamine. J Am Chem Soc. 2010;132:7990–7997. doi: 10.1021/ja910843d. [DOI] [PubMed] [Google Scholar]
- 38.Torres AJ, Contento RL, Gordo S, Wucherpfennig KW, Love JC. Functional single-cell analysis of T-cell activation by supported lipid bilayer-tethered ligands on arrays of nanowells. Lab Chip. 2013;13:90–99. doi: 10.1039/c2lc40869d. [DOI] [PMC free article] [PubMed] [Google Scholar]
- 39.Gattinoni L, et al. Acquisition of full effector function in vitro paradoxically impairs the in vivo antitumor efficacy of adoptively transferred CD8+ T cells. J Clin Invest. 2005;115:1616–1626. doi: 10.1172/JCI24480. [DOI] [PMC free article] [PubMed] [Google Scholar]
- 40.Cohen CJ, et al. Isolation of neoantigen-specific T cells from tumor and peripheral lymphocytes. J Clin Invest. 2015;125:3981–3991. doi: 10.1172/JCI82416. [DOI] [PMC free article] [PubMed] [Google Scholar]
- 41.Strønen E, et al. Targeting of cancer neoantigens with donor-derived T cell receptor repertoires. Science. 2016;352:1337–1341. doi: 10.1126/science.aaf2288. [DOI] [PubMed] [Google Scholar]
- 42.Chauvin JM, et al. HLA Anchor Optimization of the Melan-A-HLA-A2 Epitope within a Long Peptide Is Required for Efficient Cross-Priming of Human Tumor-Reactive T Cells. J Immunol. 2012;188:2102–2110. doi: 10.4049/jimmunol.1101807. [DOI] [PubMed] [Google Scholar]
- 43.Turtle CJ, Riddell SR. Artificial antigen presenting cells for use in adoptive immunotherapy. Cancer J. 2010;16:374. doi: 10.1097/PPO.0b013e3181eb33a6. [DOI] [PMC free article] [PubMed] [Google Scholar]
- 44.Eggermont LJ, Paulis LE, Tel J, Figdor CG. Towards efficient cancer immunotherapy: advances in developing artificial antigen-presenting cells. Trends Biotechnol. 2014;32:456–465. doi: 10.1016/j.tibtech.2014.06.007. [DOI] [PMC free article] [PubMed] [Google Scholar]
- 45.Puu G, Gustafson I. Planar lipid bilayers on solid supports from liposomes–factors of importance for kinetics and stability. Biochim Biophys Acta (BBA)-Biomembranes. 1997;1327:149–161. doi: 10.1016/s0005-2736(97)00052-7. [DOI] [PubMed] [Google Scholar]
- 46.Anderson NA, Richter LJ, Stephenson JC, Briggman KA. Characterization and control of lipid layer fluidity in hybrid bilayer membranes. J Am Chem Soc. 2007;129:2094–2100. doi: 10.1021/ja066588c. [DOI] [PubMed] [Google Scholar]
- 47.Collins MD, Keller SL. Tuning lipid mixtures to induce or suppress domain formation across leaflets of unsupported asymmetric bilayers. Proc Natl Acad Sci. 2008;105:124–128. doi: 10.1073/pnas.0702970105. [DOI] [PMC free article] [PubMed] [Google Scholar]
- 48.Reich C, et al. Asymmetric structural features in single supported lipid bilayers containing cholesterol and G M1 resolved with synchrotron X-ray reflectivity. Biophys J. 2008;95:657–668. doi: 10.1529/biophysj.107.113068. [DOI] [PMC free article] [PubMed] [Google Scholar]
- 49.Longo GS, Schick M, Szleifer I. Stability and liquid-liquid phase separation in mixed saturated lipid bilayers. Biophys J. 2009;96:3977–3986. doi: 10.1016/j.bpj.2009.02.043. [DOI] [PMC free article] [PubMed] [Google Scholar]
- 50.Kwong B, Liu H, Irvine DJ. Induction of potent anti-tumor responses while eliminating systemic side effects via liposome-anchored combinatorial immunotherapy. Biomaterials. 2011;32:5134–5147. doi: 10.1016/j.biomaterials.2011.03.067. [DOI] [PMC free article] [PubMed] [Google Scholar]
- 51.Koo H, et al. Bioorthogonal copper-free click chemistry inVivo for tumor-targeted delivery of nanoparticles. Angew Chemie - Int Ed. 2012;51:11836–11840. doi: 10.1002/anie.201206703. [DOI] [PubMed] [Google Scholar]
- 52.Desai RM, Koshy ST, Hilderbrand SA, Mooney DJ, Joshi NS. Versatile click alginate hydrogels crosslinked via tetrazine-norbornene chemistry. Biomaterials. 2015;50:30–37. doi: 10.1016/j.biomaterials.2015.01.048. [DOI] [PubMed] [Google Scholar]
Methods-only References
- 53.Imai C, et al. Chimeric receptors with 4-1BB signaling capacity provoke potent cytotoxicity against acute lymphoblastic leukemia. Leukemia. 2004;18:676–684. doi: 10.1038/sj.leu.2403302. [DOI] [PubMed] [Google Scholar]
Associated Data
This section collects any data citations, data availability statements, or supplementary materials included in this article.
Supplementary Materials
Data Availability Statement
The authors declare that the data supporting the findings of this study are available within the main manuscript, the supplemental figures, and the tables. A life sciences and flow cytometry reporting summary for this article are available.