

Abstract
Bone marrow fibrosis is a critical component of primary myelofibrosis (PMF). But the origin of myofibroblasts that drive fibrosis is unknown. Using genetic fate mapping we found that bone marrow Leptin receptor (Lepr) – expressing mesenchymal stromal lineage cells expanded extensively and were the fibrogenic cells in PMF. These stromal cells down-regulated the expression of key haematopoietic stem cell (HSC)- supporting factors and up-regulated genes associated with fibrosis and osteogenesis, indicating fibrogenic conversion. Administration of imatinib or conditional deletion of platelet-derived growth factor receptor a (Pdgfra) from Lepr+ stromal cells suppressed their expansion and ameliorated bone marrow fibrosis. Conversely, activation of the PDGFRa pathway in bone marrow Lepr+ cells led to expansion of these cells and extramedullary haematopoiesis, features of PMF. Our data identify Lepr+ stromal lineage cells as the origin of myofibroblasts in PMF and suggest that targeting PDGFRa signaling could be an effective way to treat bone marrow fibrosis.
Introduction
HSCs are maintained by their microenvironmental niches. Recently, we identified bone marrow Lepr+ mesenchymal stromal cells as a critical component of the niche that elaborates multiple factors, including stem cell factor (SCF) and CXCL12 1, 2. These stromal cells include skeletal stem cells that are the main source of bone in the adult bone marrow 3. Although our understanding of the mesenchymal stromal cells under steady state has advanced quickly, how these cells are altered by and contribute to haematological diseases has not been well characterized 4.
PMF is a subtype of myeloproliferative neoplasms (MPNs) with clinical characteristics, including anemia, bone marrow fibrosis and extramedullary haematopoiesis 5. Most PMF patients are elderly. PMF originates clonally from abnormal haematopoietic stem/progenitor cells. Allogeneic HSC transplantation is the only possible cure. However, this approach is too toxic for elderly people, precluding its application to most PMF patients. The haematopoietic-intrinsic molecular mechanisms that lead to PMF have been studied extensively 6. Several driver mutations have been identified, including JAK2V617F and MPLW515L mutations that lead to constitutive activation of JAK2 kinase and the upstream receptor MPL, respectively 6. Calreticulin mutations that activate the MPL receptor 7-9 have recently been discovered in most JAK2/MPL mutation-negative patients 10, 11. Thus, activation of the MPL-JAK-STAT pathway in haematopoietic cells is a general feature of MPNs, regardless of the specific molecular mechanisms. Consistent with this, a comprehensive genomic analysis has identified gene signature of JAK-STAT activation in all MPN patients, independent of mutations 12. Currently, JAK inhibitors have been actively explored as a means to treat PMF. While these inhibitors control symptoms, they do not resolve the disease, particularly the bone marrow fibrosis 6. Thus a deeper understanding of the fibrotic component of PMF pathogenesis is required to devise more effective therapies.
The cellular mechanisms underlying bone marrow fibrosis are still being elucidated. An earlier study of X chromosome-linked markers in a female PMF patient revealed that haematopoietic cell overproliferation was clonal while the bone marrow fibrosis was not 13. Mouse models with MPN-associated mutations have demonstrated that MPNs originate from abnormal haematopoietic clones 14. But how overproliferating haematopoietic cells lead to bone marrow fibrosis and extramedullary haematopoiesis is not clear. Megakaryocyte deregulation and hyperplasia is a defining cellular feature of PMF 6, 15. Overexpression of the major megakaryopoietic cytokine, thrombopoietin (TPO), leads to megakaryocyte hyperplasia and PMF in mice 16, 17. Gata1low mice with a block in megakaryocyte maturation 18. developed myelofibrosis, suggesting a disease model where dysregulated megakaryocytes secrete excessive cytokines, including transforming growth factor-beta 1 (Tgfβ1) and platelet-derived growth factor (PDGF) that drive bone marrow fibrosis 19. Indeed, targeting deregulated megakaryocytes by inhibiting the AURKA pathway eliminated bone marrow fibrosis 20. However, the bone marrow stromal cells that respond to the cytokines elaborated by hyperplastic megakaryocytes and that directly deposit reticulin and collagen fibers have not been identified.
PDGFs are potent cytokines that promote mesenchymal cell proliferation and are implicated in many fibrotic diseases, including pulmonary and liver fibrosis 21. Activation of PDGFRa signaling is sufficient to drive fibrosis in diverse organs 22, 23. PMF patients have significantly higher concentrations of PDGFs in circulation, likely due to increased release 24. However, whether PDGFR pathways play a role in bone marrow fibrosis has not been directly addressed.
It has been speculated that cells of the fibroblastic lineage are the origin of myofibroblasts in PMF 5, 25. A number of markers have been used to identify mouse bone marrow fibroblastic stromal cells, also referred to as colony-forming unit-fibroblast (CFU-F), including Nestin-GFP, CD51, PDGFRa, PDGFRb and NG2 26-30. Using some of these markers, several studies characterized the mesenchymal stromal cells in MPN mouse models. In a chronic myeloid leukemia (CML) model, Schepers et al reported an expansion of Lin−CD45−CD31−CD51+Sca1− osteoblastic lineage cells and increase collagen deposition. However, it was not clear whether these cells were the origin of bone marrow fibrosis 31. In a Jak2V617F MPN model, Arranz et al performed lineage-tracing using Nestin-creER to assess the contribution of Nestin+ stromal cells. No obvious contribution of these cells to bone marrow fibrosis was noted 32. As a result, the stromal cells that directly contribute to bone marrow fibrosis are unknown. Given the central role of PDGFR signaling in myofibroblasts and fibrosis, we searched for bone marrow stromal cells that express PDGFRs. Previously, we reported that Lepr+ stromal cells are uniformly positive for PDGFRa and PDGFRb 1, 3. Conversely, virtually all PDGFR+ stromal cells in the bone marrow are Lepr+ 3. This raises the question of whether the Lepr+PDGFR+ stromal cells are the origin of myofibroblasts in PMF.
We set out to identify the stromal cells that generate reticulin and collagen fiber in myelofibrosis using lineage tracing. We found that Lepr+ mesenchymal stromal cells were the source of myofibroblasts and underwent expansion in PMF. These cells down-regulated key HSC maintenance factors and up-regulated fibrogenic and osteogenic genes. Conditional deletion of Pdgfra from Lepr+ mesenchymal stromal cells or administrating imatinib suppressed their expansion and largely abolished bone marrow fibrosis. Conversely, activation of PDGFRa pathway in Lepr+ mesenchymal stromal cells led to their expansion and extramedullary haematopoiesis. Our results identify the activation of the PDGFRa pathway in Lepr+ cells as an important contributor to myelofibrosis and provide a proof of principle that inhibiting the PDGFRa pathway in mesenchymal stromal cells is an attractive strategy to treat bone marrow fibrosis.
Results
Development of primary myelofibrosis in Tpo-overexpressing mice
We adapted a retroviral mouse PMF model by transplanting Tpo-overexpressing (TOE) retrovirally-infected bone marrow cells into irradiated mice. Consistent with prior reports 16, 17, these mice developed high levels of serum TPO (Fig. 1a), thrombocythemia (Fig. 1b) and a trend towards leukocytosis (Fig. 1c) within three months after the transplantation. The bone marrow from the TOE mice was pale, particularly in mice with advanced PMF (Fig. 1d). Enlarged spleens with extramedullary haematopoiesis were evident accompanied by a 3-fold increase in spleen weight (Fig. 1e and f). Bone marrow myeloid cells significantly expanded in TOE mice (58±13% cells were myeloid cells in TOE vs 40±8% in controls) (Fig. 1g). These mice displayed megakaryocyte hyperplasia in the bone marrow (Fig. 1h) and profound fibrosis in the spleen and bone marrow (Fig. 1i and j). Large amounts of collagen fibers and osteosclerosis associated with fibrosis made dissociation of bone marrow cells from TOE mice into single cell suspension difficult. These observations indicate that the TOE model developed features of PMF as previously reported 16, 17.
Figure 1. TOE mice develop clinical features of PMF.
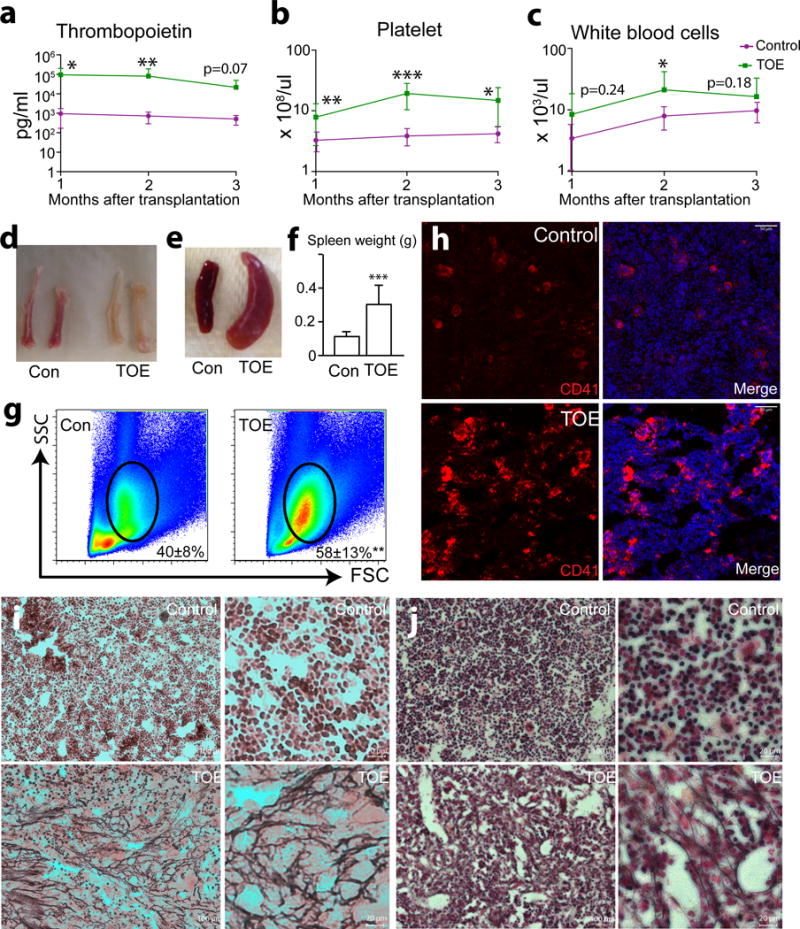
a. Plasma TPO levels determined by ELISA 1 to 3 months after the bone marrow transplantation showing elevated TPO level in TOE mice compared with controls (mice transplanted with control vector virus-infected bone marrow cells) (n=16, 15 and 7 mice for control, n=15, 13 and 7 mice for TOE, at month 1-3 after transplantation, respectively).
b and c. Peripheral blood count analysis of TOE and control mice 1 to 3 months after bone marrow transplantation (n=16, 15 and 7 mice for control, n=15, 13 and 7 mice for TOE, at month 1-3 after transplantation, respectively for b) (n=16, 15 and 12 mice for control, n=15, 13 and 10 mice for TOE, at month 1-3 after transplantation, respectively for c).
d. Long bones from TOE mice were pale compared with vector controls.
e. TOE mice showed enlarged spleens.
f. Quantification of the spleen weight (n=13 mice for control and TOE, each).
g. TOE mice bone marrow showed a significant increase of myeloid cell frequency (n=8 mice for control, n=7 mice for TOE).
h. Images of bone marrow sections showing that megakaryocyte lineage cells were overproliferated in the bone marrow of TOE mice. Megakaryocytes were marked by CD41 antibody staining (in red). Nuclei were stained with DAPI (in blue).
i and j. Reticulin staining showing extensive fibrosis in the spleen (i) and bone marrow (j) from TOE mice. Right panels of i and j are higher magnification images. TOE, Tpo-overexpressing. Con, control vector virus. All data represent mean±s.d.. Two-tailed student’s t-tests were used to assess statistical significance: *p<0.05, ** p<0.01, *** p<0.001. Images are representative of at least 3 biological replicates.
HSCs undergo proliferation and mobilization in TOE mice
We examined HSC and progenitor compartments in TOE mice 2–4 months after the bone marrow transplantation. There was a 5-fold increase of the frequency of Lin−Sca1+cKit+CD150+CD48− HSCs in the bone marrow of TOE mice compared with mice transplanted with control virus-infected bone marrow cells (Fig. 2a and b). Similarly, Lin−Sca1+cKit+CD150−CD48− multipotent progenitors (MPPs) and Lin−Sca1+cKit+ haematopoietic progenitors (HPCs) were also significantly increased (Fig. 2a and Supplementary Fig. 1a). Bone marrow cellularity was significantly reduced in TOE mice (Fig. 2c). An overall quantification revealed an increased of HSC number in TOE bone marrow (Fig. 2d). There were variations among the TOE mice in term of haematopoietic phenotypes presumably due to variable amount of TPO (thus variable fibrosis induction strength) in individual mice. When the mice were grouped into intermediate and advanced stages based on their haematopoietic parameters (e.g. color of the bone marrow and ease of bone marrow dissociation), we observed an initial significant increase of bone marrow HSC number in intermediate followed by a reduction of HSCs in advanced PMF mice (Fig. 2e), consistent with clinical data on different stages of PMF patients 33. MPPs and HPCs showed similar alterations (Supplementary Fig. 1a). This is associated with a gradual depletion of bone marrow cellularity (Fig. 2f). HSCs from TOE mice incorporated more BrdU in 5-day pulse experiments (Fig. 2g and Supplementary Fig. 1b), suggesting they proliferated more.
Figure 2. HSCs overproliferate and mobilize to the spleen in TOE mice.
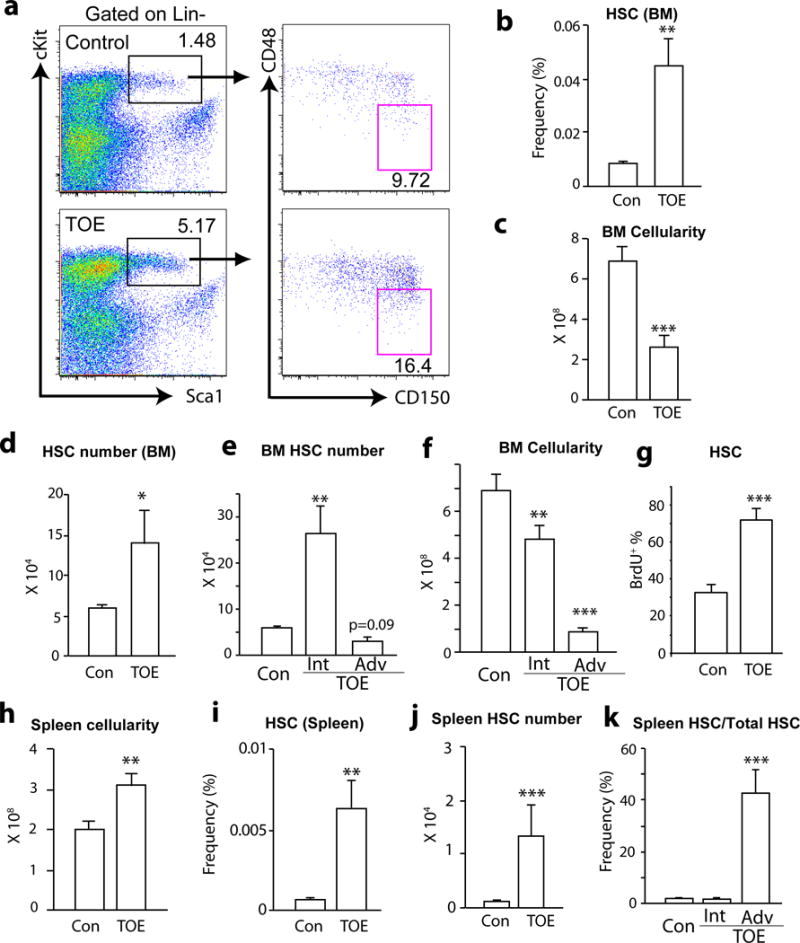
a. Representative flow cytometric plot showing the increased Lin−Sca1+cKit+CD150+CD48− HSC frequency in TOE mice.
b. Bone marrow HSC frequency was significantly increase in TOE mice (n=21 mice for control and n=22 mice for TOE).
c. TOE mice had a significant reduction of bone marrow cellularity (n=21 mice for control and n=18 mice for TOE).
d. TOE mice had an increased HSC number in the bone marrow (n=20 mice for control and n=18 mice for TOE).
e. There was a significant increase of bone marrow HSC number in intermediate PMF followed by a reduction of bone marrow HSCs in advanced PMF (n=20 mice for control, n=9 mice for intermediate PMF, n=10 mice for advanced PMF).
f. As the PMF developed, there was a gradually more severe reduction of bone marrow cellularity in TOE mice (n=20 mice for control, n=9 mice for intermediate PMF, n=10 mice for advanced PMF).
g. Bone marrow HSCs from TOE mice incorporated significantly more BrdU in 5-day pulse experiments (n=4 mice for control and n=8 mice for TOE).
h. Spleen cellularity from TOE was significantly increased (n=15 mice for control and n=12 mice for TOE).
i and j HSC frequency and number from spleens of TOE mice were significantly increased (n=22 mice for control and n=23 mice for TOE in (i), n=13 mice for control and n=11 mice for TOE in (j)).
k. Quantification of spleen and bone marrow HSC number showed a significant mobilization to the spleen in advanced stage of PMF (n=12 mice for control, n=6 mice for intermediate PMF and n=7 mice for advanced PMF). TOE, Tpo-overexpressing. Con, control vector virus. Int, intermediate stage. Adv, advanced stage. All data represent mean±sem. Two-tailed student’s t-tests were used to assess statistical significance: *p<0.05, ** p<0.01, *** p<0.001.
There was a 1.6-fold more of mechanically dissociable cells in the spleens from TOE mice (Fig. 2h). This was probably an underestimate because dissociation of TOE spleens was difficult due to extensive fibrosis. HSC frequency and number increased significantly in the TOE spleens (Fig. 2i and j). HSCs shifted from the bone marrow to the spleen in advanced PMF mice (Fig. 2k and Supplementary Fig. 1c–f). Overall, total HSC number first increased in intermediate PMF followed by a reduction in advanced PMF (Supplementary Fig. 1g). These data suggest a pathogenic process of PMF: HSCs initially overproliferate and start mobilizing to the spleen; as the disease progresses, the bone marrow becomes fibrotic and hypocellular, and many HSCs shift to the spleen in advanced stages of PMF.
Lepr+ mesenchymal stromal cells undergo fibrotic expansion
The above data suggest that bone marrow fibrosis contributes to bone marrow haematopoietic failure. However, the identity of cells that deposit collagen fibers and render bone marrow fibrotic is elusive. Bone marrow Lepr+ mesenchymal stromal cells, which uniformly express PDGFRa and PDGFRb 1, 3, arise perinatally and are major contributor to bone formed in adults but not during development 3. They give rise to nearly all CFU-Fs in adult bone marrow and can differentiate into bone, cartilage and adipocytes in vitro and in vivo 3. These observations prompted us to test whether Lepr+ stromal cells are responsible for bone marrow fibrosis in vivo. The frequency of enzymatically dissociated CD45/Ter119−PDGFRa+ stromal cells significantly increased in TOE mice (Fig. 3a and Supplementary Fig. 2a). Lepr-cre knockin allele recombines specifically in PDGFRa+ bone marrow mesenchymal stromal cells1, 3. We fate-mapped Lepr+ lineage cells using Lepr-cre; tdTomato mice in which PMF was induced by transplanting TOE retrovirus-infected bone marrow cells (Fig. 3b). Consistent with the increased stromal cell frequency (Fig. 3a and Supplementary Fig. 2a), tdTomato+ cells expanded dramatically in TOE mice compared with mice transplanted with bone marrow cells infected with control virus (Fig. 3c–f and Supplementary Fig. 2b). These tdTomato+ stromal lineage cells elaborated extensive cellular processes resembling myofibroblasts (Fig. 3e and f and Supplementary Fig. 2c–d), suggesting that these cells assumed a fibrotic cell fate.
Figure 3. Bone marrow mesenchymal stromal cells undergo expansion and fibrotic conversion in PMF.
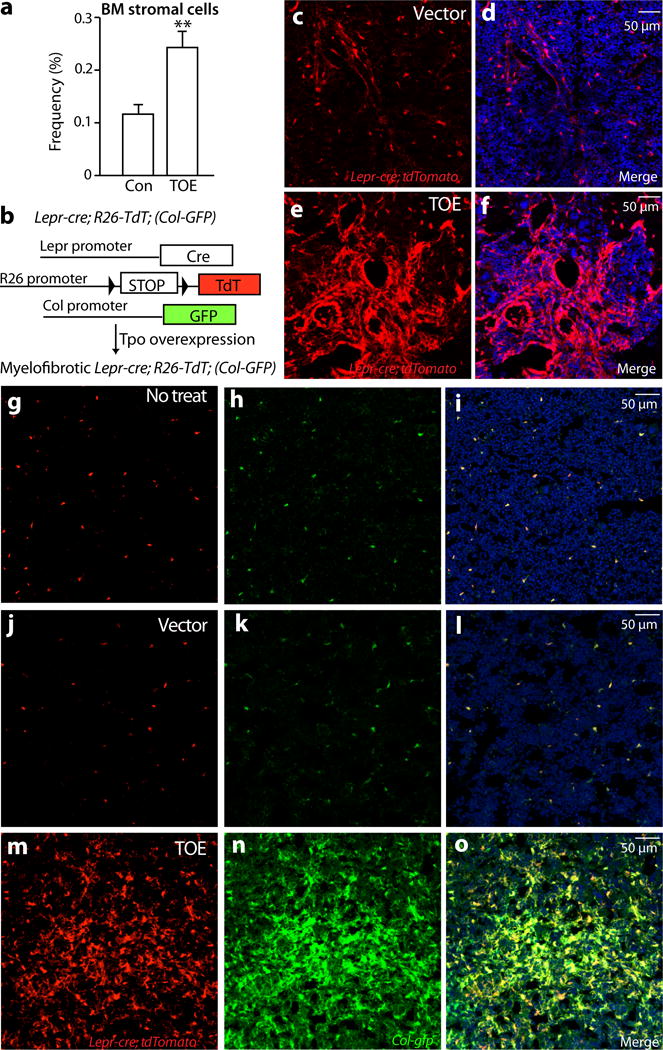
a. Flow cytometric analysis of enzymatically dissociated bone marrow cells showing a significant increase of mesenchymal stromal cells (n=17 mice for control and n=18 mice for TOE).
b. A scheme depicting the in vivo lineage tracing experiments.
c–f. Lepr-cre; loxptdTomato mice were transplanted with Tpo-overexpressing virus-infected bone marrow cells (TOE) or control virus infected bone marrow cells (control). Two to three months after the transplantation, the fate of Lepr-cre-expressing lineage cells was followed by assessing the tdTomato+ cells. Confocal images showing a substantial expansion of Lepr-cre expressing lineage cells in TOE mice.
g–i. Confocal images showing Lepr-cre-expressing tdTomato+ mesenchymal stromal cells were Col-GFP+ in Lepr-cre; loxptdTomato; Col-gfp mice under steady state.
j–o. Bone marrow mesenchymal stromal cells from TOE PMF Lepr-cre; loxptdTomato; Col-gfp mice underwent expansion and were Col-GFP+. Vector controls were Lepr-cre; loxptdTomato; Col-gfp mice transplanted with control virus-infected bone marrow cells. TOE, Tpo-overexpressing. Con, control vector virus. Data represent mean±sem. Two-tailed student’s t-tests were used to assess statistical significance: *p<0.05. Images are representative of at least 3 biological replicates.
To directly assess whether the Lepr+ stromal cells are the myofibroblastic cells, we used Collagen1a1-GFP (Col-GFP) reporter mice 34, which labels Collagen1a1-expressing myofibroblastic cells in multiple organs 23, 35, 36. We generated Lepr-cre; tdTomato; Col-gfp mice to examine whether tdTomato+ cells are Col-GFP+ in the PMF bone marrow. In Lepr-cre; tdTomato; Col-gfp mice without PMF induction, sparse tdTomato+ cells and Col-GFP+ cells overlapped (Fig. 3g–i), suggesting that Lepr+ stromal cells expressed collagen and had some fibrogenic capacity even under steady state. We then induced PMF by transplanting TOE virus-infected bone marrow cells into these mice. At three to four months after the transplantation, mice were analyzed. Consistent with our earlier observation, tdTomato+ stromal lineage cells underwent a significant expansion in TOE bone marrow (Fig. 3j–o). Virtually all of the tdTomato+ cells were Col-GFP+ (Fig. 3j–o and Supplementary Fig. 2e). Conversely, virtually all Col-GFP+ cells were tdTomato+ (Fig. 3j–o and Supplementary Fig. 2f). These data demonstrate that Lepr+ lineage cells are the major if not exclusive source of myofibroblasts responsible for fibrosis in the PMF bone marrow.
Mesenchymal stromal cells down-regulate key niche factors for HSCs
Lepr+ mesenchymal stromal cells plays a critical role in bone marrow HSC maintenance by generating key niche factors, CXCL12 and SCF 1, 2, 37. Bone marrow Lepr+ cells, Cxcl12high cells and Scfhigh cells are essentially the same mesenchymal population 1-3. Fibrogenic conversion of these cells may alter their capacity to support HSCs. We examined the niche function of these cells in PMF by evaluating the expression of key niche-derived HSC maintenance factors. We directly assessed CXCL12 expression in the bone marrow from Cxcl12DsRed/+ knockin mice 2 with PMF induction. Cxcl12DsRed/+ mice reconstituted with empty vector virus-infected bone marrow cells were used as controls. The expression level of Cxcl12-DsRed was reduced in TOE mice compared with controls, although the frequency of these cells did not seem to change as revealed by confocal microscopy (Fig. 4a–d and Supplementary Fig. 3a–d) and by flow cytometry (Fig. 4e). Quantification of the intensity of Cxcl12-DsRed and quantitative real-time PCR (qRT-PCR) analysis showed that there was significant reduction of DsRed expression level and Cxcl12 transcripts by mesenchymal stromal cells (Fig. 4f–h and Supplementary Fig. 3e). Many of the Cxcl12-DsRed+ stromal cells displayed elongated fibroblast-like cell morphology (Supplementary Fig. 3c and d), consistent with the notion that these cells adopted a fibrogenic cell fate. Since CXCL12 is a major HSC retention signal 2, 38, its down-regulation provides a potential mechanistic explanation for HSC mobilization out of the bone marrow in PMF.
Figure 4. Bone marrow mesenchymal stromal cells down-regulate key HSC maintenance factors, CXCL12 and SCF.
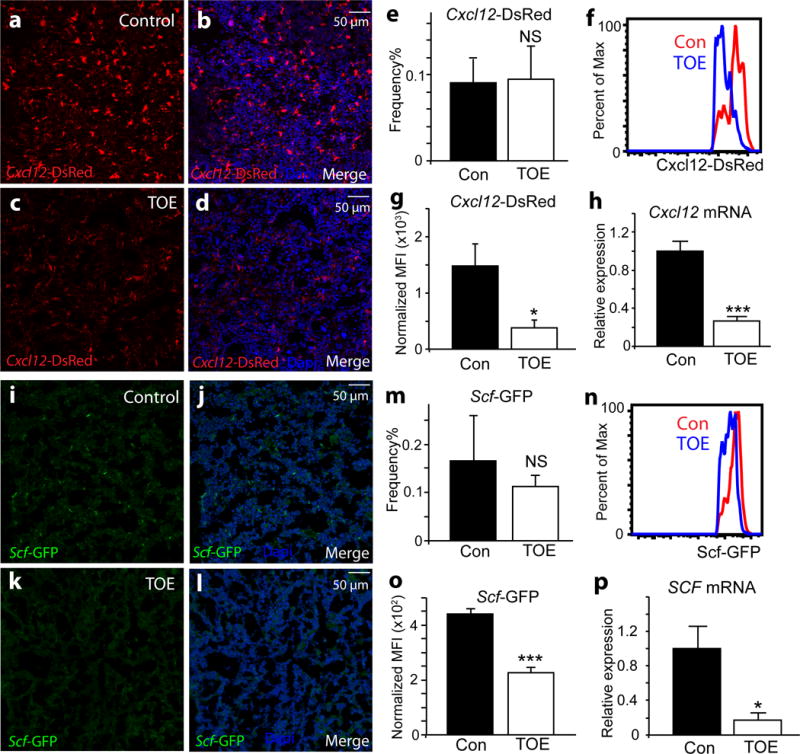
a–d. Confocal images showing Cxcl12-DsRed reporter expressing in the bone marrow of Cxcl12DsRed/+ mice transplanted with control virus-infected bone marrow cells (a-b). The expression level of Cxcl12-DsRed reporter was dramatically down-regulated in the bone marrow of Cxcl12DsRed/+ mice transplanted with Tpo-overexpressing virus-infected bone marrow cells (TOE) (c-d) compared with controls (a-b). Nuclei were stained with DAPI (blue).
e. The frequency of CD45/Ter119−Cxcl12-DsRed+ mesenchymal stromal cells was not significantly altered in TOE mice compared with controls (n=4 mice for control and n=6 mice for TOE).
f–g. The fluorescent intensity of Cxcl12-DsRed was significantly reduced in TOE mice compared with controls as assessed by flow cytometry (n=4 mice for control and n=6 mice for TOE).
h. qPCR analysis revealed that Cxcl12 transcripts were significantly decreased in sorted mesenchymal stromal cells from TOE mice compared with controls (n=3 mice for control and n=4 mice for TOE).
i–l. The expression level of Scf-GFP reporter was down-regulated in TOE mice. GFP (green) shows Scf-GFP+ cells. Nuclei were stained with DAPI (blue).
m. The frequency of CD45/Ter119−Scf-GFP+ stromal cells was not significantly altered in TOE mice (n=3 mice for control and n=4 mice for TOE).
n–o. The fluorescent intensity of Scf-GFP was significantly reduced in TOE mice as assessed by flow cytometry (n=3 mice for control and n=4 mice for TOE).
p. qPCR analysis showed Scf transcripts were significantly decreased in sorted mesenchymal stromal cells (n=3 mice for control and n=4 mice for TOE). TOE, Tpo-overexpressing. Con, control vector virus. All data represent mean±sem.. Two-tailed student’s t-tests were used to assess statistical significance: *p<0.05, ***p<0.001, NS, not significant. Images are representative of at least 3 biological replicates.
Taking advantage of an Scfgfp/+ knockin reporter 1, we assessed the expression of Scf-GFP+ in the PMF bone marrow. There was a down-regulation of Scf-GFP expression level in the PMF bone marrow revealed by confocal microscopy (Fig. 4i–l). By flow cytometry, the frequency of CD45/Ter119−Scf-GFP+ stromal cells did not differ significantly between TOE and control bone marrow (Fig. 4m and Supplementary Fig. 3f). The Scf-GFP expression level at single-cell resolution was significantly reduced in PMF bone marrow as assessed by flow cytometry (Fig. 4n and o). qRT-PCR analysis also showed a significant reduction of Scf transcripts (Fig. 4p and Supplementary Fig. 3e). Overall, the above data suggest that adaptation of a fibrotic cell fate by mesenchymal stromal cells leads to lower expression of key HSC niche factors and thus compromised bone marrow niche.
Mesenchymal stromal cells undergo fibrotic conversion/differentiation in PMF
We performed a genome-wide gene expression profiling to molecularly characterize the mesenchymal stromal cells in PMF. We sorted CD45/Ter119−Cxcl12-DsRed+ mesenchymal stromal cells as Cxcl12 expression is a direct marker for functional HSC niche cells. Although Cxcl12-DsRed is expressed by other bone marrow cells at low levels 2 and its expression level was down-regulated ~ 4 fold (Fig. 4f and g), our sorting strategy purified most mesenchymal stromal cells expressing high levels of DsRed (Supplementary Fig. 4a). As expected, these cells also expressed high levels of mesenchymal markers such as Pdgfra (CD140a), Pdgfrb(CD140b) and Lepr (Supplementary Fig. 4b). CD45/Ter119−Cxcl12-DsRed+ cells expressed very little, if any, Nestin or Ng2 (Supplementary Fig. 4b). Statistical analysis identified 480 up-regulated genes (p<0.05, fold>1.5) and 146 down-regulated genes (p<0.05, fold>1.5) from TOE mice compared with controls (Fig. 5a). Gene ontology (GO) analysis using the Database for Annotation, Visualization and Integrated Discovery (DAVID) identified several significantly enriched processes, including extracellular matrix, cell adhesion and proteinaceous extracellular matrix (Fig. 5b), suggesting a fibrotic conversion/differentiation of these cells.
Figure 5. Mesenchymal stromal cells up-regulate fibrosis and osteogenesis genes in PMF.
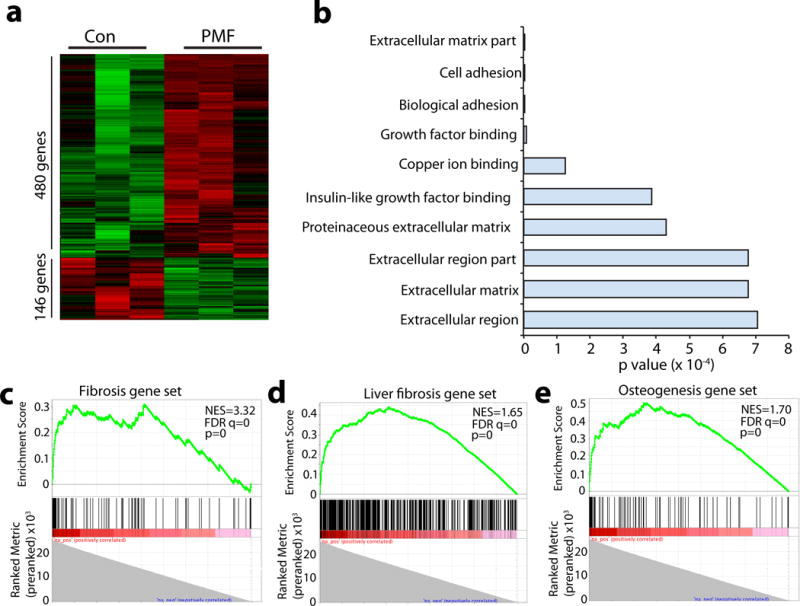
a. Heat map showed 480 significantly up-regulated and 146 significantly down-regulated genes in freshly sorted mesenchymal stromal cells from PMF mice compared with controls identified by gene expressing profiling analysis (n=3 mice for control and TOE each).
b. Gene ontology (GO) analysis showed biological processes significantly affected in mesenchymal stromal cells from PMF mice.
c–e. Gene set enrichment analysis (GESA) showed significant enrichment of fibrosis genes (c and d) and osteogenesis genes (e) in mesenchymal stromal cells from PMF mice. NES, normalized enrichment score. FDR, false discovery rate. p, nominal p value.
To systematically test whether these cells underwent fibrotic conversion, we performed gene set enrichment analysis (GSEA). A mouse fibrosis gene set was obtained from Qiagen (www.qiagen.com), which includes 85 key genes involved in dysregulated tissue remodeling during the repair and healing of wounds (Supplementary Fig. 4c). We found that Cxcl12+ mesenchymal stromal cells from PMF bone marrow expressed many genes associated with fibrosis (normalized enrichment score (NES)=3.32, false discovery rate (FDR) q=0 and p=0) (Fig. 5c). Using a published fibrosis gene signature from in vivo fibrotic liver stellate cells 39, we performed an independent GSEA analysis. Again, PMF mesenchymal stromal cells significantly expressed many genes associated with liver stellate cell fibrosis (NES=1.65, FDR q=0 and p=0), confirming their fibrotic conversion (Fig. 5d). Since Lepr+ stromal cells are the main source of bone formed in the adult bone marrow 3 and osteosclerosis is a feature of myelofibrosis 40, we tested whether the PMF mesenchymal stromal cells globally up-regulated osteoblastic genes. A mouse osteogenesis gene set was obtained from Qiagen (www.qiagen.com), which includes 82 genes related to osteogenic differentiation (Supplementary Fig. 4d). A GSEA analysis revealed that PMF mesenchymal stromal cells significantly expressed many osteogenic genes (NES=1.7, FDR q=0 and p=0) (Fig. 5e). Thus the mesenchymal stromal cells underwent global gene expression change to a fibrotic/osteogenic fate in the PMF bone marrow.
Genes that were significantly more highly expressed in PMF mesenchymal stromal cells included genes encoding extracellular matrix: Acta2 (a-smooth muscle actin), Fn (fibronectin), several collagens (Col12a1, Col1a1, Col1a2 and Col3a1) and integrins (Itgbl1, Itga2 and Itgb5) (Supplementary Table 1). Extracellular matrix remodeling enzymes were also up-regulated, including Mmp9 (matrix metallopeptidase 9), Timp1 (tissue inhibitor of metalloproteinase 1), Mmp2 (matrix metallopeptidase 2), Timp3 (tissue inhibitor of metalloproteinase 3) and Mmp14 (matrix metallopeptidase 14) (Supplementary Table 1). Several highly up-regulated genes associated with osteogenesis included Postn (periostin, osteoblast specific factor), Spp1 (secreted phosphoprotein 1, osteopontin) and Alpl (alkaline phosphatase, liver/bone/kidney) (Supplementary Table 1). We also observed a significant reduction of Lepr (Supplementary Table 1), although the expression level was still high (Supplementary Fig. 4b). A recent study reported that LepR from bone marrow stromal cells promotes adipogenesis and inhibits osteogenesis 41. The down-regulation of Lepr is consistent with the elevated osteogenesis of these cells in PMF. In line with our analysis on niche factor expression (Figure 4), we also observed downregulation of Cxcl12 and Scf (Supplementary Fig. 4b). Altogether, these data demonstrate that bone marrow mesenchymal stromal cells undergo fibrotic conversion/differentiation and are thus likely the origin of myofibroblasts responsible for fibrosis in the PMF bone marrow.
PDGFRa in mesenchymal stromal cells is required for bone marrow fibrosis
The identification of Lepr+ mesenchymal stromal lineage cells as bone marrow myofibroblasts in PMF provided us an opportunity to investigate the molecular pathways involved in their fibrotic conversion. Activation of PDGFRa has been implicated in fibrosis of multiple organs 22, 23. As Lepr+ mesenchymal stromal cells are the major cell type expressing PDGFRa in the bone marrow 1, we wondered whether PDGFRa in mesenchymal stromal cells is required for their fibrotic conversion. We conditionally deleted Pdgfra from bone marrow mesenchymal stromal cells by generating Lepr-cre; Pdgfrafl/fl or Lepr-cre; Pdgfrafl/− mice. PDGFRa was efficiently deleted from bone marrow mesenchymal stromal cells (Supplementary Fig. 5a). Bone marrow cells from these mice had normal reconstitution activity when transplanted into lethally irradiated recipient mice (Supplementary Fig. 5b). We induced PMF by transplanting TOE virus-infected bone marrow cells into Lepr-cre; Pdgfrafl/fl and control mice. At 2–3 months after the bone marrow transplantation, HSC frequency from both Lepr-cre; Pdgfrafl/fl and control mice were similarly increased in the spleen (Fig. 6a). This was accompanied by enlarged spleens with likely ongoing extramedullary haematopoiesis (Fig. 6b–c and Supplementary Fig. 5c). Reticulin staining on spleen sections from Lepr-cre; Pdgfrafl/fl mice demonstrated excessive deposition of reticulin fibers to the same extent as those from control TOE mice (Supplementary Fig. 5d). These data revealed that Lepr-cre; Pdgfrafl/fl TOE mice developed many features of PMF in the spleen.
Figure 6. Deletion of Pdgfra from mesenchymal stromal cells or administrating imatinib ameliorates bone marrow fibrosis.
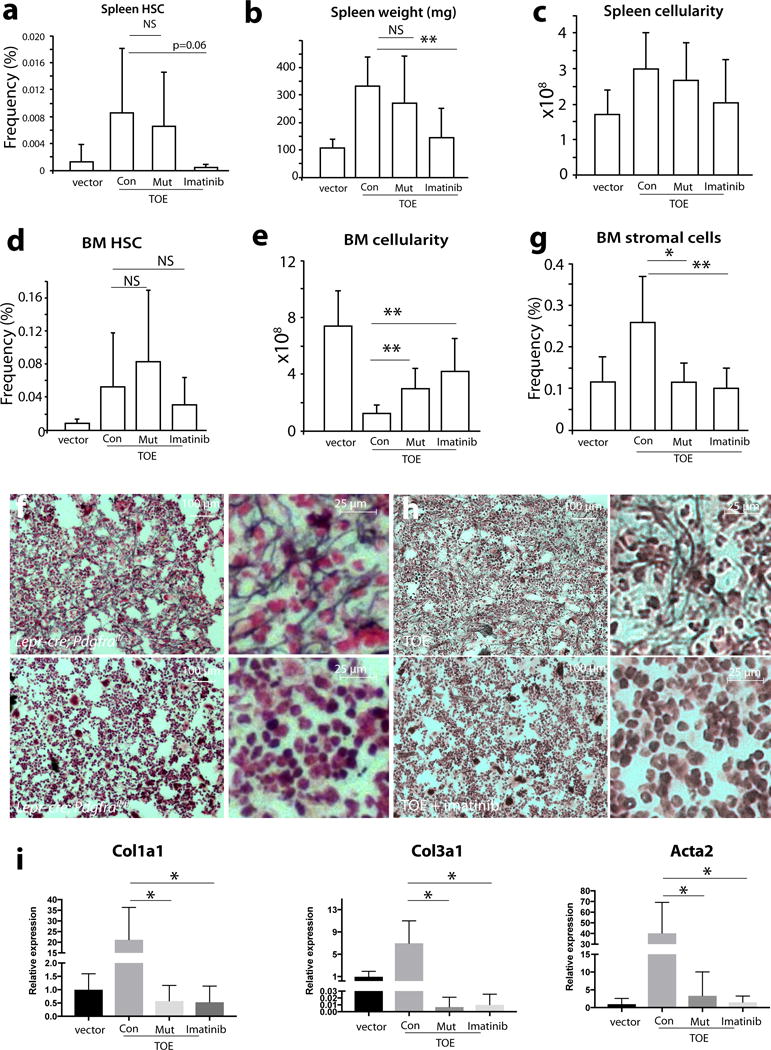
a. Lepr-cre; Pdgfrafl/fl TOE mice had an increase of spleen HSC frequency similar to control TOE mice while imatinib suppresses HSC mobilization (n=22 mice for vector, n=10 mice for Con, n=8 mice for Mut, n=7 mice for imatinib). vector = vector in control; Con = TOE in control; Mut = TOE in Lepr-cre; Pdgfrafl/fl ; imatinib = TOE treated with imatinib.
b–c. Lepr-cre; Pdgfrafl/fl TOE mice but not imatinib-treated TOE mice displayed increased spleen weight (b, n=18 mice for vector, n=8 mice for Con, n=7 mice for Mut, n=7 mice for imatinib) and cellularity (c, n=15 mice for vector, n=7 mice for Con, n=7 mice for Mut, n=7 mice for imatinib) compared with control TOE mice.
d. Bone marrow from Lepr-cre; Pdgfrafl/fl TOE or imatinib-treated TOE mice had no significant change in HSC frequency, compared with control TOE mice (n=21 mice for vector, n=10 mice for Con, n=8 mice for Mut, n=7 mice for imatinib).
e. Lepr-cre; Pdgfrafl/fl TOE and imatinib-treated TOE mice had significant increase of bone marrow cellularity compared with control TOE mice (n=21 mice for vector, n=10 mice for Con, n=8 mice for Mut, n=7 mice for imatinib).
f. Deletion of Pdgfra from mesenchymal stromal cells led to blockage of reticulin deposition in the bone marrow from Lepr-cre; Pdgfrafl/fl TOE mice.
g. Deletion of Pdgfra from Lepr+ stromal cells or administration of imatinib led to suppression of the overproliferation of bone marrow CD45/Ter119−PDGFRb+ mesenchymal stromal cells in TOE mice (n=17 mice for vector, n=8 mice for Con, n=6 mice for Mut, n=7 mice for imatinib).
h, Administration of imatinib led to blockage of reticulin fiber deposition in the bone marrow of TOE mice.
i, Deletion of Pdgfra from Lepr+ stromal cells or administration of imatinib suppresses fibrotic genes in bone marrow mesenchymal stromal cells (n=4 mice for vector, n=4 mice for Con, n=4 mice for Mut, n=4 mice for imatinib).
Data represent mean±s.d.. Two-tailed student’s t-tests were used to assess statistical significance: *p<0.05, **p<0.01, NS, not significant.
Myeloid proliferation and HSC expansion occurred similarly in Lepr-cre; Pdgfrafl/fl TOE and control TOE mice (Fig. 6d). There was a significant rescue of the bone marrow cellularity in Lepr-cre; Pdgfrafl/fl mice (Fig. 6e), suggesting an improvement of the bone marrow niche function. Megakaryocyte hyperplasia was similar in Lepr-cre; Pdgfrafl/fl and control TOE mice (Supplementary Fig. 5e). We then examined bone marrow fibrosis by performing reticulin staining. Consistent with our earlier observation (Fig. 1j), excessive reticulin fiber deposition was observed in the bone marrow from control TOE mice (Fig. 6f, upper panels and Supplementary Fig. 5f). In contrast, we did not observe reticulin staining in the bone marrow from Lepr-cre; Pdgfrafl/fl TOE mice (Figure 6f, lower panels and Supplementary Fig. 5f). Consistent with the ameliorated fibrosis, flushing the bone marrow cells out of the bone from Lepr-cre; Pdgfrafl/fl TOE mice was dramatically easier compared with fibrotic control TOE bone marrow likely due to the absence of excessive fibrosis and osteosclerosis. The increased frequency of mesenchymal stromal lineage cells was suppressed to almost vector control level in Lepr-cre; Pdgfrafl/fl TOE mice (Fig. 6g and Supplementary Fig. 5g). Several fibrotic genes, such as Col1a1, Col3a1 and Acta2, were significantly down-regulated in Lepr-cre; Pdgfrafl/fl TOE mice (Fig.6i). Thus, PDGFRa signaling in Lepr+ mesenchymal stromal cells is required for bone marrow fibrosis in PMF. These data functionally show that bone marrow Lepr+ mesenchymal stromal cells are the cell type responsible for fibrosis in PMF.
Imatinib effectively blocks the activity of several tyrosine kinases, including PDGFRa 42. We assessed whether imatinib treatment would alleviate bone marrow fibrosis. PMF was induced in TOE mice and then imatinib was administrated through chow. Imatinib effectively rescued bone marrow hypocellularity and blocked mesenchymal stromal cell expansion, fibrotic conversion, and bone marrow fibrosis (Fig. 6e, g, h and i). Imatinib also effectively suppressed spleen extramedulary haematopoiesis and fibrosis, suggesting that other cell types and/or pathways may mediate PMF spleen pathogenesis (Fig. 6a–c and Supplementary Fig. 5c, h). Our results suggest that targeting PDGFRa pathway in mesenchymal stromal cells may be beneficial in treating bone marrow fibrosis.
Activation of PDGFRa in Lepr+ bone marrow mesenchymal stromal cells leads to their expansion and extramedullary haematopoiesis
To directly test whether activation of the PDGFRa pathway in mesenchymal stromal cells has an impact on PMF pathogenesis, we conditionally activated PDGFRa by generating Lepr-cre; PdgfraD842V/+; tdTomato mice (Fig. 7a). The PdgfraD842V allele allows for cell-type specific activation of PDGFRa pathway under the control of its endogenous promoter 22, 23. By flow cytometry, bone marrow stromal cell frequency was largely unchanged in Lepr-cre; PdgfraD842V/+ mice (Supplementary Fig. 6a). However, by confocal microscopy, we observed foci with a significant increase of tdTomato+ stromal cells in the trabecular bone region of Lepr-cre; PdgfraD842V/+; tdTomato mice (Fig. 7b–d). We also observed excessive osteogenesis in the diaphysis region of these mice (Fig. 7e–f). However, no excessive bone marrow fibrosis was observed (Supplementary Fig. 6b).
Figure 7. Activation of PDGFRa pathway in Lepr+ cells leads to mesenchymal stromal cell expansion and HSC mobilization.
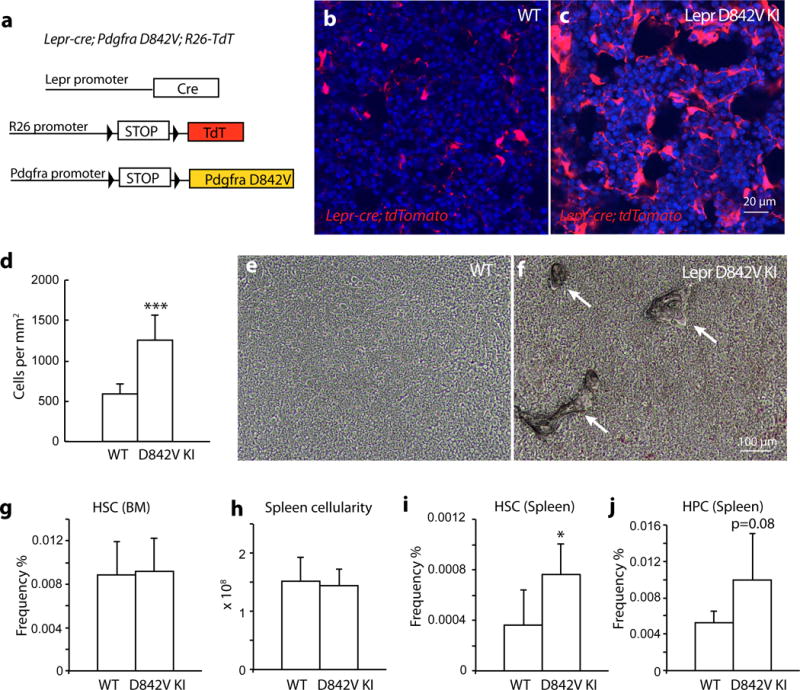
a. A scheme depicting the in vivo lineage tracing experiments with Lepr-cre; PdgfraD842V/+; tdTomato mice.
b–c. Confocal images showing expansion of tdTomato+ stromal cells in the trabecular region of bone marrow from Lepr-cre; PdgfraD842V/+; tdTomato mice.
d. Quantification of tdTomato+ cells on bone marrow images from trabecular region showing that tdTomato+ cells were significantly expanded in Lepr-cre; PdgfraD842V/+; tdTomato mice compared with controls (n=12 representative confocal images from 3 independent mice each).
e–f. Bright-field images of the diaphysis region showing excessive bone formation in Lepr-cre; PdgfraD842V/+ mice. Arrows point to bone.
g–h. Lepr-cre; PdgfraD842V/+ mice had normal bone marrow HSC frequency (g, n=4 mice for control, n=5 mice for D842V) and spleen cellularity (h, n=5 mice for control, n=6 mice for D842V).
i–j. Lepr-cre; PdgfraD842V/+ mice displayed increased HSC (i, n=5 mice for control, n=6 mice for D842V) and haematopoietic progenitor HPC (LSK) (j, n=5 mice for control, n=6 mice for D842V) frequencies in the spleen.
Data represent mean±s.d.. Two-tailed student’s t-tests were used to assess statistical significance: *p<0.05, ***p<0.001. Images are representative of at least 3 biological replicates.
Lepr-cre; PdgfraD842V/+ mice had normal bone marrow cellularity and HSC frequency (Fig. 7g and Supplementary Fig. 6c). However, these mice had increased HSC and haematopoietic progenitor frequencies in the spleens and livers (Fig. 7h–j and Supplementary Fig. 6d). These results suggest that activation of PDGFRa pathway in Lepr+ cells is sufficient to cause some features of PMF: mesenchymal stromal cell expansion, osteogenesis and HSC mobilization.
Discussion
Although PMF has been recognized as a haematological disease originating from abnormal HSCs, its clinical features suggest a more complex pathogenesis. The bone marrow fibrosis associated with PMF has been hypothesized as a stromal reaction to the overproliferative haematopoietic clones, but the precise identity of the reactive myofibroblasts had not previously been identified. Our fate mapping data demonstrate that Lepr+ mesenchymal stromal cells are the cells of origin of myofibroblasts responsible for collagen fiber generation and deposition in PMF. The identification of these cells warrants further detailed investigation aimed at developing targeted therapies to treat bone marrow fibrosis.
In this study we observed expansion of bone marrow Lepr+ mesenchymal stromal lineage cells in PMF (Fig. 3a, c–f and Supplementary Fig. 2a–d). A report using Nestin as a marker suggests that bone marrow stromal cell number is reduced in Jak2V617F mice 32. The authors performed Nestin-creER fate mapping and did not observe contribution from this lineage to myofibroblasts. Several previous studies have shown that Nestin-cre or Nestin-creER recombines in only rare bone marrow stromal cells 1, 3, 43. These cells are not CFU-Fs and contribute little, if any, to skeletal tissues 3, 43. Thus, Nestin-creER unlikely targets mesenchymal stromal cells. It should be noted that although low expression of a Nestin-GFP transgene is a marker for CFU-F, the expression of endogenous Nestin, or other Nestin transgenic lines (including Nestin-cre or Nestin-CreER) does not mark the same mesenchymal stromal cells 1, 3, 43. Thus, our data are consistent with the notion that Lepr+ stromal cells but not Nestin+, Nestin-cre+ or Nestin-creER+ cells are the source of bone marrow myofibroblasts in PMF.
NG2+ cells have been reported to contain bone marrow CFU-Fs 29. However, a fate-mapping experiment demonstrated Ng2-creER+ cells did not contribute to PDGFRa+ stromal cells 29, suggesting these cells are unlikely the source of bone marrow fibrosis. Gli1+ and Gremlin-1+ bone marrow stromal cells also contain CFU-Fs 43, 44. Their contributions to bone marrow fibrosis are unknown. The contributions to bone marrow fibrosis by distinct yet overlapping mesenchymal stromal cells bearing different markers require further investigations.
Our Lepr-cre; Pdgfrafl/fl TOE mice still developed severe spleen fibrosis (Supplementary Fig. 5d). It could be that Lepr-cre does not target all of the spleen fibrogenic cells and/or that PDGFRa is not required for spleen fibrosis. Over-activation of PDGFRa is sufficient to drive fibrosis in diverse organs 22, 23. We thus favor the first possibility. Identification of the spleen fibrogenic cells will directly distinguish these possibilities. Recently, spleen Tcf21+ perivascular stromal cells have been identified as an important component of the spleen niche 45. It will be interesting to determine the relative contributions of the Tcf21+ and Lepr+ cells to spleen fibrosis. Imatinib exerted more potent effects against bone marrow fibrosis and HSC mobilization than genetic deletion of Pdgfra from Lepr+ cells (Fig. 6 and Supplementary Fig. 5). Given that imatinib targets several tyrosine kinases including BCR-ABL, PDGFR and c-KIT, it is likely that the additional molecular and cellular targets account for the stronger effects of the drug.
Lepr-cre; PdgfraD842V/+ mice showed regional stromal cell expansion and HSC mobilization (Fig.7). But the phenotypes were not as pronounced as the TOE model. This could reflect the partial activation of the PDGFRa pathway in the D842V model 22. However, other pathways could be co-operating in TOE to induce more prominent PMF pathology. Further elucidation of the PDGFRa and other pathways in PMF will deepen our understanding of the pathogenesis.
The modification of the bone marrow niche by abnormal haematopoietic cells is a critical contributor to many haematological diseases 4. Consistent with early observations 15, our data suggest that hyperplastic megakaryocytes are the source of PDGF and other cytokines promoting bone marrow mesenchymal stromal cell fibrosis and HSC niche dysfunction. Current therapies for PMF focused on the haematopoietic compartment by targeting the mutant haematopoietic clones. But the overall benefits are limited. Imatinib mesylate have been preliminarily explored in PMF 46, 47, but its clinical benefits were limited due to side effects. Our results call for additional detailed study. We propose that combined therapy against both mutant haematopoietic clone (e.g. with JAK inhibitors) and dysfunctional, fibrotic bone marrow niche (e.g. with imatinib or other PDGFRa inhibitors) with careful treatment regimen may lead to better outcome.
Methods
Mice
Lepr-cre 48, LoxptdTomato 49 and Pdgfrafl 50 mice were obtained from the Jackson Laboratory. Scfgfp, Cxcl12DsRed and Col-gfp mice were described previously 1, 2, 34. PdgfraD842V mice 22, 23 were kindly provided by Drs. Lorin Olson and Philippe Soriano. All mice were maintained on C57BL/6 background. Experiments were started on 8-week-old young adult mice and gender was not selected. Mice were housed in specific pathogen-free, Association for the Assessment and Accreditation of Laboratory Animal Care (AAALAC)- approved facilities at the Columbia University Medical Center. All protocols were approved by the Institute Animal Care and Use Committee of Columbia University and were under the Animal Welfare Assurance A3007-01. Two-tailed student’s t-tests were used to assess statistical significance (*p<0.05, **p<0.01, ***p<0.001).
Retroviral production and infection of bone marrow cells
Mouse Tpo mRNA was cloned into pMIG retroviral vector. A DsRed version and a ‘colorless’ version of pMIG-Tpo were generated by replacing GFP reporter with DsRed or deleting GFP gene in pMIG, respectively. These versions of retroviral vectors allowed tracing of infected bone marrow cells in recipient mice. Retroviruses were produced by transfecting 293T cells with pMIG-Tpo or pMIG vectors along with pCL-Eco. Fluorouracil (5-FU) (150mg/kg) was injected into donor mice via I.V. route. Four to five days later, mice were euthanized and bone marrow cells were collected. DMEM with 15% heat-inactivated fetal bovine serum, 100ng/ml SCF, 10ng/ml IL-3, 10ng/ml IL-6 (from Peprotech) and 50um 2-mercaptoethanol was used to pre-stimulate 5-FU-treated bone marrow cells overnight. Two spin infections were carried out before bone marrow cells were transplanted into lethally irradiated recipient mice at 1–10 million cells /mouse.
Bone marrow transplantation
Adult recipient mice were lethally irradiated by a Cesium 137 Irradiator (JL Shepherd and Associates) at 300 rad/minute with two doses of 540 rad (total 1080 rad) delivered at least 2h apart. Cells were transplanted by retro-orbital venous sinus injection of anesthetized mice. Mice were maintained on antibiotic water (Baytril 0.17g/L) for 14 days then switched to regular water. Recipient mice were periodically bled to assess the level of donor-derived blood cells (by flow cytometry), platelet (by CBC count) and serum TPO level (by ELISA).
Flow cytometry
Bone marrow cells were isolated by flushing the long bones or by crushing the long bones with mortal and pestle in Ca2+ and Mg2+ free HBSS with 2% heat-inactivated bovine serum. Spleen cells were obtained by crushing the spleen between two glass slides. The cells were drawn by passing through a 25G needle several times and filtered with a 70μm nylon mesh. The following antibodies were used to stain HSCs: anti-CD150 (TC15-12F12.2, Biolegend, Cat#115903 or 115911, 1:200), anti-CD48 (HM48-1, Biolegend, Cat#103411, 1:200), anti-Sca-1 (E13-161.7, Biolegend, Cat#122513, 1:200), anti-cKit (2B8, Biolegend, Cat#105825, 1:200), lineage markers (anti-Ter119, Biolegend, Cat#116205 or 116207, 1:200; anti-B220 (6B2), Biolegend, Cat#103205 or 103207, 1:400; anti-Gr1 (8C5), Biolegend, Cat#108405 or 108407, 1:400; anti-CD2 (RM2-5), Biolegend, Cat#100105 or 100107, 1:200; anti-CD3 (17A2), Biolegend, Cat#100203 or 100205, 1:200; anti-CD5 (53-7.3), Biolegend, Cat#100605 or 100607, 1:400 and anti-CD8 (53-6.7), Biolegend, Cat#100705 or 100707, 1:400). DAPI was used to exclude dead cells. For flow cytometric analysis of stromal cells, bone marrow was flushed using HBSS- with 2% bovine serum. Then the whole bone marrow was digested with Collagenase IV (200U/ml) and DNase I (200U/ml) at 37°C for 20 min. Samples were then stained with antibodies and analyzed by flow cytometry. Anti-CD140a (APA5), Biolegend, Cat#135909, 1:100; anti-CD140b (APB5), Biolegend, Cat#136009, 1:100; anti-CD45 (30-F11), Biolegend, Cat#103111, 1:400 and anti-Ter119, Biolegend, Cat#116211, 1:200 antibodies were used to stain mesenchymal stromal cells. For flow cytometric analysis of peripheral blood chimera levels, peripheral blood was subjected to ammonium chloride potassium red cell lysis before antibody staining. Antibodies including anti-CD45.2 (104), Biolegend, Cat#109805, 1:400; anti-CD45.1 (A20), Biolegend, Cat#110715, 1:200; anti-Gr1 (8C5), Biolegend, Cat#108415, 1:400; anti-Mac-1 (M1/70), Biolegend, Cat#101211, 1:400; anti-B220 (6B2), Biolegend, Cat#103209, 1:400 and anti-CD3 (17A2), Biolegend, Cat#100205, 1:200 were then added to stain cells. Samples were run on FACSAria II, LSRII or FACSCanto II flow cytometers. Data were analyzed by FACSDiva (BD) or FlowJo (Tree Star) software.
Bone sectioning and immunostaining
Freshly dissected long bones were fixed in a Formalin-based fixative at 4°C for 3 hours. Then the bones were embedded in 8% gelatin in PBS. Samples were snap frozen with liquid N2 and stored at −80°C. Bones were sectioned using a CryoJane system (Instrumedics). Sections were dried overnight at room temperature (RT) and stored at −80°C. Sections were re-hydrated in PBS for 5 min before immunostaining. 5% goat serum in PBS was used to block the sections. Primary antibodies were applied to the slides for 1h at RT followed by secondary antibody incubation for 30min at RT with repetitive washes in between. Slides were mounted with anti-fade prolong gold (Life Tech) and images were acquired on a Zeiss 710 confocal microscope. Rat-anti-CD41 (eBioscience, eBioMWReg30, Cat#13-0411, 1:100) was used as primary antibody.
Reticulin staining
Bone sections prepared as above were stained with Reticulin Stain Kit (Polysciences, Inc.) per manufacture’s instruction. Images were taken on a Zeiss Axio Observer microscope.
Cell cycle analysis
For BrdU incorporation analysis, mice were given an intraperitoneal injection of 0.1mg BrdU in PBS per g of body weight. Then the mice were maintained on 0.5mg/ml BrdU water for 5 days before the analysis. The frequency of BrdU+ cells was determined by flow cytometry using an APC BrdU Flow Kit (BD Biosciences).
Quantitative reverse transcription PCR
Cells were double-sorted directly into Trizol. Total RNA was extracted according to manufacture’s instructions. Quantitative real-time PCR was run using SYBR green on a StepOne Plus (Life Tech) or a CFX Connect Real-time PCR machine (BioRad). β-actin was used to normalize the RNA content of samples. Primers used in this study were: Scf: OLD405: 5′-TTGTTACCTTCGCACAGTGG-3′ and OLD406: 5′-AATTCAGTGCAGGGTTCACA-3′; Cxcl12: OLD35: 5′-TGCATCAGTGACGGTAAACCA-3′ and OLD36: 5′- GTTGTTCTTCAGCCGTGCAA-3′; β-actin: OLD27: GCTCTTTTCCAGCCTTCCTT-3′ and OLD28: 5′-CTTCTGCATCCTGTCAGCAA-3′; Col1a1: OLD826: ACGGCTGCACGAGTCACAC and OLD827: GGCAGGCGGGAGGTCTT; Col3a1: OLD828: 5′-AGGCTGAAGGAAACAGCAAA-3′ and OLD829: 5′-TAGTCTCATTGCCTTGCGTG-3′; Acta2: OLD830: ACTGGGACGACATGGAAAAG and OLD831: GTTCAGTGGTGCCTCTGTCA.
Gene expression profiling and analysis
Three independent, fresh isolated aliquots of approximately 5,000 Cxcl12-DsRed+ cells from bone marrow of from Cxcl12DsRed/+ recipient mice transplanted with Tpo-overexpressing virus-infected bone marrow cells or control virus-infected bone marrow cells were flow cytometrically sorted into Trizol. Total RNA was extracted and amplified using the WT-Ovation Pico RNA Amplification system (Nugen) following manufacture’s instructions. Sense strand cDNA was generated using the WT-Ovation Exon Module (Nugen). Then, cDNA was fragmented and labeled using FL-Ovation DNA Biotin Module V2 (Nugen). The labeled cDNA was hybridized to Affymetrix Mouse Gene ST 1.0 chips following the manufacture’s instructions. Expression values for all probes were normalized and determined using the robust multi-array average (RMA) method via Affymetrix Expression Console. Normalized data were analyzed using NIA Array Analysis 51. Significantly up- or down-regulated genes (p<0.05 and fold>1.5) were used to performed gene ontology analysis using the Database for Annotation, Visualization and Integrated Discovery (DAVID) online tools 52, 53. For gene set enrichment analysis (GSEA), the complete gene expression profiles were ranked based on p values from NIA Array Analysis and used as metric. Gene sets associated with fibrogenesis and osteogenesis were obtained from www.qiagen.com. The analyses were performed as described 54, 55.
Imatinib administration
Imatinib meslyate (0.5g/kg) (Biotang INC) chow was custom made by Envigo. One month after bone marrow transplantation (Tpo overexpression), mice were started on imatinib chow for 2 additional months before analysis.
Statistics and reproducibility
Sample size was not based on power calculations. No animals were excluded from the analysis. The experiments were not randomized. The investigators were not blinded to allocation during experiments and result assessment. Pairwise statistical significance was evaluated by two-tailed Student’s t-test. One-way ANOVA was used to analyze microarray data. All data and statistics were derived from at least three biological replicates. 293T cells were used to generate retrovirus in this study. No cell lines used in this study were found in the database of commonly misidentified cell lines that is maintained by ICLAC and NCBI Biosample. The cell lines were not authenticated. The cell lines were not tested for mycoplasma contamination.
Data availability
Microarray data that support the findings of this study have been deposited in the Gene Expression Omnibus (GEO) under accession code GSE84387. Previously published expression data that were re-analyzed here are available online 39. All other data supporting the findings of this study are available from the corresponding author upon reasonable request.
Supplementary Material
Acknowledgments
This work was supported by the MPN Research Foundation. L.D., J.L. were supported by the Rita Allen Foundation and the National Heart, Lung and Blood Institute (1R01HL132074). Flow cytometry was partly supported by the NIH (S10RR027050 and S10OD020056). We thank Dr. R. Schwabe at Columbia and Dr. D. Brenner at UC San Diego for providing Col-gfp mice. We thank Dr. Lorin Olson at Oklahoma Medical Research Foundation and Dr. Philippe Soriano at Icahn School of Medicine at Mount Sinai for providing PdgfraD842V mice. We thank S. Weyn-Vanhentenryck, C. Zhang and R. Schwabe at Columbia for help on analyzing gene expression data. We thank S. Ho and A. Figueroa for help on flow cytometry.
Footnotes
Author Contributions
G.W., M.D., L.M., Y.L. and L.D. performed all experiments with the help of Q.L. and J.L.. M.D., L.M., G.W. and L.D. designed the experiments, interpreted the results, and wrote the manuscript.
References
- 1.Ding L, Saunders TL, Enikolopov G, Morrison SJ. Endothelial and perivascular cells maintain haematopoietic stem cells. Nature. 2012;481:457–462. doi: 10.1038/nature10783. [DOI] [PMC free article] [PubMed] [Google Scholar]
- 2.Ding L, Morrison SJ. Haematopoietic stem cells and early lymphoid progenitors occupy distinct bone marrow niches. Nature. 2013;495:231–235. doi: 10.1038/nature11885. [DOI] [PMC free article] [PubMed] [Google Scholar]
- 3.Zhou BO, Yue R, Murphy MM, Peyer JG, Morrison SJ. Leptin-receptor-expressing mesenchymal stromal cells represent the main source of bone formed by adult bone marrow. Cell stem cell. 2014;15:154–168. doi: 10.1016/j.stem.2014.06.008. [DOI] [PMC free article] [PubMed] [Google Scholar]
- 4.Schepers K, Campbell TB, Passegue E. Normal and Leukemic Stem Cell Niches: Insights and Therapeutic Opportunities. Cell stem cell. 2015;16:254–267. doi: 10.1016/j.stem.2015.02.014. [DOI] [PMC free article] [PubMed] [Google Scholar]
- 5.Abdel-Wahab OI, Levine RL. Primary myelofibrosis: update on definition, pathogenesis, and treatment. Annual review of medicine. 2009;60:233–245. doi: 10.1146/annurev.med.60.041707.160528. [DOI] [PubMed] [Google Scholar]
- 6.Tefferi A. Myeloproliferative neoplasms: A decade of discoveries and treatment advances. American journal of hematology. 2016;91:50–58. doi: 10.1002/ajh.24221. [DOI] [PubMed] [Google Scholar]
- 7.Araki M, et al. Activation of the thrombopoietin receptor by mutant calreticulin in CALR-mutant myeloproliferative neoplasms. Blood. 2016;127:1307–1316. doi: 10.1182/blood-2015-09-671172. [DOI] [PubMed] [Google Scholar]
- 8.Chachoua I, et al. Thrombopoietin receptor activation by myeloproliferative neoplasm associated calreticulin mutants. Blood. 2016;127:1325–1335. doi: 10.1182/blood-2015-11-681932. [DOI] [PubMed] [Google Scholar]
- 9.Marty C, et al. Calreticulin mutants in mice induce an MPL-dependent thrombocytosis with frequent progression to myelofibrosis. Blood. 2016;127:1317–1324. doi: 10.1182/blood-2015-11-679571. [DOI] [PubMed] [Google Scholar]
- 10.Klampfl T, et al. Somatic mutations of calreticulin in myeloproliferative neoplasms. The New England journal of medicine. 2013;369:2379–2390. doi: 10.1056/NEJMoa1311347. [DOI] [PubMed] [Google Scholar]
- 11.Nangalia J, et al. Somatic CALR mutations in myeloproliferative neoplasms with nonmutated JAK2. The New England journal of medicine. 2013;369:2391–2405. doi: 10.1056/NEJMoa1312542. [DOI] [PMC free article] [PubMed] [Google Scholar]
- 12.Rampal R, et al. Integrated genomic analysis illustrates the central role of JAK-STAT pathway activation in myeloproliferative neoplasm pathogenesis. Blood. 2014;123:e123–133. doi: 10.1182/blood-2014-02-554634. [DOI] [PMC free article] [PubMed] [Google Scholar]
- 13.Jacobson RJ, Salo A, Fialkow PJ. Agnogenic myeloid metaplasia: a clonal proliferation of hematopoietic stem cells with secondary myelofibrosis. Blood. 1978;51:189–194. [PubMed] [Google Scholar]
- 14.Lundberg P, et al. Myeloproliferative neoplasms can be initiated from a single hematopoietic stem cell expressing JAK2-V617F. The Journal of experimental medicine. 2014;211:2213–2230. doi: 10.1084/jem.20131371. [DOI] [PMC free article] [PubMed] [Google Scholar]
- 15.Papadantonakis N, Matsuura S, Ravid K. Megakaryocyte pathology and bone marrow fibrosis: the lysyl oxidase connection. Blood. 2012;120:1774–1781. doi: 10.1182/blood-2012-02-402594. [DOI] [PMC free article] [PubMed] [Google Scholar]
- 16.Yan XQ, et al. Chronic exposure to retroviral vector encoded MGDF (mpl-ligand) induces lineage-specific growth and differentiation of megakaryocytes in mice. Blood. 1995;86:4025–4033. [PubMed] [Google Scholar]
- 17.Villeval JL, et al. High thrombopoietin production by hematopoietic cells induces a fatal myeloproliferative syndrome in mice. Blood. 1997;90:4369–4383. [PubMed] [Google Scholar]
- 18.Shivdasani RA, Fujiwara Y, McDevitt MA, Orkin SH. A lineage-selective knockout establishes the critical role of transcription factor GATA-1 in megakaryocyte growth and platelet development. The EMBO journal. 1997;16:3965–3973. doi: 10.1093/emboj/16.13.3965. [DOI] [PMC free article] [PubMed] [Google Scholar]
- 19.Vannucchi AM, et al. Development of myelofibrosis in mice genetically impaired for GATA-1 expression (GATA-1(low) mice) Blood. 2002;100:1123–1132. doi: 10.1182/blood-2002-06-1913. [DOI] [PubMed] [Google Scholar]
- 20.Jeremy Wen Q, et al. Targeting megakaryocytic-induced fibrosis in myeloproliferative neoplasms by AURKA inhibition. Nature medicine. 2015;21:1473–1480. doi: 10.1038/nm.3995. [DOI] [PMC free article] [PubMed] [Google Scholar]
- 21.Bonner JC. Regulation of PDGF and its receptors in fibrotic diseases. Cytokine & growth factor reviews. 2004;15:255–273. doi: 10.1016/j.cytogfr.2004.03.006. [DOI] [PubMed] [Google Scholar]
- 22.Olson LE, Soriano P. Increased PDGFRalpha activation disrupts connective tissue development and drives systemic fibrosis. Developmental cell. 2009;16:303–313. doi: 10.1016/j.devcel.2008.12.003. [DOI] [PMC free article] [PubMed] [Google Scholar]
- 23.Iwayama T, et al. PDGFRalpha signaling drives adipose tissue fibrosis by targeting progenitor cell plasticity. Genes & development. 2015;29:1106–1119. doi: 10.1101/gad.260554.115. [DOI] [PMC free article] [PubMed] [Google Scholar]
- 24.Gersuk GM, Carmel R, Pattengale PK. Platelet-derived growth factor concentrations in platelet-poor plasma and urine from patients with myeloproliferative disorders. Blood. 1989;74:2330–2334. [PubMed] [Google Scholar]
- 25.Tefferi A. Pathogenesis of myelofibrosis with myeloid metaplasia. Journal of clinical oncology : official journal of the American Society of Clinical Oncology. 2005;23:8520–8530. doi: 10.1200/JCO.2004.00.9316. [DOI] [PubMed] [Google Scholar]
- 26.Morikawa S, et al. Prospective identification, isolation, and systemic transplantation of multipotent mesenchymal stem cells in murine bone marrow. The Journal of experimental medicine. 2009;206:2483–2496. doi: 10.1084/jem.20091046. [DOI] [PMC free article] [PubMed] [Google Scholar]
- 27.Mendez-Ferrer S, et al. Mesenchymal and haematopoietic stem cells form a unique bone marrow niche. Nature. 2010;466:829–834. doi: 10.1038/nature09262. [DOI] [PMC free article] [PubMed] [Google Scholar]
- 28.Komada Y, et al. Origins and properties of dental, thymic, and bone marrow mesenchymal cells and their stem cells. PloS one. 2012;7:e46436. doi: 10.1371/journal.pone.0046436. [DOI] [PMC free article] [PubMed] [Google Scholar]
- 29.Kunisaki Y, et al. Arteriolar niches maintain haematopoietic stem cell quiescence. Nature. 2013;502:637–643. doi: 10.1038/nature12612. [DOI] [PMC free article] [PubMed] [Google Scholar]
- 30.Pinho S, et al. PDGFRalpha and CD51 mark human nestin+ sphere-forming mesenchymal stem cells capable of hematopoietic progenitor cell expansion. The Journal of experimental medicine. 2013;210:1351–1367. doi: 10.1084/jem.20122252. [DOI] [PMC free article] [PubMed] [Google Scholar]
- 31.Schepers K, et al. Myeloproliferative neoplasia remodels the endosteal bone marrow niche into a self-reinforcing leukemic niche. Cell stem cell. 2013;13:285–299. doi: 10.1016/j.stem.2013.06.009. [DOI] [PMC free article] [PubMed] [Google Scholar]
- 32.Arranz L, et al. Neuropathy of haematopoietic stem cell niche is essential for myeloproliferative neoplasms. Nature. 2014;512:78–81. doi: 10.1038/nature13383. [DOI] [PubMed] [Google Scholar]
- 33.Reilly JT, et al. Guideline for the diagnosis and management of myelofibrosis. British journal of haematology. 2012;158:453–471. doi: 10.1111/j.1365-2141.2012.09179.x. [DOI] [PubMed] [Google Scholar]
- 34.Yata Y, et al. DNase I-hypersensitive sites enhance alpha1(I) collagen gene expression in hepatic stellate cells. Hepatology. 2003;37:267–276. doi: 10.1053/jhep.2003.50067. [DOI] [PubMed] [Google Scholar]
- 35.Lin SL, Kisseleva T, Brenner DA, Duffield JS. Pericytes and perivascular fibroblasts are the primary source of collagen-producing cells in obstructive fibrosis of the kidney. The American journal of pathology. 2008;173:1617–1627. doi: 10.2353/ajpath.2008.080433. [DOI] [PMC free article] [PubMed] [Google Scholar]
- 36.Mederacke I, et al. Fate tracing reveals hepatic stellate cells as dominant contributors to liver fibrosis independent of its aetiology. Nature communications. 2013;4:2823. doi: 10.1038/ncomms3823. [DOI] [PMC free article] [PubMed] [Google Scholar]
- 37.Oguro H, Ding L, Morrison SJ. SLAM family markers resolve functionally distinct subpopulations of hematopoietic stem cells and multipotent progenitors. Cell stem cell. 2013;13:102–116. doi: 10.1016/j.stem.2013.05.014. [DOI] [PMC free article] [PubMed] [Google Scholar]
- 38.Greenbaum A, et al. CXCL12 in early mesenchymal progenitors is required for haematopoietic stem-cell maintenance. Nature. 2013;495:227–230. doi: 10.1038/nature11926. [DOI] [PMC free article] [PubMed] [Google Scholar]
- 39.De Minicis S, et al. Gene expression profiles during hepatic stellate cell activation in culture and in vivo. Gastroenterology. 2007;132:1937–1946. doi: 10.1053/j.gastro.2007.02.033. [DOI] [PubMed] [Google Scholar]
- 40.Lataillade JJ, et al. Does primary myelofibrosis involve a defective stem cell niche? From concept to evidence. Blood. 2008;112:3026–3035. doi: 10.1182/blood-2008-06-158386. [DOI] [PubMed] [Google Scholar]
- 41.Yue R, Zhou BO, Shimada IS, Zhao Z, Morrison SJ. Leptin Receptor Promotes Adipogenesis and Reduces Osteogenesis by Regulating Mesenchymal Stromal Cells in Adult Bone Marrow. Cell stem cell. 2016 doi: 10.1016/j.stem.2016.02.015. [DOI] [PubMed] [Google Scholar]
- 42.Lydon NB, Druker BJ. Lessons learned from the development of imatinib. Leukemia research. 2004;28(Suppl 1):S29–38. doi: 10.1016/j.leukres.2003.10.002. [DOI] [PubMed] [Google Scholar]
- 43.Worthley DL, et al. Gremlin 1 identifies a skeletal stem cell with bone, cartilage, and reticular stromal potential. Cell. 2015;160:269–284. doi: 10.1016/j.cell.2014.11.042. [DOI] [PMC free article] [PubMed] [Google Scholar]
- 44.Kramann R, et al. Perivascular Gli1+ progenitors are key contributors to injury-induced organ fibrosis. Cell stem cell. 2015;16:51–66. doi: 10.1016/j.stem.2014.11.004. [DOI] [PMC free article] [PubMed] [Google Scholar]
- 45.Inra CN, et al. A perisinusoidal niche for extramedullary haematopoiesis in the spleen. Nature. 2015;527:466–471. doi: 10.1038/nature15530. [DOI] [PMC free article] [PubMed] [Google Scholar]
- 46.Tefferi A, et al. Phase 2 trial of imatinib mesylate in myelofibrosis with myeloid metaplasia. Blood. 2002;99:3854–3856. doi: 10.1182/blood-2001-12-0154. [DOI] [PubMed] [Google Scholar]
- 47.Hasselbalch HC, et al. Imatinib mesylate in idiopathic and postpolycythemic myelofibrosis. American journal of hematology. 2003;74:238–242. doi: 10.1002/ajh.10431. [DOI] [PubMed] [Google Scholar]
- 48.DeFalco J, et al. Virus-assisted mapping of neural inputs to a feeding center in the hypothalamus. Science. 2001;291:2608–2613. doi: 10.1126/science.1056602. [DOI] [PubMed] [Google Scholar]
- 49.Madisen L, et al. A robust and high-throughput Cre reporting and characterization system for the whole mouse brain. Nature neuroscience. 2010;13:133–140. doi: 10.1038/nn.2467. [DOI] [PMC free article] [PubMed] [Google Scholar]
- 50.Tallquist MD, Soriano P. Cell autonomous requirement for PDGFRalpha in populations of cranial and cardiac neural crest cells. Development. 2003;130:507–518. doi: 10.1242/dev.00241. [DOI] [PubMed] [Google Scholar]
- 51.Sharov AA, Dudekula DB, Ko MS. A web-based tool for principal component and significance analysis of microarray data. Bioinformatics. 2005;21:2548–2549. doi: 10.1093/bioinformatics/bti343. [DOI] [PubMed] [Google Scholar]
- 52.Huang da W, Sherman BT, Lempicki RA. Systematic and integrative analysis of large gene lists using DAVID bioinformatics resources. Nature protocols. 2009;4:44–57. doi: 10.1038/nprot.2008.211. [DOI] [PubMed] [Google Scholar]
- 53.Huang da W, Sherman BT, Lempicki RA. Bioinformatics enrichment tools: paths toward the comprehensive functional analysis of large gene lists. Nucleic acids research. 2009;37:1–13. doi: 10.1093/nar/gkn923. [DOI] [PMC free article] [PubMed] [Google Scholar]
- 54.Subramanian A, et al. Gene set enrichment analysis: a knowledge-based approach for interpreting genome-wide expression profiles. Proceedings of the National Academy of Sciences of the United States of America. 2005;102:15545–15550. doi: 10.1073/pnas.0506580102. [DOI] [PMC free article] [PubMed] [Google Scholar]
- 55.Mootha VK, et al. PGC-1alpha-responsive genes involved in oxidative phosphorylation are coordinately downregulated in human diabetes. Nature genetics. 2003;34:267–273. doi: 10.1038/ng1180. [DOI] [PubMed] [Google Scholar]
Associated Data
This section collects any data citations, data availability statements, or supplementary materials included in this article.
Supplementary Materials
Data Availability Statement
Microarray data that support the findings of this study have been deposited in the Gene Expression Omnibus (GEO) under accession code GSE84387. Previously published expression data that were re-analyzed here are available online 39. All other data supporting the findings of this study are available from the corresponding author upon reasonable request.