Abstract
Bubble-induced color Doppler (BCD) is a histotripsy therapy monitoring technique that uses Doppler ultrasound to track the motion of residual cavitation nuclei that persist after the collapse of the histotripsy bubble cloud. In this study, BCD is used to monitor tissue fractionation during histotripsy tissue therapy, and the BCD signal is correlated with the destruction of structural and non-structural components identified histologically to further understand how BCD monitors the extent of treatment. A 500-kHz, 112-element phased histotripsy array is used to generate approximately 6×6×7 mm lesions within ex vivo bovine liver tissue by scanning over 219 locations with 30–1000 pulses-per-location. A 128-element L7-4 imaging probe is used to acquire BCD signals during all treatments. The BCD signal is then quantitatively analyzed using the time-to-peak rebound velocity (tprv) metric. Using the Pearson correlation coefficient (PCC), the tprv is compared to histological analytics of lesions generated by different numbers of pulses using a significance level of 0.001. Histological analytics in this study include viable cell count, reticulin-stained type III collagen area, and trichrome-stained type I collagen area. It is found that the tprv metric has a statistically significant correlation with the change in reticulin-stained type III collagen area with a PCC of −0.94 (p < 0.001) indicating that changes in BCD are more likely due to destruction of the structural components of tissue.
Keywords: Histotripsy, therapy feedback, color Doppler
Introduction
Histotripsy is a therapeutic ultrasound technique that employs inertial cavitation to mechanically destroy and fractionate unwanted target-tissue within the body noninvasively without damaging surrounding tissue (Xu et al., 2007), (Lin, et al., 2014). Histotripsy has been investigated for the treatment of deep vein thrombosis (Zhang, et al., 2016) (Zhang, et al., 2017), liver tumors (Vlaisavljevich, et al., 2013), benign prostatic hyperplasia (Roberts, 2005) (Schade, et al., 2012), congenital heart diseases (Xu, et al., 2004), and transcranial brain applications (Kim et al., 2014).
Quantitative imaging feedback for indicating tissue fractionation is important for monitoring and guiding non-invasive ablation techniques such as histotripsy to ensure treatment accuracy and efficacy. Magnetic resonance guided focused ultrasound (MRgFUS) is used to provide a 3D temperature map as real-time feedback during high-intensity focused ultrasound (HIFU) thermal treatments (Hynynen et al., 1993) (McDannold et al., 1998) (Allen et al., 2012) and has been approved by the FDA to treat several conditions including essential tremor (Lipsman, et al., 2013), uterine fibroids (Roberts, 2005), and prostate cancer (Gyöngy & Coussios, 2010). However, MRI-guidance for histotripsy would require MRI-compatible histotripsy arrays as well as procedural MRI scanners.
Ultrasound imaging has previously been used to guide HIFU therapy and for monitoring treatment and the development of HIFU-induced cavitation (Farny et al., 2006) (Owens, et al., 2011). For histotripsy, B-mode ultrasound imaging has also been used in real-time during treatment to monitor changes in the bubble cloud, which appears as a dynamically changing hyperechoic zone (Owens, et al., 2011) (Owens, et al., 2012). When substantial tissue liquefaction has occurred, the tissue appears to be hypoechoic on B-mode imaging (Hall et al., 2007) (Xu, et al., 2009). However, B-mode ultrasound is sub-optimal for monitoring the treatment effect due to its low sensitivity, as the hypoechoic zone only occurs when substantial tissue fractionation is achieved (Wang, et al., 2009). Additionally, as the intensity of the tissue speckle varies across different tissues both temporally and from patient-to-patient, it is unlikely that a universal intensity threshold could be set to indicate complete tissue fractionation for different tissues and patients.
Ultrasound elastography, such as acoustic radiation force impulse (ARFI) imaging, has also been investigated to detect histotripsy lesion formation. As the histotripsy treatment progresses, the target-tissue is fractionated until it turns into a liquid-appearing homogenate, indicating that the elasticity of the tissue decreases throughout treatment (Miller, et al., 2012) (Wang et al., 2012) (Wang et al., 2014). (Cain et al., 2012) A reliable elasticity method would be especially useful for histotripsy in viscoelastic tissues such as the liver where the collagenous elements of the extracellular matrix are the primary structural component. These elastography methods have been experimentally successful in the detection of tissue fractionation with higher sensitivity than B-mode speckle intensity. However, as the tissue becomes more liquefied, the shear wave propagation used for elastography imaging techniques become increasingly restricted resulting in decreased accuracy of elastography measurements later in histotripsy treatment (Wang et al., 2012). Additionally, reflections from the histotripsy-induced cavitation nuclei are known to contribute to and interfere with the radiation force used for ARFI imaging, which may introduce artifacts in the elastography methods (Wang et al., 2014).
Recently, a new modality called bubble-induced color Doppler (BCD) has been developed to monitor histotripsy-induced tissue fractionation in real-time (Zhang, et al., 2015) (Miller et al., 2016) (Macoskey et al., 2017). This method uses Doppler ultrasound on a conventional clinical ultrasound machine to obtain velocity estimations of the residual cavitation nuclei that persist after cavitation during histotripsy therapy. Our previous work has shown that this motion is due to the disturbance caused by the rapid expansion and collapse of the bubble cloud, which has also been observed previously elsewhere (Khokhlova, et al., 2011). This motion is only observed when the histotripsy bubble cloud is formed, and we have found that this residual motion can last for at least 20 ms after each histotripsy pulse, thus indicating that it is likely not due to acoustic radiation force. Furthermore, we have found that as the tissue becomes increasingly fractionated, the motion of residual nuclei lasts longer, and that the change of the BCD signal correlates somewhat with increased tissue destruction (Miller et al., 2016). However, in this previous study, only cellular destruction was quantified over a small sample of pulse numbers. Thus, a more detailed physiological investigation of the correlation of the BCD signal with tissue destruction is required. Interestingly, in Vlaisavljevich, et al. (2014), it was shown that tissues with higher Young’s moduli result in cavitation bubbles with shorter lifespans and smaller maximum radii (Vlaisavljevich, et al., 2014). This suggests that as the tissue becomes more fractionated and the elasticity of the tissue decreases, the cavitation bubble cloud should last longer with a higher maximum radius. Therefore, due to the fact that the BCD signal is highly dependent on cavitation dynamics which are dependent on tissue mechanics and we know that the residual nuclei motion responsible for the BCD signal lasts increasingly longer throughout treatment, we hypothesize that the BCD signal is more closely correlated with the destruction of structural components of tissue that contribute to the overall mechanical properties of tissue rather than the cellular components.
In this study, we investigated how changes in the BCD signal throughout histotripsy treatment are quantitatively correlated to the levels of fractionation of specific structures within liver tissue induced by histotripsy. Histotripsy therapy was applied to ex vivo bovine liver tissue by a 112-element histotripsy array at varying levels of tissue fractionation (i.e., number of histotripsy pulses), and BCD signals were acquired for all samples. Each tissue sample was histologically stained to quantify cellular destruction, type III collagen destruction, and type I collagen destruction.
Methods
Ex Vivo Bovine Liver Preparation
Freshly excised bovine liver acquired from a local abattoir was preserved in room-temperature PBS-buffered saline and was used within 24 hours of harvest. Prior to treatment, liver was sectioned into approximately 4 cm cube sections and was then placed in degassed PBS-buffered saline under vacuum in a desiccator for five hours. Liver samples were then removed from the desiccator and were embedded in blocks of 1.5% agarose to maintain structural stability. The blocks were suspended in place via two carbon skewers. This was done so that no structural support material other than agar was present between the histotripsy array and the tissue, thus minimizing aberration and the chance for cavitation on the surface of the sample. Once the agarose was solidified after roughly one hour, the tissue phantoms were positioned in the water above the histotripsy array using a three-axis positioner.
Histotripsy Treatment Parameters
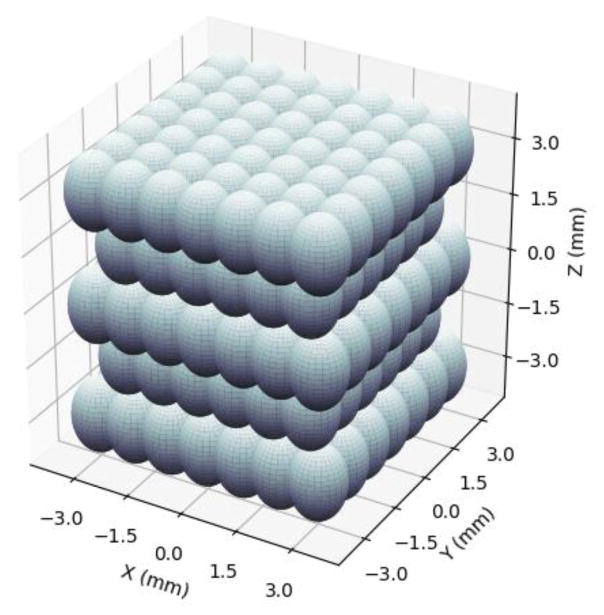
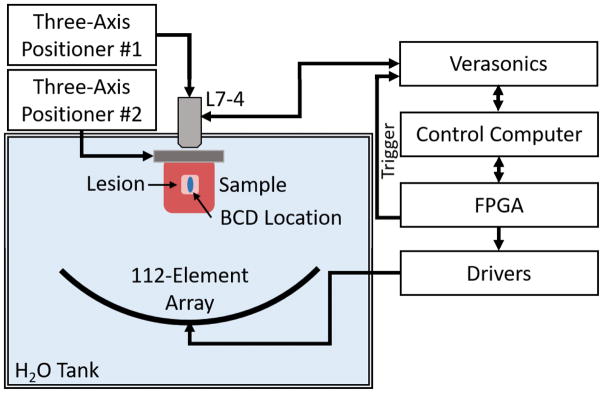
The treatments were applied in a 6×6×7 mm volume consisting of 219 treatment locations excited by electronically steering the phased array. The treatment locations were organized in five alternating 7×7 and 6×6 location layers with 1 mm spacing between locations within each plane (x- and y-dimensions) and 1.5 mm spacing between planes (z-dimension) to ensure uniform fractionation throughout the volume. The layers were placed parallel to the histotripsy wave front, and the layer farthest from the array was treated first. Locations within each layer were treated randomly. A rendering of the packing grid is shown in Figure 1. The array focus was steered to locations at 100 Hz PRF except for the central location where the BCD signal was acquired. The BCD signal was only acquired at the central location of the lesion. Prior to the pulse at the central location, the array paused for 0.5 seconds. This was done to allow residual cavitation nuclei from the previous pulse to dissolve (Fowlkes & Crum, 1988) (Wang et al., 2012). Liver samples were treated with 0, 30, 60, 100, 200, 300, 500, or 1000 pulses-per-location to produce a wide range of tissue fractionation. These pulse numbers were chosen to cover the full range of tissue fractionation to complete cell disruption in the treatment volume and to align with regions of change in BCD profiles collected during preliminary experiments. For each dose level, 6 replicate samples were treated. A schematic overview of the experimental setup is shown in Figure 2. The 112-element 500 kHz therapy array was placed facing upwards in a tank filled with degassed water. The primary control computer sent commands to the transducer driving system, which stored treatment locations and controlled the timing of treatment. The three-axis positioner holding the tissue sample was a manual positioner that allowed for gross positioning of the liver samples in the focus of the therapy array. Prior to treatment, the liver samples were imaged with B-mode ultrasound using a 5 MHz, 128-element linear imaging probe (ATL HDI L7-4, Philips, Andover, MA) with a Verasonics Imaging System (SS#: 1634, Verasonics, Inc., Redmond, WA) to ensure that therapy was occurring in relatively homogenous portions of liver that were void of large vessels or large portions of connective tissue. A motorized three-axis positioner was used to position the L7-4 imaging probe.
Figure 1.
Treatment location packing grid. Spacing between points in the x- and y- directions is 1 mm, and spacing between layers in the z-direction is 1.5 mm. In this orientation, ultrasound is being delivered from the bottom of the grid, i.e., from negative z towards positive z.
Figure 2.
Experimental setup. A 500 kHz 112-element array is used to generate histotripsy lesions at 219 locations throughout a treatment volume in bovine liver tissue. A Verasonics system using standard Doppler ultrasound imaging with an L7-5 linear array (driven at 5 MHz) was used to acquire BCD data and was triggered by the FPGA-controlled driving system. BCD was acquired for the pulse at the central location within the lesion. An automatic three-axis positioning system was used to position the linear array, and second manual three-axis positioner was used to position the liver samples.
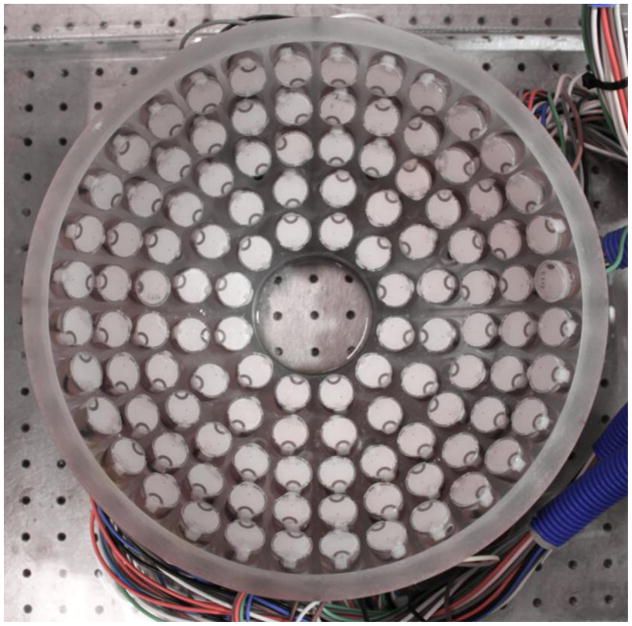
The histotripsy transducer used for this study was a 112-element, 500 kHz histotripsy phased-array transducer constructed in-house (Duryea et al., 2015). An image of the array is shown Figure 3. The array consisted of a 15 cm radius of curvature and a 27 cm aperture. Each element was driven by one channel on a 112-channel high-voltage pulser that emitted an approximately 1.5-cycle, 3-microsecond sinusoidal acoustic pulse. The array and driving system was controlled by a set of field-programmable gate arrays (FPGAs) such that each element was individually addressable. The generated waveform at the geometric focus was evaluated using a fiber-optic probe hydrophone (FOPH) with a 100-μm diameter sensing tip (Parsons et al., 2006). The arrangement of the elements in the array produced a focal zone with a −6 dB beamwidth of 2.0 mm laterally and 6.3 mm axially when measured in the linear regime at a pressure amplitude of 8 MPa using the FOPH. During treatment, the transducer was driven just above the intrinsic threshold for cavitation, so cavitation only occurred in the area of highest pressure rather than throughout the full −6 dB beamwidth. For peak-negative pressures above approximately 10 MPa, the waveform could not be directly measured by the FOPH due to cavitation on the fiber tip. For P- ≥10 MPa, the transducer’s waveform was approximated by dividing the array into several sub-apertures, which were driven and measured separately and then summed to estimate the pressure at each calibrated driving voltage. The array was divided into four quadrant sub-apertures, which was enough to maintain a P- of <10 MPa. At the driving voltage used for this study, the extrapolated P- pressure was found to be approximately 40.8 MPa. It should be noted that nonlinear propagation was not taken into account in the extrapolation.
Figure 3.
Image of the 112-element 500 kHz histotripsy phased array. From this orientation, the positive z-axis is pointed directly at the point-of-view.
Bubble-Induced Color Doppler Acquisition and Processing
Bubble-induced color Doppler was acquired using standard Doppler ultrasound imaging on a Verasonics imaging system (Redmond, WA) using the same 5 MHz center frequency, 128-element linear imaging transducer (ATL HDI L7-4, Philips, Andover, MA) used for treatment planning. The imaging probe was placed on the opposite side of the sample from the therapy array. Prior to placing the tissue sample in the tank, the imaging probe was aligned with the geometric focus of the therapy system in the free-field by imaging the cavitation bubble cloud on B-mode. An acquisition transaxial region of interest (ROI) of 39 mm to 51 mm from the imaging probe was used to acquire the Doppler data. The Verasonics Doppler protocol was set to acquire 210 Doppler acquisitions at 10 kHz PRF to observe a temporal window of 21 ms after the central therapy pulse. This window covered the same region in which motion was recorded in a prior study using particle image velocimetry to observe the movement of residual cavitation nuclei after a histotripsy pulse (Miller et al., 2016). The Doppler acquisitions were processed offline using the Doppler processing algorithms included with the Verasonics ultrasound imaging system. The mean frame-by-frame Doppler velocity throughout the 21 ms after the central therapy pulse in the Doppler ROI was processed in rolling 10 acquisition segments, resulting in 200 separate 10 frame acquisitions to cover a 20 ms temporal range. A thresholding algorithm employing a multi-level Otsu’s method (Matlab, The Mathworks, Natick MA, USA) was applied to the Doppler frames to observe only the areas with the greatest movement of residual nuclei. The time to peak negative rebound velocity (tprv) was used to quantify the BCD data. This metric calculates the time at which the highest magnitude negative velocity after each histotripsy pulse occurs.
Tissue Fractionation Analysis via Histology
Upon treatment completion, samples were removed from their sample holders, and all agarose was cleaned off the tissue. Samples were then submerged in 10% buffered formalin (Fischer Scientific International, LLC, Hampton, NH) for one week for fixation. Once fixed, samples were cut into thin slices and were placed in cassettes that were then submerged in new 10% buffered formalin and sent out for histology sectioning and staining (Scientific Solutions, LLC, Fridley, MN). All formalin-fixed and paraffin-embedded liver tissue sections were stained with Masson’s trichrome stain and Gordon & Sweet’s reticulin stain (Gordon & Sweets, 1936). The trichrome stain is a three-color staining protocol, which stains collagen blue, muscle fibers red, and cell nuclei dark brown to black. Trichrome staining allows for visualization of both cells and type I collagen which is the most abundant collagen in mammals. Type I collagen usually organizes into thick bundles and is found in connective tissues in the liver. Gordon & Sweet’s reticulin stain was used to highlight the thin reticular fibers and basement membrane material in the liver tissue. The reticular fibers are usually type III collagen and are found interlaced with hepatocytes in the extracellular matrix and outline the architecture of liver parenchyma. We hypothesize that cells are more susceptible to histotripsy damage while collagen is more resistant. Example images of the trichrome and reticulin stains of the liver are shown in Figure 4.
Figure 4.
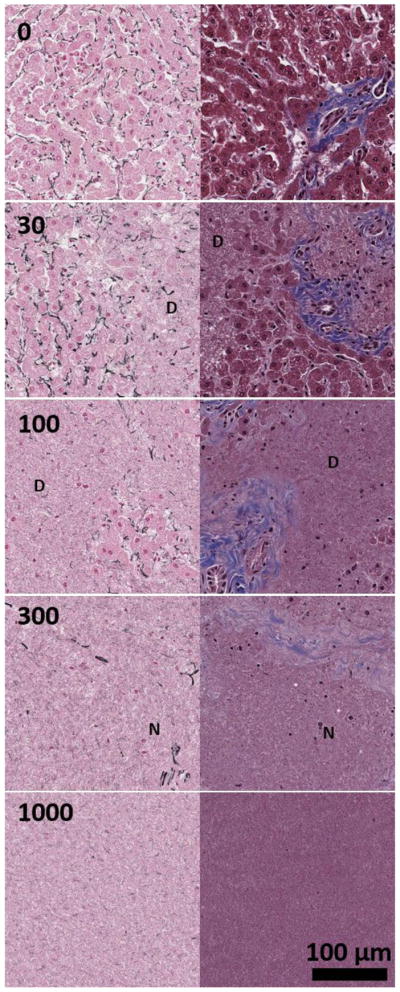
Sample histology of the liver tissue using Masson’s trichrome (right column) and Gordon & Sweet’s reticulin stains (left column) for histotripsy dosages of 0, (top row), 30 (second row), 100 (third row), 300 (fourth row), and 1000 (bottom row) pulses-per-location. Type I collagen is blue in trichrome stain and reticulin fiber is black in reticulin stain. For 30 and 100 pulses-per-location, areas of destruction are marked with a D. For 300 pulses-per-location, example remnant nuclei are marked with an N. Complete tissue homogenization is observed at 1000 pulses-per-location.
All slides were then scanned with a resolution of 0.253 μm/pixel – an equivalent of 400x magnification – for image processing. A square area of 15 mm2 was selected from the center of the approximately 42 mm2 cross-sectional lesion for image analysis. Two color-channel thresholding algorithms were used to segment the blue collagen fibers in trichrome stained slides and the dark purple/black reticular fibers in the reticulin stained slides. To determine the number of cells remaining in the lesions, ten randomly selected 1024×1024 pixel tiles within the lesion were manually counted. The number of tiles counted was based on estimated sample variance and desired detectable difference between groups using power analysis to obtain a statistical power of 0.95 with α = 0.01 for extrapolation of cellular density to the rest of the lesion when compared to a normal distribution. A nonlinear least squares best fitting algorithm using an exponential decay model was used to calculate best fit trend lines for the histology metrics between each dosage that was analyzed, thus allowing for a continuous trend line to estimate the histology metrics at all doses between 0 and 1000 pulses-per-location. Statistical p-values for the histology data were calculated using a chi-squared goodness-of-fit test, and time constants (with time being pulse number) were calculated for each best-fit line to directly compare the histology metrics.
BCD and Tissue Fractionation Metric Statistical Analysis
The BCD tprv was plotted against each histology metric, and linear regression was used to fit a trend line to each relationship for a relative comparison between the metrics. Coefficients of determination, i.e., R-squared values, were calculated for each linear regression fit to compare how well the model fit the BCD-histology comparisons. However, a high coefficient of determination does not necessarily mean that a statistical model is the right model for a given dataset. Therefore, the Pearson correlation coefficient (PCC), which measures an unbiased linear correlation between two variables and reports a p-value based on Student’s t-test, was used to obtain a single quantitative metric for the extent of correlation between the BCD tprv and histology metrics. The PCC was chosen because it obtains an easily comparable correlation metric between two signals regardless of the scale of the signals. The PCC returns a value ranging between −1 and 1, where 1 indicates a perfectly direct linear correlation, −1 indicates a perfectly inverse linear correlation, and 0 indicates no correlation. The PCC is mathematically defined as ρ(a, b) = E(ab)/σaσb where σa and σb are the standard deviations of signals a and b, respectively, and E(ab) is the cross-correlation between a and b (Benesty et al., 2009). Because we knew a priori that there would be mono-directional change of both the BCD tprv and all histology metrics, we chose a very conservative p-value of 0.001 to indicate a statistically significant correlation.
Results
Bubble-Induced Color Doppler Metrics
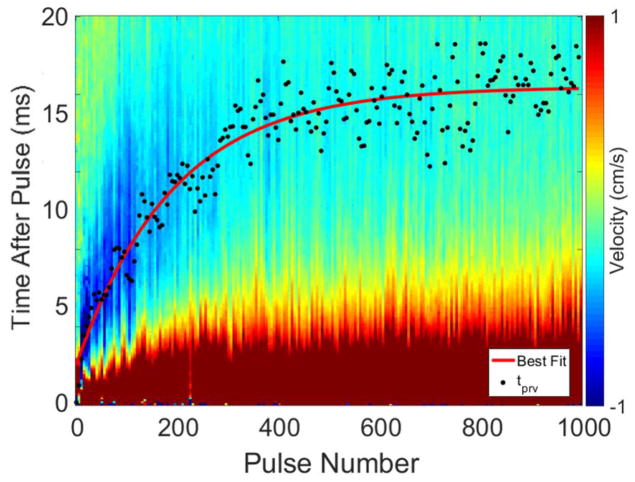
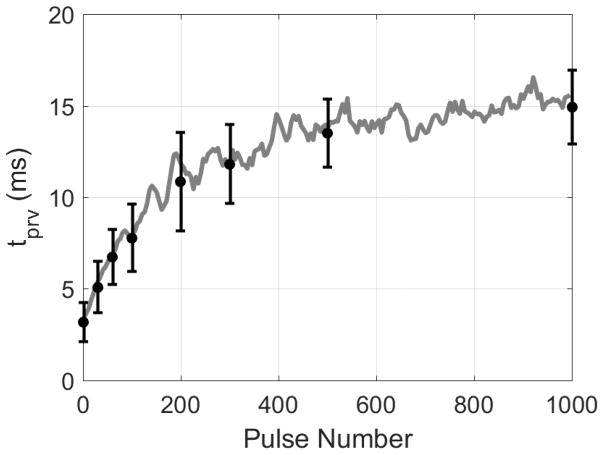
A total of 42 lesions were treated, and their respective BCD signals for each pulse were collected and analyzed. A representative BCD slow-time/fast-time profile from one 1000 pulse-per-location treatment is shown in Figure 5. In all treatments, the BCD data exhibited a net large positive velocity (away from the therapy transducer) followed by a large net negative velocity (towards the therapy transducer). Early in treatment between 1 and approximately 200 pulses, a second positive velocity rebound was observed within the recorded 20 ms window. The time corresponding to tprv for each Doppler velocity trace is also shown in Figure 5, and a nonlinear least squares trend line was fitted to the tprv metric. In all samples, the change in the BCD tprv metric exhibited mono-directional change throughout treatment and grew such that the peak negative velocity occurred later after each therapy pulse until it plateaued at around 400 pulses with a tprv of approximately 16 ms.
Figure 5.
Example BCD slow-time/fast-time profile from one 1000 pulse treatment. The tprv is indicated by a black point for each pulse number, and a nonlinear least squares best-fit trend line is shown in red. The largest peak negative velocities were on the order of -1 m/s and were observed to have large negative velocities earlier in treatment.
An average of the tprv metric from six 1000 pulse treatments is shown in Figure 6. Also shown in Figure 6 are the average tprv found for the doses at which the histology metrics were recorded. A similar trend of increasing and plateauing tprv over the treatment as Figure 5 is observed. It is also shown that the variance of the tprv metric tends to increase throughout treatment. This was due to the fact that the tprv for each treatment reached slightly different steady states plateauing at tprv values between 10 and 20 ms depending on the treatment. Previous studies in tissue-mimicking agarose phantoms also observed this phenomenon (Miller, Zhang, Maxwell, Cain, & Xu, 2016), suggesting that increasing liquefaction of the surrounding medium results in less consistent motion of residual cavitation nuclei.
Figure 6.
Average BCD tprv from six 1000 pulse treatments. Gray line indicates a 5-sample moving average. Black points indicate tprv at pulse numbers corresponding to the same pulse numbers used for histological analysis, i.e., 0, 30, 60, 100, 200, 300, 500, and 1000 pulse-per-location.
Tissue Fractionation Analysis via Histology
In Figure 4, representative liver histology of normal liver and four stages after treatment are qualitatively shown: pre-treatment control (row 1), early sparse cell fractionation (row 2) generated by 30 pulses-per-location, widespread cell fractionation and partial destruction of liver architecture (row 3) generated by 100 pulses-per-location, complete cell fractionation and destruction of liver architecture and early connective tissue fractionation (row 4) generated by 300 pulses-per-location, and complete liquefaction of all cells and connective tissues (row 5) generated by 1000 pulses-per-location. In order to analyze and better visualize several varieties of tissue structures, reticulin staining (left column) and trichrome staining (right column) were used to analyze the different levels of tissue fractionation generated by histotripsy. For the first stage of treatment, at 30 pulses-per-location, only disparate regions of tissue damage have occurred. At this point, roughly 50% of the hepatocytes still appear to be intact with largely preserved liver architecture highlighted by reticulin stain and intact portal tracts with bile ducts, portal veins, portal arteries, and thick blue portal collagen fibers shown by the trichrome stain. For the second stage, by 100 pulses-per-location, significant hepatocyte and architecture destruction with loss of reticulin had occurred, and in some samples, only minimal small clusters of isolated hepatocytes with a few fractionated reticulin fibers remained in a sea of necrotic debris. The trichrome stain showed that only mild to moderate portal tract and thick type I collagen fiber damage was present at 100 pulses. Interestingly, most of the remaining hepatocytes were found adjacent to the thick type I collagen fibers and portal tracts, suggesting that these collagen fibers and portal tracts acted to protect the hepatocytes from the cavitation damage. For the third stage, by 300 pulses-per-location, virtually all hepatocytes in all treated liver samples had been destroyed including those that were adjacent to portal tracts and type I collagen fibers. Both reticulin and trichrome stains showed almost complete destruction of both type III and I collagen fibers. There were only a few scattered remnant naked nuclei in the liquefied necrotic debris, which are not viable intact cells. For the fourth stage of treatment, as shown in final row of images in Figure 4, at 1000 pulses-per-location, the liver tissue is completely liquefied with loss of hepatocytes and both types of collagen fibers.
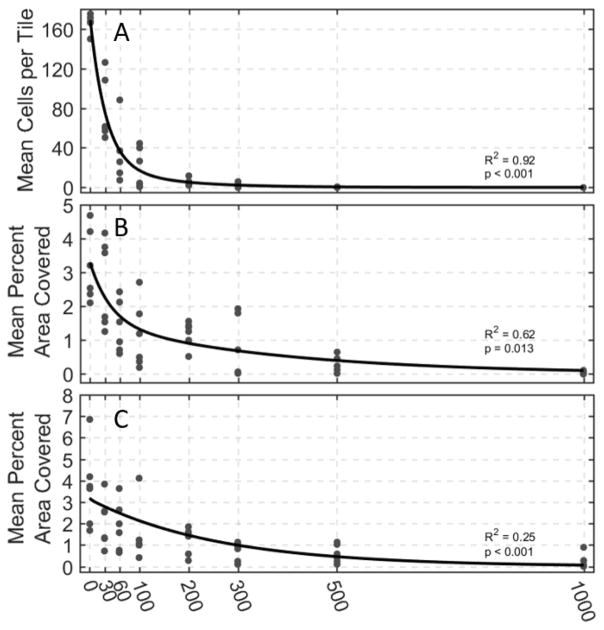
The quantitative histological analyses of cell count, intact reticulin-stained collagen area, and intact trichrome-stained collagen area and their respective nonlinear least squares fits are shown in Figure 7. The least squares best fit lines of all three cellular metrics exhibited exponential decay to varying degrees with increasing number of histotripsy pulses applied. In these analyses, the population of viable cells in the treatment region decreases exponentially and reaches zero around 300 pulses at the latest. Both the reticulin and trichrome-stained collagen metrics take longer to reach a point at which there is virtually no reticulin or trichrome-stained collagen detected. The exponential decay time constants were found to be 38, 120, and 257 pulses for cell count, reticulin-stained collagen, and trichrome-stained collagen areas, respectively, thus supporting our hypothesis that cells are destroyed much earlier in the treatment than stronger structural connective components of the tissue.
Figure 7.
Histological analysis of 42 histotripsy treated samples at varying dosages. (A) Viable cell count remaining in imaged medium. The cell count experienced the greatest amount of destruction early in treatment. (B) Percent area with intact reticulin-stained collagen and (C) percent area with intact trichrome-stained collagen. Both collagen metrics experienced slower amounts of destruction than remaining cell count. Nonlinear least square best-fit lines are shown in black. All best fit lines exhibited statistical significance when compared to a normal distribution as indicated by the p-values on each plot.
BCD and Tissue Fractionation Metric Statistical Analysis
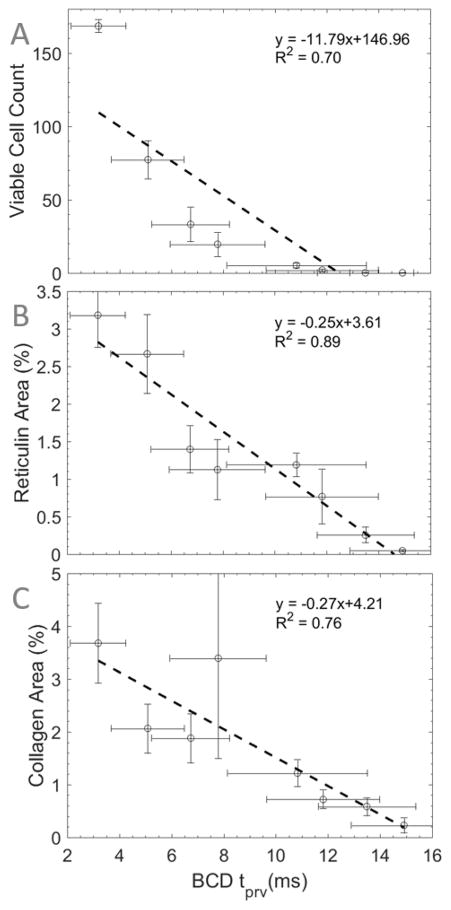
The mean values of the BCD tprv were plotted against the mean values of viable cell count, reticulin-stained collagen area, and trichrome-stained collagen area in Figure 8A, B, and C, respectively. Linear regression was used to qualitatively indicate the fit of a linear model to the relationship between these metrics. It was found that the relationship between tprv and reticulin-stained collagen resulted in the highest coefficient of determination with a value of 0.89, indicating that linear regression is a good model for this relationship. Viable cell count and trichrome-stained collagen vs. BCD tprv resulted in lower coefficients of determination in comparison to reticulin-stained collagen with values of 0.70 and 0.76, respectively. This indicates that, relative to each other, the tprv-reticulin relationship is better modeled by a linear relationship than the tprv-viable cells and tprv-trichrome relationships. The Pearson correlation coefficient analysis of the datasets returned PCCs of −0.84, −0.94, and −0.87 with p-values of 0.01, <0.001, and 0.005 for tprv vs. viable cell count, reticulin-stained collagen area, and trichrome-stained collagen area, respectively (Table 1). This indicates that each histology metric is inversely correlated with tprv to varying degrees. However, based on our chosen level of significance, only tprv vs. reticulin-stained collagen resulted in a statistically significant linear correlation.
Figure 8.
BCD tprv vs. (A) viable cell count, (B) reticulin-stained area, and (C) trichrome-stained collagen area throughout 1000 pulse histotripsy treatments in bovine liver. Dashed lines indicate best-fit lines acquired using linear regression (n = 6).
Table 1.
Summary of Pearson Correlation Coefficients* Between BCD and Histology Metrics
| Cells Remaining | Reticulin-Stained Collagen | Trichrome-Stained Collagen | |
|---|---|---|---|
| Bubble-Induced Color Doppler | −0.84 (0.010) | −0.94 (<0.001) | −0.87 (0.005) |
Values in parentheses indicate the p-value
Discussion
Bubble-Induced Color Doppler
The results from this study support the results from all other BCD-based studies in the literature in that the BCD signal exhibited initial movement of residual cavitation nuclei away from the therapy transducer followed by a rebound back towards the transducer and that the BCD tprv metric exhibited mono-directional growth in time (Miller, et al., 2012) (Miller et al., 2016) (Zhang, et al., 2015) While the reason for this reproducible directionality of residual nuclei movement has not yet been completely verified experimentally for histotripsy, existing theoretical and experimental work into the physics of the non-spherical cavitation-bubble collapse is able to provide some insight. Previously, it has been shown that the collapse of the cavitation-bubble results in the formation of a liquid jet and an impulsive pressure release. The jet subsequently penetrates the bubble resulting in damage to the surrounding medium (Tomita, et al., 1986) (Coleman, et al., 1987) (Crum, 1988) (Dear, et al., 1988) (Field, 1991) (Bourne, et al., 1992) (Johnsen, et al., 2008) (Johnsen, et al., 2009). It is believed that this non-spherical collapse and liquid jet is caused by a non-uniform pressure distribution around the bubble, which can be induced by the presence of a solid object or free surface, buoyancy, or interactions with shockwaves such as those in histotripsy (Lauterborn, et al., 1975) (Philipp, et al., 1998) (Ohl, et al., 2003) (Obreschkow, et al., 2011) (Dear, et al., 1988). During a non-spherical collapse, there is a non-zero Kelvin impulse, i.e., non-zero bubble inertia (Blake, 1983) (Blake, 1988) (Blake, et al., 2015), which has been shown to correlate with bubble cloud migration and flow (Blake, et al., 1986) (Blake, et al., 1987). Due to the fact that the BCD-measured movement is only observed when cavitation occurs, this suggests that acoustic radiation force is not the primary mechanism of movement. Furthermore, our unpublished data suggest that the asymmetric growth and collapse of the cavitation results in a fast net motion of the cavitation bubbles. The inertia from this fast motion can last for over 20 ms, moving persistent residual nuclei, which is detected as the BCD signal. Therefore, we hypothesize that the transfer of momentum from the Kelvin impulse to the surrounding tissue caused by non-spherical cavitation-collapse may be a primary mechanism for the BCD-detected oscillation of residual cavitation nuclei. Future experimental studies will test this hypothesis.
Tissues with lower elasticities result in bubbles that grow larger and last longer. As tissue elasticity decreases throughout histotripsy treatment until the tissue is completely liquefied, we hypothesize that the movement of the cavitation nuclei sustains longer as tissue is fractionated by histotripsy. The increase in tprv observed throughout treatment indicates that the frequency of oscillation of the movement of residual nuclei is decreasing throughout treatment, which corresponds to the decreased tissue elasticity. The increased variability of the tprv metric as the treatment progresses has also been reported previously. This is likely due to the fact that bubble cloud formation is less consistent from one pulse to the next when forming in a liquid environment with increasing spatial variability of acoustic backscatter off the bubble cloud with increasing tissue homogenization (Parsons et al., 2007). An increase in variable bubble cloud formation would also result in an increase in the variability of movement of residual nuclei in the treated volume from pulse to pulse.
Histological Analysis
The three histological components extracted from histology in this study were chosen to analyze weak, moderate, and strong components of the liver tissue that have varying resistance to histotripsy-induced tissue fractionation. Cells highlighted by hematoxylin in the trichrome stained tissue samples were used as the weak component. Reticulin-stained collagen is an extracellular structure stained by silver particles in the reticulin stain, which is stronger than cells but weaker and more homogenously distributed throughout the liver tissue than the thicker type I collagen fibers highlighted by the trichrome stain. Reticulin-stained fibers are small branching structures made primarily of type III collagen that are ubiquitously found throughout the extracellular matrix in many tissues including liver (Little & Kramer, 1952). The results clearly show that histotripsy destroys cells first, then weaker extracellular matrix materials such as reticulin-stained collagen, and finally stronger extracellular matrix materials such as trichrome-stained collagen. These results also directly support the results from (Miller et al., 2016) in which virtually no intact viable cells were observed after 200 to 300 therapy pulses for ex vivo bovine liver. In order to destroy something such as a tumor, only cellular destruction is required. However, here we have found that hepatocytes that reside close to stronger structures such as trichrome-stained collagen or portal tracts are able to sustain higher histotripsy dosages than those that are not. Thus, the collagenous and connective tissue characteristics may impact the treatment required for appropriate cellular destruction. Due to the fact that different patients and tissues have varying tissue matrix characteristics, a real-time feedback mechanism for collagen structure destruction may provide a quantitative indication of treatment progression with patient and tissue specificity.
Correlation of BCD signal with Histology Metrics
Previous studies have indicated that the BCD tprv metric is correlated with the number of intact cells remaining. However, due to the fact that bubble dynamics are more closely influenced by structural components of tissue and cells are less of a contributing factor to the mechanical properties of tissue than collagen, we hypothesized that the BCD signal would correlate more with the destruction of structural components of tissue. The observed BCD signals and histology in this study support this hypothesis by showing that the change in the BCD tprv metric has a statistically significant inverse correlation with reticulin-stained collagen components identified histologically. The inverse nature of this correlation is primarily a product of how the data is presented and should not be seen as a disadvantage. The PCC of the tprv with both intact cells remaining and trichrome-stained collagen area were both found to be statistically insignificant, thus indicating that they are not linearly correlated with the tprv metric. Although trichrome-stained collagen certainly contributes to the overall macrostructure of liver, trichrome-stained collagen bundles only occur in thick, sparse bundles, and they often do not contribute to the local, microstructure of the tissue treated in these experiments. Therefore, there were locations within the treated tissue where virtually no trichrome-stained collagen existed. We hypothesize that this sparse distribution of trichrome-stained collagen is what may have led to its lower correlation with tprv than reticulin-stained collagen. Additionally, the variance in the trichrome-stained collagen metrics was higher than the other two histology metrics. We also attribute this high variance to the sparseness of the trichrome-stained collagen, for some histology tiles contained almost no trichrome-stained collagen while others were virtually filled with trichrome stained collagen. Furthermore, we now hypothesize that tissues with more densely packed collagen of both type I and type III would result in a slower change of tprv due to an increase in the amount of histotripsy required for complete liquefaction. An indicator for collagen-embedded tissue destruction is important due to the observed shielding of hepatocytes near collagen structures. Thus, using BCD as an indicator of complete collagen destruction would be a good indicator of tissue ablation, i.e., complete cell death thus eliminating the need to over treat tissue while ensuring that the target tissue has been completely homogenized to the necessary degree. Due to the fact that connective tissues are generally high in collagen, this indicates that the tprv of the BCD signal may be able to track treatment progression in patients with varying collagen matrix profiles.
Conclusions
In this study, we investigated the use of bubble-induced color Doppler received by a separate linear imaging probe to monitor the levels of tissue fractionation induced by histotripsy therapy in bovine ex vivo liver. Histology was acquired at various dosages throughout treatment, and three metrics were used to identify the extent of destruction of various types of tissues with varying degrees of mechanical strength. It was found that the tprv of the BCD signal had a statistically significant linear correlation with reticulin-stained collagen destruction, indicating that changes in the BCD signal are more closely related to the structural components of tissue rather than cellular destruction. These results suggest that BCD may be able to provide noninvasive and quantitative monitoring of tissue mechanical integrity during histotripsy therapy.
Acknowledgments
This work was supported by a Research Scholar Grant from the American Cancer Society (RSG-13-101-01-CCE), a grant from National Institute of Biomedical Imaging and Bioengineering (NIBIB) of the National Institutes of Health under Award Number R01EB008998, a grant from National Institute of Neurological Disorders and Stroke (NINDS) of the National Institutes of Health under Award Number R21NS093121, and The Hartwell Foundation. Disclosure notice: Drs. Tim Hall, Charles Cain, Fred Lee Jr., and Zhen Xu have financial interests and/or other relationship with HistoSonics Inc.
Footnotes
Publisher's Disclaimer: This is a PDF file of an unedited manuscript that has been accepted for publication. As a service to our customers we are providing this early version of the manuscript. The manuscript will undergo copyediting, typesetting, and review of the resulting proof before it is published in its final citable form. Please note that during the production process errors may be discovered which could affect the content, and all legal disclaimers that apply to the journal pertain.
References
- Allen SP, Roberts WW, Hall TL, Cain CA, Hernandez-Garcia L. Characterization of the in vivo Histotripsy Lesion Using High Field MRI. Proceedings, International Society for Magnetic Resonance in Medicine 20th Annual Meeting and Exhibition; Melbourne, Austrialia. 2012. [Google Scholar]
- Benesty J, Chen J, Huang Y, Cohen I. Noise reduction in speech processing. Berlin Heidelberg: Springer; 2009. Pearson correlation coefficient; pp. 1–4. [Google Scholar]
- Blake J. The Kelvin Impulse: Applications to Bubble Dynamics. Eigth Australasian Fluid Mechanics Conference. 1983:10B.1–10B.4. [Google Scholar]
- Blake J. The Kelvin impulse: Application to cavitation bubble dynamics. The Journal of the Australian Mathematical Society. 1988;30:127–146. [Google Scholar]
- Blake J, Gibson D. Cavitation bubbles near boundaries. Ann Rev Fluid Mech. 1987;19:99–123. [Google Scholar]
- Blake J, Leppinen D, Wang Q. Cavitation and bubble dynamics: the Kelvin impulse and its applications. Interface Focus. 2015;5:1–15. doi: 10.1098/rsfs.2015.0017. [DOI] [PMC free article] [PubMed] [Google Scholar]
- Blake J, Taib B, Doherty G. Transient cavities near boundaries. Part 1. Rigid boundary. J Fluid Mech. 1986;170:479–497. [Google Scholar]
- Bourne N, Field J. Shock-induced collapse of single cavities in liquids. J Fluid Mech. 1992;244:225–240. [Google Scholar]
- Cain C, Wang T-Z. 20130102932 A1 United States Patent No US. 2012 Oct 10;
- Coleman A, Saunders J, Crum L, Dyson M. Acoustic Cavitation Generated by an Extracorporeal Shockwave Lithotripter. Ultrasound Med Biol. 1987;13:69–76. doi: 10.1016/0301-5629(87)90076-7. [DOI] [PubMed] [Google Scholar]
- Crum L. Cavitation Microjets as a Contributory Mechanism for Renal Calculi Disintegration in ESWL. J Urol. 1988;140:1587–1590. doi: 10.1016/s0022-5347(17)42132-x. [DOI] [PubMed] [Google Scholar]
- Dear J, Field J. A study of the collapse of arrays of cavities. J Fluid Mech. 1988;190:409–425. [Google Scholar]
- Dear J, Field J, Walton A. Gas compression and jet formation in cavities collapse by a shock wave. Nature. 1988;332:505–508. [Google Scholar]
- Duryea A, Cain C, Roberts W, Hall T. Removal of residual cavitation nuclei to enhance histotripsy fractionation of soft tissue. IEEE Trans Ultrason, Ferroelect Freq Control. 2015;62:2068–2078. doi: 10.1109/tuffc.2015.007202. [DOI] [PMC free article] [PubMed] [Google Scholar]
- Farny C, Holt G, Roy R. Monitoring the Development of HIFU-Induced Cavitation Activity. AIP Conf Proc. 2006;829:348–352. [Google Scholar]
- Field J. The physics of liquid impact, shock wave interactions with cavities, and the implications to shock wave lithotripsy. Phys Med Biol. 1991;36:1475–1484. doi: 10.1088/0031-9155/36/11/007. [DOI] [PubMed] [Google Scholar]
- Fowlkes J, Crum L. Cavitationa threshold measurements for microsecond length pulses of ultrasound. J Acoust Soc Am. 1988;83:2190–2201. doi: 10.1121/1.396347. [DOI] [PubMed] [Google Scholar]
- Gordon H, Sweets H. A Simple Method for the Silver Impregnation of Reticulum. Am J Pathol. 1936;12:545. [PMC free article] [PubMed] [Google Scholar]
- Gyöngy M, Coussios CC. Passive Spatial Mapping of Inertial Cavitation During HIFU Exposure. IEEE Trans Biomed Eng. 2010;57:48–56. doi: 10.1109/TBME.2009.2026907. [DOI] [PubMed] [Google Scholar]
- Hall T, Fowlkes J, Cain C. A real-time measure of cavitation induced tissue disruption by ultrasound imaging backscatter reduction. IEEE Trans Ultrason, Ferroelect Freq Control. 2007;54:569–575. doi: 10.1109/tuffc.2007.279. [DOI] [PubMed] [Google Scholar]
- Hynynen K, Darkazanli A, Unger E, Schenck J. MRI-guided noninvasive ultrasound surgery. Medical Physics. 1993;20:107–115. doi: 10.1118/1.597093. [DOI] [PubMed] [Google Scholar]
- Johnsen E, Colonius T. Shock-induced collapse of a gas bubble in shockwave lithotripsy. J Acoust Soc Am. 2008;124:2011–2020. doi: 10.1121/1.2973229. [DOI] [PMC free article] [PubMed] [Google Scholar]
- Johnsen E, Colonius T. Numerical simulations of non-spherical bubble collapse. J Fluid Mech. 2009;629:231–262. doi: 10.1017/S0022112009006351. [DOI] [PMC free article] [PubMed] [Google Scholar]
- Khokhlova T, Canney M, Khokhlova V, Sapozhnikov O, Crum L, Bailey M. Controlled tissue emulsification produced by high intensity focused ultrasound shock waves and millisecond boiling. J Acoust Soc Am. 2011;130:3498–3510. doi: 10.1121/1.3626152. [DOI] [PMC free article] [PubMed] [Google Scholar]
- Kim Y, Hall TL, Xu Z, Cain CA. Transcranial histotripsy therapy: A feasibility study. IEEE Trans Ultrason, Ferroelect Freq Control. 2014;61:582–593. [Google Scholar]
- Lauterborn W, Bolle H. Experimental investigations of cavitation-bubble collapse in the neighbourhood of a solid boundary. J Fluid Mech. 1975;72:391–399. [Google Scholar]
- Lin KW, Kim Y, Maxwell AD, Wang TY, Hall TL, Xu Z, Fowlkes BJ, Cain CA. Histotripsy beyond the intrinsic cavitation threshold using very short ultrasound pulses: Microtripsy. IEEE Trans Ultrason, Ferroelect Freq Control. 2014;61:251–265. doi: 10.1109/TUFFC.2014.6722611. [DOI] [PMC free article] [PubMed] [Google Scholar]
- Lipsman N, MLS, Huang Y, Lee L, Sankar T, Chapman M, Hynynen K, Lozano AM. MR-guided focused ultrasound thalamotomy for essential tremor: A proof-of-concept study. Lancet Neurol. 2013;12:462–468. doi: 10.1016/S1474-4422(13)70048-6. [DOI] [PubMed] [Google Scholar]
- Little K, Kramer H. Nature of Reticulin. Nature. 1952;170:499–500. doi: 10.1038/170499b0. [DOI] [PubMed] [Google Scholar]
- Macoskey J, Sukovich J, Hall T, Cain C, Xu Z. Real-time acoustic-based feedback for histotripsy therapy. 173rd Meeting of the Acoustical Society of America; Boston, MA. 2017. [Google Scholar]
- McDannold N, Hynynen K, Wolf D, Wolf G, Jolesz F. MRI Evaluation of Thermal Ablation of Tumors with Focused Ultrasound. J Magn Reson Imaging. 1998;8:91–100. doi: 10.1002/jmri.1880080119. [DOI] [PubMed] [Google Scholar]
- Miller R, Maxwell A, Wang T-Z, Fowlkes J, Cain C, Xu Z. Real-time elastography-based monitoring of histotripsy tissue fractionation using color Doppler. IEEE International Ultrasonics Symposium; Dresden, Germany. 2012. [Google Scholar]
- Miller R, Zhang Z, Maxwell A, Cain C, Xu Z. Bubble-Induced Color Doppler Feedback for Histotripsy Fractionation. IEEE Trans Ultrason, Ferroelect Freq Control. 2016;63:408–419. doi: 10.1109/TUFFC.2016.2525859. [DOI] [PMC free article] [PubMed] [Google Scholar]
- Obreschkow D, Tinguely M, Dorsaz N, Kobel P, de Bosset A, Farhat M. Universal scaling law for jets of collapsing bubbles. Phys Rev Lett. 2011;107:1–5. doi: 10.1103/PhysRevLett.107.204501. [DOI] [PubMed] [Google Scholar]
- Ohl C, Ikink R. Shock-wave-induced jetting of micron-sized bubbles. Phys Rev Lett. 2003;90:214502. doi: 10.1103/PhysRevLett.90.214502. [DOI] [PubMed] [Google Scholar]
- Owens G, Miller R, Ensing G, Ives K, Gordon D, Ludomirsky A, Xu Z. Therapeutic ultrasound to non-invasively create intracardiac communications in an intact animal model. Catheter Cardiovasc Interv. 2011;77:580–588. doi: 10.1002/ccd.22787. [DOI] [PMC free article] [PubMed] [Google Scholar]
- Owens G, Miller R, Owens S, Swanson S, Ives K, Ensing G, Gordon DX. Intermediate-term effects of intracardiac communications created noninvasively by therapeutic ultrasound (histotripsy) in a porcine model. Pediatric Cardiology. 2012;33:83–89. doi: 10.1007/s00246-011-0094-6. [DOI] [PubMed] [Google Scholar]
- Parsons J, Cain C, Fowlkes B. Cost-effective assembly of a basic fiber-optic hydrophone for measurement of high-amplitude therapeutic ultrasound fields. J Acoust Soc Am. 2006;119:1432–1440. doi: 10.1121/1.2166708. [DOI] [PubMed] [Google Scholar]
- Parsons J, Cain C, Fowlkes B. Spatial Variability in Acoustic Backscatter as an Indicator of Tissue Homogenate Production in Pulsed Cavitational Ultrasound Therapy. IEEE Trans Ultrason, Ferroelect Freq Control. 2007;54:576–590. doi: 10.1109/tuffc.2007.280. [DOI] [PubMed] [Google Scholar]
- Philipp A, Lauterborn W. Cavitation erosion by single laser-produced bubbles. J Fluid Mech. 1998;361:75–116. [Google Scholar]
- Roberts W. Focused ultrasound ablation of renal and prostate cancer: Current technology and future directions. Urol Oncol. 2005;23:367–371. doi: 10.1016/j.urolonc.2005.05.022. [DOI] [PubMed] [Google Scholar]
- Schade GR, Keller J, Kimberly I, Cheng X, Rosol TJ, Roberts WW. Histotripsy focal ablation of implanted prostate tumor in an ACE-1 canine cancer model. J Urol. 2012;188:1957–1964. doi: 10.1016/j.juro.2012.07.006. [DOI] [PMC free article] [PubMed] [Google Scholar]
- Tomita Y, Shima A. Mechanisms of impulsive pressure generation and damage pit formation by bubble collapse. J Fluid Mech. 1986;169:535–564. [Google Scholar]
- Vlaisavljevich E, Kim Y, Allen S, Pelletier S, Cain C, Ives K, Xu Z. Image-Guided Non-Invasive Ultrasound Liver Ablation Using Histotripsy: Feasibility Study in an In Vivo Porcine Model. Ultrasound Med Biol. 2013;39:1398–1409. doi: 10.1016/j.ultrasmedbio.2013.02.005. [DOI] [PMC free article] [PubMed] [Google Scholar]
- Vlaisavljevich E, Maxwell A, Warnez M, Johnsen E, Cain C, Xu Z. Histotripsy-induced cavitation cloud initiation thresholds in tissues of different mechanical properties. IEEE Trans Ultrason, Ferroelect Freq Control. 2014;61:341–352. doi: 10.1109/TUFFC.2014.6722618. [DOI] [PMC free article] [PubMed] [Google Scholar]
- Wang TY, Winterroth F, Hall TL, Fowlkes BJ, Rothman ED, Roberts WW, Cain CA. Quantitative ultrasound backscatter for pulsed cavitational ultrasound therapy-histotripsy. IEEE Trans Ultrason, Ferroelect Freq Control. 2009;56:995–1005. doi: 10.1109/tuffc.2009.1131. [DOI] [PMC free article] [PubMed] [Google Scholar]
- Wang TY, Xu Z, Hall TL, Fowlkes B, Cain CA. An Efficient Treatment Strategy for Histotripsy by Removing Cavitation Memory. Ultrasound Med Biol. 2012;38:753–766. doi: 10.1016/j.ultrasmedbio.2012.01.013. [DOI] [PMC free article] [PubMed] [Google Scholar]
- Wang TZ, Hall T, Xu Z, Fowlkes J, Cain C. Imaging feedback of histotripsy treatments using ultrasound shear wave elastography. IEEE Trans Ultrason, Ferroelect Freq Control. 2012;59:1167–1181. doi: 10.1109/tuffc.2012.2307. [DOI] [PMC free article] [PubMed] [Google Scholar]
- Wang TZ, Hall T, Xu Z, Fowlkes J, Cain C. Imaging feedback for histotripsy by characterizing dynamics of acoustic radiation force impulse (ARFI)-induced shear waves excited in a treated volume. IEEE Trans Ultrason, Ferroelect Freq Control. 2014;61:1137–1151. doi: 10.1109/TUFFC.2014.3013. [DOI] [PubMed] [Google Scholar]
- Xu Z, Hall T, Fowlkes JB, Cain CA. Effects of acoustic parameters on bubble cloud dynamics in ultrasound tissue erosion (histotripsy) J Acoust Soc Am. 2007;122:229–236. doi: 10.1121/1.2735110. [DOI] [PMC free article] [PubMed] [Google Scholar]
- Xu Z, Ludomirsky A, Eun LY, Hall TL, Tran BC, Fowlkes BJ, Cain CA. Controlled Ultrasound Tissue Erosion. IEEE Trans Ultrason, Ferroelect Freq Control. 2004;51(7):26–736. doi: 10.1109/tuffc.2004.1308731. [DOI] [PMC free article] [PubMed] [Google Scholar]
- Xu Z, Zhenzhen F, Hall TL, Winterroth F, Fowlkes BJ, Cain CA. Size Measurement of Tissue Debris Particles Generated from Pulsed Ultrasound Cavitational Therapy - Histotripsy. Ultrasound Med Biol. 2009;35:245–255. doi: 10.1016/j.ultrasmedbio.2008.09.002. [DOI] [PMC free article] [PubMed] [Google Scholar]
- Zhang X, Macoskey J, Ives K, Owens G, Gurm H, Shi J, Pizzuto M, Cain CA, Xu Z. Non-Invasive Thrombolysis Using Microtripsy in a Porcine Deep Vein Thrombosis Model. Ultrasound Med Biol. 2017;43:1378–1390. doi: 10.1016/j.ultrasmedbio.2017.01.028. [DOI] [PMC free article] [PubMed] [Google Scholar]
- Zhang X, Miller RM, Lin KW, Levin AM, Owens GE, Gurm HS, Cain CA, Xu Z. Real-Time Feedback of Histotripsy Thrombolysis Using Bubble-Induced Color Doppler. Ultrasound Med Biol. 2015;41:1389–1401. doi: 10.1016/j.ultrasmedbio.2014.12.006. [DOI] [PMC free article] [PubMed] [Google Scholar]
- Zhang X, Owens GE, Cain CA, Gurm HS, Macoskey J, Xu Z. Histotripsy Thrombolysis on Retracted Clots. Ultrasound Med Biol. 2016;42:1903–1918. doi: 10.1016/j.ultrasmedbio.2016.03.027. [DOI] [PMC free article] [PubMed] [Google Scholar]


