Abstract
A number of studies have implicated proton-coupled oligopeptide transporters (POTs) in the initiation and/or progression of inflammatory bowel disease and immune cell signaling. With this in mind, the aim of this study was to delineate the expression of POTs in mouse colonic tissues and immune cells, and characterize the potential role of these transporters in nucleotide-binding oligomerization domain (NOD) signaling. Using a dextran sodium sulfate (DSS)-induced colitis mouse model, we found that DSS down regulated Pht1 gene expression and up regulated Pht2 gene expression in colonic tissue and immune cells. In contrast, PEPT1 protein was absent from the colonic tissue and immune cells of normal and DSS-treated mice. NOD ligands, muramyl dipeptide (MDP) and L-Ala-γ-D-Glu-meso-diaminopimelic acid (tri-DAP), were shown to be substrates of PHT2 in MDCK-hPHT219,20AA cells. Subsequent studies revealed that the immune response of lamina propia mononuclear cells may be regulated by PHT1 and PHT2, and that PHT2 facilitated the NOD-dependent immune response in RAW264.7 macrophages. These results clarified the expression of POTs in mouse colonic segments, cells and subtypes, and the role of increased Pht2 expression during chemically-indiced colitis in facilitating NOD-dependent immune response. The findings further suggest that intestinal PHT2 may serve as a therapeutic target for IBD therapy.
Keywords: colon, immune cells, proton-coupled oligopeptide transporters, NOD1/2, immune response
Graphical abstract
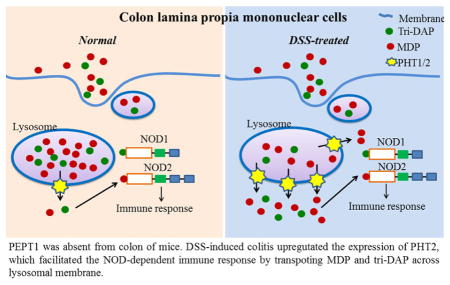
PEPT1 was absent from colon of mice. DSS-induced colitis upregutated the expression of PHT2, which facilitated the NOD-dependent immune response by transpoting MDP and tri-DAP across lysosomal membrane.
1. Introduction
Several proton-coupled oligopeptide transporters (POTs) have been implicated in inflammatory bowel disease (IBD) and colonic immune response signaling, although a clear understanding of the mechanisms involved is far from certain. POTs, which mediate the cellular uptake of di/tripeptides and many peptidomimetics utilizing an inwardly-directed proton gradient and negative membrane potential, are comprised of four mammalian members, namely PEPT1, PEPT2, PHT1 and PHT2.1, 2 The peptide transporters PEPT1 (considered a low affinity high capacity carrier) and PEPT2 (considered a high affinity low capacity carrier) have broad substrate specificity 3 and, in addition to di/tripeptides, can transport peptide-like drugs such as cefadroxil 4 and valacyclovir 5, 6. The peptide/histidine transporters PHT1 and PHT2 are unique in their ability to transport histidine in addition to di/tripeptides and some drugs. PEPT1 and PEPT2, mainly localized at apical membranes of the intestinal epithelial cells 7 and renal proximal tubule epithelial cells 8, respectively, are responsible for the intestinal absorption and renal reabsorption of their substrates. PHT1 is found primarily in brain and eye 9 and PHT2 in lung, spleen and thymus 10 although they are also expressed in small intestine 11, 12. The functional relevance of peptide/histidine transporters, however, remains unclear.
The expression and function of PEPT1 in immune cell regulation of colonic inflammation is controversial. PEPT1 has been shown to mediate the transport of bacterially produced peptides like muramyl dipeptide (MDP) 13 and L-Ala-γ-D-Glu-meso-diaminopimelic acid (tri-DAP) 14 which, when recognized by the intracellular pattern recognition receptor nucleotide–binding oligomerization domain 1 (NOD1) and 2 (NOD2), respectively, can initiate the immune response. Previous studies observed that while PEPT1 protein was not detected at the apical membrane of normal colon, PEPT1 was up regulated in colonic epithelial cells of patients with IBD,15 where it could transport NOD1 and NOD2 peptide ligands from the tubular luminal of colon into enterocytes. The same authors also reported that PEPT1 could transport small bacterial products such as MDP and tri-DAP into macrophages to trigger the immune response, thus, facilitating the induction of colitis.16, 17 However, these studies only examined PEPT1 protein expression in human peripheral blood mononuclear cells and KG-1 cells (human monocytic cell line),17 and Pept1 transcripts but not protein from mouse colonic immune cells.16 Thus, PEPT1 protein expression in the colon of native tissue was unknown. Other studies demonstrated that in mouse, rat and human, PEPT1 was expressed in normal distal colon but not proximal colon.18 Moreover, during dextran sodium sulfate (DSS)- and trinitrobenzene sulphonic acid (TNBS)-induced colitis, the expression of PEPT1 was down-regulated and not required for NOD2-dependent immune activation.19 Still, the expression of PEPT1 protein in colonic immune cells was not studied.
The physiological role and pharmacologic relevance of PHT1 and PHT2 is largely unknown. Studies suggest that PHT1 is associated with diabetes,20 inflammatory bowel disease,21 and systemic lupus erythematous 22 and promotes colitis through Toll-like receptor 9 and NOD1-dependent innate immune responses 23. PHT2 is considered a lymphatic peptide/histidine transporter in which its mRNA expression can be up-regulated by lipopolysaccharide (LPS) in THP-1 (human acute monocytic leukemia cell line) cells and mouse spleen.24 Another study reported that PHT2 protein was found on the lysosomal membrane of transfected HEK-293T (human embryonic cell line) and BHK (baby hamster kidney cell line) cells, suggesting it could transport histidine and peptides from inside the lysosome to the cytosol. 10 Subsequently, Nakamura et al.25 demonstrated that both PHT1 and PHT2 were localized to endo-lysosomes in transfected bone marrow-derived dendritic cells (BMDCs) of mice and were responsible for the egress of MDP- rhodamine into the cytosolic compartment. Thus, it was proposed that PHT1/2 might help bacterially derived peptides, internalized in endo-lysosomes, reach the cytosol and trigger NOD2-dependent innate inflammatory responses.
Given the potential role of POTs in IBD, and the critical lack of information concerning the constitutive expression of POT isoforms in animal models, the primary objective of the present study was to delineate the expression of PEPT1/2 and PHT1/2 in mouse colonic tissues and immune cells. The secondary objective was to characterize the potential role of these transporters in intestinal inflammation, especially the role of PHT2 in NOD-dependent immune response, using a chemically derived colitis model and transfected cell models.
2. Materials and Methods
2.1. Materials
Primers used in quantitative real-time polymerase chain reaction (qRT-PCR) analyses were synthesized by Integrated DNA Technologies (Coralville, Iowa) and shown in Table 1. Primary antibodies included rabbit anti-mouse PEPT1 and PEPT2, as described previously.26 A mouse monoclonal antibody for β-actin or GAPDH was obtained from Thermo Scientific (Rockford, IL). Secondary anti-rabbit and anti-mouse antibodies were obtained from Bio-Rad Laboratories (Hercules, CA). MDP and tri-DAP were purchased from InvivoGen (San Diego, CA), LPS from Sigma-Aldrich (St. Louis, MO), and dextran sulfate sodium salt (DSS) (MW 36,000–50,000) from MP Biomedicals (Solon, OH). All other chemicals or solvents were of the highest grade commercially available.
Table 1.
qRT-PCR primers for POTs mRNA expression in mouse
| Forward primer (5′-3′) | Reverse primer (5′-3′) | |
|---|---|---|
| Pept1 | CCACGGCCATTTACCATACG | TGCGATCAGAGCTCCAAGAA |
| Pept2 | TGCAGAGGCACGGACTAGATAC | GGGTGTGATGAACGTAGAAATCAA |
| Pht1 | GCTGCCACCTGCATTACTACTTC | CGTACTTCACAGACACAATGAGGAA |
| Pht2 | GCTGAAGCTTGCGTTCCAA | AACAGGTGGGCACTTTCAGAGT |
| Gapdh | GAGACAGCCGCATCTTCTTGT | CACACCGACCTTCACCATTTT |
| Il-6 | TCCTCTCTGCAAGAGACTTCCATCC | GGGAAGGCCGTGGTTGTCACC |
| Tnfα | CCACGTCGTAGCAAACCACCAAG | ATCCATGCCGTTGGCCAGGAG |
| Il-1β | AGTTGACGGACCCCAAAAG | AGCTGGATGCTCTCATCAGG |
2.2. Animals and cells
Adult (8–10 weeks) C57BL/6 mice were purchased from The Jackson Laboratory (Bar Harbor, ME). Animal studies were conducted in accordance with the guidelines from the National Institutes of Health for the care and use of animals, and were approved by the Institutional Animal Care and Use Committee at the University of Michigan. Animals were allowed free access to standard laboratory chow and tap water prior to study.
The macrophage cell line RAW264.7 was kindly provided by Prof. Bo Yang, College of Pharmaceutical Sciences, Zhejiang University. The parental Madin–Darby canine kidney (MDCK) cells were acquired from Peking Union Medical College (Beijing, China). All cells were cultured in 25 cm2-plastic plates and maintained at 37°C in humidified atmosphere of 5% CO2 in Dulbecco modified Eagle medium from Invitrogen (Rockford, IL) with 10% fetal bovine serum from ThermoFisher Scientific, (Rockford, IL).
2.3. qRT-PCR analyses
The mRNA expression of POTs in cells and tissues was determined by qRT-PCR using species-specific primers, as described previously.27 Briefly, total RNA was isolated by using the Qiagen RNeasy Plus Mini Kit (Valencia, CA) followed by reverse transcription using the Qiagen Omniscript RT Kit (20 μL mix containing H2O, 1.0 μg total RNA, 2 μL 10x buffer RT, 2 μL 5 mM dNTP mix, 2μL 10 μM Oligo dT primer, 1 μL 10 units/μL RNase inhibitor, 1 μL Omniscript reverse transcriptase) according to the manufacturer’s protocols. Real-time PCR was carried out on an Applied Biosystems 7300 Real-Time PCR System (Foster City, CA) using SYBR Green-based detection. Each sample was measured three times and the averaged cycle threshold (CT) used. Relative mRNA levels of target genes were normalized by mouse Gapdh, and calculated by the ΔCT method as 2−ΔCT, ΔCT = CT (target gene) − CT (Gapdh).
2.4. Immunoblot analyses
POT protein expression was evaluated by immunoblotting, as described previously.27 Briefly, cell and tissue samples were isolated using Nonidet P40-lysis buffer (50 mM Tris-HCl, 150 mM NaCl, 1% Nonidet P40 and proteinase inhibitor cocktail, pH 8.0), and protein concentrations measured using a Bicinchoninic Acid Protein Assay Kit (ThermoFisher Scientific, Rockford, IL). Equal amounts of protein (~ 30 μg) were separated by 10% sodium dodecyl sulfate polyacrylamide gel electrophoresis (SDS-PAGE), transferred onto polyvinylidene difluoride membranes (PVDF) (Millipore Corporation, Billerica, MA), and then blocked overnight with 5.0% nonfat milk in Tris-buffered saline/Tween 20 (TBST) at 4°C. The membranes were incubated with primary antibody (1:5000 dilution, PEPT1 or PEPT2; 1:5000 dilution, β-actin or GAPDH) for 2 hr and washed with TBST for 5 min x five times. The membranes were then incubated with secondary antibody (goat anti-rabbit or anti-mouse IgG-horseradish peroxidase, 1:5000 dilution) for 45 min and washed again. Bound antibodies were detected on X-ray film using LumiGLO Chemiluminescent Substrate (Kirkegaard and Perry Laboratories, Gaithersburg, MD). All immunoblot results were obtained under nonsaturated conditions.
2.5. Preparation of lamina propia mononuclear cells and subtypes from mouse cecum/colon
Lamina propia mononuclear cells (LPMCs), along with CD11b+ (primarily macrophages) and CD11b− immune cells, were isolated according to Weigmann et al.28 Using this method, the cecum and colon were removed and dissected into small pieces, and washed three times with supplemented HBSS (sHBSS) (calcium and magnesium-free Hanks’ balanced salt solution containing 2.5% heat-inactivated FBS, and 100 U/mL penicillin and 100 g/mL streptomycin) while stirring. The tissues were incubated with 1 mM dithiothreitol (Sigma-Aldrich, St. Louis, MO) in sHBSS for 15 min (room temperature) to remove the mucus layer, washed again, and then incubated with “pre-warmed” 2 mM EDTA (Sigma-Aldrich, St. Louis, MO) for 45 min (37°C) to remove the epithelial cells. The supernatant, containing epithelial cells, was collected separately and the remaining sample incubated with 1 mM EDTA (37°C) for 45 min. After being washed three times with sHBSS, the sample was incubated for about 90 min in “pre-warmed” sHBSS containing 250 U/mL collagenase type 3 (Worthington Biochemical, Freehold, NJ) and 0.01 mg/mL DNase I (Worthington Biochemical, Freehold, NJ). The digested tissues were filtered through a 70-μm cell strainer (BD Falcon, Durham, NC) and the lysate centrifuged at 700 g for 10 min (4°C). The pellet containing cells was then re-suspended in 40% Percoll solution (Amersham Biosciences, Piscataway, NJ), layered on top of 75% Percoll solution, and centrifuged at 700 g for 20 min (4°C). Viable LPMCs were recovered from the visible white ring at the interphase of the two different Percoll solutions. Lamina propria macrophages were isolated from LPMCs using human/mouse CD11b MicroBeads (Miltenyi Biotec, San Diego, CA) according to the manufacturer’s instructions. Cells were cultured in supplemented RPMI-1640 medium (430 mL RPMI-1640 with 50 mL fetal calf serum, 5 mL 100x Pen/Strep, 5mL 100x L-glutamine, 5 mL 100x HEPES, 5 mL 100x NEAA and 500 μl 1000x 2-mercaptoethanol; Gibco - Life Technologies, Grand Island, NY).29
2.6. Induction of ulcerative colitis in mice
DSS (3.0% w/v) was added to the drinking water of adult male mice for 7 days,30 and the physical characteristics (i.e., body weight, stool consistency and stool blood content) recorded daily. Colon length (including cecum) was measured on day 7 after the mice were euthanized. Histological examination of hematoxylin and eosin-stained colonic sections was carried out by the Pathology Core for Animal Research of the University of Michigan. In addition to body weight, disease severity was evaluated using a stool scoring system with normal stool consistency without blood (0 points), soft stools with traces of blood (1 point), very soft stool with visible blood (2 points) and watery stools with visible rectal bleeding (3 points).31
2.7. Stimulation of LPMCs with MDP, tri-DAP and lipopolysaccharide
LPMCs, isolated from the cecum/colon of untreated (water alone) or DSS-induced mice, were seeded on 24-well plates at a density of 7.0 × 10⁵ cells/well. Stimulation was initiated by incubating the LPMCs with lipopolysaccharide (LPS) (10 ng/mL), MDP (100 μg/mL) or tri-DAP (100 μg/mL) in culture medium for 24 hr. Inhibition experiments were performed by co-incubating LPMCs (containing MDP or tri-DAP) with the PHT2 substrate L-histidine (25 mM; Sigma-Aldrich, St. Louis, MO) or negative control alanine (25 mM; Sigma-Aldrich, St. Louis, MO). Following the incubation period, the culture medium was collected for cytokine measurements.
2.8. Cell transfection
MDCK cells were transfected with plasmid hPHT2L19A,L20A-eGFP- pcDNA3.1/Hygro (+) (constructed in-house, leucine at position 19, 20 of hPHT2 was mutated into alanine) according to the manufacturer’s instructions of Lipofectamine™ 2000 (Invitrogen, Rockford, IL). The disruption of cytoplasmic di-leucine motifs of hPHT2 makes it locate to the plasma membrane 25. Cells were screened by hygromycin B (400 μg/ml) for 14 days, and positive single clones with stable hPHT219,20AA expression (MDCK-hPHT219,20AA) were confirmed by accumulation of d3-L-histidine (PUEN Scientific Instrument Co. Guangzhou, China) and fluorescence detection. Cells transfected with empty pcDNA3.1(+)-eGFP vector served as control (mock).
RAW264.7 cells were seeded on 24-well plates at a density of 3.0 × 10⁵ cells/well 24 hr before transfection to achieve 40–50% confluence. Cells were transient transfected with plasmid musPHT2-His-pcDNA3.1 (+) or empty pcDNA3.1 (+) by using Lipofectamine3000™ (Invitrogen, Rockford, IL) according to the manufacturer’s protocol. After 24 hr, cells were gently washed twice with fresh medium. Stimulation was initiated by incubating the RAW264.7-musPHT2 and RAW264.7-vector cells with MDP (10 μg/mL), tri-DAP (10 μg/mL) or LPS (10 ng/mL) in culture medium for 0, 4, 6 and 8 hr, after which total RNA was isolated at the designated time for target gene detection. RAW264.7-musPHT2 and RAW264.7-vector cells were also stimulated with MDP (0, 1, 10 μg/mL), tri-DAP (0, 1, 10 μg/mL) or LPS (0, 10 ng/mL) in culture medium for 24 hr, and the medium was then collected for cytokine measurements.
2.9. Uptake studies and LC-MS/MS assay
MDCK-hPHT219,20AA and mock cells were washed twice with MES buffer (1 L ddH2O: 8.00g NaCl, 0.40g KCl, 0.14g CaCl2, 0.20g MgSO4·7H2O, 0.06g Na2HPO4·12H2O, 0.06g KH2PO4, 0.35g NaHCO3, 1.00g glucose, 1.95g MES, pH 5.5). Uptake was initiated by adding a specific concentration of MDP or tri-DAP in MES buffer (pH 5.5) and incubated at 37 °C for 30 or 60 min, and then terminated by removing the buffer and rapidly washing 3 times with ice-cold MES. Preliminary studies indicated that both MDP and tri-DAP were stable in buffer over the incubation periods examined (data not shown). Cells were solubilized in 100 μl of 0.1% SDS (Sigma-Aldrich, St. Louis, MO), 80 μl of cell lysate was mixed with 160 μl acetonitrile containing the internal standard (10 nM valacyclovir, National Institutes for Food and Drug Control, Beijing, China), and the mixture was then centrifuged for 15 min at 16,000 g. Concentrations of MDP or tri-DAP in the supernatant were assayed by an Agilent 1290/6460 LC-MS with a triple-quadrupole mass spectrometer (Agilent Technologies, Santa Clara, CA). Isocratic chromatographic separation was performed on an Agilent ZORBAX SB-Aq C18 column (5 μm, 4.6×150 mm) at a flow rate of 0.6 ml/min with 40% mobile phase A (0.1% formic acid in 20 mM ammonium formate-water) and 60% B (0.1% formic acid in acetonitrile) for MDP, or 55% mobile phase A and 45% mobile phase B for tri-DAP. The compounds were detected by mass spectrometry with an electrospray ionization source under the following conditions: positive ion mode; capillary voltage, 3.5 kV; ion source temperature, 140°C; and desolation temperature, 350°C. Quantification was obtained using the multiple reaction monitoring mode at m/z transitions of 493.1 > 138 for MDP, 391.1 > 170.1 for tri-DAP and 325 > 125 for valacyclovir. Fragmentor voltage and collision energy were set at 110V and 30V (MDP), 90V and 20V (tri-DAP), and 120V and 10V (valacyclovir).
2.10. Quantification of cytokines
Protein concentrations of the proinflammatory cytokines IL-6, TNFα and IL-1β were quantified using the Quantikine Colorimetric Sandwich ELISA Kit (R&D Systems, Minneapolis, MN) according to the manufacturer’s protocol.
2.11. Statistics
The data were reported as mean ± SE, and statistical analyses were performed using GraphPad Prism version 5.01 for Windows (La Jolla, CA). An unpaired two-tailed Student’s t-test was used to compare differences between two groups. For multiple comparisons, a one-way analysis of variance (ANOVA) was used followed by Dunnett’s or Tukey’s post hoc test. A probability of p ≤ 0.05 was considered significant.
3. Results
3.1. POTs expression in mouse LPMCs and colon
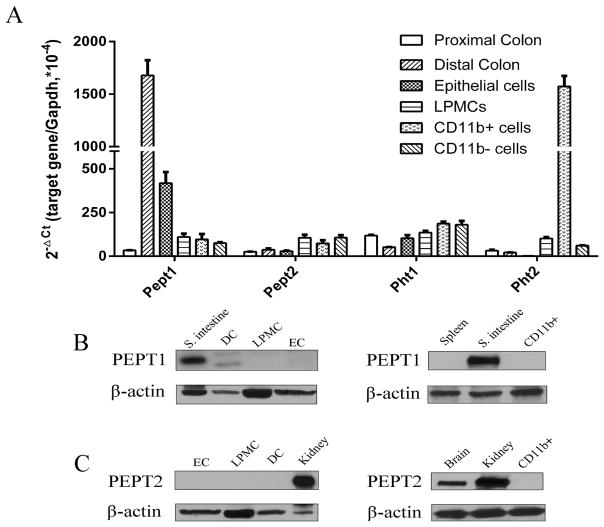
In order to gain a better understanding of the expression of POTs in colon, especially immune cells, lamina propria mononuclear cells were isolated from the cecum/colon of normal mice and then separated into CD11b+ and CD11b− subtypes. As shown in Fig. 1A, Pept1 transcripts were much higher in the distal colon as compared to the proximal colon and other cells. Pept2 and Pht1 transcripts were detected in proximal and distal colon, and all cells, but the expression levels were much lower compared to Pept1. Pht2 was the only POT with very high mRNA expression in CD11b+ macrophages; however, its expression was faint in proximal and distal colon and other cells. Immunoblots were performed to determine whether the expression of PEPT1 and PEPT2 proteins was consistent with mRNA levels. Protein expression of these transporters are shown in Figs. 1B (PEPT1) and 1C (PEPT2), with the small intestine and kidney serving, respectively, as positive controls. The blots demonstrated that PEPT1 and PEPT2 proteins were not expressed in distal colon, LPMCs, epithelial cells and CD11b+ macrophages, despite Pept1 having high mRNA expression in the distal colon.
Fig. 1.
Expression of proton-coupled oligopeptide transporters (POTs) in the colon and immune cells. (A) mRNA expression of POTs in proximal and distal colon, epithelial cells, lamina propia mononuclear cells (LPMCs), CD11b+ macrophages, and CD11b− immune cells prepared from mouse colon. The CT values of POTs genes and Gapdh ranged from 16~29. Data are expressed as mean ± SE (n=3). Protein expression of PEPT1 (B) and PEPT2 (C) in distal colon (DC), and epithelial cells (EC), lamina propia mononuclear cells (LPMCs), and CD11b+ macrophages prepared from mouse colon. The small intestine was used as a positive control for PEPT1, the kidney was used as a positive control for PEPT2. Immunoblots are shown for one representative experiment from three independent studies showing similar results.
3.2 POTs expression in mouse LPMCs and colon during DSS-induced colitis
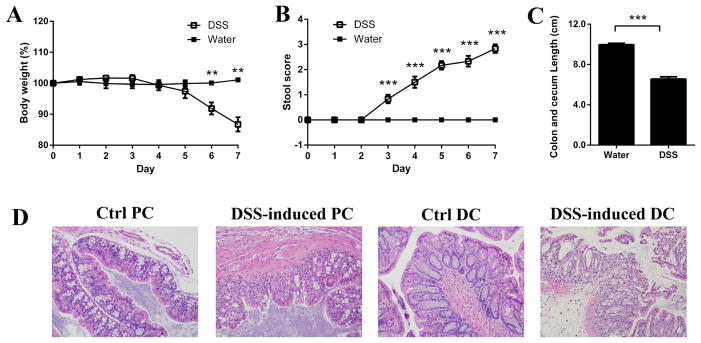
There is considerable controversy concerning the regulation of apically expressed colonic PEPT1 during inflammation and the potential role of intracellular PEPT1 in transporting MDP and tri-DAP into macrophages. There is also evidence suggesting that PHT1 and PHT2 may affect immune response signaling by transporting bacterially derived peptides out of endo-lysosomes in colonic immune cells and into the cytosol. Thus, studies were performed in mouse LPMCs and colon to examine whether PEPT1, PHT1 and PHT2 expression was altered by inflammation using a DSS-induced ulcerative colitis model. As shown in Fig. 2, mice treated with DSS showed a progressive and significant weight loss (panel A) and disease severity, as evidenced by an increasing stool score (panel B), over time. In addition, the colon length (includes cecum) was significantly shorter at day 7 in DSS-treated mice compared to control (water alone) animals (panel C). Histological analysis of representative sections from proximal and distal colon showed epithelial erosion and immune cell infiltration (panel D). All these symptoms were consistent with the chemical-induction of colitis in our mouse model.
Fig. 2.
Chemically induced colitis was achieved in mice using dextran sodium sulfate (DSS) in which the animals were given 3.0% DSS in their drinking water for 7 days. Weight loss (A) and disease severity (B) were evaluated daily, and colon length including cecum (C) was evaluated at day 7. Histological examination of tissues obtained from proximal colon (PC) and distal colon (DC) was performed on normal (control, Ctrl) and DSS-induced mice (D). Data are expressed as mean ± SE (n=6). **p < 0.01 and ***p < 0.001 using an unpaired Student’s t-test.
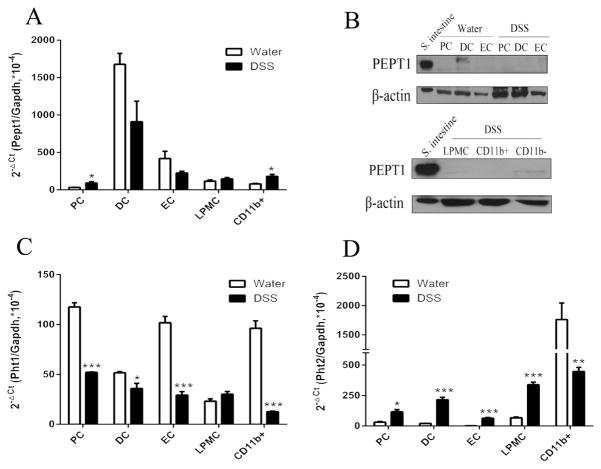
In regard to gene expression, Pept1 transcripts were not different in DSS-treated mice, compared to water controls (Fig. 3A), with the exception of a small up-regulation in proximal colon and CD11b+ macrophages. In regard to protein levels, PEPT1 was not detected in any of the colonic tissues or cells (Fig. 3B), indicating that DSS-induced colitis did not trigger an aberrant expression of PEPT1 in colonic tissues or cells. The mRNA levels of Pht1 were low and significantly down regulated in proximal and distal colon, epithelial cells and CD11b+ macrophages, but not in LPMCs (Fig. 3C). Pht2 mRNA expression, on the other hand, was significantly up regulated in proximal and distal colon, epithelial cells and LPMCs, but down regulated in CD11b+ macrophages (Fig. 3D). This finding suggests the effect of DSS in colonic immune cells may be more significant for PHT2 than PHT1 given its mRNA up-regulation in LPMCs.
Fig. 3.
Expression of proton-coupled oligopeptide transporters (POTs) in the colon and immune cells from normal mice (water) and chemically induced colitis (DSS) mice. The animals were given water alone or 3.0% DSS in their drinking water for 7 days at which time the samples were obtained. mRNA expression of Pept1 (A), Pht1 (C) and Pht2 (D) was detected in proximal colon (PC), distal colon (DC), epithelial cells (EC), lamina propia mononuclear cells (LPMCs) and CD11b+ macrophages. The CT values of POTs genes and Gapdh ranged from 16~29. Data are expressed as mean ± SE (n=3–6). *p < 0.05 and **p < 0.01 using an unpaired Student’s t-test. Protein expression of PEPT1 (B) was detected in proximal colon (PC), distal colon (DC), epithelial cells (EC), lamina propia mononuclear cells (LPMCs) and CD11b+ macrophages from normal mice and DSS-induced mice. The small intestine was used as a positive control for PEPT1. Immunoblots are shown for one representative experiment from three independent studies showing similar results.
3.3. MDP and tri-DAP are substrates of PHT2
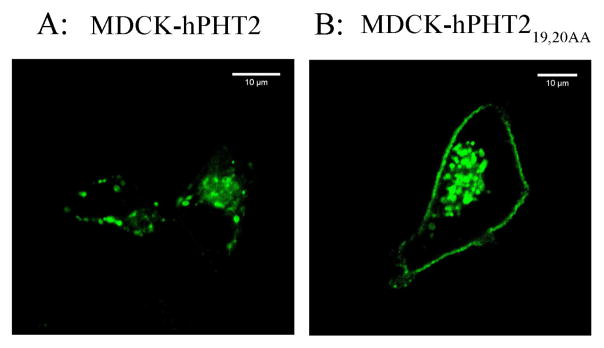
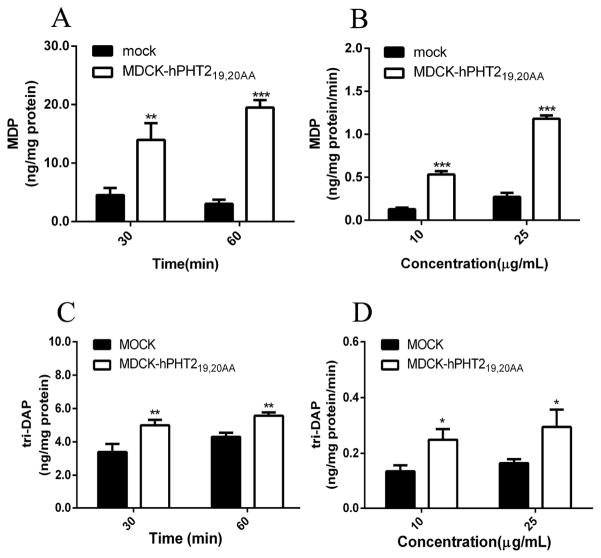
The above results indicated that ulcerative colitis up-regulated the expression of Pht2 transcripts in mouse colonic tissue and immune cells, which implies PHT2 may play an important role in immune response. A possible way that PHT2 affects immune response is to transport bacterial peptides like MDP or tri-DAP across lysosomal membranes to trigger an NOD-dependent immune response. Therefore, it is necessary to find out whether or not MDP and tri-DAP are substrates of PHT2. Thus, we constructed MDCK-hPHT219,20AA monoclonal cells with stable expression of hPHT2 protein in plasma membranes (Fig. 4), and investigated the accumulation of MDP or tri-DAP in MDCK-hPHT219,20AA and mock cells. As shown in Figs. 5A and 5C, the accumulation of MDP and tri-DAP in MDCK-hPHT219,20AA cells was about 3- to 6-fold and 1.2- to 1.6-fold higher than that of mock cells, respectively, when incubated with 10 μg/mL of substrate for 30 or 60 min. Similar results were also observed when cells were incubated with 10 μg/mL or 25 μg/mL of MDP or tri-DAP for 30 min (Figs. 5B and 5D). The results demonstrated that PHT2 is capable of transporting MDP and tri-DAP, and with a higher transport capacity for MDP.
Fig. 4.
Expression of hPHT219,20AA protein in cell plasma membranes. hPHT2 (A) or hPHT219,20AA (B) was expressed as eGFP fusion proteins in MDCK cells, then observed by confocal microscopy. Bar = 10 μm.
Fig. 5.
MDCK-hPHT219,20AA and mock cells were incubated in MES buffer (pH 5.5) with 25 μg/mL of MDP (A) or tri-DAP (C) for 30 or 60 min at 37°C. MDCK-hPHT219,20AA and mock cells were incubated in MES buffer (pH 5.5) with 10 μg/mL and 25 μg/mL of MDP (B) or tri-DAP (D) for 30 min at 37°C. Data are expressed as mean ± SE (n=3). **p < 0.01 and ***p < 0.001 as compared to mock cells using an unpaired Student’s t-test.
3.4. Role of PHT1 and PHT2 in the immune response of mouse LPMCs to MDP and tri-DAP
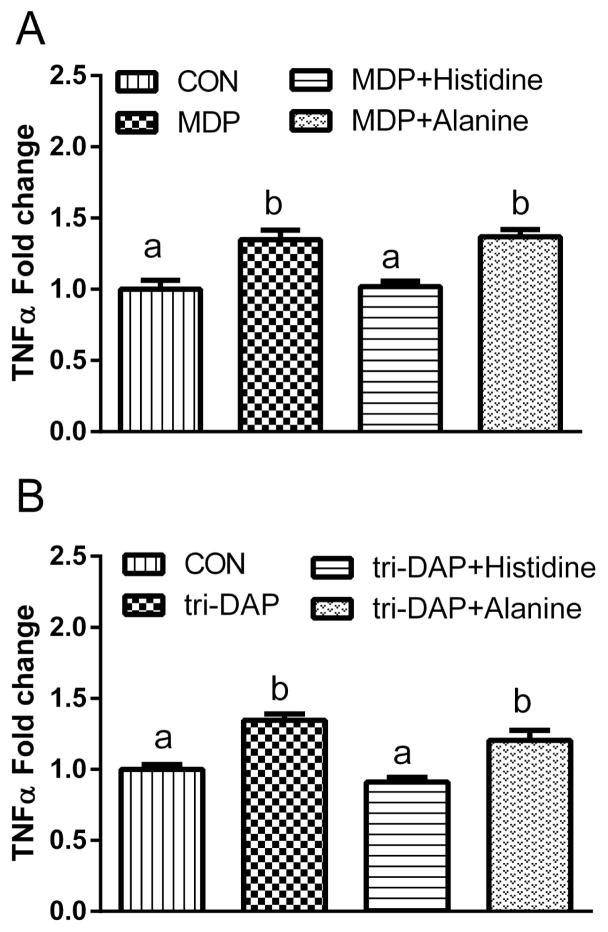
Given the effect of DSS-induced colitis on Pht1 and Pht2 mRNA expression in mouse LPMCs, along with the substrate specificity of PHT2 for bacterially-produced di/tripeptides, these transporters were then evaluated with respect to cytokine expression. In this study, MDP (a NOD2 ligand) and tri-DAP (a NOD1 ligand) were used to stimulate the immune response of LPMCs. L-Histidine was used as an inhibitor to block the function of PHT1/2. First, we compared the immune response to MDP, tri-DAP and LPS stimulation of LPMCs from normal (Fig. 6A) and DSS-induced mice (Fig. 6B). The results showed that, except for LPS, MDP and tri-DAP had little (or no) effect on the protein expression of IL-6, TNFα and IL-1β. Moreover, the protein expression of TNFα and IL-1β in LPMCs was not significantly different between normal and DSS-induced mice; IL-6 expression, however, was increased in DSS-induced mice (Fig. 6C). Next, we incubated the LPMCs of normal mice with a PHT1/2 inhibitor (25 mM L-histidine) or alanine (25mM, negative control), applied different stimuli (MDP or tri-DAP), and measured the effect on TNFα release (Fig. 7). The results showed that L-histidine, but not alanine, suppressed the increased protein expression of TNFα induced by MDP (panel A) and tri-DAP (panel B). Thus, PHT1/2 may regulate the immune response in LPMCs of mouse colon by participating in the transport of MDP and tri-DAP.
Fig. 6.
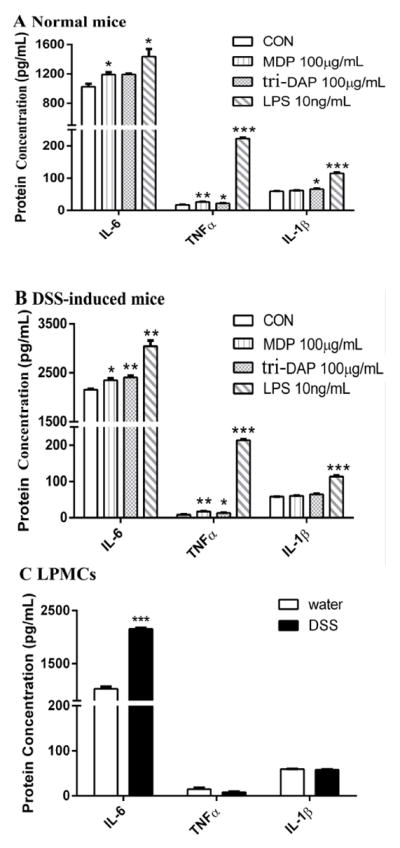
Protein expression of IL-6, TNFα and IL-1β in lamina propia mononuclear cells (LPMCs) induced by 24 hr incubations of MDP (100 μg/mL), tri-DAP (100 μg/mL) or LPS (10 ng/mL). (A) LPMCs were prepared from normal mice. (B) LPMCs were prepared from DSS-induced colitis mice. (C) The expression of f IL-6, TNFα and IL-1β in LPMCs from normal and colitis mice. Data are expressed as mean ± SE (n=6 samples/treatment) in which six animals were pooled for each sample. *p < 0.05, **p < 0.01 and ***p < 0.001 as compared to buffer (control, CON) using ANOVA followed by Dunnett’s test.
Fig. 7.
Effect of 25 mM histidine or alanine on the protein expression of TNFα in lamina propia mononuclear cells (LPMCs) induced by 24 hr incubations of 100 μg/mL MDP (A) or tri-DAP (B). Data are expressed as mean ± SE (n=6 samples/treatment) in which six animals were pooled for each sample. Treatment groups with different letters are statistically different using ANOVA followed by Tukey’s test, CON=control group (unstimulated).
3.5. PHT2 facilitates the immune response of RAW264.7 macrophages to MDP and tri-DAP
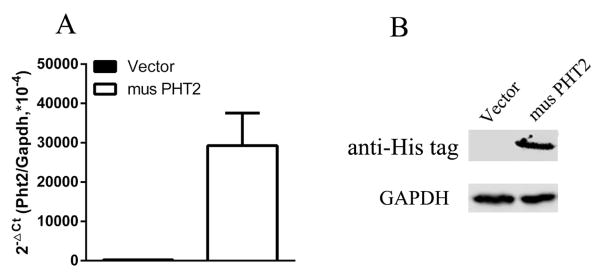
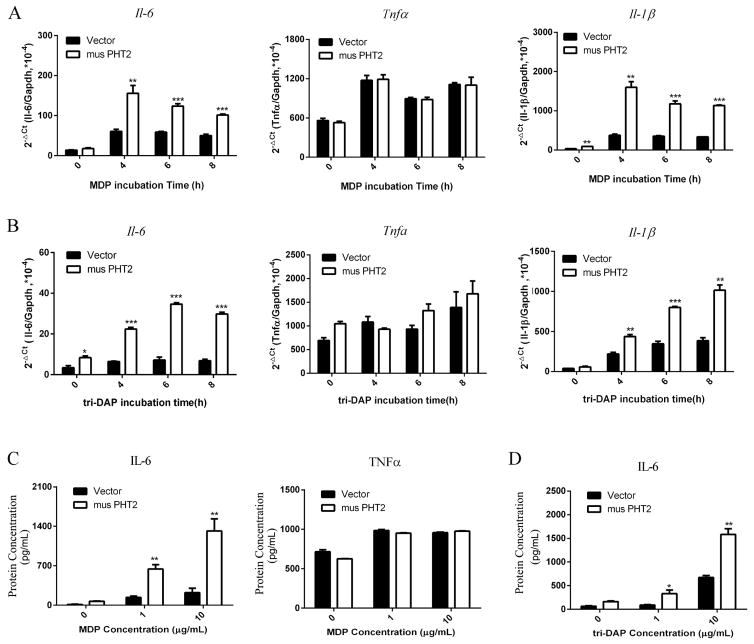
The above result showed that LPMCs may not be an appropriate cell model for the study of PHT2 function in immune response because of its weak response to stimuli. Here, we used RAW264.7 macrophages with PHT2 overexpression to further explore its function in NOD-dependent immune response. As shown Fig. 8, RAW264.7-musPHT2 cells expressed significantly higher musPHT2 mRNA and protein levels than RAW264.7-vector cells. RAW264.7-musPHT2 cells and RAW264.7- vector cells were treated with MDP (10 μg/mL) or tri-DAP (10 μg/mL) for 0, 4, 6 and 8 hr. The results showed that, except for TNFα, the transcription levels of IL-6 and IL-1β were significantly higher in RAW264.7-musPHT2 than in RAW264.7-vector (Figs. 9A and 9B). To confirm these results, RAW264.7-musPHT2 cells and RAW264.7-vector cells were treated with MDP (0, 1, 10 μg/mL) or tri-DAP (0, 1, 10 μg/mL) for 24 hr, and the culture medium was collected for cytokine measurements. The protein expression results were consistent with that of gene expression, where IL-6 was much higher in RAW264.7-musPHT2 cells than that in RAW264.7-vector cells; no difference was observed for TNFα (Figs. 9C and 9D). These results indicated that PHT2 facilitated the MDP- and tri-DAP-induced NOD-dependent immune response in transfected RAW264.7 cells.
Fig. 8.
musPHT2 expression in RAW264.7 cells evaluated by qRT-PCR and western blot. RAW264.7 cells were transiently transfected with pcDNA3.1(+)-musPHT2-his tag or vector for 24 hr, total RNA and protein were isolated respectively for qRT-PCR (A) and western blot (B) to evaluate the expression of PHT2. Data are expressed as mean ± SE (n=3). Immunoblots are shown for one representative experiment from three independent studies showing similar results.
Fig. 9.
The expression of IL-6, TNFα and IL-1β in RAW264.7-musPHT2 and RAW264.7-vector cells stimulated with MDP or tri-DAP. RAW264.7 cells were transiently transfected with pcDNA3.1(+)-musPHT2-his tag or vector for 24 hr and then stimulated with 10 μg/mL MDP (A) or tri-DAP (B) for 0, 4, 6 and 8 hr, after which total RNA was isolated for Il-6, Tnfα and Il-1β detection. The CT values of Il-6, Tnfα, Il-1β and Gapdh ranged from 16~27. RAW264.7 cells were transiently transfected with pcDNA3.1(+)-musPHT2-his tag or vector for 24 hr and then stimulated with 0, 1, 10 μg/mL MDP (C) or tri-DAP (D) for 24 hr, after which cell supernatant was collected for IL-6 and TNFα detection. Data are expressed as mean ± SE (n=3). *p < 0.05, ***p < 0.001 as compared to cells transfected with vector using an unpaired Student’s t-test.
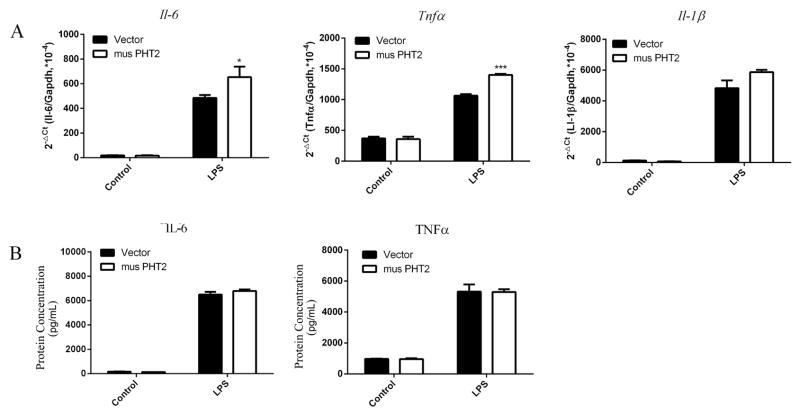
In order to demonstrate that the PHT2 facilitated NOD-dependent immune response was specifically due to transporting NOD ligands (MDP and tri-DAP), RAW264.7-musPHT2 and RAW264.7-vector cells were treated with LPS (10 ng/mL) for 4 or 24 hr. As shown in Fig. 10A, the transcription levels of IL-6 and TNFα were higher in RAW264.7-musPHT2 cells than that in RAW264.7-vector cells, whereas no difference was observed for IL-1β. Moreover, the protein expression levels of IL-6 and TNFα in the culture medium of RAW264.7-musPHT2 cells and RAW264.7-vector cells stimulated with LPS (10 ng/mL) for 24 hr were not significantly different (Fig. 10B). This finding indicated that PHT2 had no effect on LPS-induced immune response and suggested that the PHT2 facilitated NOD-induced immune response was due to the ability of this protein to transport NOD ligands.
Fig. 10.
The expression of IL-6, TNFα and IL-1β in RAW264.7-musPHT2 and RAW264.7-vector cells stimulated with LPS. RAW264.7 cells were transiently transfected with pcDNA3.1(+)-musPHT2-his tag or vector for 24 hr and then stimulated with LPS (10 ng/mL) for 4 hr, after which total RNA was isolated for Il-6, Tnfα and Il-1β detection (A). The CT values of Il-6, Tnfα, Il-1β and Gapdh ranged from 16~27. RAW264.7 cells were transiently transfected with pcDNA3.1(+)-musPHT2-his tag or vector for 24 hr and then stimulated with LPS (10 ng/mL) for 24 hr, after which cell supernatant were collected for IL-6 and TNFα protein detection (B). Data are expressed as mean + SE (n=3). *p < 0.05, ***p < 0.001 as compared to cells transfected with vector using an unpaired Student’s t-test.
4. Discussion
A number of studies have implicated a role for POT family members in the initiation and/or progression of IBD and immune cell signaling. However, there has been scant information regarding the constitutive protein expression and function of these POTs in intestinal tissues and, in particular, colonic immune cells from native tissue. In the present study, several important findings were reported for the first time using mouse colon, colonic cells and subtypes, such that: 1) with or without inflammation, PEPT1 protein was not expressed in lamina propia mononuclear cells of the colon or colonic CD11b+ macrophages; 2) Pht1 was down-regulated and Pht2 up-regulated by DSS-induced colitis in proximal and distal colon and lamina propia mononuclear cells; 3) MDP and tri-DAP are substrates of PHT2; and 4) the immune responses of MDP- and tri-DAP-treated LPMCs were regulated by PHT1/2, and PHT2 facilitated the NOD-dependent immune response in RAW264.7 macrophages stimulated with these two bacterially-produced di/tripeptides.
Our results differ from that of Merlin and coworkers 15, 16, 17 who suggested that PEPT1 was expressed in the colon and colonic immune cells during IBD 15. They also suggested that PEPT1-containing immune cells from mouse colon were responsible for the uptake of MDP and tri-DAP into macrophages and the subsequent immune response. However, their studies only examined PEPT1 protein expression in human peripheral blood mononuclear cells and KG-1 cells (human monocytic cell line),17 and Pept1 transcripts but not protein from mouse colonic immune cells.16 In our studies, we examined the PEPT1 protein expression from native tissue and primary immune cells of mouse colon, and found no evidence of PEPT1 protein in mouse colonic epithelial cells, LPMC or CD11b+ macrophages. The Merlin group also tried to evaluate the function of PEPT1 in vivo, where they reported that colonic PEPT1 expression aggravated DSS-induced colitis in mice.32 On the other hand, Daniel and coworkers 18, 19 presented results contrary to that of Merlin in which PEPT1 protein was expressed in mouse distal colon (abundance ~40% of that found in small intestine) but was essentially absent in proximal colon. The Daniel group also demonstrated that PEPT1 protein levels were consistently reduced in DSS- and TNBS-induced colitis mouse models, and during inflammation in IBD patients.19 These studies, however, did not measure the expression of PEPT1 protein in colonic cellular- or subcellular- preparations. In our studies, PEPT1 protein was not observed in mouse proximal and distal colon, colonic epithelial cells and CD11b immune cells, even during DSS-induced colitis in mice. The disparity among investigators is unclear but may be due to differences in antibody specificity, the site of sampling (i.e., regional specificity), or the method of sample preparation among laboratories. Notwithstanding this uncertainty, our studies corroborate that of Daniel and coworkers 18, 19 in arguing against PEPT1 having a primary role in the inflammatory response.
Despite our finding that PEPT1 mRNA was significantly up regulated in the proximal colon and CD11b+ macrophages of DSS-induced mice, no protein expression was observed in the colon and macrophages of untreated or DSS-induced mice, a result consistent with the literature. Thus, subsequent studies on how PEPT1 might influence IBD pathogenesis in vivo was not performed. Instead, we elected to focus on PHT1 and PHT2, which was recently shown to be related with the immune response 23, 24, 25.
Studies indicated that PHT1 was associated with the innate immune response and had substantial expression in monocytes, macrophages and dendritic cells 23, 33. PHT2 was also shown to be highly expressed in macrophages and monocytes 24, 33. While there are currently no studies demonstrating the expression of PHT1 or PHT2 protein in colonic and immune cell preparations from native colon. Our results showed low expression levels of Pht1 transcripts in proximal and distal colon, LPMCs, epithelial cells and CD11b+ and CD11b− immune cells. In addition, during DSS-induced colitis, Pht1 transcripts were significantly reduced with unknown reasons. With respect to PHT2, our studies showed that Pht2 transcripts were significantly up-regulated in colonic tissues and immune cells of DSS-induced mice, which was consist with our previous observation that LPS-induced inflammation increased the expression of Pht2.24
Increasing evidence points to an important role of endosomes/lysosomes as signaling platforms in immune cell function and, in particular, for PHT1 and PHT2 as key transporters in the delivery of NOD ligands to cytosolic receptors.25, 34 Although both NOD1 and NOD2 can interact with tri-DAP and MDP, respectively, to activate NF-KB and proinflammatory cytokines,35, 36 it is still unclear how these (and other) bacterially derived components reach the cytosol. For example, during inflammatory conditions such as IBD, do the ligands enter colonic epithelial cells by specific peptide transporters or by endocytotic pathways? Alternatively, are the bacteria internalized by colonic immune cells in the lamina propia, which fuse with endo-lysosomes and then release the lysosomal degradation products into cytosol? In our study, neither PEPT1 nor PEPT2 protein (two peptide transporters located apically in plasma membranes) was detected in colonic tissue segments or cells, therefore, we can rule out POT-mediated tri-DAP and MDP entry at the epithelial cell surface. Moreover, it has been reported that endocytosis is an important pathway for the entry of NOD ligands into the cell, and the cytosolic internalization of tri-DAP and MDP was pH-dependent.21 In our study, we provided direct and powerful evidence that tri-DAP and MDP were substrates of PHT2. Thus, the most probable mechanism was that tri-DAP and MDP were internalized by immune cells which fused with lysosomes, subsequently releasing these di/tripeptides into the cytosolic compartment (via lysosomal membrane transporter PHT1 or PHT2) where they could then activate NOD1 and NOD2, respectively.
Our previous study showed that PHT2 transcripts were up regulated by LPS in mouse spleen,24 an important tissue in immune system regulation. It was also reported that PHT1 and PHT2 were expressed in the endo-lysosomal compartments of transfected mouse BMDCs, that IL-6 production was stimulated by MDP and LPS in RAW264.7 cells, and that PHT1/2 were required for the NOD2 responses to endosomally derived MDP.34 Our study extended the previous findings by showing that, during DSS-induced colitis, PHT2 gene expression was significantly up-regulated in the colon and lamina propia mononuclear cells. Using the mouse macrophage cell line RAW264.7 as a model system, we found overexpression of PHT2 significantly increased the release of pro-inflammatory cytokines induced by MDP and tri-DAP, but not by LPS, which implied PHT2 promoted the inflammatory response because of its ability to transport these two bacterially-produced di/tripeptides. When macrophages were given MDP or tri-DAP extracellularly, macrophages with overexpression of lysosomal PHT2 can transport more MDP or tri-DAP to the cytosol, triggering an immune response. Thus, the up-regulation of PHT2 may be responsible, at least in part, for the progression of inflammatory states.
In concluding, the present study provided important information on the expression of POTs in mouse colonic segments, cells and subtypes. We demonstrated that PEPT1 was not present in colonic tissue, epithelial cells or immune cells including macrophages, and that an absence of expression was still observed during chemically induced colitis. We also demonstrated that DSS-induced ulcerative colitis increased the gene expression of Pht2 and reduced the gene expression of Pht1. Finally, we proved that the NOD ligands MDP and tri-DAP were substrates of PHT2, and that PHT2 can facilitate the NOD-dependent immune response. We appreciate the fact that many of our studies were performed in vitro, and that further validation with in vivo models will be needed. Future experiments will address the functional role of PHT2 on immune response, hopefully, with the use of Pht2 knockout mice. Collectively, our results provide novel information on how POT transporters may affect the pathogenesis of inflammatory bowel disease. By extension, blocking PHT2 function and/or expression may be a potential strategy to treat patients with IBD.
Acknowledgments
This work was supported by the National Institutes of Health National Institute of General Medical Sciences grant R01GM115481 (to DES), by the National Natural Scientific Foundation of China (81573492) and by Zhejiang Provincial Science and Technology Foundation of China (2015C33162).
Abbreviation
- IBD
inflammatory bowel disease
- NOD1
nucleotide-binding oligomerization domain 1
- NOD2
nucleotide-binding oligomerization domain 2
- LPMCs
lamina propia mononuclear cells
- LPS
lipopolysaccharide
- MDP
muramyl peptide
- tri-DAP
L-Ala-γ-D-Glu-meso-DAP
- PCR
polymerase chain reaction
- SLC15A
solute carrier family 15 A
- LC-MS/MS
high-performance liquid chromatography-mass spectrometer
- POTs
proton-coupled oligopeptide transporters
- DSS
dextran sodium sulfate
- hPHT2
human PHT2 transporter
- musPHT2
mouse PHT2 transporter
Footnotes
Conflict of Interest
The authors declare no conflicts of interest, financial or otherwise.
Publisher's Disclaimer: This is a PDF file of an unedited manuscript that has been accepted for publication. As a service to our customers we are providing this early version of the manuscript. The manuscript will undergo copyediting, typesetting, and review of the resulting proof before it is published in its final citable form. Please note that during the production process errors may be discovered which could affect the content, and all legal disclaimers that apply to the journal pertain.
References
- 1.Rubio-Aliaga I, Daniel H. Peptide transporters and their roles in physiological processes and drug disposition. Xenobiotica. 2008;38:1022–42. doi: 10.1080/00498250701875254. [DOI] [PubMed] [Google Scholar]
- 2.Smith DE, Clemencon B, Hediger MA. Proton-coupled oligopeptide transporter family SLC15: physiological, pharmacological and pathological implications. Mol Aspects Med. 2013;34:323–36. doi: 10.1016/j.mam.2012.11.003. [DOI] [PMC free article] [PubMed] [Google Scholar]
- 3.Brandsch M. Transport of drugs by proton-coupled peptide transporters: pearls and pitfalls. Expert Opin Drug Metab Toxicol. 2009;5:887–905. doi: 10.1517/17425250903042292. [DOI] [PubMed] [Google Scholar]
- 4.Hu Y, Smith DE. Species differences in the pharmacokinetics of cefadroxil as determined in wildtype and humanized PepT1 mice. Biochem Pharmacol. 2016;107:81–90. doi: 10.1016/j.bcp.2016.03.008. [DOI] [PMC free article] [PubMed] [Google Scholar]
- 5.Ganapathy ME, Huang W, Wang H, Ganapathy V, Leibach FH. Valacyclovir: a substrate for the intestinal and renal peptide transporters PEPT1 and PEPT2. Biochem Biophys Res Commun. 1998;246:470–5. doi: 10.1006/bbrc.1998.8628. [DOI] [PubMed] [Google Scholar]
- 6.Yang B, Smith DE. In Silico Absorption Analysis of Valacyclovir in Wildtype and Pept1 Knockout Mice Following Oral Dose Escalation. Pharm Res. 2017 doi: 10.1007/s11095-017-2242-z. [DOI] [PMC free article] [PubMed] [Google Scholar]
- 7.Jappar D, Wu SP, Hu Y, Smith DE. Significance and regional dependency of peptide transporter (PEPT) 1 in the intestinal permeability of glycylsarcosine: in situ single-pass perfusion studies in wild-type and Pept1 knockout mice. Drug Metab Dispos. 2010;38:1740–6. doi: 10.1124/dmd.110.034025. [DOI] [PMC free article] [PubMed] [Google Scholar]
- 8.Shen H, Smith DE, Yang T, Huang YG, Schnermann JB, Brosius FC. Localization of PEPT1 and PEPT2 proton-coupled oligopeptide transporter mRNA and protein in rat kidney. Am J Physiol. 1999;276:F658–65. doi: 10.1152/ajprenal.1999.276.5.F658. [DOI] [PubMed] [Google Scholar]
- 9.Yamashita T, Shimada S, Guo W, Sato K, Kohmura E, Hayakawa T, et al. Cloning and functional expression of a brain peptide/histidine transporter. J Biol Chem. 1997;272:10205–11. doi: 10.1074/jbc.272.15.10205. [DOI] [PubMed] [Google Scholar]
- 10.Sakata K, Yamashita T, Maeda M, Moriyama Y, Shimada S, Tohyama M. Cloning of a lymphatic peptide/histidine transporter. Biochem J. 2001;356:53–60. doi: 10.1042/0264-6021:3560053. [DOI] [PMC free article] [PubMed] [Google Scholar]
- 11.Bhardwaj RK, Herrera-Ruiz D, Eltoukhy N, Saad M, Knipp GT. The functional evaluation of human peptide/histidine transporter 1 (hPHT1) in transiently transfected COS-7 cells. Eur J Pharm Sci. 2006;27:533–42. doi: 10.1016/j.ejps.2005.09.014. [DOI] [PubMed] [Google Scholar]
- 12.Herrera-Ruiz D, Wang Q, Gudmundsson OS, Cook TJ, Smith RL, Faria TN, et al. Spatial expression patterns of peptide transporters in the human and rat gastrointestinal tracts, Caco-2 in vitro cell culture model, and multiple human tissues. AAPS PharmSci. 2001;3:E9. doi: 10.1208/ps030109. [DOI] [PMC free article] [PubMed] [Google Scholar]
- 13.Vavricka SR, Musch MW, Chang JE, Nakagawa Y, Phanvijhitsiri K, Waypa TS, et al. hPepT1 transports muramyl dipeptide, activating NF-kappaB and stimulating IL-8 secretion in human colonic Caco2/bbe cells. Gastroenterology. 2004;127:1401–9. doi: 10.1053/j.gastro.2004.07.024. [DOI] [PubMed] [Google Scholar]
- 14.Dalmasso G, Nguyen HT, Charrier-Hisamuddin L, Yan Y, Laroui H, Demoulin B, et al. PepT1 mediates transport of the proinflammatory bacterial tripeptide L-Ala-{gamma}-D-Glu-meso-DAP in intestinal epithelial cells. Am J Physiol Gastrointest Liver Physiol. 2010;299:G687–96. doi: 10.1152/ajpgi.00527.2009. [DOI] [PMC free article] [PubMed] [Google Scholar]
- 15.Merlin D, Si-Tahar M, Sitaraman SV, Eastburn K, Williams I, Liu X, et al. Colonic epithelial hPepT1 expression occurs in inflammatory bowel disease: transport of bacterial peptides influences expression of MHC class 1 molecules. Gastroenterology. 2001;120:1666–79. doi: 10.1053/gast.2001.24845. [DOI] [PubMed] [Google Scholar]
- 16.Ayyadurai S, Charania MA, Xiao B, Viennois E, Merlin D. PepT1 expressed in immune cells has an important role in promoting the immune response during experimentally induced colitis. Lab Invest. 2013;93:888–99. doi: 10.1038/labinvest.2013.77. [DOI] [PubMed] [Google Scholar]
- 17.Charrier L, Merlin D. The oligopeptide transporter hPepT1: gateway to the innate immune response. Lab Invest. 2006;86:538–46. doi: 10.1038/labinvest.3700423. [DOI] [PubMed] [Google Scholar]
- 18.Wuensch T, Schulz S, Ullrich S, Lill N, Stelzl T, Rubio-Aliaga I, et al. The peptide transporter PEPT1 is expressed in distal colon in rodents and humans and contributes to water absorption. Am J Physiol Gastrointest Liver Physiol. 2013;305:G66–73. doi: 10.1152/ajpgi.00491.2012. [DOI] [PubMed] [Google Scholar]
- 19.Wuensch T, Ullrich S, Schulz S, Chamaillard M, Schaltenberg N, Rath E, et al. Colonic expression of the peptide transporter PEPT1 is downregulated during intestinal inflammation and is not required for NOD2-dependent immune activation. Inflamm Bowel Dis. 2014;20:671–84. doi: 10.1097/01.MIB.0000443336.71488.08. [DOI] [PubMed] [Google Scholar]
- 20.Takeuchi F, Ochiai Y, Serizawa M, Yanai K, Kuzuya N, Kajio H, et al. Search for type 2 diabetes susceptibility genes on chromosomes 1q, 3q and 12q. Journal of Human Genetics. 2008;53:314–24. doi: 10.1007/s10038-008-0254-6. [DOI] [PubMed] [Google Scholar]
- 21.Lee J, Tattoli I, Wojtal KA, Vavricka SR, Philpott DJ, Girardin SE. pH-dependent Internalization of Muramyl Peptides from Early Endosomes Enables Nod1 and Nod2 Signaling. Journal of Biological Chemistry. 2009;284:23818–29. doi: 10.1074/jbc.M109.033670. [DOI] [PMC free article] [PubMed] [Google Scholar]
- 22.Zuo XB, Sheng YJ, Hu SJ, Gao JP, Li Y, Tang HY, et al. Variants in TNFSF4, TNFAIP3, TNIP1, BLK, SLC15A4 and UBE2L3 interact to confer risk of systemic lupus erythematosus in Chinese population. Rheumatol Int. 2014;34:459–64. doi: 10.1007/s00296-013-2864-3. [DOI] [PubMed] [Google Scholar]
- 23.Sasawatari S, Okamura T, Kasumi E, Tanaka-Furuyama K, Yanobu-Takanashi R, Shirasawa S, et al. The solute carrier family 15A4 regulates TLR9 and NOD1 functions in the innate immune system and promotes colitis in mice. Gastroenterology. 2011;140:1513–25. doi: 10.1053/j.gastro.2011.01.041. [DOI] [PubMed] [Google Scholar]
- 24.Wang Y, Sun D, Song F, Hu Y, Smith DE, Jiang H. Expression and regulation of the proton-coupled oligopeptide transporter PhT2 by LPS in macrophages and mouse spleen. Mol Pharm. 2014;11:1880–8. doi: 10.1021/mp500014r. [DOI] [PMC free article] [PubMed] [Google Scholar]
- 25.Nakamura N, Lill JR, Phung Q, Jiang Z, Bakalarski C, de Maziere A, et al. Endosomes are specialized platforms for bacterial sensing and NOD2 signalling. Nature. 2014;509:240–4. doi: 10.1038/nature13133. [DOI] [PubMed] [Google Scholar]
- 26.Sun D, Wang Y, Tan F, Fang D, Hu Y, Smith DE, et al. Functional and molecular expression of the proton-coupled oligopeptide transporters in spleen and macrophages from mouse and human. Mol Pharm. 2013;10:1409–16. doi: 10.1021/mp300700p. [DOI] [PMC free article] [PubMed] [Google Scholar]
- 27.Hu Y, Xie Y, Keep RF, Smith DE. Divergent developmental expression and function of the proton-coupled oligopeptide transporters PepT2 and PhT1 in regional brain slices of mouse and rat. J Neurochem. 2014;129:955–65. doi: 10.1111/jnc.12687. [DOI] [PMC free article] [PubMed] [Google Scholar]
- 28.Weigmann B, Tubbe I, Seidel D, Nicolaev A, Becker C, Neurath MF. Isolation and subsequent analysis of murine lamina propria mononuclear cells from colonic tissue. Nat Protoc. 2007;2:2307–11. doi: 10.1038/nprot.2007.315. [DOI] [PubMed] [Google Scholar]
- 29.Franchi L, Kamada N, Nakamura Y, Burberry A, Kuffa P, Suzuki S, et al. NLRC4-driven production of IL-1beta discriminates between pathogenic and commensal bacteria and promotes host intestinal defense. Nat Immunol. 2012;13:449–56. doi: 10.1038/ni.2263. [DOI] [PMC free article] [PubMed] [Google Scholar]
- 30.Dalmasso G, Charrier-Hisamuddin L, Nguyen HT, Yan Y, Sitaraman S, Merlin D. PepT1-mediated tripeptide KPV uptake reduces intestinal inflammation. Gastroenterology. 2008;134:166–78. doi: 10.1053/j.gastro.2007.10.026. [DOI] [PMC free article] [PubMed] [Google Scholar]
- 31.Chassaing B, Aitken JD, Malleshappa M, Vijay-Kumar M. Dextran Sulfate Sodium (DSS)-Induced Colitis in Mice. Curr Protoc Immunol. 2014;104:15 25 1–15 25 14. doi: 10.1002/0471142735.im1525s104. [DOI] [PMC free article] [PubMed] [Google Scholar]
- 32.Dalmasso G, Nguyen HT, Ingersoll SA, Ayyadurai S, Laroui H, Charania MA, et al. The PepT1-NOD2 signaling pathway aggravates induced colitis in mice. Gastroenterology. 2011;141:1334–45. doi: 10.1053/j.gastro.2011.06.080. [DOI] [PMC free article] [PubMed] [Google Scholar]
- 33.Moreau A, Le Vee M, Jouan E, Parmentier Y, Fardel O. Drug transporter expression in human macrophages. Fundam Clin Pharmacol. 2011;25:743–52. doi: 10.1111/j.1472-8206.2010.00913.x. [DOI] [PubMed] [Google Scholar]
- 34.Bonham KS, Kagan JC. Endosomes as platforms for NOD-like receptor signaling. Cell Host Microbe. 2014;15:523–5. doi: 10.1016/j.chom.2014.05.001. [DOI] [PMC free article] [PubMed] [Google Scholar]
- 35.Moreira LO, Zamboni DS. NOD1 and NOD2 Signaling in Infection and Inflammation. Front Immunol. 2012;3:328. doi: 10.3389/fimmu.2012.00328. [DOI] [PMC free article] [PubMed] [Google Scholar]
- 36.Caruso R, Warner N, Inohara N, Nunez G. NOD1 and NOD2: signaling, host defense, and inflammatory disease. Immunity. 2014;41:898–908. doi: 10.1016/j.immuni.2014.12.010. [DOI] [PMC free article] [PubMed] [Google Scholar]


