Abstract
In this work, we propose an ultrasound-guided remote measurement technique, utilizing an acoustic radiation force (ARF) beam as our excitation source and a receiving hydrophone, to noninvasively assess a bone’s mechanical properties. Features, such as velocity, were extracted from the received acoustic pressure from the bone surface. The typical velocity of an intact bone (3540 m/s) is higher in comparison to a demineralized bone (2231 m/s). According to the receiver operating characteristic (ROC) curve, the optimal velocity cut-off value of ≥ 3096 m/s yields 80% sensitivity and 82.61% specificity between intact and demineralized bone. Applying a support vector machine (SVM), the hours of bone demineralization are successfully classified with maximum accuracy > 80% using 18% training data. The results demonstrate the potential application of our proposed technique and machine learning for monitoring bone mechanical properties.
Keywords: Bone, Demineralization, Support vector machines, Acoustic radiation force, Quantitative Ultrasound
Introduction
Noninvasive techniques such as vibration analysis and quantitative ultrasound (QUS) have been used to assess long bone mechanical properties. Vibration analysis utilizes an impact hammer to generate vibrational waves and measure the resonant frequencies to assess the mechanical properties of long bones (Sonstegard and Matthews 1976) (Jurist 1970, Steele, et al. 1988, Van der Perre, et al. 1983). In QUS analysis, guided waves from axial transmission measurement along the bone surface has been used to determine the material properties of long bones (Gerlanc, et al. 1975, Siegel, et al. 1958) (Bossy, et al. 2004, Lee and Yoon 2004, Lowet and Van der Perre 1996, Moilanen 2008, Mole and Ganesan 2010, Rose 2004, Ta, et al. 2009, Vavva, et al. 2008, Viktorov 1970). Recent progress in QUS, has focused on the extraction of the dispersion curves and to exploit multimodal waveguide of long bones to extract cortical thickness and stiffness (Xu, et al. 2016, Vallet, et al. 2016). However, the clinical utility of both vibrational analysis (Cornelissen, et al. 1986, Saha and Lakes 1977, Van der Perre, et al. 1983, Ziegert and Lewis 1979) and QUS (Bossy, et al. 2004, Lee and Yoon 2004, Lowet and Van der Perre 1996, Moilanen 2008, Moilanen, et al. 2006, Vavva, et al. 2008) has been challenging due to the impact of soft-tissue. The bone and overlaying soft-tissue layer guide wave modes overlap in time and frequency (Lee and Yoon 2004, Moilanen 2008). In a vibrational analysis, considerable differences in magnitude and temporal measurements occur when performed on the skin and directly on the bone (Ziegert and Lewis 1979). Bochud et al. (Bochud, et al. 2017) summarized the effects of overlying soft-tissue on QUS and demonstrated reliable bone strength estimates from calibrated bone phantoms using an inversion scheme based on the free-plate model, despite the presence of soft-tissue. Thus, this study represents a step forward in quantifying the overlaying soft-tissue effects on QUS assessment of bone tissue.
In 2006, Azra Alizad, et al. (Alizad et al. 2006) utilized acoustic radiation force excitation to study the change in resonant frequencies of a bone due to change in its physical properties due to a fracture. The method offered the advantage of applying a force remotely and directly to the bone under test, thus avoiding interference of overlaying muscle or other tissues on force distribution. Similarly, Callé, et al. (Callé et al. 2003) utilized acoustic radiation force to generate vibrations along the bone tissue, however in their study the acoustic pressure radiating from the bone tissue was captured by a hydrophone. The captured signal was then used to produce an image of the bone tissue internal structure.
In order to improve the noninvasive assessment of bone mechanical properties, an ultrasound-guided remote measurement technique using acoustic radiation force (ARF) excitation in combination with machine learning is proposed. The ARF excitation exerts a localized transient force noninvasively on the bone surface, inducing vibrational waves along the bone surface. The radiated acoustic pressure from these vibrational waves is obtained for bone demineralization assessment. It should be noted that the acoustic radiation force does not propagate along the bone. The acoustic radiation force acts as a body force onto the bone surface generating the propagation of bending waves along the bone. The bending waves cause a deflection in the plane perpendicular to the bone surface. By coupling our receiver to the bone surface, the radiated pressure from the deflection of the bone is captured. Thereafter, a machine learning classification algorithm based on the support vector machine (SVM) (Vapnik 2000) is utilized for classifying the levels of bone demineralization.
In this paper, features are extracted from the acoustic responses from the ultrasound-stimulated remote measurements. A SVM model is trained using the extracted features. Thereafter, the trained SVM model is then used to classify the levels of demineralization of the bones.
Context
Relating bone demineralization and bone mechanics
In order to demonstrate that bone mechanics directly reflect bone demineralization, ex vivo experiments comparing bone mineral density (the clinical gold standard for bone quality assessment) and elasticity measurements are conducted. Our goal with this experiment is to provide the pretext, that although bone mineral density (BMD) is a gold standard for clinical bone assessment it is unable to fully explain bone quality and strength. Bone specimens are demineralized to mimic the degradation of the bone mechanical properties. Thereafter, the relationship between the elasticity and bone mineral density (BMD) are examined. The bone demineralization and mechanics of porcine femurs (n=2) and tibia (n=2), obtained from a slaughterhouse, are examined. The ex vivo bone specimens’ BMD were measured using a General Electric Lunar iDXA (GE Healthcare, Madison, WI) dual-energy X-ray absorptiometry (DEXA) densitometer. Thereafter, the BMD and mechanical measurements were conducted in 6 time points. The first test was done on the intact (no demineralization) bone. The subsequent experiments were conducted in incremental demineralization events, where the bones were left in the 10% acid solution for 3, 6, 11, 17, and 23 days, respectively.
The DEXA changes of the porcine femoral bone were observed from the intact (no demineralization) stage (day 0) to the day 23 of demineralization. In parallel, the bone elasticity was measured by a 4-point bending test using a MTS servo hydraulic 858 (MTS Corporation, Minneapolis, MN) and 500N load cell (Interface Inc., Scottsdale, AZ). The samples were tested to 100 N at a rate of 33.33 m/s. The elastic modulus (E) was obtained using the following equation (Reed and Brown 2001):
| (1) |
where m is the slope of the linear regime of the load-deflection curve, I cross-sectional area moment of inertia and l=50 mm is the loading span distance.
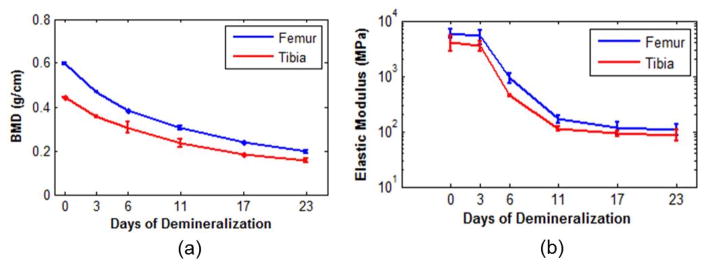
Figure 1 shows the decrease of BMD and elasticity with demineralization. Figure 1a shows that the bone BMD decreases by approximately 33% from the intact state (day 0) to the day 23 of demineralization. Similarly, the elasticity decreases by over 80% from an intact state to the 23rd day of demineralization in Figure 1b. The BMD and elasticity results are plotted on a linear and log scale, respectively; the logscale plot was done in order to capture the rapid decline of the porcine elasticity as a function of demineralization. This decrease in elasticity is over one order of magnitude, whereas the decrease in BMD did not reach one order of magnitude. These results demonstrate that monitoring elasticity may be used as a surrogate for monitoring bone BMD, with the added advantage of higher sensitivity.
Figure 1.
Porcine femur and tibia bone (a) BMD and (b) elastic modulus results. The error bars represent ±1 standard deviation of the measurements in each bone group.
We propose a technique to noninvasively monitor parameters related to bone elasticity. Our technique is based on remote measurements along the bone surface using ARF excitations to induce radiated acoustic pressure to be captured. By extracting features from the radiated acoustic pressure that correlate with elasticity, one can in turn monitor bone mechanical properties.
Working theory
Radiated acoustic pressure from a Bernoulli–Euler beam
In this section, we consider modeling a long bone as an Euler-Bernoulli beam. The Euler – Bernoulli beam theory provides a means for obtaining the deflection of a beam and has been extensively applied to the estimation of stresses in long bones (Lowet et al. 1993, Collier et al. 1982, Khalil et al. 1981, Stock et al. 2007, Roberts et al. 1996, Thomsen et al. 1990). Following, Tang et al. (Tang, et al. 2007) we model the sound radiated from an Euler-Bernoulli beam under ARF excitation using a Green’s function formulation.
The beam is assumed to be immersed in a host-fluid with an ARF excitation F occurring at the location of x1 = xo acting on the beam surface. The beam transverse deflection U (x1 ) and host-fluid pressure P (x1 , x2) are governed by the respective equations of motion
| (2a) |
| (2b) |
where the host-fluid wavenumber vector kf = kx2 + kx1 is composed of axial (kx1) and vertical (kx2) components, where the wavenumber has a fluid velocity of cf . Equation (2b) has a bending wavenumber of for the beam, where is the bending wave velocity (cs is dependent on frequency), E is the Young’s modulus, A the cross-sectional area of the beam, I is the cross-sectional area moment of inertial and ρs is the density of the beam material. Since Eq. (2b) is a fourth-order differential equation, the deflection U (x1 ) has four solutions for wavenumber k :
is for the waves propagating in the positive direction.
is for the waves propagating in the negative direction.
is for the evanescent waves going in the positive direction.
is for the evanescent waves going in the negative direction.
If ks is real, then the wave propagates without attenuation. If ks is purely imaginary and not equal to zero (Im {ks} ≠ 0 ), then the wave is evanescent with an amplitude exponentially attenuating by eIm {ks}x1. Therefore, evanescent waves do not propagate. Assuming a simply supported beam, the modal solution for the deflection U ( x1 ) yields,
| (3) |
where kl = lπ/L is the modal wavenumber, k = ω/cs and xo is the ARF excitation position. The integer l of the modal wavenumber denotes the beam’s mode of vibration. Even and odd numbers of l are the antisymmetric and symmetric modes of vibration, respectively. Due to its out-of-phase vibration, causing less volume of fluid to be displaced by the beam, the antisymmetric modes are a less effective sound radiator compared to the in-phase vibrations from the symmetric modes. Therefore, the beam’s symmetric modes of vibration are usually the main contributors to the radiated pressure in the fluid.
The following boundary conditions at the interface between the fluid and beam must be satisfied:
- Continuity of the displacement field at the beam and fluid interface,
(4a) -
Continuity of the particle speed at the beam and fluid interface,
(4b) where ρf is the density of the fluid and Uf is the transverse displacement field in the fluid. In boundary condition (ii), the fluid particle speed is expressed in terms of pressure and the beam particle speed in terms of displacement.
A general solution for the pressure field of a vibrating structure can be derived in the form of an integral equation. This yields the Kirchhoff-Helmholtz integral equation for a general formulation of the pressure field,
| (5) |
where the pressure is evaluated over a 2L finite distance. The free space Green function G is well-known as
| (6) |
where denotes the 0th order Hankel function of the first kind. Satisfying the boundary conditions in Eqs. (4) at the interface x2 = 0+ between the hos-fluid and beam, the axial wavenumber is equal to the bending wavenumber kx1 = ks, therefore the vertical component of the fluid wavenumber can be expressed in terms of the bending wavenumber. For wavenumber kx2, the acoustic pressure P has two solutions: (1) If kx2 is real, a wave from the beam interface propagates into the fluid; (2) If kx2 is imaginary and (Im {kx2} ≠ 0 ), then the wave is evanescent and not propagating with its amplitude attenuating by eIm {kx2}x2.
Simulation analysis
Consider the simply supported Euler-Bernoulli beam immersed in fluid is excited by an F = 0.01N ARF beam. The host-fluid density ρf = 1.22 kg/ m3 , and cf = 344 m/s sound speed. The beam has a ρA = 15 kg/m product density-area and I= 44 mm 4 cross-sectional area moment of inertia. The radiated pressure from a beam is simulated for the elastic moduli of E= 5GPa and E=100 MPa, which have similar respective elastic moduli’s with that of an intact and demineralized bone as observed in Fig. 1b. The time-frequency responses of the radiated acoustic pressure P are obtained at x = (0, 0.001L ) observation point. The temporal response of the beam for both elastic moduli is shown in Figure 2.
Figure 2.
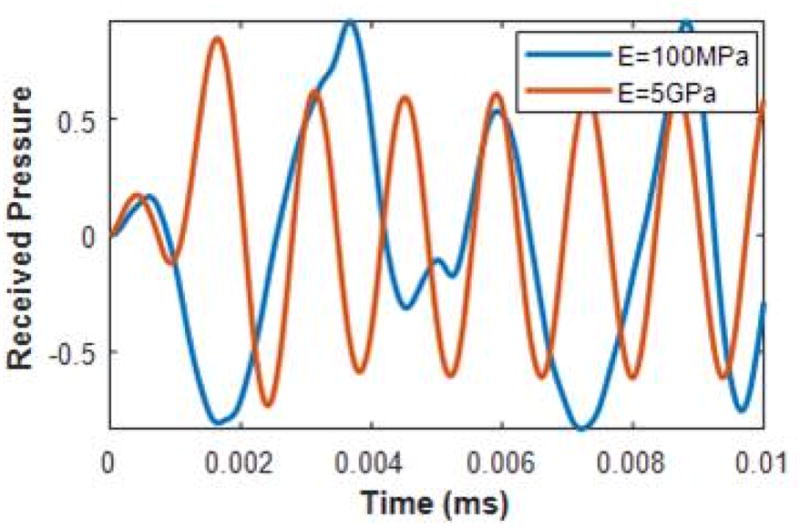
Temporal response of radiated pressure from Euler-Bernoulli beams with E= 5 GPa and E= 100 MPa elastic moduli.
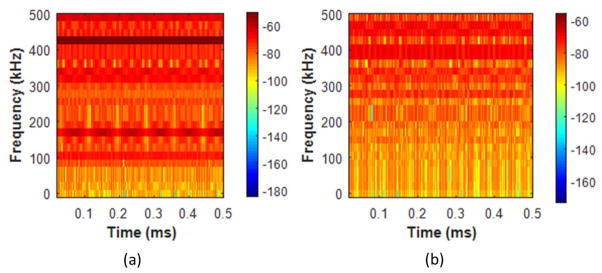
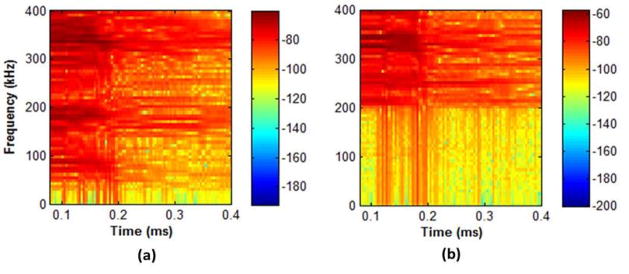
Figure 3 shows the time-frequency responses of the bandpass filtered (50–500 kHz) radiated acoustic pressure signal using an 8-point Butterworth filter. Time-frequency analysis utilizing the spectrogram has been conducted in noninvasive evaluation of long bones (Protopappas, et al. 2007). Xu et al. (Xu, et al. 2010) used time frequency analysis to separate individual modes from multimodal guide wave signals in long bones. Figure 3 demonstrates a frequency shift decreasing with the beam’s elastic modulus. The average weighted-mean frequency of the spectrograms shifted with decreasing elastic modulus from 434 kHz (E= 5 GPa) to 688 kHz (E= 100 MPa). The magnitudes of the lower frequencies (approximately below 200 kHz) become attenuated with decreasing elastic modulus. A reduction in the beam’s Young’s modulus increases the value of the bending wavenumber ks, allowing for to be larger than , whereby the vertical wavenumber kx2 becomes an imaginary value and the wave from the beam interface is evanescent. Therefore, little to no acoustic pressure radiates into the beam’s host-fluid at these lower frequencies (approximately below 200 kHz).
Figure 3.
Euler-Bernoulli beam radiated acoustic pressure spectrogram for (a) E=5GPa and (b) E= 100 MPa
Materials and Methods
Ultrasound-stimulated remote measurements
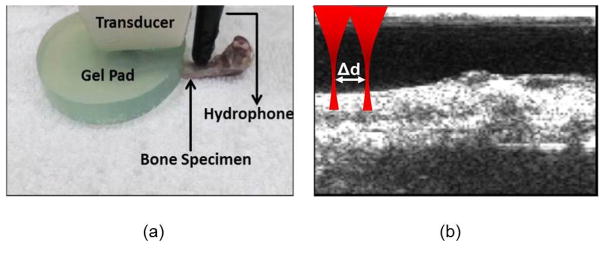
In total, n=25 rabbit femoral bones (farm raised, unknown gender, and non-New Zealand white rabbits) were obtained from a slaughterhouse. The typical lengths of the rabbit femoral bones were 8 cm with I=32.9 mm4 cross-sectional area moment of inertia. The overlaying soft tissue was removed. The elastic modulus of a selected number of intact ex vivo rabbit femoral bone specimen (n=12) were measured by a 4-point bending test using a MTS servo hydraulic 858 (MTS Corporation, Minneapolis, MN) with TestStar II control software and an SMT2-2000N load cell (Interface Inc., Scottsdale, AZ). A preload was applied to eliminate the error induced by uneven surface conditions. The samples were tested to 50 N at a rate of 33.33 m/s. Load and displacement data were collected every 5 N. The elastic modulus (E) of the bone was obtained using I=32.9 mm4 for the moment of inertia and l=10 mm for the loading span distance. Thereafter, the specimens were demineralized. Placing the specimens in containers with an excess amount of 20% acetic acid, the bones were left in the acidic solution for 24, 48 and 72 hours. The specimens were then placed in a 0.9% sodium chloride buffer solution and rinsed in sterile water. The elastic modulus of a selected number of demineralized bones was measured by a 4-point bending test: 24 hours (n=13), 48 hours (n=5) and 72 hours (n=5). It should be noted, that not the entire rabbit femoral specimen followed the progressive demineralization process from intact, 24, 48 and 72 hours of demineralization. The bones were categorized as n=23 intact bones and demineralized bones (n=25): n=13 (24 h), n=7 (48 h) and n=5 (72 h). Remote acoustic measurements were conducted on the bone samples using a fully programmable US platform (Verasonics V-1, Verasonics, Kirkland, WA USA) equipped with a 5MHz linear array transducer to guide and focus the ARF beam. The US-guided ARF beam consists of a 5-cycle and 50μs toneburst focused on the bone surface. The radiated acoustic pressure is obtained using the TC4034-1 omnidirectional hydrophone (Teledyne RESON, Slangerup, Denmark, frequency range: 1 Hz to 470 kHz +3/ 10 dB; receiving sensitivity 218 ± 3 dB (at 250 Hz)). The hydrophone is placed along the edge of the transducer. The hydrophone was coupled to the bone surface using acoustic gel. It should be noted that the experiments were not conducted in water. In Figure 4, a 0.5 cm non-attenuating gel pad was placed between the transducer and bone surface to obtain an F-number >1 for an ARF beam focused on the bone surface.
Figure 4.
Experimental setup: Left panel - positioning of the transducer and the hydrophone on the bone. Gel pad is used to provide appropriate distance to focus the beam on the bone surface. Right panel – B-mode image showing the bone surface. The ultrasound beam in red is focused on bone surface. In another experiment (see section on SVM and labels), the beam is shifted by Δd.
Principles of support vector machine
Cortes and Vapnik (Cortes and Vapnik 1995) first proposed the SVM as a binary decision method which constructs the optimal hyperplane for a high dimensional feature space (Fayyad 1996). Training data , where zi is the feature vector belonging to the class label yi ∈ {−1,1}, is used to construct the optimal hyperplane by dividing the features based on the class labels. To this end, the optimal hyperplane is determined by minimizing the function,
| (5) |
with the following constraints to Eq. (5),
| (6) |
where w is the normal vector to the hyperplane, ξ ≥ 0 is the slack variable and C is the penalty factor. The solution to the optimization problem of Eq. (5) with constraints of Eq. (6) is given by the Lagrangian Φ ( w , b, α, ξ, β) , where α, β are the Lagrange multipliers (Minoux 1986). The Lagrangian has to be minimized with respect to w , b , x and maximized with respect to the Lagrangian multipliers. The Lagrangian duality satisfies both conditions by transforming Eq. (6) into a dual optimization problem
| (7) |
with the following constraints,
| (8a) |
| (8b) |
where α are the support vectors, the inner product ψT (xi)ψ(xj ) = K (xi , xj) is the kernel function. Solving Eq. (7) with constraints Eq. (8) the optimal hyperplane in the feature space is given by,
| (9) |
where sgn is a sign function.
SVM features and labels
Several features are extracted from the acoustic signal for the classification of bone demineralization. The following features are extracted:
- Velocity: The wave velocity in the bone is obtained by sequential remote measurements at ARF foci distances d0 and d1 from the hydrophone. Figure 4b shows the excitations at the two foci locations separated by Δd = d1 − d0 distance. The distance between the ARF foci (Δd ) were Δd= 1 mm and 1.2 mm. The time lag τmax at the peak of the cross-correlation function between the measured signals is used to estimate the velocity feature. A threshold of > 0.9 for the peak cross-correlation coefficient is established for the τmax time lag. The velocity is calculated as,
(10) -
Root Mean Square (RMS): The RMS value for the measured signal at a distance d0 is obtained. The RMS is expressed as,
(11) where ΔT is a time constant and x (t ) is the acoustic signal.
-
Ratio of Power (ROP): The power distribution of an acoustic response in the frequency domain is determined using the ratio of the lower frequency band to total frequency band (Martins, et al. 2014). The ROP value is given by:
(12) where n1 to n2 define the range of the lower frequency band, n1 to No kHz define the total frequency band, and Xk is the k-th discrete Fourier transform of the acoustic signal.
-
Average Weighted-Mean Frequency (AMF): The spectrogram weighted-mean frequency of the acoustic signal at a time t is given by,
(13) where S is the spectrogram and ω is the angular frequency. Averaging 〈ω〉 along the spectrogram time axis yields the AMF feature.
The RMS, ROP, and AMF features are respectively determined from the temporal response, spectral response and spectrogram analysis of the radiated pressure p(t). These features, as defined above, are directly related to the attenuation of the radiated pressure. Therefore, a decrease of the elastic modulus, as observed in the Euler-Bernoulli beam simulation in Figs. 2 and 3, would be reflected by these features. Each feature in Eqs. (11–13) is associated with its class label e.g. intact, 24, 48 and 72 hours of bone demineralization.
SVM training and classification
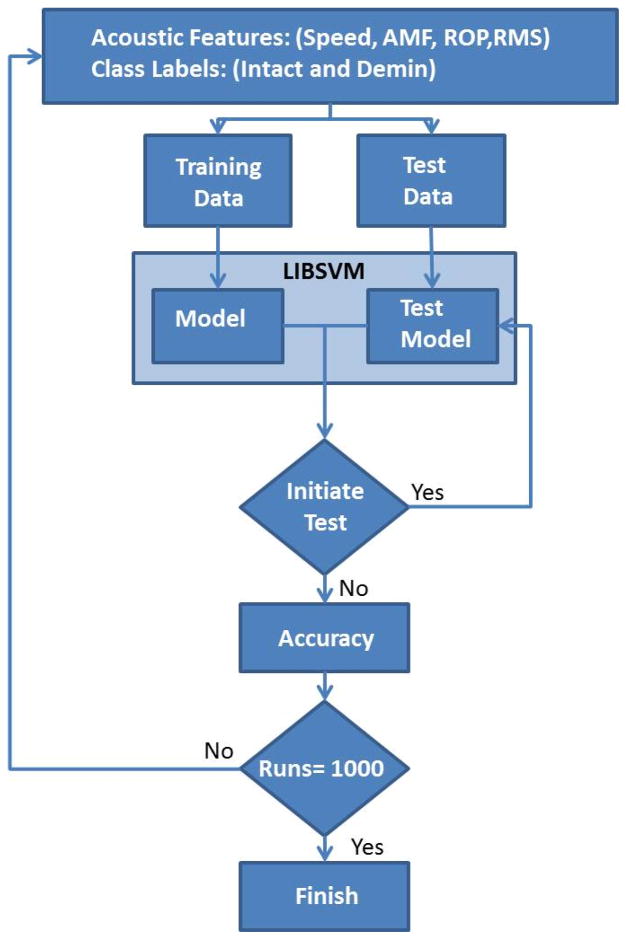
A dataset of M=48 total intact (n=23) and demineralized (n=25) bone features are used as inputs into the SVM. Randomly selected subsets of N intact and N demineralized bones are utilized for training. Meanwhile, an M - 2N dataset is used for testing. LIBSVM, a widely used SVM tool (Chang and Lin 2011), generates a decision model from the training dataset. Thereafter, the LIBSVM decision model is used to classify the test dataset. This process is repeated 1000 times for maximum accuracy. A flowchart of the SVM classification is detailed in Figure 5.
Figure 5.
SVM flowchart.
Statistical analysis
In order to assess the performance of the feature which best delineates demineralization, the receiver operating characteristic (ROC) analysis was performed. An optimal cut-off value, which maximizes the sensitivity and specificity of the ROC curve, was established. The one-way ANOVA was utilized to test for significant differences in the acoustic features among the demineralization states. The significant test was followed up with the Tukey’s HSD post-hoc tests. The p values of less than 0.05 were considered to indicate statistical significance. Statistical analyses were performed using MATLAB software.
Results
Remote measurements
Table 1 summarizes the median and interquartile range (IQR, 25th–75th percentile) elastic moduli of the intact and demineralized bones. The results demonstrate a p< 0.0001 significant difference between the bone states. The median values of the elastic moduli do not necessarily decay monotonically. The variations in the median elastic modulus values between the 24 and 48 hour demineralized bones are most likely due to residual mineral left in the bone matrix (Summitt and Reisinger 2003) from the partial demineralization process. This occurs because the demineralization process is not uniform along the bone. With full demineralization, such as the 72 hour demineralization, the mineral content of the bone varies minimally therefore the elastic moduli would be similar. This is demonstrated by the lower interquartile range (0.05 GPa) of the 72 hour demineralized bones in comparison to the other levels of demineralization.
Table 1.
Summary of the median and interquartile range (IQR, 25th-75th percentile) elastic moduli of the intact and demineralized bones.
| Time of Demineralization (hrs) | # of bone samples | Median, GPa | IQR, GPa |
|---|---|---|---|
| 0 (Intact) | 12 | 5.19 | 0.85 |
| 24 | 13 | 0.75 | 1.33 |
| 48 | 5 | 1.54 | 0.47 |
| 72 | 5 | 0.02 | 0.05 |
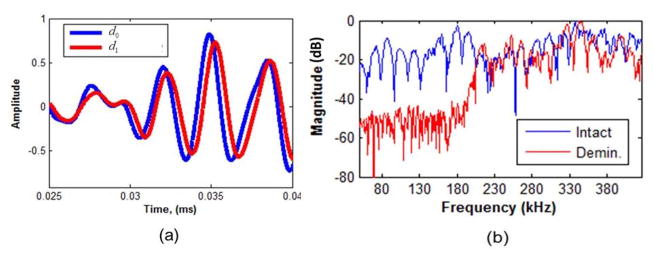
In Figure 6a, the measured acoustic signal at distances d0 and d1 for an intact bone is presented. One can clearly observe that the signal shape obtained at d1 is approximately a time delayed version of the measured signal at d0 distance. The received pressure signals were bandpass filtered from 50 to 500 kHz, thereafter using Eq. (10) the velocity is estimated. The frequency responses (normalized with the maximum magnitude) of an intact and 72 hour demineralized bone measured at d0 distance, are shown in Figure 6b. For frequencies below 200 kHz, the magnitude of the demineralized bone is highly attenuated. This was also observed in our simulation, and an explanation of this effect was provided. Therefore, for the ROP feature the 50–150 kHz band will be used for the n1 − n2 low frequency range. The 50–400 kHz band is used for the n1 − N0 total frequency band. Also, the RMS feature is obtained for the bandpass filtered acoustic signal in the 50–100 kHz frequency band.
Figure 6.
(a) Intact bone acoustic responses. (b) Frequency responses of an intact and 72
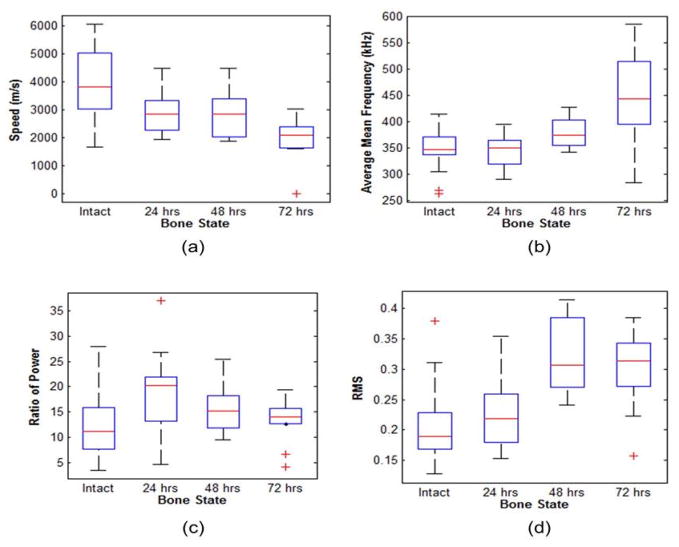
The spectrograms of an intact and 72 hour demineralized bone at d0 are shown in Figures 7. The spectrograms are constructed with a 4096 point rectangular time window and 4000 overlapping points. Figure 7b shows that the lower frequencies (< 200 Hz) are highly attenuated in comparison to the intact bone spectrogram in Figure 7a. This results in an AMF shift from 409 kHz (intact bone) to 426 kHz (72 hour demineralized bone). In Figure 8, comparative boxplots of the acoustic features for the intact and demineralized bones are constructed. Figure 8a shows that the velocity features decrease with hours of bone demineralization. The median velocity between intact (3540 m/s) and demineralized (2231 m/s) bones show a significant reduction in velocity. In Figure 8(b–d), no significant difference was obtained for the RMS, ROP and AMF features. The ANOVA and post-hoc test results are summarized in Table 2. The results demonstrate a significant difference between intact and 72 hour demineralized bones for velocity, RMS, and ROP. Other notable results from Table 2, 48 hour and 72 hour demineralized bones had a significant difference in AMF and ROP.
Figure 7.
Spectrogram of an (a) intact and (b) 72 hour demineralized bone at distance.
Figure 8.
Boxplot comparisons of (a) speed, (b) average mean frequency, (c) ratio of power, and (d) RMS as a function of hours of demineralization. The central box represents values from the lower to upper quartile (25th – 75thpercentile). The line through each box represents the median. Error bars show minimum and maximum non-extreme values. ‘+’, are extreme values.
Table 2.
One way ANOVA of remote acoustic measurements. Note: (*) denotes the mean difference is significant at the 0.05 level.
| (I) Bo ne Sta te |
(J) Bo ne Sta te |
Velocty | RMS | AMF | ROP | ||||||||
|---|---|---|---|---|---|---|---|---|---|---|---|---|---|
| Mean Differ ence (I-J) |
95% Confidenc e Interval |
Mean Differ ence (I-J) |
95% Confidenc e Interval |
Mean Differ ence (I-J) |
95% Confidenc e Interval |
Mean Differ ence (I-J) |
95% Confidenc e Interval |
||||||
| Lo wer Bou nd |
Upp er Bou nd |
Lo wer Bou nd |
Upper Bound | Lo wer Bou nd |
Upp er Bou nd |
Lo wer Bou nd |
Upp er Bou nd |
||||||
| Int act | 24 hrs | 1311 | −12.1 | 2634 | −0.01 | −0.09 | 0.06 | 56.2* | 13. 1 | 99. 2 | −6.22 | −20.9 | 8.47 |
| 48 hrs | 1244 | −20.8 | 2510 | −0.10 | −0.19 | −0.01 | 45.8 | −1.67 | 93. 2 | −3.4 | −21.9 | 15. 1 | |
| 72 hrs | 1988* | 804 | 3171 | −0.08* | −0.16 | 0.0006 | −2.3 | −45.3 | 40. 7 | −290* | −307 | −274 | |
| 24 hrs | Int act | 1311 | −12.1 | 2634 | −0.01 | −0.09 | 0.06 | 56.2* | 13. 1 | 99. 2 | −6.22 | −20.9 | 8.47 |
| 48 hrs | −66.6 | −1463 | 1330 | −0.08 | −0.176 | 0.004 | −10.4 | −57.8 | 37. 07 | 2.82* | −17.7 | 23. 3 | |
| 72 hrs | 676 | −646 | 2000 | −0.06 | −0.14 | 0.017 | −58.5* | −101 | −15.4 | −284 | −303 | −266 | |
| 48 hrs | Int act | 1244 | −20.8 | 2510 | −0.10 | −0.176 | 0.004 | 45.8 | −1.67 | 93. 2 | −3.4 | −21.9 | 15. 1 |
| 24 hrs | −66.6 | −1463 | 1330 | −0.08 | −0.176 | 0.004 | −10.4 | −57.8 | 37. 07 | 2.82* | −17.7 | 23. 3 | |
| 72 hrs | 743 | −522 | 2008 | 0.02 | −0.069 | 0.11 | −48* | −95.5 | −0.627 | −287* | −309 | −265 | |
| 72 hrs | Int act | 1988* | 804 | 3171 | −0.08* | −0.16 | 0.0006 | −2.3 | −45.3 | 40. 7 | −290* | −307 | −274 |
| 24 hrs | 676 | −646 | 2000 | −0.06 | −0.14 | 0.017 | −58.5* | −101 | −15.4 | 2.82 | −303 | −266 | |
| 48 hrs | 743 | −522 | 2008 | 0.02 | −0.069 | 0.111 | −48* | −95.5 | −0.627 | −287* | −309 | −265 | |
Since velocity is the best feature delineating hours of bone demineralization, a velocity cut-off value between intact and demineralized bone is established. According to the receiver operating curve (ROC) analysis between intact and demineralized bones in Figure 9, the optimal velocity cut-off value ≤ 3019.6 m/s yields 80% sensitivity, 82.6% specificity and 83% positive predictive value (PPV).
Figure 9.
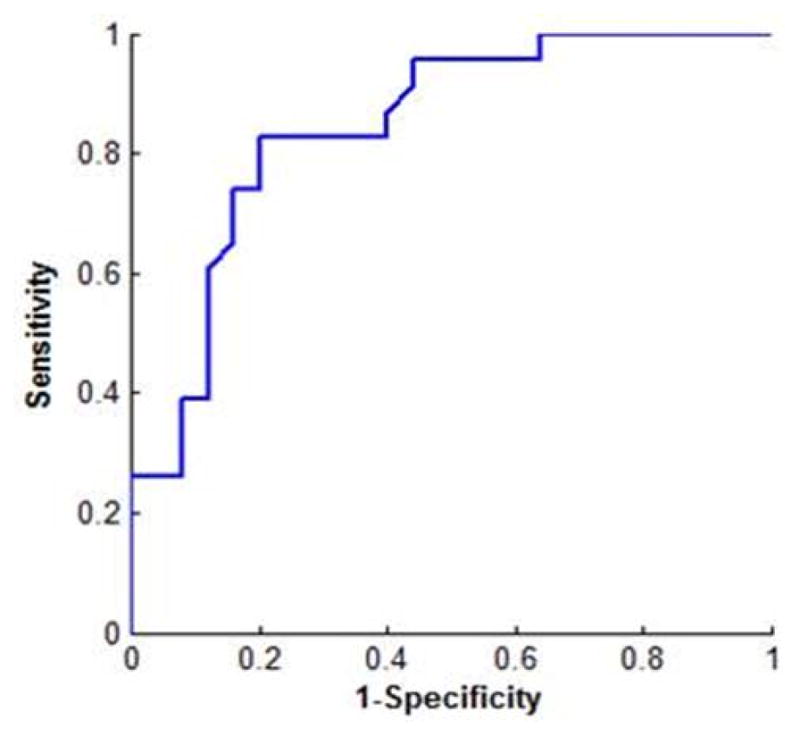
ROC curve of intact and demineralized bones.
SVM classification of bone demineralization
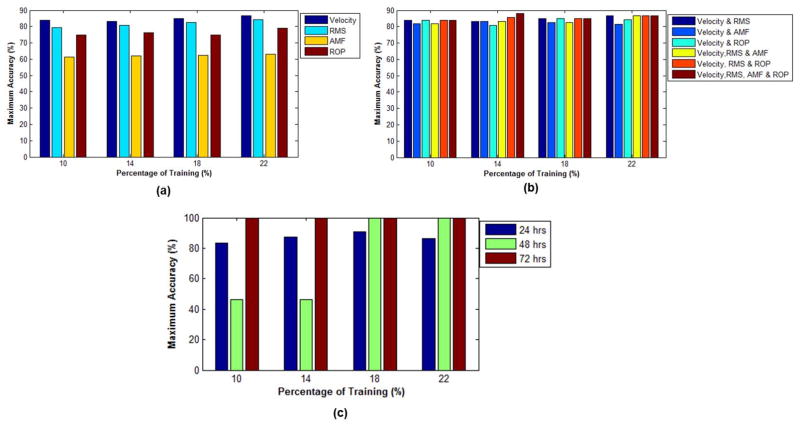
Figure 10(a–b) shows the maximum accuracy (the highest percentage bone condition correctly classified using a specific training and testing dataset) of the LIBSVM classification between intact and demineralized bones for each individual and combination of acoustic features. Figure 10a shows that velocity and RMS are the best acoustic features delineating demineralization, achieving a maximum accuracy > 80% with more than 10% training data. Figure 10b shows that a maximum accuracy > 80% can be achieved using various combinations of features in addition to velocity. The combination of all the features has a maximum accuracy of 88% using 14% training data.
Figure 10.
LIBSVM analysis of (a) individual, (b) combination of acoustic features and (c) LIBSVM analysis of hours of bone demineralization.
In Figure 10c, all the acoustic features are combined to classify between intact and the hours of demineralization (24, 48 and 72 hours). A maximum accuracy of 100% is achieved with 10% training data for classification between intact and 72 hour demineralized bones. In the classification between intact and 48 hour demineralized bones, the maximum accuracy increases with the percentage of training data. The maximum accuracy increased from 50% to 100% with 10% and 18% training data, respectively. The classification between the intact and 24 hour demineralized bones has the lowest maximum accuracy (> 90%). However, a maximum accuracy >80% is achieved for all the percentages of training data.
Discussion
In this study, ultrasound-guided remote measurements in combination with SVM were used to classify the levels of bone demineralization. Acoustic features of the measured signals were obtained from rabbit femurs. Velocity was the dominant acoustic feature delineating with levels of bone demineralization. Previous ultrasound studies (Bossy, et al. 2004, Mehta, et al. 2001, Mehta, et al. 1998, Raum, et al. 2005), have shown velocity to be highly correlated to the mechanical properties of bone tissues. The demineralization process gradually reduces the bone elastic modulus (Burstein, et al. 1975), therefore changing the flexural rigidity (product of the bone elastic modulus and moment of inertia) of the bone (Guo, et al. 1991, Lewandrowski, et al. 1995). Flexural rigidity is directly related to the velocity of the lower frequency waves, as well as the resonant frequency in vibrational analysis (Van der Perre and Lowet 1996). Thus a reduction in flexural rigidity due to demineralization lowers the velocity, which has been observed in our results.
In the ROC analysis, the optimal cut-off velocity value (≤ 3096 m/s) resulted in a low PPV (< 70%) when classifying between intact and level (hours) of demineralized bones. Applying a SVM approach, using all of the acoustic features for training and testing, increased the classification accuracy of differentiating between intact and demineralized bone (> 80%). Classifying intact and the 24 hour demineralization bones is a challenge, with no significant difference between the two bone states.
There are several limitations of this work. Firstly, the bone specimen was assumed to be an isotropic material. Thus, the elastic coefficient is assumed to be uniform in all directions. Second, our receiving hydrophone is omnidirectional, as opposed to a directionally focused transducer. Thus, the received pressure has contributions in all directions. However, since the hydrophone is perpendicular to the bone surface, the displacement in this direction (deflection) will be the main contributor to the received pressure. Third, the changes in velocity with respect to the rabbit femoral bone density were not investigated. Since, velocity is not solely dependent on the elastic modulus but is also related to density. It should be noted however, that in the porcine experiments the elastic modulus decreased at faster rate than the BMD results. Demonstrating that the elastic modulus is the dominate factor reflecting the demineralization effects.
Further investigation, as well as additional data, is required to increase SVM classification for the levels of bone demineralization. Additional acoustic parameters, such as attenuation, can possibly further increase the accuracy of our SVM results. A larger dataset can aid in identifying the levels of bone demineralization.
Acknowledgments
The authors would also like to thank Mohammad Mehrmohammadi from the Department of Biomedical Engineering at Wayne State University, also Randall Kinnick, Leighton Wan, Mathew Cheong, and Larry Berglund, both from Mayo Clinic College of Medicine, for their kind assistance in conducting the experiments.
Footnotes
Publisher's Disclaimer: This is a PDF file of an unedited manuscript that has been accepted for publication. As a service to our customers we are providing this early version of the manuscript. The manuscript will undergo copyediting, typesetting, and review of the resulting proof before it is published in its final citable form. Please note that during the production process errors may be discovered which could affect the content, and all legal disclaimers that apply to the journal pertain.
References
- Alizad A, Walch M, Greenleaf JF, Fatemi M. Vibrational characteristics of bone fracture and fracture repair: application to excised rat femur. Journal of biomechanical engineering. 2006;128(3):300–8. doi: 10.1115/1.2187037. [DOI] [PubMed] [Google Scholar]
- Bochud N, Vallet Q, Minonzio J-G, Laugier P. Predicting bone strength with ultrasonic guided waves. Scientific Reports. 2017;7:43628. doi: 10.1038/srep43628. [DOI] [PMC free article] [PubMed] [Google Scholar]
- Bossy E, Talmant M, Laugier P. Three-dimensional simulations of ultrasonic axial transmission velocity measurement on cortical bone models. The Journal of the Acoustical Society of America. 2004;115:2314–24. doi: 10.1121/1.1689960. [DOI] [PubMed] [Google Scholar]
- Bossy E, Talmant M, Peyrin F, Akrout L, Cloetens P, Laugier P. An In Vitro Study of the Ultrasonic Axial Transmission Technique at the Radius: 1-MHz Velocity Measurements Are Sensitive to Both Mineralization and Intracortical Porosity. Journal of Bone and Mineral Research. 2004;19:1548–56. doi: 10.1359/JBMR.040513. [DOI] [PubMed] [Google Scholar]
- Burstein AH, Zika J, Heiple K, Klein L. Contribution of collagen and mineral to the elastic-plastic properties of bone. The Journal of Bone & Joint Surgery. 1975;57:956–61. [PubMed] [Google Scholar]
- Chang C-C, Lin C-J. LIBSVM: A library for support vector machines. ACM Transactions on Intelligent Systems and Technology (TIST) 2011;2:27. [Google Scholar]
- Collier R, Nadav O, Thomas T. The mechanical resonances of a human tibia: Part I—in vitro. Journal of biomechanics. 1982;15(8):545–53. doi: 10.1016/0021-9290(82)90067-7. [DOI] [PubMed] [Google Scholar]
- Cornelissen P, Cornelissen M, Van der Perre G, Christensen A, Ammitzbøll F, Dyrbye C. Assessment of tibial stiffness by vibration testing in situ – II. Influence of soft tissues, joints and fibula Journal of biomechanics. 1986;19:551–61. doi: 10.1016/0021-9290(86)90128-4. [DOI] [PubMed] [Google Scholar]
- Cortes C, Vapnik V. Support-vector networks. Machine learning. 1995;20:273–97. [Google Scholar]
- Fayyad UM. Data mining and knowledge discovery: Making sense out of data. IEEE Intelligent Systems. 1996:20–25. [Google Scholar]
- Gerlanc M, Haddad D, Hyatt GW, Langloh JT, Hilaire PS. Ultrasonic study of normal and fractured bone. Clinical orthopaedics and related research. 1975;111:175–80. doi: 10.1097/00003086-197509000-00025. [DOI] [PubMed] [Google Scholar]
- Guo MZ, Xia ZS, Lin LB. The mechanical and biological properties of demineralised cortical bone allografts in animals. Journal of Bone & Joint Surgery, British Volume. 1991;73:791–94. doi: 10.1302/0301-620X.73B5.1894668. [DOI] [PubMed] [Google Scholar]
- Jurist JM. In vivo determination of the elastic response of bone. I. Method of ulnar resonant frequency determination. Physics in medicine and biology. 1970;15:417. doi: 10.1088/0031-9155/15/3/002. [DOI] [PubMed] [Google Scholar]
- Khalil T, Viano D, Taber L. Vibrational characteristics of the embalmed human femur. Journal of Sound and Vibration. 1981;75(3):417–36. [Google Scholar]
- Lee K, Yoon SW. Feasibility of bone assessment with leaky Lamb waves in bone phantoms and a bovine tibia. The Journal of the Acoustical Society of America. 2004;115:3210–17. doi: 10.1121/1.1707086. [DOI] [PubMed] [Google Scholar]
- Lewandrowski K-U, Tomford WW, Yeadon A, Deutsch TF, Mankin HJ, Uhthoff HK. Flexural rigidity in partially demineralized diaphyseal bone grafts. Clinical orthopaedics and related research. 1995;317:254–62. [PubMed] [Google Scholar]
- Lowet G, Van Audekercke R, Van der Perre G, Geusens P, Dequeker J, Lammens J. The relation between resonant frequencies and torsional stiffness of long bones in vitro. Validation of a simple beam model. Journal of biomechanics. 1993;26(6):689–96. doi: 10.1016/0021-9290(93)90032-a. [DOI] [PubMed] [Google Scholar]
- Lowet G, Van der Perre G. Ultrasound velocity measurement in long bones: measurement method and simulation of ultrasound wave propagation. Journal of biomechanics. 1996;29:1255–62. doi: 10.1016/0021-9290(96)00054-1. [DOI] [PubMed] [Google Scholar]
- Martins CH, Aguiar PR, Frech A, Bianchi EC. Tool Condition Monitoring of Single-Point Dresser Using Acoustic Emission and Neural Networks Models. Instrumentation and Measurement, IEEE Transactions on. 2014;63:667–79. [Google Scholar]
- Mehta SS, Antich PP, Daphtary MM, Bronson DG, Richer E. Bone material ultrasound velocity is predictive of whole bone strength. Ultrasound in medicine & biology. 2001;27:861–67. doi: 10.1016/s0301-5629(01)00385-4. [DOI] [PubMed] [Google Scholar]
- Mehta SS, Öz OK, Antich PP. Bone elasticity and ultrasound velocity are affected by subtle changes in the organic matrix. Journal of Bone and Mineral Research. 1998;13:114–21. doi: 10.1359/jbmr.1998.13.1.114. [DOI] [PubMed] [Google Scholar]
- Minoux M. Mathematical programming: theory and algorithms. John Wiley & Sons; 1986. [Google Scholar]
- Moilanen P. Ultrasonic guided waves in bone. Ultrasonics, Ferroelectrics, and Frequency Control, IEEE Transactions on. 2008;55:1277–86. doi: 10.1109/TUFFC.2008.790. [DOI] [PubMed] [Google Scholar]
- Moilanen P, Nicholson P, Kilappa V, Cheng S, Timonen J. Measuring guided waves in long bones: Modeling and experiments in free and immersed plates. Ultrasound in medicine & biology. 2006;32:709–19. doi: 10.1016/j.ultrasmedbio.2006.02.1402. [DOI] [PubMed] [Google Scholar]
- Mole SS, Ganesan L. Unsupervised hybrid classification for texture analysis using fixed and optimal window size. International Journal on Computer Science and Engineering. 2010;2:2910–15. [Google Scholar]
- Protopappas VC, Kourtis IC, Kourtis LC, Malizos KN, Massalas CV, Fotiadis DI. Three-dimensional finite element modeling of guided ultrasound wave propagation in intact and healing long bones. The Journal of the Acoustical Society of America. 2007;121(6):3907–21. doi: 10.1121/1.2354067. [DOI] [PubMed] [Google Scholar]
- Raum K, Leguerney I, Chandelier F, Bossy E, Talmant M, Saïed A, Peyrin F, Laugier P. Bone microstructure and elastic tissue properties are reflected in QUS axial transmission measurements. Ultrasound in medicine & biology. 2005;31:1225–35. doi: 10.1016/j.ultrasmedbio.2005.05.002. [DOI] [PubMed] [Google Scholar]
- Reed KL, Brown TD. Elastic modulus and strength of emu cortical bone. The Iowa orthopaedic journal. 2001;21:53. [PMC free article] [PubMed] [Google Scholar]
- Roberts S, Hutchinson T, Arnaud S, Kiratli B, Martin R, Steele CR. Noninvasive determination of bone mechanical properties using vibration response: a refined model and validation in vivo. Journal of biomechanics. 1996;29(1):91–8. doi: 10.1016/0021-9290(95)00030-5. [DOI] [PubMed] [Google Scholar]
- Rose JL. Ultrasonic waves in solid media. Cambridge university press; 2004. [Google Scholar]
- Saha S, Lakes RS. The effect of soft tissue on wave-propagation and vibration tests for determining the in vivo properties of bone. Journal of biomechanics. 1977;10:393–401. doi: 10.1016/0021-9290(77)90015-x. [DOI] [PubMed] [Google Scholar]
- Siegel I, Anast G, Fields T. The determination of fracture healing by measurement of sound velocity across the fracture site. Surgery, gynecology & obstetrics. 1958;107:327. [PubMed] [Google Scholar]
- Sonstegard DA, Matthews LS. Sonic diagnosis of bone fracture healing — a preliminary study. Journal of biomechanics. 1976;9:689–94. doi: 10.1016/0021-9290(76)90170-6. [DOI] [PubMed] [Google Scholar]
- Steele C, Zhou L-J, Guido D, Marcus R, Heinrichs W, Cheema C. Noninvasive determination of ulnar stiffness from mechanical response — in vivo comparison of stiffness and bone mineral content in humans. Journal of biomechanical engineering. 1988;110:87–96. doi: 10.1115/1.3108423. [DOI] [PubMed] [Google Scholar]
- Stock JT, Shaw CN. Which measures of diaphyseal robusticity are robust? A comparison of external methods of quantifying the strength of long bone diaphyses to cross-sectional geometric properties. American Journal of Physical Anthropology. 2007;134(3):412–23. doi: 10.1002/ajpa.20686. [DOI] [PubMed] [Google Scholar]
- Summitt MC, Reisinger KD. Characterization of the mechanical properties of demineralized bone. Journal of Biomedical Materials Research Part A. 2003;67:742–50. doi: 10.1002/jbm.a.10123. [DOI] [PubMed] [Google Scholar]
- Ta D, Wang W, Wang Y, Le LH, Zhou Y. Measurement of the dispersion and attenuation of cylindrical ultrasonic guided waves in long bone. Ultrasound in medicine & biology. 2009;35:641–52. doi: 10.1016/j.ultrasmedbio.2008.10.007. [DOI] [PubMed] [Google Scholar]
- Tang H, Wu C, Huang X. Vibroacoustic analysis for a uniform beam using composite Green function method. Applied Acoustics. 2007;68(11):1386–99. [Google Scholar]
- Thomsen JJ. Modelling human tibia structural vibrations. Journal of Biomechanics. 1990;23(3):215–28. doi: 10.1016/0021-9290(90)90013-s. [DOI] [PubMed] [Google Scholar]
- Vallet Q, Bochud N, Chappard C, Laugier P, Minonzio J-G. In vivo characterization of cortical bone using guided waves measured by axial transmission. IEEE transactions on ultrasonics, ferroelectrics, and frequency control. 2016;63(9):1361–71. doi: 10.1109/TUFFC.2016.2587079. [DOI] [PubMed] [Google Scholar]
- Van der Perre G, Lowet G. In vivo assessment of bone mechanical properties by vibration and ultrasonic wave propagation analysis. Bone. 1996;18:S29–S35. doi: 10.1016/8756-3282(95)00377-0. [DOI] [PubMed] [Google Scholar]
- Van der Perre G, Van Audekercke R, Martens M, Mulier J. Identification of in-vivo vibration modes of human tibiae by modal analysis. Journal of biomechanical engineering. 1983;105:244–48. doi: 10.1115/1.3138412. [DOI] [PubMed] [Google Scholar]
- Vapnik VN. Statistics for Engineering and Information Science. Springer-Verlag; New York: 2000. The nature of statistical learning theory. [Google Scholar]
- Vavva MG, Protopappas VC, Gergidis LN, Charalambopoulos A, Fotiadis DI, Polyzos D. The effect of boundary conditions on guided wave propagation in two-dimensional models of healing bone. Ultrasonics. 2008;48:598–606. doi: 10.1016/j.ultras.2008.04.013. [DOI] [PubMed] [Google Scholar]
- Viktorov IA. Rayleigh and Lamb waves: physical theory and applications. Plenum press; 1970. [Google Scholar]
- Xu K, Minonzio J-G, Ta D, Hu B, Wang W, Laugier P. Sparse SVD method for high-resolution extraction of the dispersion curves of ultrasonic guided waves. IEEE transactions on ultrasonics, ferroelectrics, and frequency control. 2016;63(10):1514–24. doi: 10.1109/TUFFC.2016.2592688. [DOI] [PubMed] [Google Scholar]
- Xu K, Ta D, Wang W. Multiridge–based analysis for separating individual modes from multimodal guided wave signals in long bones. IEEE transactions on ultrasonics, ferroelectrics, and frequency control. 2010;57(11):2480–90. doi: 10.1109/TUFFC.2010.1714. [DOI] [PubMed] [Google Scholar]
- Ziegert J, Lewis J. The effect of soft tissue on measurements of vibrational bone motion by skin-mounted accelerometers. Journal of biomechanical engineering. 1979;101:218–20. [Google Scholar]


