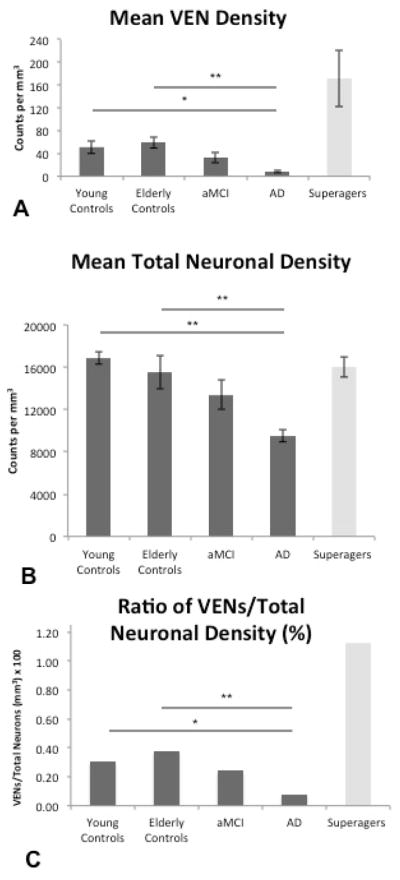
Figure 2.

Heights of the bars represent mean estimated VEN density, total neuronal density, and ratio of VEN density/total neuronal density, per cubic millimeter in all five subject groups (n = 5 per group) in the anterior cingulate cortex. Error bars represent standard error. (A) Consistent with prior findings (Gefen et al. 2015), SuperAgers showed higher VEN density compared to all groups. The following relationships were found among the other 4 groups: AD subjects showed significantly lower VEN density compared to young controls and cognitively-normal controls; there were no differences between aMCI subjects and AD subjects or aMCI subjects and elderly controls. In addition, there were no significant differences between the cognitively normal young and normal older groups. (B) Highest total neuronal density was found in young controls, followed by elderly controls, aMCI subjects, and AD subjects; there were no significant differences between elderly and young controls. Neuronal density in SuperAgers was at levels comparable to young and old cognitively average subjects. (C) When total neuronal count was accounted for, VEN distributions (illustrated as the ratio of VEN density to total neuronal density × 100) remained similar to the distribution illustrated in VEN counts alone. *p < 0.05; **p < 0.01.
