

Abstract
Background
We examined prospectively whether social capital mitigates the adverse effects of natural disaster on cognitive decline.
Methods
The baseline for our study was established seven months before the 2011 Great East Japan Earthquake and Tsunami in a survey of older community-dwelling adults who lived 80 kilometers west of the epicenter (59.0% response rate). Approximately two and a half years after the disaster, the follow-up survey gathered information about personal experiences of disaster as well as incidence of cognitive disability (82.1% follow-up rate). Our primary outcome was cognitive disability (measured on an 8-level scale) assessed by in-home assessment.
Findings
The experience of housing damage was associated with risk of cognitive impairment (coefficient = 0.04, 95% confidence interval: 0.02 to 0.06). Factor analysis of our analytic sample (n = 3,566) established two sub-scales of social capital: a cognitive dimension (perceptions of community social cohesion) and a structural dimension (informal socializing and social participation). Fixed effects regression showed that informal socializing and social participation buffered the risk of cognitive decline resulting from housing damage.
Interpretation
Informal socializing and social participation may prevent cognitive impairment following natural disaster.
Funding
National Institutes of Health (R01AG042463-04), the Japan Society for the Promotion of Science, the Japanese Ministry of Health, Labour and Welfare and the Japanese Ministry of Education, Culture, Sports, Science and Technology.
In the aftermath of the 2011 Great East Japan Earthquake and Tsunami, 89% of the post-disaster related deaths were older residents who were 65 years old or over1. A particular concern for older survivors is the potential risk of cognitive decline. We have previously reported that experience of disaster – particularly housing damage – is associated with an increased risk of cognitive decline among older survivors2.
In turn, a wealth of epidemiological evidence suggests that the preservation of cognitive and function in older individuals is dependent on their ability to maintain social connections in the community3. For improving disaster resilience and protecting the health of older adults, it is increasingly recognized that preserving social connections in the community – also referred to as “social capital” – serves as a critical ingredient4,5. According to Aldrich (2012)6, communities endowed with higher stocks of social capital – i.e. stronger bonds of trust between community members, as well as norms of mutual assistance – are better equipped to cope with the devastating consequences of disaster. However, no previous study has demonstrated whether social capital mitigates the impact of disaster experiences on cognitive decline.
Social capital is often separated into cognitive and structural components. The former refers to how people perceive social relations in their community (e.g. trust of others, mutual help, and community attachment), while the latter component captures what people actually do (e.g., informal socializing with their neighbors and participation in social activities)7.
In the present study, we took advantage of a unique “quasi experiment” in which information about social capital and cognitive function was gathered seven months prior to the disaster. The Japan Gerontological Evaluation Study (JAGES) was established in 2010 as a nationwide sample of community-dwelling residents aged 65 years or older. Our study area, Iwanuma city – located approximately 80 kilomteters west of the earthquake epicenter – was one of the field sites of the JAGES cohort. Approximately 2.5 years after the disaster, we re-contacted the 3,594 survivors and linked their responses to incident cognitive disability ascertained by in-home assessment and medical examination under Japan’s national Long-Term Care Insurance (LTCI) registry. This unique design afforded us the opportunity to prospectively examine the association between changes in individual social capital and cognitive function, spanning the experience of disaster.
Methods
Study participants
One of the field sites of the JAGES cohort is based in the city of Iwanuma (total population 44,187 in 2010) in Miyagi Prefecture. We mailed questionnaires to every resident aged 65 years or older in August 2010 (n=8,576), using the official residential register. The survey inquired about personal characteristics as well as their health status. The response rate was 59.0% (n = 5,058), which is comparable to other surveys of community-dwelling residents.
The earthquake and tsunami occurred on March 11, 2011, seven months after the baseline survey was completed. Iwanuma city is a coastal municipality located approximately 80 kilometers west of the earthquake epicenter, so that it was in the direct line of the tsunami that killed 180 residents, damaged 5,542 houses and inundated 48% of the land area (Figure 1)8.
Figure 1.
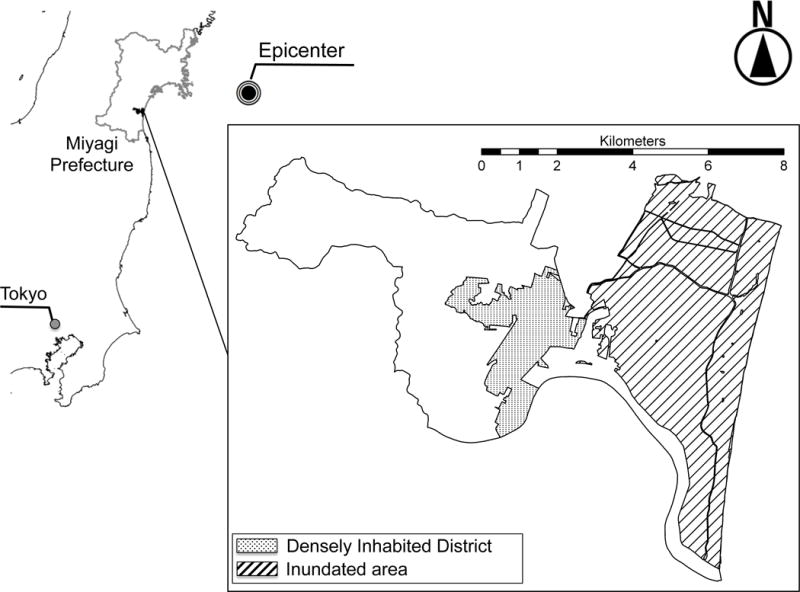
Map of Inundated Area in Iwanuma City, Japan
Approximately 2.5 years after the disaster (starting on October 2013), we conducted a follow-up survey of all survivors. The survey gathered information about personal experiences of disaster as well as updating their health status. Informed consent was obtained at the time of survey collection. The respondents were then linked to the national LTCI registry, which includes information about cognitive impairment based on in-home assessment by trained investigators (e.g., public health nurse).
The detailed flow-chart of the analytic sample is presented in Figure 2. Of the 4,380 eligible participants from the baseline survey, we managed to re-contact 3,594 individuals (follow-up rate: 82.1%). Our analytic sample is 3,566 due to incompletely signed informed consent forms and lack of linkage to the national LTCI database.
Figure 2.
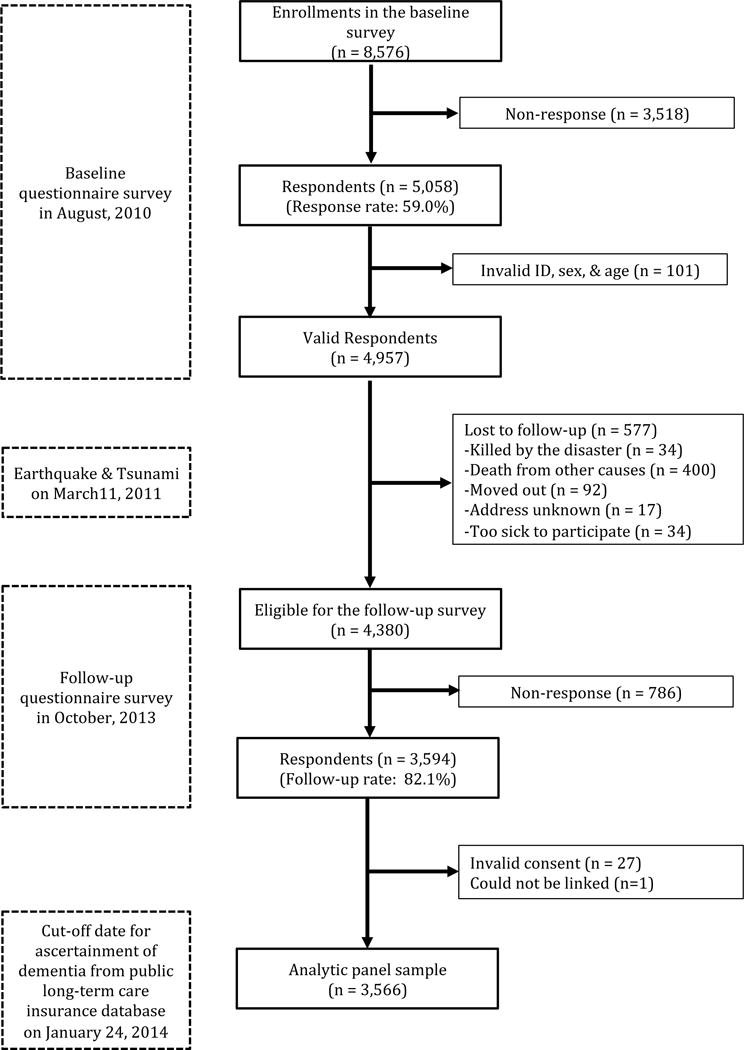
Flow Chart for the Analytic Panel Sample (n = 3,566) Aged 65 Years and Older, Iwanuma, Japan, 2010–2013
The survey protocol was reviewed and approved by the human subjects committee of the Harvard T.H. Chan School of Public Health, as well as the human subjects committees of Tohoku University, Nihon Fukushi University, and Chiba University.
Outcome variable
Our primary outcome is levels of cognitive decline assessed by a standardized in-home assessment under a national LTCI scheme established in 20009. An applicant is assessed for eligibility to receive long-term care (e.g., meals on wheels) by a trained investigator dispatched from the certification committee in each municipality.
During the home visit, each individual is assessed with regard to their activities of daily living and instrumental activities of daily living status, cognitive function (e.g., short-term memory, orientation and communication) as well as presence of mental and behavioral disorders (e.g., delusions of persecution, confabulation, and soliloquy) using a standardized protocol. Following the assessment, the applicants are classified into one of 8 levels (1= independent, 8=requires specialized medical treatment in a long-term care facility) according to the severity of their cognitive disability (eTable 1)2. This index of cognitive impairment is strongly correlated with the Mini Mental State Examination (Spearman’s rank correlation ρ = −0.73, p < .001)10 and level I of the 8-point scale has been demonstrated to correspond with a 0.5 point rating on the Clinical Dementia Rating scale (specificity and sensitivity, 0.88)11.
The initial certification is valid for 6 months, after which periodic re-assessments are conducted every 12 months. Individuals and their caregivers can request a re-assessment before the expiration date, if their health status changes markedly9.
The committee also asks a panel of physicians to independently assess the cognitive disability level of applicants to determine the care requirements of the applicants12. The medical assessment is conducted independently of the in-home assessment, but we confirmed a high correlation between these two methods of assessment (Pearson’s correlation γ= 0.80, p < .001). In our primary analyses, we used the in-home assessment as our outcome, but in sensitivity analyses we also used the medical examination data.
We linked JAGES cohort participants to the LTCI register in Iwanuma city for the follow-up period from April 1, 2010 to January 24, 2014.
Explanatory variables
Our primary exposure variables are the cognitive and structural dimensions of social capital. The cognitive dimension was assessed based on answers to questionnaire items about residents’ perceptions of trust of others in the community, levels of mutual help, and community attachment. These were evaluated using the questions “Do you think that people living in your community can be trusted in general?” (Trust); “Do you think people living in your community try to help others in most situations?” (Mutual help); and “How attached are you to the community in which you live?” (Community attachment). Responses were ordered along a 5-point Likert scale, with 1 indicating “not at all” and 5 indicating “very much”.
The structural dimension of social capital was measured by the frequency of meeting with friends, the number of friends whom the respondent met during the past month, and the frequency of participating in sports and hobby clubs per a week. Respondents were asked “How often do you see your friends?” (1= rarely, 6 = almost every day); “How many friends/acquaintances have you seen over the past month?” (1 = none, 5 = 10 or more); “How often do you attend sports or hobby group activities?” (1 = not at all, 6 = almost every day).
We also inquired about personal experiences of damage in the earthquake and tsunami, i.e., damage or loss of housing as well as loss of relatives or friends. Two or more technical officers surveyed property damage and the local government certificated the result (eTable 2).
Covariates and risk factors
We selected as time-varying confounding variables: age, equivalized income, medical diagnosis of stroke and diabetes13, depression symptoms (measured by the Geriatric Depression Scale-15, GDS-15)14, smoking, drinking15, daily walking time16. Other time invariant characteristics, such as sex and educational attainment, were omitted from our fixed effects regressions17. We also controlled for length of time (in years) between the pre- and post-disaster assessments for each subject (mean 3.69, SD 0.38)2.
Household income was equalized by dividing the gross income by the square root of the number of household members and categorized into “Under 2.0 million JPY” versus “2.0 million JPY and over”. Depressive symptoms were categorized into lower risk (four points and under) versus higher risk (five points and over)18.
Statistical analysis
In the present study, we used a fixed effects (or first difference) model in which we regressed within-individual changes in the dependent variable (ΔY: change in level of cognitive impairment) on changes in the independent variable (ΔX: change in level of social capital), which differences out the confounding influences of all observed and unobserved time-invariant factors.
We conducted an exploratory factor analysis with principal factor method followed by promax rotation to confirm the factor structure of our seven items measuring social capital and examined the effect of each sub-scale of social capital on cognitive decline.
We hypothesized that improvements in social capital (before vs. after the disaster) will buffer the impact of disaster experiences on cognitive decline, while a decline is social capital will have the opposite effect. To understand these interactions, we stratified the baseline sample into two groups – “high” social capital before the disaster versus “low” social capital, based on a median split. This resulted in two sets of groups for comparison: (i) people who reported low social capital both before and after the disaster (reference group) vs. people who experienced improvements in social capital after the disaster (“2010 low and 2013 high”); and (ii) people who reported high social capital both before & after the disaster (reference) vs. people who experienced declining social capital after the disaster (“2010 high and 2013 low”).
To address potential bias due to missing data, we used multiple imputation by Markov Chain Monte Carlo method assuming missingness at random for explanatory variables and covariates. We created five imputed data sets and combined each result of analysis using the Stata command “mi estimate”.
All analyses were performed using STATA version 14.0 (STATA Corp LP., College Station, Texas, USA).
Role of the funding source
The funders had no role in the design or conduct of the study; nor collection, management, analysis, and interpretation of the data; nor preparation, review, or approval of the manuscript; nor the decision to submit the manuscript for publication. The corresponding author had full access to all the data in the study and assumes final responsibility for the decision to submit for publication.
Results
Table 1 presents the characteristics of respondents at baseline (prior to the disaster) and at follow-up 2.5 years after the disaster. From the comparison with results of the local Census at baseline (eTable 3), females made up 56.5% of respondents, and this proportion is very close to the actual Census of older residents in Iwanuma city in October, 2010 (male 42.8%, female 57.2%)19. The age distribution of our sample is also close to the local Census data except for the group aged 85 years and over (respondents 6.2%, Census data 13.2%)19. A somewhat higher proportion of our respondents were married (71.4%) compared to the Census data (64.7%)20. The proportion of employed individuals in our data (17.8%) was also quite close to the Census data (17.2%)21. These comparisons support the representativeness of our data relative to Iwanuma city as a whole.
Table 1.
Characteristics of Overall Analytic Sample at Baseline and Follow-up Survey (n = 3,566) Aged 65 Years and Older, Iwanuma, Japan, 2010–2013
| Baseline survey in August, 2010 | Follow-up survey in October, 2013 | |||||||
|---|---|---|---|---|---|---|---|---|
| n | % | Mean | SD | n | % | Mean | SD | |
| Cognitive impairment level | ||||||||
| Independent | 3,421 | 95.8 | 3,156 | 88.5 | ||||
| I | 77 | 2.2 | 181 | 5.1 | ||||
| IIa | 6 | 0.2 | 51 | 1.4 | ||||
| IIb | 52 | 1.5 | 116 | 3.3 | ||||
| IIIa | 8 | 0.2 | 43 | 1.2 | ||||
| IIIb | 2 | 0.1 | 15 | 0.4 | ||||
| IV | 0 | 0.0 | 4 | 0.1 | ||||
| M | 0 | 0.0 | 0 | 0.0 | ||||
| Missing | 0 | 0.0 | 0 | 0.0 | ||||
| Housing damagea | ||||||||
| No damage | 1,423 | 39.9 | ||||||
| Affected | 1,496 | 42.0 | ||||||
| Minor | 257 | 7.2 | ||||||
| Major | 131 | 3.7 | ||||||
| Destroyed | 158 | 4.4 | ||||||
| Missing | 101 | 2.8 | ||||||
| Loss of relatives and/or friendsb | ||||||||
| No | 2,166 | 60.7 | ||||||
| Yes | 1,329 | 37.3 | ||||||
| Missing | 71 | 2.0 | ||||||
| Age | ||||||||
| (Continuous) | 3,566 | 100.0 | 73.64 | 6.28 | 3,566 | 100.0 | 76.84 | 6.29 |
| Missing | 0 | 0.0 | 0 | 0.0 | ||||
| Equivalized income | ||||||||
| Under 2.0 million JPY | 1,422 | 39.8 | 1,586 | 44.4 | ||||
| 2.0 million JPY and over | 1,489 | 41.8 | 1,400 | 39.3 | ||||
| Missing | 655 | 18.4 | 580 | 16.3 | ||||
| Stroke | ||||||||
| No | 2,664 | 74.7 | 2,845 | 79.8 | ||||
| Yes | 77 | 2.2 | 196 | 5.5 | ||||
| Missing | 825 | 23.1 | 525 | 14.7 | ||||
| Diabetes | ||||||||
| No | 2,285 | 64.1 | 2,551 | 71.6 | ||||
| Yes | 456 | 12.8 | 490 | 13.7 | ||||
| Missing | 825 | 23.1 | 525 | 14.7 | ||||
| Depressive symptoms (GDS scale) | ||||||||
| 4 points and under | 2,090 | 58.6 | 2,072 | 58.1 | ||||
| 5 points and over | 984 | 27.6 | 1,026 | 28.8 | ||||
| Missing | 492 | 13.8 | 468 | 13.1 | ||||
| Current drinking | ||||||||
| No | 2,208 | 61.9 | 2,421 | 67.9 | ||||
| Yes | 1,277 | 35.8 | 1,121 | 31.4 | ||||
| Missing | 81 | 2.3 | 24 | 0.7 | ||||
| Current smoking | ||||||||
| No | 2,903 | 81.4 | 3,265 | 91.6 | ||||
| Yes | 366 | 10.3 | 278 | 7.8 | ||||
| Missing | 297 | 8.3 | 23 | 0.6 | ||||
| Walking time per day | ||||||||
| Under 30 minutes | 1,284 | 36.0 | 1,281 | 35.9 | ||||
| 30 to 59 minutes | 1,183 | 33.2 | 1,227 | 34.4 | ||||
| 60 to 89 minutes | 493 | 13.8 | 534 | 15.0 | ||||
| 90 minutes and over | 435 | 12.2 | 470 | 13.2 | ||||
| Missing | 171 | 4.8 | 54 | 1.5 | ||||
| Perceived mutual help between neighbors | ||||||||
| 1: Not at all-5: Very much | 3,456 | 96.9 | 3.54 | 0.83 | 3,483 | 97.7 | 3.53 | 0.80 |
| Missing | 110 | 3.1 | 83 | 2.3 | ||||
| Trust of neighbors | ||||||||
| 1: Not at all-5: Very much | 3,487 | 97.8 | 3.75 | 0.77 | 3,511 | 98.5 | 3.74 | 0.72 |
| Missing | 79 | 2.2 | 55 | 1.5 | ||||
| Community attachment | ||||||||
| 1: Not at all-5: Very much | 3,484 | 97.7 | 4.00 | 0.83 | 3,517 | 98.6 | 3.95 | 0.82 |
| Missing | 82 | 2.3 | 49 | 1.4 | ||||
| Frequency meeting with friends | ||||||||
| 1: Rarely-6: Almost everyday | 3,414 | 95.7 | 3.73 | 1.48 | 3,517 | 98.6 | 3.63 | 1.57 |
| Missing | 152 | 4.3 | 49 | 1.4 | ||||
| Number of friends who met for the past month | ||||||||
| 1: None-5: 10 or more | 3,387 | 95.0 | 3.58 | 1.27 | 3,507 | 98.3 | 3.42 | 1.35 |
| Missing | 179 | 5.0 | 59 | 1.7 | ||||
| Frequency participating to sports club | ||||||||
| 1: None-6: Almost everyday | 2,991 | 83.9 | 1.86 | 1.43 | 3,421 | 95.9 | 1.78 | 1.42 |
| Missing | 575 | 16.1 | 145 | 4.1 | ||||
| Frequency participating to hobby club | ||||||||
| 1: None-6: Almost everyday | 3,048 | 85.5 | 2.25 | 1.46 | 3,428 | 96.1 | 1.90 | 1.38 |
| Missing | 518 | 14.5 | 138 | 3.9 | ||||
| Sex (time-invariant variable)c | ||||||||
| Male | 1,552 | 43.5 | ||||||
| Female | 2,014 | 56.5 | ||||||
| Missing | 0 | 0.0 | ||||||
| Educational attainment (time-invariant variable)d | ||||||||
| 9 years and under | 1,229 | 34.5 | ||||||
| 10 years and over | 2,199 | 61.7 | ||||||
| Missing l | 138 | 3.8 | ||||||
Abbreviations: JPY, Japanese Yen.
Empty cells at baseline due to before the disaster.
Empty cells at follow-up due to time-invariant variables.
In addition, we also compared the characteristics of our analytic sample to non-respondents at the follow-up survey (n = 786). The sex distribution was similar, although our analytic sample was somewhat older than the non-respondents (see eTable 3). The proportion of married persons in our analytic sample (71.4 %) was higher than among non-respondents (64.9 %). More respondents were likely to be employed at the time of the follow-up survey (17.8 %) compared to the non-respondents (14.0 %). The non-respondents were also less likely to be classified as functionally independent (84.1%) compared to the analytic sample (95.9%). This may have resulted in some attrition bias, but the differences were not large. (eTable 3).
Among the respondents, 37.3 % reported losing relatives or friends in the disaster, while 57.3 % reported personal damage to their property (Table 1). The prevalence of respondents whose cognitive function was classified as non-independent at the follow-up survey (11.5%) was three times higher than at baseline (4.2%). The prevalence of stroke (2.2%) had also increased to 5.5% at the follow-up survey. In addition, all components of social cohesion and informal socializing/social participation decreased during the followup.
The results of the factor analysis supported our approach to create two sub-scales for social capital – one representing the cognitive dimension (“social cohesion”) and the other representing the structural dimension (“informal socializing and social participation”) (eTable 4). Each eigenvalue of the sub-scales exceeded 1.0 (1.80, 1.14, respectively) thereby fulfilling the Kaiser-Guttman criterion22, and they explained 73% and 46% of the total variance, respectively (eTable 5). The sub-scales had good internal consistency reliability, with Cronbach’s α = 0.77 and 0.71, respectively (eTable 4).
We calculated sex-and age-adjusted averaged cognitive disability scores at both surveys according to the four patterns of transition in social capital before/after the disaster (eTable 5). Respondents who reported declining levels of social capital (2010 high – 2013 low) showed an increase in the level of cognitive impairment at the follow-up survey (1.11 to 1.38, for social cohesion; 1.06 to 1.28, for informal socializing and social participation).
As shown in Table 2, the fixed effects model for the overall samples indicated that housing damage was associated with higher risk of cognitive impairment (coefficient = 0.04, 95% CI: 0.02 to 0.06), while the main effects for social cohesion and informal socializing/social participation were protectively associated with cognitive impairment (coefficient = −0.04, 95% CI: −0.07 to −0.01; and coefficient = −0.06, 95% CI: −0.09 to −0.03, respectively). In addition, the interaction term for housing damage × informal socializing/social participation was also statistically significant (p < .001, see also Figure 3). Sensitivity analyses using the results of medical examination also showed similar results (eTable 6).
Table 2.
Effects of Disaster Experiences and Social Capital on Changes in Cognitive Impairment Level in Overall Analytic Sample (n = 3,566) Aged 65 Years and Older, Iwanuma, Japan, 2010–2013
| Coefficient (95% CI) | P | |
|---|---|---|
| Housing damage | ||
| 1: None - 5: Destroy (Continuous) | 0.04 (0.02 to 0.06) | < .001 |
| Loss of relatives/friends | ||
| Yes = 1, No = 0 | −0.02 (−0.07 to 0.02) | .31 |
| Age | ||
| (Continuous) | 0.30 (0.26 to 0.35) | < .001 |
| Equivalent income | ||
| ≥ 2 million JPY = 1, < 2 million JPY = 0 | −0.01 (−0.05 to 0.04) | .92 |
| Stroke | ||
| Yes = 1, No = 0 | 0.20 (0.10 to 0.31) | < .001 |
| Diabetes | ||
| Yes = 1, No = 0 | −0.01 (−0.11 to 0.09) | .87 |
| Depressive symptoms | ||
| ≥ 5 p = 1, ≤ 4 = 0 | 0.09 (0.04 to 0.15) | .001 |
| Current drinking | ||
| Yes = 1, No = 0 | 0.04 (−0.04 to 0.12) | .30 |
| Current smoking | ||
| Yes = 1, No = 0 | −0.06 (−0.18 to 0.05) | .27 |
| Increased walking time | ||
| 1: < 30 minute-4: ≥ 90 minute (Continuous) | −0.04 (0.06 to −0.01) | .002 |
| The length of time between pre- and post-disaster assessment | ||
| (Continuous) | −0.24 (−0.27 to −0.20) | < .001 |
| Social cohesion | ||
| (Continuous) | −0.04 (−0.07 to −0.01) | .04 |
| Informal socializing and social participation | ||
| (Continuous) | −0.06 (−0.09 to −0.03) | < .001 |
| Housing damage * social cohesion | ||
| (Continuous) | −0.01 (−0.03 to 0.02) | .79 |
| Housing damage * informal socializing and social participation | ||
| (Continuous) | −0.07 (−0.08 to −0.05) | < .001 |
Abbreviations: CI, confidence interval; JPY, Japanese Yen.
Figure 3.
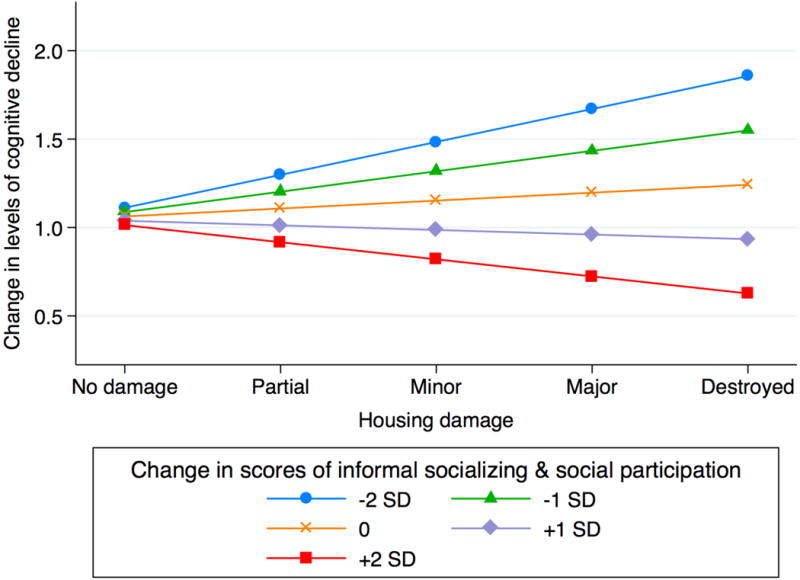
Marginal Effect of the Interaction of Housing Damage × Informal Socializing/Social participation in the Overall Analytic Sample (n = 3,566) Aged 65 Years and Older, Iwanuma, Japan, 2010–2013
In the subgroup analysis comparing “2010 low and 2013 low” versus “2010 low and 2013 high”, the interaction term for housing damage × informal socializing/social participation was also statistically significant (p < .001) (model 2 in Table 3). In the comparison of “2010 high and 2013 high” vs. “2010 high and 2013 low”, the interaction term of housing damage × informal socializing/social participation was also statistically significant (p = .01) (model 2 in Table 4). That is, informal socializing and social participation appeared to buffer the impact of housing damage on cognitive impairment.
Table 3.
Effects of Disaster Damage and Social Capital on Changes in Cognitive Impairment Level, in Comparing Low-Low vs Low-High of Social Capital for Stratified Sample, Aged 65 Years and Older, Iwanuma, Japan, 2010–2013
| Model 1: Social cohesion (n = 1,487) | Model 2: Informal socializing and social participation (n = 1,818) | |||
|---|---|---|---|---|
| Coefficient (95% CI) | P | Coefficient (95% CI) | P | |
| Housing damage | ||||
| 1: None - 5: Destroy (Continuous) | 0.04 (0.01 to 0.07) | .03 | 0.07 (0.03 to 0.10) | < .001 |
| Loss of relatives/friends | ||||
| Yes = 1, No = 0 | −0.04 (−0.12 to 0.03) | .21 | −0.04 (−0.12 to 0.05) | .37 |
| Age | ||||
| (Continuous) | 0.33 (0.27 to 0.39) | < .001 | 0.36 (0.28 to 0.43) | < .001 |
| Equivalent income | ||||
| ≥ 2 million JPY = 1, < 2 million JPY = 0 | 0.01 (−0.08 to 0.08) | .97 | 0.01 (−0.07 to 0.09) | .87 |
| Stroke | ||||
| Yes = 1, No = 0 | 0.29 (0.12 to 0.45) | .001 | 0.24 (0.04 to 0.44) | .02 |
| Diabetes | ||||
| Yes = 1, No = 0 | −0.03 (−0.17 to 0.12) | .71 | 0.08 (−0.12 to 0.28) | .41 |
| Depressive symptoms | ||||
| ≥ 5 p = 1, ≤ 4 = 0 | 0.15 (0.07 to 0.22) | < .001 | 0.09 (−0.03 to 0.21) | .14 |
| Current drinking | ||||
| Yes = 1, No = 0 | 0.03 (−0.08 to 0.14) | .55 | 0.03 (−0.11 to 0.18) | .64 |
| Current smoking | ||||
| Yes = 1, No = 0 | −0.07 (−0.24 to 0.10) | .41 | −0.11 (−0.31 to 0.09) | .30 |
| Increased walking time | ||||
| 1: < 30 minute-4: ≥ 90 minute (Continuous) | −0.02 (−0.05 to 0.02) | .30 | −0.05 (−0.09 to −0.01) | .02 |
| The length of time between predisaster and postdisaster assessment | ||||
| (Continuous) | −0.25 (−0.31 to −0.20) | < .001 | −0.27 (−0.34 to −0.21) | < .001 |
| Social cohesion | ||||
| (Continuous) | 0.03 (−0.03 to 0.08) | .32 | ||
| Interaction term: Housing damage * social cohesion | ||||
| (Continuous) | −0.02 (−0.06 to 0.02) | .43 | ||
| Informal socializing and social participation | ||||
| (Continuous) | −0.04 (−0.10 to 0.02) | .23 | ||
| Interaction term: Housing damage * informal socializing and social participation | ||||
| (Continuous) | −0.10 (−0.14 to −0.05) | < .001 | ||
Abbreviations: CI, confidence interval; JPY, Japanese Yen.
Table 4.
Effects of Disaster Damage and Social Capital on Changes in Cognitive Impairment Level, Comparing High-High vs High-Low of Social Capital in Stratified Sample Aged 65 Years and Older, Iwanuma, Japan, 2010–2013
| Model 1: Social cohesion (n = 1,404) | Model 2: Informal socializing and social participation (n = 1,233) | |||
|---|---|---|---|---|
| Coefficient (95% CI) | P | Coefficient (95% CI) | P | |
| Housing damage | ||||
| 1: None - 5: Destroy (Continuous) | 0.05 (0.02 to 0.08) | .002 | 0.04 (0.01 to 0.06) | .009 |
| Loss of relatives/friends | ||||
| Yes = 1, No = 0 | −0.02 (−0.08 to 0.04) | .48 | −0.01 (−0.06 to 0.05) | .76 |
| Age | ||||
| (Continuous) | 0.30 (0.24 to 0.36) | < .001 | 0.24 (0.18 to 0.29) | < .001 |
| Equivalent income | ||||
| ≥ 2 million JPY = 1, < 2 million JPY = 0 | −0.02 (−0.08 to 0.04) | .56 | −0.01 (−0.05 to 0.04) | .80 |
| Stroke | ||||
| Yes = 1, No = 0 | 0.18 (0.02 to 0.33) | .03 | 0.16 (−0.02 to 0.35) | .08 |
| Diabetes | ||||
| Yes = 1, No = 0 | 0.02 (−0.12 to 0.15) | .81 | −0.09 (−0.21 to 0.04) | .16 |
| Depressive symptoms | ||||
| ≥ 5 p = 1, ≤ 4 = 0 | 0.08 (−0.01 to 0.15) | .05 | 0.10 (0.02 to 0.19) | .02 |
| Current drinking | ||||
| Yes = 1, No = 0 | 0.07 (−0.04 to 0.18) | .24 | 0.05 (−0.04 to 0.13) | .31 |
| Current smoking | ||||
| Yes = 1, No = 0 | −0.08 (−0.23 to 0.07) | .32 | −0.02 (−0.15 to 0.11) | .76 |
| Increased walking time | ||||
| 1: < 30 minute-4: ≥ 90 minute (Continuous) | −0.06 (−0.09 to −0.03) | < .001 | −0.03 (−0.06 to −0.01) | .03 |
| The length of time between predisaster and postdisaster assessment | ||||
| (Continuous) | −0.24 (−0.30 to −0.19) | < .001 | −0.19 (−0.24 to −0.15) | < .001 |
| Social cohesion | ||||
| (Continuous) | 0.13 (0.07 to 0.19) | < .001 | ||
| Interaction term: Housing damage * social cohesion | ||||
| (Continuous) | 0.03 (−0.01 to 0.08) | .17 | ||
| Informal socializing and social participation | ||||
| (Continuous) | 0.10 (0.06 to 0.14) | < .001 | ||
| Interaction term: Housing damage * informal socializing and social participation | ||||
| (Continuous) | 0.04 (0.01 to 0.07) | .01 | ||
Abbreviations: CI, confidence interval; JPY, Japanese Yen.
Although the interaction terms for housing damage × social cohesion was not significant in any of the models, the point estimates were in the expected direction (Table 2 to 4 and eTable 6 to 8).
Discussion
This study demonstrates that experiences of disaster (particularly, housing damage) are associated with the increased risk of cognitive impairment, while social capital appeared to buffer that association. Subgroup analyses suggested that increased informal socializing and social participation mitigates the impact of housing damage on deterioration of cognitive function, while decreases in informal socializing/social participation potentiated the impact of property damage on incident cognitive disability.
The association between changes in social capital and cognitive decline is both statistically and clinically important. For example, the magnitude of the association between decreased social cohesion and cognitive decline (beta coefficient = 0.13, 95% CI: 0.07 to 0.19) is larger than the effect of incident depressive symptoms on cognitive decline (beta coefficient = 0.08, 95% CI: −0.01 to 0.15) (model 1 in Table 4).
Previous studies have demonstrated that disaster experiences are linked with heightened risk of cognitive decline among affected older individuals in the aftermath of the 2011 Great East Japan Earthquake2 as well as Hurricanes Katrina and Rita23. Studies have also suggested that social capital is protectively associated with depression and posttraumatic stress disorder following disasters4. Our study extends the evidence by showing that social capital can buffer the impact of disaster experiences on cognitive decline.
According to Aldrich (2012)6, the three broad mechanisms by which social capital assists in disaster resilience include: (a) norms of reciprocity serve as a kind of “informal insurance”, enabling residents to draw on each other for instrumental and emotional assistance; (b) stronger community bonds enable residents to more effectively “voice” their needs and demands during disaster recovery; and (c) social solidarity raises the cost of “exit” from the community in the aftermath of disaster, thereby enabling the speedier reconstruction of stricken communities. To these we may add yet a fourth mechanism to explain our findings, i.e., stronger connections to the community helped older victims from becoming socially isolated after they experienced housing damage and were relocated to temporary trailer housing. After the disaster, the residents who moved together with their neighbors into the temporary shelters continued to organize a variety of communal activities within the trailer home villages24. We hypothesize that these communal activities preserved the social connections between displaced residents, and that mutual support (as well as apparently mundane daily activities such as visiting with neighbors) helped to maintain cognitive functioning among vulnerable seniors.
A major strength of this study is the availability of information pre-dating the disaster about levels of cognitive disability as well as other health conditions. Our design was therefore able to effectively address the problem of recall bias in most studies conducted in post-disaster settings. A second strength is the record linkage to medically-verified cognitive disability obtained during home visits.
An important limitation of our study is that our first differences analyses cannot rule out simultaneity, e.g. changes in informal socializing/social participation occurred because of (or at the same time as) changes in cognitive impairment. In the more severe cases of cognitive decline, there is also the possibility of information bias – i.e. people did not accurately recall their most recent patterns of socializing with others. On the other hand, the baseline reports of social cohesion/social participation were obtained previous to the disaster, thereby eliminating the possibility of recall bias due to the traumatic events of the disaster itself. Lastly, selection bias might have arisen due to the somewhat higher proportion of non-respondents in the follow-up survey who were cognitively impaired at baseline. However, our response rate is quite comparable to similar surveys involving community-dwelling residents25. In addition, we confirmed that the demographic profile of our participants is quite similar to the Census of Iwanuma residents aged 65 years or older (eTable 3). Furthermore, the response rate of our follow-up survey among survivors was quite high (82.1%). Owing to the compulsory residential registration system in Japan, only seventeen residents from the baseline sample could not be tracked (Figure 2).
In conclusion, our findings suggest that social capital mitigates the impact of housing damage on cognitive decline in the aftermath of a natural disaster. A previous mixed methods study questioned 281 survivors of the 2011 Earthquake and Tsunami who had been resettled into trailer homes in the aftermath of the disaster26. Compared to those who moved together with other members of their community, survivors who were resettled by lottery (individual relocation) were less likely to report that they received social support from their new neighbors, and also less likely to report that they provided social support to others. Hence the method of relocating disaster victims is likely to have an important impact on their ability to maintain community ties. In addition, interventions that promote social cohesion and civic participation may be effective in promoting cognitive resilience in the aftermath of disaster. The World Bank recently reported on such a campaign in Ofunato, a city in Iwate prefecture that was devastated by the 2011 disaster, called the “Ibasho Café” initiative (“ibasho” in Japanese means “a place to gather”). The project objective was to help strengthen the social capital needed to recover from the disaster, giving community members of all ages a place where they can develop more and deeper connections with each other27.
Supplementary Material
Research in context.
Evidence before this study
We searched PubMED for manuscripts published in any language from database inception to January 24, 2017, using the following search terms: [(“disaster”[Title/Abstract] OR “earthquake”[Title/Abstract]) AND (“social capital”[Title/Abstract]) AND (“Cognitive Disorders”[MeSH Major Topic]] OR “dementia”[Title/Abstract])]. We specified “MeSH Major Topic” for “cognitive disorders” and searched in title or abstract for rest of words. As a result of the search using these inclusion criteria, we could not identify any articles. That is, no previous studies have examined whether social capital can buffer the impact of natural disaster experiences on cognitive function.
Added value of this study
Previous studies have demonstrated that disaster experiences are linked to heightened risk of cognitive decline among affected older individuals in the aftermath of the 2011 Great East Japan Earthquake as well as Hurricanes Katrina and Rita. Previous studies also suggested that social capital is protectively associated with depression and posttraumatic stress disorder following disasters. Our study extends the evidence that social capital buffers the impact of disaster experiences on cognitive decline. This study demonstrates that informal socializing and social participation can buffer the adverse impact of housing damage on cognitive function among older survivors of natural disaster.
Implications of all the available evidence
Interventions to promote civic participation may be useful in promoting cognitive resilience in the aftermath of disaster.
Acknowledgments
We appreciate the support and cooperation of the Iwanuma Mayor’s office, and the staff of the Department of Health and Welfare of Iwanuma city government. This work was supported by a grant from the National Institutes of Health (R01 AG042463); Grants-in-Aid for Scientific Research from the Japan Society for the Promotion of Science (KAKENHI 23243070, KAKENHI 22390400, KAKENHI 22592327 and KAKENHI 24390469); a Health Labour Sciences Research Grant from the Japanese Ministry of Health, Labour and Welfare (H22-Choju-Shitei-008 and H24-Choju-Wakate-009); and a grant from the Strategic Research Foundation Grant-Aided Project for Private Universities from the Japanese Ministry of Education, Culture, Sports, Science and Technology (S0991035).
Footnotes
Publisher's Disclaimer: This is a PDF file of an unedited manuscript that has been accepted for publication. As a service to our customers we are providing this early version of the manuscript. The manuscript will undergo copyediting, typesetting, and review of the resulting proof before it is published in its final citable form. Please note that during the production process errors may be discovered which could affect the content, and all legal disclaimers that apply to the journal pertain.
Contributors: HH TT JA YM KK IK conceived and designed the survey; HH TT JA YM KK performed the survey; HH analyzed the data; HH wrote the first draft of the manuscript; HH TT JA YM KK SS IK contributed to the writing of the manuscript. All authors agreed with manuscript results and conclusions.
Conflict of Interest Disclosures: All authors have completed and submitted the ICMJE Form for Disclosure of Potential Conflicts of Interest and none were reported.
References
- 1.HelpAge International. Displacement and older people: The case of the Great East Japan Earthquake and Tsunami of 2011. 2013 http://www.helpage.org/silo/files/displacement-and-older-people-the-case-of-the-great-east-japan-earthquake-and-tsunami-of-2011.pdf (accessed December 3 2016)
- 2.Hikichi H, Aida J, Kondo K, et al. Increased risk of dementia in the aftermath of the 2011 Great East Japan Earthquake and Tsunami. Proceedings of the National Academy of Sciences. 2016;113(45):E6911–E8. doi: 10.1073/pnas.1607793113. [DOI] [PMC free article] [PubMed] [Google Scholar]
- 3.Glass TA, Balfour JL. Neighborhoods, Aging, and Functional Limitations. In: Kawachi I, Berkman LF, editors. Neighborhoods and Health. New York: Oxford University Press; 2003. pp. 303–34. [Google Scholar]
- 4.Hikichi H, Aida J, Tsuboya T, Kondo K, Kawachi I. Can Community Social Cohesion Prevent Posttraumatic Stress Disorder in the Aftermath of a Disaster? A Natural Experiment From the 2011 Tohoku Earthquake and Tsunami. American journal of epidemiology. 2016;183(10):902–10. doi: 10.1093/aje/kwv335. [DOI] [PMC free article] [PubMed] [Google Scholar]
- 5.Giordano GN, Lindström M. The 2005 London terror attacks: An investigation of changes in psychological wellbeing and social capital pre- and post-attacks (2003–07)-A UK panel study. SSM - Population Health. 2016;2:485–94. doi: 10.1016/j.ssmph.2016.06.008. [DOI] [PMC free article] [PubMed] [Google Scholar]
- 6.Aldrich DP. Building resilience: social capital in post-disaster recovery. Chicago: The University of Chicago Press; 2012. [Google Scholar]
- 7.Harpham T. The Measurement of Community Social Capital Through Surveys. In: Kawachi I, Subramanian SV, Kim D, editors. Social Capital and Health. New York, NY: Springer; 2008. pp. 51–62. [Google Scholar]
- 8.Miyagi Prefecture. Higashi Nihon Daishinsai ni okeru Higai tou Jyōkyō [in Japanese] 2017 Apr 25; 2017. https://www.pref.miyagi.jp/uploaded/attachment/621067.pdf (accessed April 25 2017)
- 9.Tamiya N, Noguchi H, Nishi A, et al. Population ageing and wellbeing: lessons from Japan’s long-term care insurance policy. The Lancet. 2011;378(9797):1183–92. doi: 10.1016/S0140-6736(11)61176-8. [DOI] [PubMed] [Google Scholar]
- 10.Hisano S. Kaitei Hasegawa shiki Kan’i Chinou Hyouka Scale (HDS-R), Mini-Mental State Examination (MMSE) to Syōgai Rōjin no Nichijyō Seikatsu Jiritsu do no Kanren ni tsuite. [in Japanese] Japanese journal of geriatric psychiatry. 2009;20(8):883–91. [Google Scholar]
- 11.Meguro K, Tanaka N, Kasai M, et al. Prevalence of dementia and dementing diseases in the old-old population in Japan: the Kurihara Project. Implications for Long-Term Care Insurance data. Psychogeriatrics. 2012;12(4):226–34. doi: 10.1111/j.1479-8301.2012.00406.x. [DOI] [PubMed] [Google Scholar]
- 12.Olivares-Tirado P, Tamiya N. Development of the Long-Term Care Insurance System in Japan Trends and Factors in Japan’s Long-Term Care Insurance System. Netherlands, Dordrecht: Springer; 2014. pp. 15–42. [Google Scholar]
- 13.Tang EYH, Harrison SL, Errington L, et al. Current Developments in Dementia Risk Prediction Modelling: An Updated Systematic Review. PLoS ONE. 2015;10(9):e0136181. doi: 10.1371/journal.pone. [DOI] [PMC free article] [PubMed] [Google Scholar]
- 14.Mourao RJ, Mansur G, Malloy-Diniz LF, Castro Costa E, Diniz BS. Depressive symptoms increase the risk of progression to dementia in subjects with mild cognitive impairment: systematic review and meta-analysis. International journal of geriatric psychiatry. 2016 doi: 10.1002/gps.4406. [DOI] [PubMed] [Google Scholar]
- 15.Zhou H, Deng J, Li J, Wang Y, Zhang M, He H. Study of the relationship between cigarette smoking, alcohol drinking and cognitive impairment among elderly people in China. Age and Ageing. 2003;32(2):205–10. doi: 10.1093/ageing/32.2.205. [DOI] [PubMed] [Google Scholar]
- 16.Murai T, Yamaguchi T, Maki Y, et al. Prevention of cognitive and physical decline by enjoyable walking-habituation program based on brain-activating rehabilitation. Geriatrics & Gerontology International. 2016 doi: 10.1111/ggi.12541(16)701-8. [DOI] [PubMed] [Google Scholar]
- 17.Chang H-H. Functional food consumption and depression among the elderly — What can we learn from a longitudinal survey? Economic Modelling. 2013;33:187–93. [Google Scholar]
- 18.Weintraub D, Oehlberg KA, Katz IR, Stern MB. Test characteristics of the 15-item geriatric depression scale and Hamilton depression rating scale in Parkinson disease. Am J Geriatr Psychiatry. 2006;14(2):169–75. doi: 10.1097/01.JGP.0000192488.66049.4b. [DOI] [PMC free article] [PubMed] [Google Scholar]
- 19.Iwanuma City. Nenrei Kakusai Danjyo betsu Jinkou no Suii [in Japanese] 2010 https://www.city.iwanuma.miyagi.jp/shisei/tokei/joho/documents/4nenreikakusaijinkousuii.pdf (accessed May 7 2017)
- 20.Iwanuma City. Haigū Kankei, Nenrei, Danjyo betsu ijyō Jinkou [in Japanese] 2010 https://www.city.iwanuma.miyagi.jp/shisei/tokei/joho/documents/7haiguukankeidanjobetsujinkou.pdf (accessed May 6 2017)
- 21.Iwanuma City. Jyōjyū chi mata ha Jyūgyō chi Tsūgaku chi ni yoru Nenrei [in Japanese] 2010 https://www.city.iwanuma.miyagi.jp/shisei/tokei/joho/documents/23joujuuchimatahajuugyouchinojinnkou.pdf (accessed May 7 2017)
- 22.Pett M, Lackey N, Sullivan J. Making Sense of Factor Analysis. SAGE Publications, Inc; 2003. [Google Scholar]
- 23.Cherry KE, Su LJ, Welsh DA, et al. Cognitive and Psychosocial Consequences of Hurricanes Katrina and Rita Among Middle-Aged, Older, and Oldest-Old Adults in the Louisiana Healthy Aging Study (LHAS) Journal of applied social psychology. 2010;40(10):2463–87. doi: 10.1111/j.1559-1816.2010.00666.x. [DOI] [PMC free article] [PubMed] [Google Scholar]
- 24.Miyagi Prefecture. Dai Rokkai Miyagi ken Hisai sya Fukkō Shien Kaigi [in in Japanese] 2013 Aug 30; 2013. http://www.pref.miyagi.jp/uploaded/attachment/224713.pdf (accessed June 29 2015)
- 25.Santos-Eggimann B, Cuénoud P, Spagnoli J, Junod J. Prevalence of Frailty in Middle-Aged and Older Community-Dwelling Europeans Living in 10 Countries. The Journals of Gerontology Series A: Biological Sciences and Medical Sciences. 2009;64(6):675–81. doi: 10.1093/gerona/glp012. [DOI] [PMC free article] [PubMed] [Google Scholar]
- 26.Koyama S, Aida J, Kawachi I, et al. Social support improves mental health among the victims relocated to temporary housing following the Great East Japan Earthquake and Tsunami. The Tohoku journal of experimental medicine. 2014;234(3):241–7. doi: 10.1620/tjem.234.241. [DOI] [PubMed] [Google Scholar]
- 27.Kiyota E, Tanaka Y, Arnold M, Aldrich DP. Elders Leading the Way to Resilience. 2015 https://www.gfdrr.org/sites/default/files/publication/Elders-Leading-the-Way-to-Resilience.pdf (accessed August, 19 2015)
Associated Data
This section collects any data citations, data availability statements, or supplementary materials included in this article.