

Abstract
Neurotoxicity remains a poorly characterized an adverse effect associated with colistin therapy. The aim of the present study was to investigate the mechanism of colistin-induced neurotoxicity using the mouse neuroblastoma-2a (N2a) cell line. Colistin induced apoptotic neuronal cell death in a dose dependent manner (colistin at 0-200 μM). Colistin treatment (at 50, 100 and 200 μM) for 24 h, significant increased the reactive oxygen species (ROS) levels; while a concomitant decrease in the activities of SOD and catalase and GSH levels were detected. Mitochondrial dysfunction was evident from the dissipation of membrane potential and the increase of Bax/Bcl-2, followed by the release of cytochrome c. Caspase-3/7, 8 and 9 activation was also detected. The results of qRT-PCR showed that colistin treatment activated the gene expression of p53, bax and caspase-8, significantly increased to 1.6, 3.3 and 2.2 fold (colistin at 200 μM) (all p<0.01), respectively. The formation of autophagic vacuoles was evident with significant increases (all p<0.05 or 0.01) of both of Beclin-1 and LC3B following colistin treatment (50-200 μM), indicated that the cells were undergoing autophagy. In summary, our study reveals that colistin induced neuronal cell death involves ROS mediated oxidative stress and mitochondrial dysfunction, followed by caspase-dependent apoptosis and autophagy. This knowledge-base of the neuronal signaling pathways of colistin-induced neurotoxicity will greatly facilitate the discovery of neuro-protective agents for use in combination with colistin to prevent this undesirable side-effect.
Keywords: Colistin, Neurotoxicity, Oxidative stress, Apoptosis, Autophagy
1. Introduction
The dry antibiotic pipe-line coupled to the spread of multidrug resistant (MDR) pathogens has created a ‘perfect-storm’ where antibiotics are fast becoming useless. The world is now facing a growing threat from the emergence of bacteria that are resistant to almost all available antibiotics. Polymyxins (colistin and polymyxin B) are last-line lipopeptide antibiotics that are increasingly being used to treat those life-threatening infections caused by MDR gram-negative bacteria [1–3]. Unfortunately, polymyxin therapy is thwarted by dose-limiting nephrotoxicity, which has been reported in up to 60% of patients [4]. Neurotoxicity is another unwanted, albeit less common side-effect when patients receiving intravenous colistin methanesulfonate (CMS) (the inactive pro-drug of colistin [3]), have been reported to present with neurological symptoms such as confusion, dizziness, facial and peripheral paraesthesia, vertigo, seizures, respiratory muscle weakness, apnoea and ataxia [5–8]. To date, the underlying mechanisms of these neuropathic adverse effects remain poorly characterized. The development of a comprehensive cellular-level understanding the pathways involved in polymyxin-induced neurotoxicity is imperative if we are to improve the therapeutic index of these important last-line antibiotics. In the present study, we investigated the pathways of colistin-induced neurotoxicity using a mouse neuroblastoma N2a cell line. Our results demonstrate that colistin-induced neurotoxicity is strongly dose-dependant; and involves both apoptotic and autophagy pathways. The significant potential of these pathways as neuro-protective targets are discussed.
2. Materials and methods
2.1 Materials
Colistin (sulfate) was purchased from Zhejiang Shenghua Biology Co., Ltd (20 400 units/mg, Zhengjiang, China). Dulbecco’s modified Eagle’s medium (DMEM) and fetal bovine serum (FBS) were obtained from Life Technologies Corporation (Grand Island, NY, USA). 3-(4,5-dimetylthiazol-2-yl)-2, 5-diphenyltetrazolium bromide (MTT), sodium dodecylsulfonate (SDS) and dimethyl sulfoxide (DMSO) were purchased from AMRESCO Inc. (Solon, OH, USA). Sodium pyruvate and phenylmethyl sulfonylfluoride (PMSF) were purchased from Sigma-Aldrich (St. Louis, MO, USA). Bovine serum albumin (BSA), Rhodamine (Rh) 123 and 2′,7′-Dichlorofluorescensin diacetate (DCFH-DA) were purchased from Beyotime (Haimen, China). All other reagents were of analytical grade.
2.2 Measurement of colistin induced cytotoxicity
The N2a mouse neuroblastoma cell line (ATCC CCL-131™) was employed throughout in this study. N2a cells were cultured in DMEM medium supplemented with 10% (v/v) FBS, 110 mg/L sodium pyruvate, 100 units/mL penicillin and 100 μg/mL streptomycin (Beyotime, Haimen, China) at 37 °C in 5 % CO2. The media were changed once per day. Cytotoxicity was measured by the MTT assay [9], in brief, N2a cells (5 ×10⁴) were seeded into 96-well tissue culture plates and incubated under the aforementioned conditions. After culture for 24 h, the cells were treated with 0-400 μM of colistin for 24 h. The medium was removed and cells were incubated in 100 μL fresh medium containing 10 μL MTT solution (5 mg/mL in PBS) for 4 h at 37 °C. The medium was removed and replaced by 100 μL DMSO for 30 min. Absorbance at 570 nm was measured using a microplate reader (Molecular Devices, Sunnyvale, CA, USA).
Colistin-induced plasma membrane damage in N2a cell was quantified in terms of the amount of lactate dehydrogenase (LDH) release by means of a LDH assay kit (Beyotime, Haimen, China). The N2a cells were plated at a density of 5×10⁵ cells/well in 12-well plates, cultured for for 24 h and then treated with colistin (0–400 μM) for 24 h. Then the culture medium was harvested and centrifuged at 4000 × g for 10 min at 4 °C. The LDH activity in the supernatant was measured by monitoring the absorbance at 490 nm.
2.3 Measurement of intracellular ROS generation
The production of intracellular ROS was measured using the ROS-specific fluorescent dye 2,7-dichlorofluorescein diacetate (DCFH-DA) (Beyotime, Haimen, China). N2a cells were seeded at an initial density of 2 × 10⁴ cells/mL in 96-well plates. After 24 h, the medium were discarded and replaced with 200 μL DMEM containing colistin at the different final concentrations (12.5, 25, 50, 100, 200 μM, respectively) for incubation at 37 °C for 24 h. The cells were then washed with PBS, followed by the addition of 200 μL DMEM containing 10 μM DCFH-DA and incubated for 30 min at 37 °C in the dark. After three washes with PBS, the DCFH-DA fluorescence wasmeasured (excitation wavelength: 488 nm; emission wavelength: 530 nm).
2.4 Measurement of intracellular superoxide dismutase (SOD), catalase (CAT) and glutathione (GSH)
The SOD, CAT activity and GSH content were measured using specific assay kits according to the manufacturer’s instructions (Nanjing Jiancheng Co., Ltd., Nanjing, China). Briefly, cells were plated into 6-well plates and treated with colistin at final concentrations of 0, 12.5, 25, 50, 100 and 200 μM for 24 h. The cells were washed with ice-cold PBS and lysed using cell lysis buffer provided in the kit. The cell lysates were centrifuged at 14,000 × g for 10 min at 4 °C. The supernatant were collected and assayed for SOD, CAT activities and GSH content. The protein concentrations were measured using the BCA™ protein assay kit (Beyotime, Haimen, China).
2.5 Measurement of mitochondrial membrane potential (MMP)
The inner membrane electrical potential across the mitochondrial membrane was measured as per our previously published methods [10]. Briefly, after colistin treatment at final concentrations of 0, 25, 50, 100 and 200 μM for 24 h, the cells were washed with PBS and harvested and then incubated with 0.5 μg/mL Rh123 dye in PBS for 30 min in the dark at 37 °C. The cells were washed twice with PBS and collected for determination of Rh123 fluorescence using a BD FACSAria™ flow cytometer (Becton Dickinson, San Jose, CA, USA).
2.6 Measurement of caspase-3/7 and caspase-9 activities
N2a cells (1.5×10⁴ cells per well) were cultured in 96-well plates and treated with colistin at final concentrations of 0, 25, 50, 100 and 200 μM for 24 h. The caspase-3/7 and -9 activities were determined using the Caspase-Glo® 3/7 and 9 assay kits (Promega Corp., Madison, USA) according to the manufacturer’s instructions. The luminescence was measured using a microplate luminometer (Molecular Devices, Sunnyvale, CA, USA) and linearly related to the caspase-3/7, 8 and 9 activities.
2.7 Flow cytometric analysis and Hoechst 33342 staining of apoptosis
N2a cells were cultured on 6-well plates at a density of 5×10⁵ cells per well. N2a cells were treated with colistin at final concentrations of 0, 25, 50, 100 and 200 μM for 24 h. The flow cytometric analysis of apoptosis in N2a cells were carried out using an Annexin V-FITC apoptosis detection kit (Nanjing KeyGEN Biotech Co., Ltd, Nanjing, China). In brief, colistin-treated cells were harvested with 0.25 % trypsin, washed twice with cold PBS and resuspended in 500 μL binding buffer. Then cells were then incubated with 5 μL annexin V-FITC (40 μg/mL) and 5 μL propidium iodide (40 μg/mL) in the darkness for 10 min at room temperature and detected by BD FACSAria™ flow cytometry.
For Hoechst 33342 staining, N2a cells were cultured on 12-well culture plates at a density of 2×10⁵ cells per well and similarly treatment with colistin is as described above. After staining with 1 μg/mL Hoechst 33342 (Vigorous Biotechnology, Beijing, China) for 20 min in the dark, the cells were observed under a fluorescence microscope (excitation wavelength at 340 nm and emission wavelength at 510 nm) (Leica Microsystems, Wetzlar, Germany). Cells showing DNA fragmentation or chromatin condensation were counted as apoptotic cells.
2.8 Visualization of monodansylcandaverine (MDC)-labeled vacuoles
MDC is a fluorescent dye that is widely used as a specific marker for autophagic vacuoles[11]. N2a cells were seeded on to 12-well culture plates and treated with colistin at final concentrations of 0, 25, 50, 100 and 200 μM for 24 h. Cells were incubated with medium containing 5 μM MDC for 30 min in the dark at 37 °C. Finally, cells were washed twice with PBS and observed for MDC fluorescence using a fluorescence microscope (excitation wavelength: 380 nm; emission wavelength: 525 nm).
2.9 LC3 immunofluorescence microscopic examination
N2a cells were treated with colistin at final concentrations of 50 and 200 μM for 24 h, and then were fixed with 4 % paraformaldehyde at room temperature for 30 min. The cells were then washed twice with PBS, followed to permeabilize with 1% Triton X-100. The cells were next treated with blocking buffer (1% bovine serum albumin in PBS) for 2 h. Cells were incubated with rabbit LC3 antibodies (1:100; ProteinTech Group, Inc., Chicago, IL, USA) overnight at 4°C, washed twice with PBS, followed by incubation with Cy3-labeled goat anti-rabbit IgG secondary antibody (Beyotime Institution of Biotechnology, Haimen, China) for 2 h at 37°C. The cells were then washed twice with PBS and incubated with 4,6-dianmidino-2-phenylindole (DAPI) nuclear stain for 30 min. The expression of LC3 was examined under a fluorescence microscope (488 nm filter).
2.10 Quantitative reverse-transcription (qRT) PCR examination
N2a cells were treated with colistin at final concentrations of 0, 25, 50, 100 and 200 μM for 24 h, harvested and total RNA was isolated using the TRIzol extraction kit (Invitrogen Inc, Carlsbad, CA) according to the manufacturer’s instructions. cDNA was synthesized from 2 μg of total RNA using the Prime Script RT-PCR kit (Takara, Dalian, China). The PCR primers used were according to the previous study [12], as following: p53: forward, 5′- AGA GTC TAT AGG CCC ACC CC -3′, reverse, 5′- GCT CGA CGC TAG GAT CTG AC -3′; caspase-8: forward, 5′- CAC TAG AAA GGA GGA GAT GGA AAG -3′, reverse, 5′- CTA TCC TGT TCT CTT GGA GAG TCC -3′; Bax: forward, 5′-GCC AGC AAA CTG GTG CTC AA-3′; reverse, 5′-ATG TCC AGC CCA TGA TGG TTC-3′; β-actin: forward, 5′- CGG GAA ATC GTG CGT GAC-3′, reverse, 5′- CAG GAA GGA AGG CTG GAA GAG-3′. qRT-PCR were performed using a Chromo 4™ instrument (Bio-Rad, Hercules, CA). The cycling conditions used were as follows: 95 °C for 10 min; 40 cycles of 95 °C for 15 s, 60 °C for 1 min and 72 °C for 40 s. All reactions were conducted in three replicates. The fold change in gene expression was calculated using 2−ΔΔCt after normalizing to the expression level of β-actin.
2.11 Western blotting analysis
After colistin treatment at final concentrations of 0, 25, 50, 100 and 200 μM for 24 h, the N2a cells were harvested using a scraper and lysed using 100 μL ice-cold lysis buffer (100 mM Tris-HCl, 2% (w/v) SDS, 10% (v/v) glycerol and pH 7.4; 1 mM PMSF, 1 μg/mL aprotinin, 1 μg/mL leupeptin and 1 μg/mL pepstatin A). The lysates were then ultrasonicated (3 s and 5 s apart in each cycle for 10 times, power 22 W) using an Ultrasonic Processor (Branson, Missouri, USA). Cell lysate samples were centrifuged at 14,000 × g for 15 min at 4 °C and supernatants were collected. The protein concentrations were measured using the BCA™ protein assay kit (Beyotime, Haimen, China). Western blotting was conducted as our previously described with minor modifications to the original protocol [13]. The following primary antibodies were employed, rabbit polyclonal antibodies against Beclin-1 (1:2000), LC3B (1:1000), Bax (1:3000) Bcl-2 (1:1000) (ProteinTech Group, Inc., Chicago, IL, USA) and mouse monoclonal antibody against cytochrome C (CytC) (1:2000), GAPDH (1:1000) and β-actin (1:1000; Zhongshan Golden Bridge Co., Beijing, China). The secondary antibodies employed were goat anti-rabbit IgG (1:5000) or rabbit anti-mouse IgG (1:5000) (Zhongshan Golden Bridge Co.,Beijing, China). The results were normalized to β-actin or GAPDH and analyzed using ImageJ (National Institute of Mental Health, Bethesda, MD, USA).
2.12 Statiscal analysis
All data are expressed as the mean ± standard deviation (SD) unless specified. Statistical analyses were conducted using SPSS V13.0 (SPSS Inc., Chicago, USA) and figures were prepared using GraphPad Prism 5.0 (Graph Pad Software, Inc., La Jolla, CA). Data from the control and treatment groups were analyzed with one-way analysis of variance (ANOVA), followed by the LSD post hoc test. A p value < 0.05 was considered as significant.
3 RESULTS
3.1 Dose-dependent cytotoxic effect of colistin on neuronal cells
The treatment of N2a neuronal cells with colistin for 24 h produced a significant dose-dependant decreases of cell viability (p<0.05 or 0.01, compared to the control) (Fig.1A and B).
Figure 1. Colistin induced cytotoxicity of neuroblastoma N2a cells.
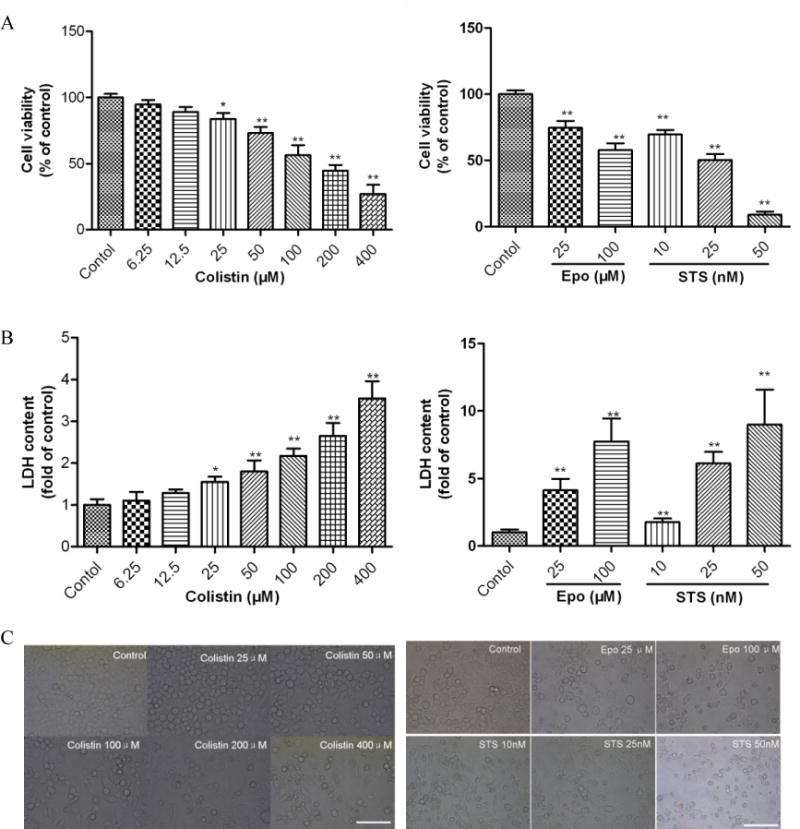
(A) The changes in cell viability of N2a cell treated with colistin, etoposide or staurosporine. (B) LDH release were determined following treatment with colistin (0 to 400 μM) for 24 h; Etoposide and staurosporine were used as the positive control treatments. Values are presented as mean ± SD (n = 5). *p<0.05, **p<0.01, compared to the control group. (C) Corresponding light microscope images of N2a cells treated with colistin (Scale Bar=50 μm). Epo, etoposide; STS, staurosporine.
N2a cells exposed to colistin concentration ≥ 50 μM exhibited the decrease of cell number and morphological changes such as cell body spindle-like, shrinkage, and dendrite fragmentation (Fig. 1C).
To gain further insights into the mode of cytotoxicity caused by colistin, cells were stained with Hoechst 33342 stain and quantitative analyzed by flow cytometry (Fig.2A and B). Colistin-treated cells displayed more condensed and fragmented chromatin and bright blue nuclei, which are indicative of apoptosis (Fig.2A). Furthermore, the early apoptosis and late apoptosis/necrosis stage’s ratios were investigated by flow cytometry. Compared to the control group, cells were treated with 50, 100 and 200 μM colistin for 24 h, viable cells were significantly decreased (all p<0.05 or 0.01), the early apoptosis cells increased to 14.2%, 19.6% and 28.4% (all p<0.01), respectively; the late apoptosis/necrosis stages increased to 9.7% (p<0.05), 12.3% (p<0.01) and 17.4% (p<0.01), respectively (Fig.2B).
Figure 2. Colistin induced apoptosis in neuroblastoma N2a cells.
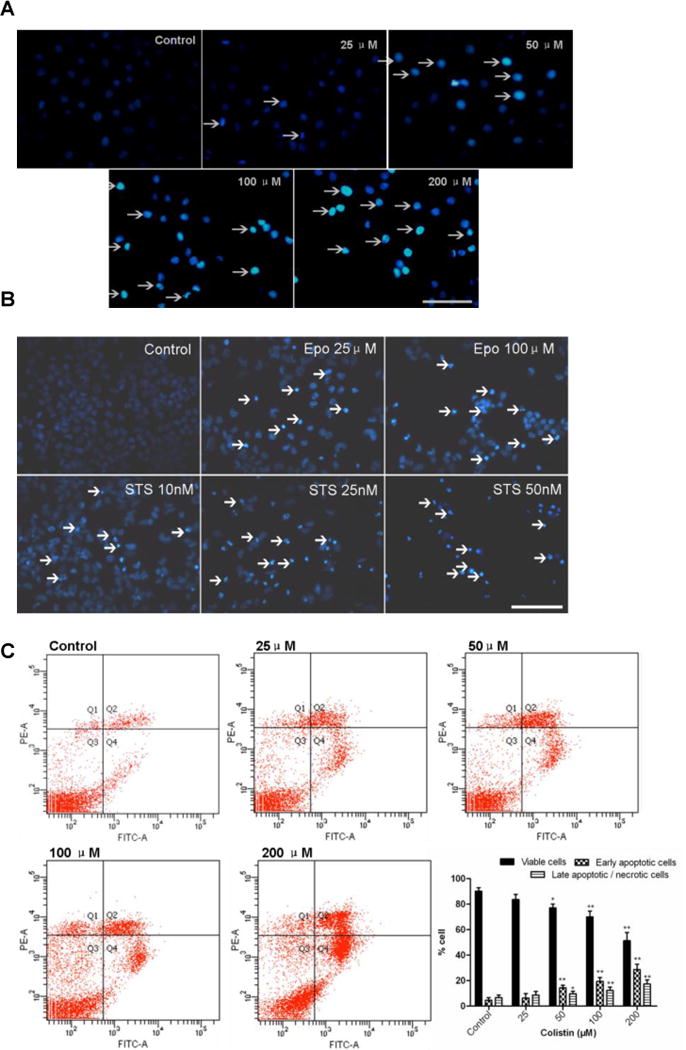
(A) Colistin induced fragmentation of the nucleus into oligonucleosomes and chromatin condensation were examined and photographed by fluorescence microscopy following Hoechst 33342 staining. The white arrows indicate apoptotic cells. Scale Bar=50 μm. (B) Etoposide and staurosporine were used as the positive control treatments. The white arrows indicate apoptotic cells. Scale Bar=25 μm; (C) Monitoring of colistin induced cellular apoptosis by flow cytometry following Annexin V-FITV/PI staining. (D) Monitoring of etoposide or staurosporine induced cellular apoptosis by flow cytometry following Annexin V-FITV/PI staining. All values were presented as mean ± SD, from three independent experiments (n=3). *p<0.05, **p<0.01, compared to control group; Q1: necrosis cells; Q2: later apoptotic cells; Q3: survival cells; Q4: early apoptotic cells; Epo, etoposide; STS, staurosporine.
3.2 Colistin treatment induces ROS producing and oxidative stress in neuronal cells
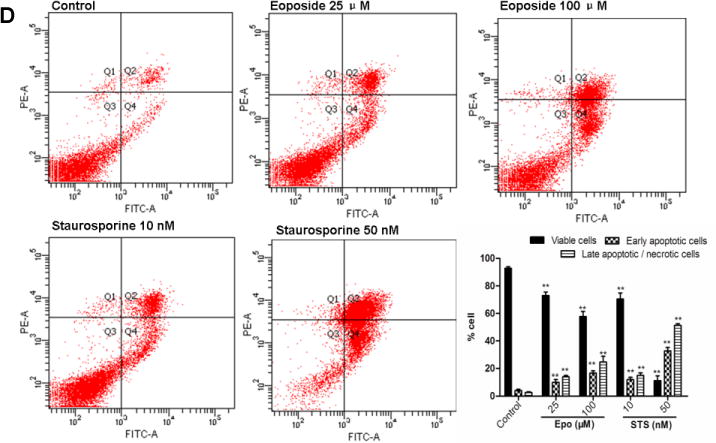
In N2a cells, treatments with 50, 100 and 200 μM of colistin significantly increased the ROS levels to 124.8 (p<0.05), 157.8% (p<0.01) and 204.5% (p<0.01) (Fig. 3A); correspondingly, activities of CAT, SOD and GSH levels also were significantly decreased (Fig. 3 B-D). Notably, there was no significant change on intracellular ROS, SOD, CAT and GSH levels when N2a cells were exposed to colistin at concentrations of ≤25 μM for 24 h (Fig. 3A-D).
Figure 3. Colistin-induced oxidative stress in neuroblastoma N2a cells.
(A) ROS production in response to colistin treatment. Intracellular ROS production was measured fluorimetrically using the dye 2,7-dichlorofluorescein diacetate. (B)-(D) Impact of colistin treatment on cellular catalase (CAT), superoxide dismutase (SOD) activities and glutathione (GSH) levels. Values are presented as the mean ± SD, from three independent experiments (n=3). *p<0.05, **p<0.01, compared to the control.
3.3 Colistin treatment induces mitochondrial dysfunction and caspases activation in neuronal cells
The treatment of N2a cells with colistin for 24 h significantly decreased the mitochondrial membrane potential (MMP) to 86.7% (colistin at 50 μM ; p<0.01), 72.4% (colistin at 100 μM; p<0.01) and 58.1% (colistin at 200 μM; p<0.01), compared to that in control group (Fig. 4A). Colistin treatment concomitantly increased the expression levels of CytC and the Bax/Bcl-2 ratio (Fig. 4A). Caspase 3/7, 8 and 9 activities were all significantly (p<0.05 or 0.01) increased following colistin treatment at concentrations ≥50 μM (Fig.4B).
Figure 4. Colistin-induced mitochondrial dysfunction and caspases activation apoptosis in neuroblastoma N2a cells.
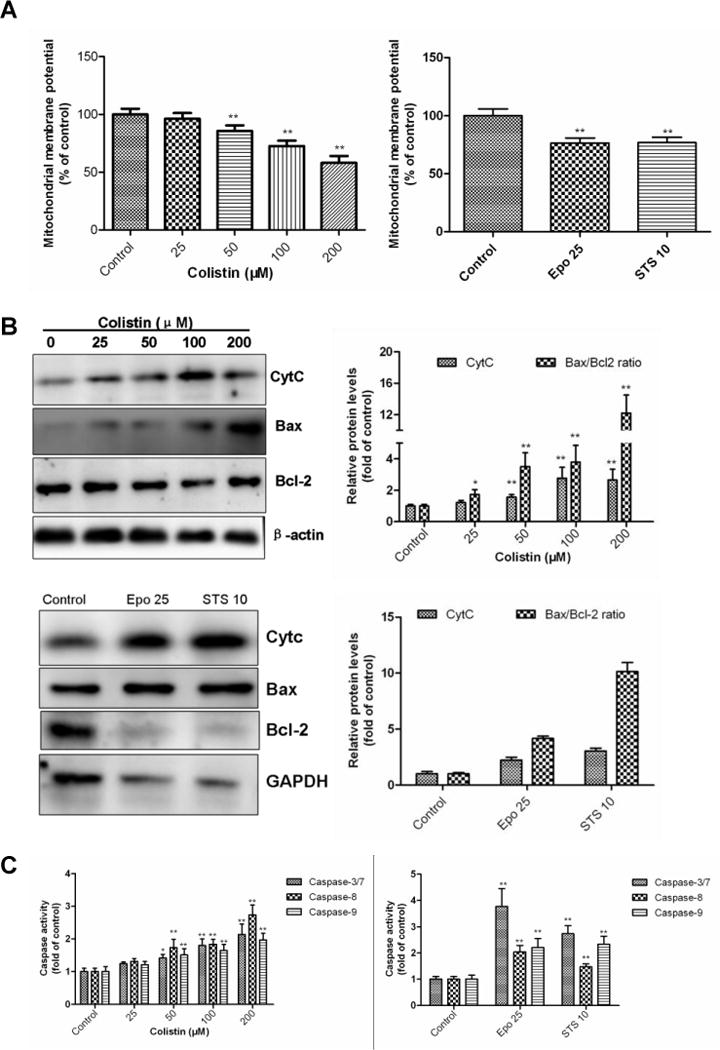
(A) Colistin-induced dissipation of mitochondrial membrane potential (Δψm); Etoposide and staurosporine were used as the positive control treatments. (B) Colistin treatment increases the Bcl2/Bax ratio and cytochrome C (Cyt C) release; β-actin or GAPDH was used as the internal standard. (C) Activation of caspase-3/7, 8 and 9 in response to colistin treatment. Values were presented as mean ± SD, from three independent experiments (n=3). *p<0.05, **p<0.01, compared to the control. Epo, etoposide; STS, staurosporine.
3.4 Colistin treatment upregulates the mRNA expressions of p53, caspase-8 and Bax in neuronal cells
After colistin treatment at the final concentrations of 25, 50, 100 and 200 μM for 24 h, concentration-dependent expressions of p53, caspase-8 and Bax were recorded as measured by mRNA levels using qRT-PCR (Fig.5). Colistin treatment at concentration ≥25 μM significant increased the Bax mRNA level (p<0.05 or 0.01) and maximum expression to 3.3 fold (colistin at 200 μM), compared with that no colistin treated cells. Similarly, a colistin concentration ≥50 μM treatment sensitized N2a cell towards apoptosis with maximum caspase-8 and p53 mRNA levels to 2.2 and 1.6 fold (colistin at 200 μM) (both p<0.01), respectively.
Figure 5. Colistin treatment upregulates the mRNA expression levels of p53, caspase-8 and Bax in neuroblastoma N2a cells.
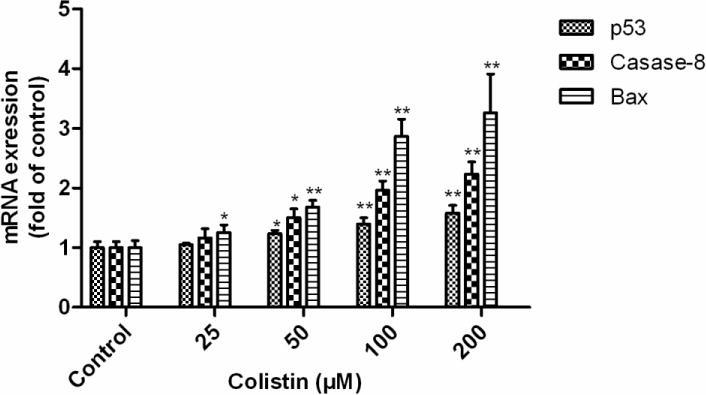
All values are presented as the mean ± SD, from three independent experiments (n=3). *p<0.05, **p<0.01, compared to control group.
3.5 Colistin treatment activates autophagy in neuronal cells
Colistin treatment significantly increased the neuronal cell autophagy in a dose-dependent manner. The western blotting results showed that the relative expression levels of Beclin 1 and the ratios of LC3II/I were significantlyincreased (~3.5 fold) when N2a cell were treated with colistin (25-200 μM) for 24 h (Fig. 6A). The formation of acidic vesicular organelles (AVOs) was also evident following colistin treatment (25-200 μM) for 24 h (Fig.6B). Immunofluorescence examination showed that LC3 expression significantly increased following colistin treatment (50 and 200 μM) for 24 h (Fig. 6C).
Figure 6. Colistin treatment activates autophagy in neuroblastoma N2a cells.
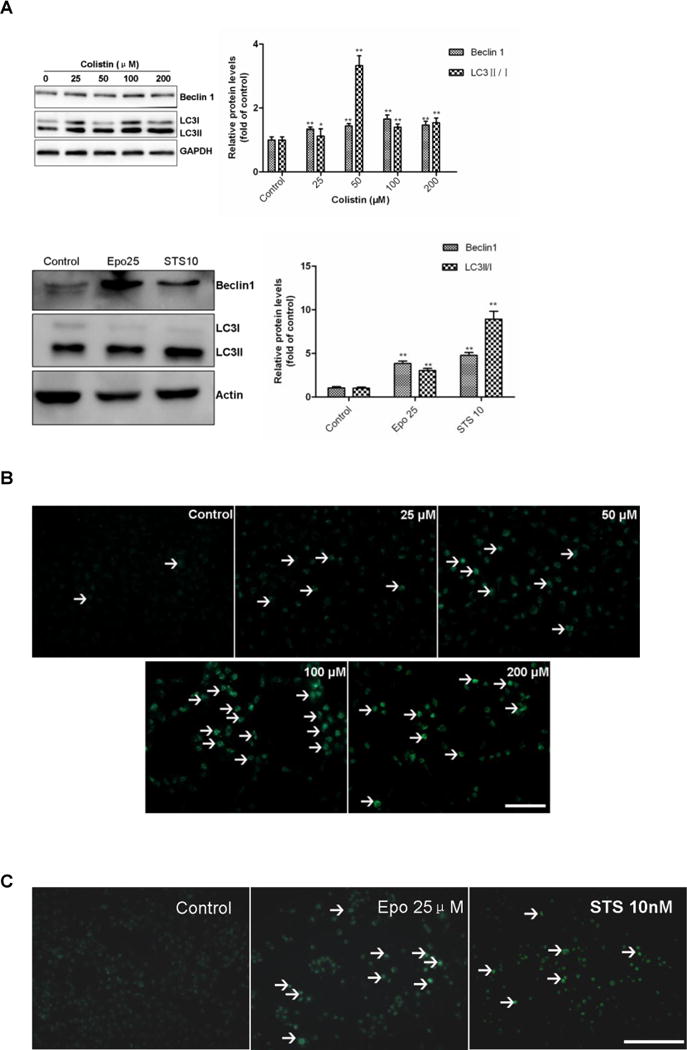
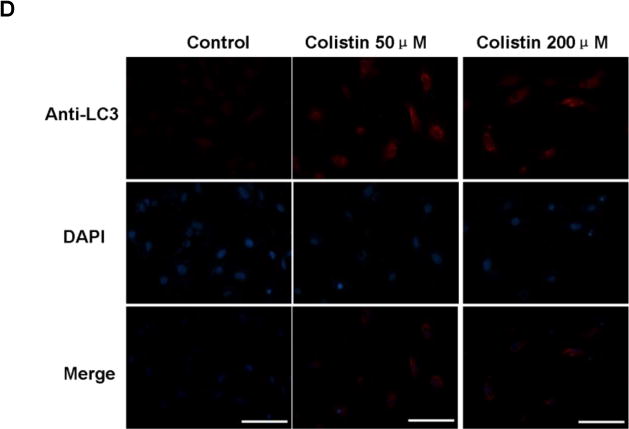
(A) The expression levels of Beclin 1 and the ratio of LC3II/I were determined by western blotting following colistin treatment for 24 h. Etoposide and staurosporine were used as the positive controls. Values were presented as mean ± SD, from three independent experiments (n = 3). *p<0.05, **p<0.01, compared to the control. (B) Fluorescence imaging of colistin treated cells following MDC staining (magnification ×20). White arrows indicate acidic vesicular organelles (AVOs). (C) Fluorescence imaging of etoposide at 25 μM (i.e., Epo 25) or staurosporine 10 nM (i.e., STS 10) treated cells following MDC staining (magnification ×20). White arrows indicate acidic vesicular organelles (AVOs) Scale Bar=25 μm. (D) Immunofluorescence staining with LC3 antibody (Red) and the nuclear stain DAPI (blue). Scale bar=50 μm.
4. DISCUSSION
The polymyxins were discovered in the 1950s, but never subjected to contemporary drug safety and development procedures. Neurotoxicity is the second major, albeit poorly understood side-effect associated with polymyxin therapy [6,8]. Clinical symptoms of polymyxin-induced neurotixicity include dizziness, visual disturbances, vertigo, confusion, hallucinations, seizures, ataxia, facial and peripheral paresthesias. An early study of the safety of intramuscularly administered colistimethate sodium (CMS) indicated that 7.3% of the patients developed neurotoxicity during the first four days of therapy [14]; mild neurotoxicity (such as paresthesias) may be more frequently, especially for the elderly patients, but it was usually ignored because of lake of objective assessment [15,6,8,16]. Multiple animal studies, have shown that colistin can induce neurotoxicity in mice [17–18], rats [19], pigs [20] or ostriches [21]. Notably, our mouse model studies demonstrated that high doses (15 mg/kg/day for 3 or 7 days) of colistin administered intravenously can cause marked neurotoxicity and neuronal in damage the brain [17,15]. In the present study, we employed the N2a mouse neuroblastoma cell line to investigate the molecular mechanisms underlying colistin-induced neurotoxicity.
In the present study, we demonstrated that colistin treatment for 24 h caused a decrease of cell viability and apoptosis in N2a cells in a dose-dependent manner (Fig. 1 and 2). These findings are consistent with our previous studies that demonstrated that colistin can induce apoptosis in primary chicken cortex neurons [22–23]. These findings are not surprising given that it has been well established that apoptosis plays a critical role in maintaining brain homeostasis in response to drug-induced toxicity[24]. Our pathway mapping data indicate that colistin-induced apoptosis in neuronal cell is activated via both the death receptor (extrinsic) and the mitochondrial (intrinsic) pathways [25]. The activation of the mitochondrial pathway was clearly evident based on several key findings. Colistin treatment of neuronal cells induced a rapid dissipation of the mitochondrial membrane potential (Fig. 3A), indicative of mitochondrial dysfunction. The mitochondrial pathway is regulated by the pro- and anti-apoptotic Bcl-2 family proteins including Bax and Bcl-2 [26]. An increase in the Bax/Bcl-2 ratios and CytC release were evident upon colistin treatment (Fig. 4A), these events are concordant with mitochondrial outer membrane permeabilization [27]. The release of CytC into the cytoplasm leads to the activation of caspases-3 and -9 (Fig. 4B), which in turn trigger apoptosis. Our results showed that colistin treatment significant increased caspase-8 (executor) activity and mRNA levels (Fig.4B and Fig. 5). This would suggest that colistin-induced apoptotic neuronal cell death can also occur via the death receptor pathway. Notably, colistin treatment significantly increased the level of p53 mRNA (Fig.5). p53 is involved in mediating cross-talk between the mitochondrial and death receptor pathways by regulating caspase-8 gene expressions and finally responded to events concerned with mitochondrial dysfunction [28,13,29–30]. p53 also can directly activate Bax to permeabilize mitochondria, cause mitochondrial CytC release, caspase activation, which triggers apoptosis [31]. This is consistent with the ~3.3-fold increase in Bax mRNA levels we observed following treatment of the N2a cells with 200 μM colistin (Fig. 5);
The nervous system is particularly vulnerable to oxidative damage owing to its high utilization of oxygen, high content of polyunsaturated fatty acids, and relative low levels of antioxidants [32]. Mitochondria are a major source of reactive oxygen species (ROS) production [33]. Mitochondrial dysfunction is closely related to excessive ROS accumulation, which leads to damage to lipids, proteins, and DNA, ultimately resulting in cell death [34]. Coincidently, we previously observed mitochondrial dysfunction in the mouse cerebral cortex and sciatic nerve tissues in mice intravenously injected with 15 mg/kg/day colistin sulfate for 7 days [17–18]. In the present study, we found that intracellular ROS levels in Na2 cells significantly increased following colistin treatment (Fig.3A). Concomitantly, we observed a decrease in GSH level and in the activity of the antioxidant enzymes SOD and CAT (Fig. 3 B-D). This indicates colistin treatment decreases the neurons capacity to breakdown superoxide anions and hydroxyl radicals; further exacerbating ROS mediated oxidative stress. Coincidently, we have previously demonstrated that the co-administration of antioxidants such as lycopene have been shown to be protective against polymyxin-induced nephrotoxicity in mice[35]. This supports the notion that oxidative stress pathways play an important role in polymyxin-induced neuro-cytotoxicity.
Autophagy is a salvaging pathway the cell uses to remove damaged organelles and proteins [33]. Autophagy also acts as a survival mechanism by providing energy and/or directly interfering with cell death pathways during nutrient deprivation, hypoxia, oxidative stress, and DNA damage [36]. Autophagy is known to be involved in the maintenance of neuronal homeostasis, particularly in response to oxidative stress and mitochondria dysfunction mediated neurotoxicity [31]. In the present study, we demonstrated that colistin can induce autophagy in N2a neuronal cells, confirmed by the formation of autophagic vacuoles and both upregulation of autophagy markers Beclin 1 and the ratios of LC3II/I(Fig. 6). This finding is in-line with our previous study that showed autophagy may play a protective role in colistin induced nephrotoxicity [13].
Conclusions
For the first time our study reveals that colistin-induced neurotoxicity involves apoptotic pathways associated with the generation of ROS and mitochondrial dysfunction, the putative schematic representation of potential mechanism showed in Fig.7. Moreover, in response to high colistin exposure neuronal cells appear to activate autophagy salvaging pathways to ‘mop-up’ damaged organelles and proteins. Our findings also touch upon the highly intricate crosstalk including ROS, p53 and death receptor pathways. Further studies are underway to elucidate the complex cross-talk between these pathways and dose-dependence for colistin-induced neuronal cell death. This first-hand understanding of colistin-induced neurotoxicity provides key information that is important not only for the amelioration of this unwanted side-effect but also for the discovery of novel, safer polymyxin-lipopeptide antibiotics-new ‘magic-bullets’ in the battle against MDR Gram-negative ‘superbugs’.
Figure 7. A schematic representation of the apoptotic pathways involved in colistin -induced neuroblastoma N2a cell death.
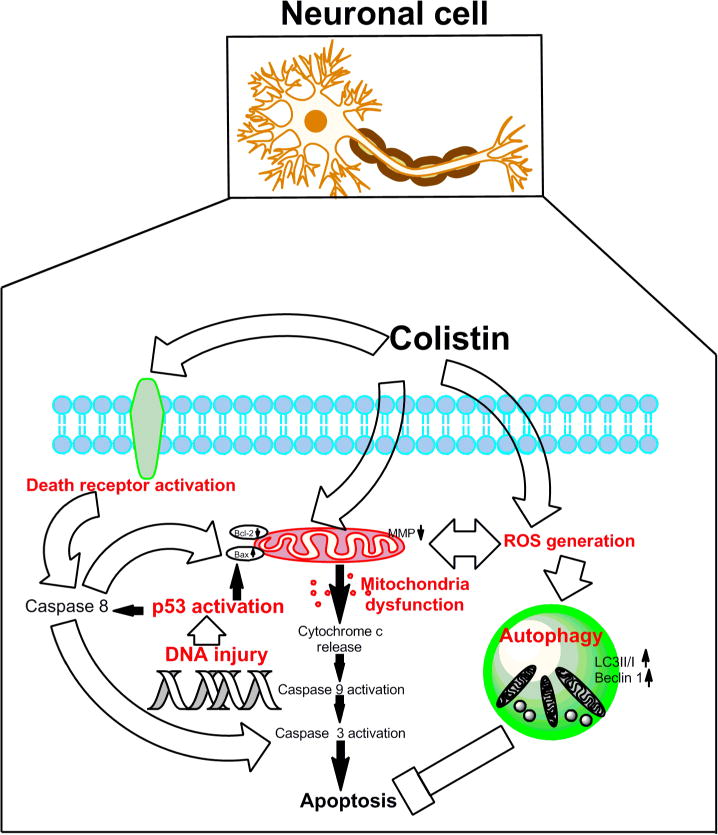
Colistin-induced apoptosis involves the activation of death receptor and mitochondrial pathways (aberration of the Bax/Bcl2 ratio,,loss of membrane potential and production of reactive oxygen species [ROS]), activation of caspase-3, -8, and -9, and, finally, DNA fragmentation resulting in neuronal cell death. Autophagy may play a neuroprotective role.
Acknowledgments
This study was supported by the National Natural Science Foundation of China (Award number 31372486). T. V. is supported by a research grant from the National Institute of Allergy and Infectious Diseases of the National Institutes of Health (R01 AI111965). T. V. is also supported by the Australian National Health and Medical Research Council (NHMRC).
Footnotes
Conflict of interest
The authors declare that there are no conflicts of interest.
References
- 1.Li J, Nation RL, Milne RW, et al. Evaluation of colistin as an agent against multi-resistant Gram-negative bacteria. Int J Antimicrob Agents. 2005;25(1):11–25. doi: 10.1016/j.ijantimicag.2004.10.001. [DOI] [PubMed] [Google Scholar]
- 2.Li J, Nation RL, Turnidge JD, et al. Colistin: the re-emerging antibiotic for multidrug-resistant Gram-negative bacterial infections. Lancet Infect Dis. 2006;6(9):589–601. doi: 10.1016/S1473-3099(06)70580-1. [DOI] [PubMed] [Google Scholar]
- 3.Bergen PJ, Li J, Rayner CR, et al. Colistin methanesulfonate is an inactive prodrug of colistin against Pseudomonas aeruginosa. Antimicrob Agents Chemother. 2006;50(6):1953–1958. doi: 10.1128/AAC.00035-06. [DOI] [PMC free article] [PubMed] [Google Scholar]
- 4.Garonzik SM, Li J, Thamlikitkul V, et al. Population pharmacokinetics of colistin methanesulfonate and formed colistin in critically ill patients from a multicenter study provide dosing suggestions for various categories of patients. Antimicrob Agents Chemother. 2011;55(7):3284–3294. doi: 10.1128/AAC.01733-10. [DOI] [PMC free article] [PubMed] [Google Scholar]
- 5.Honore PM, Jacobs R, Lochy S, et al. Acute respiratory muscle weakness and apnea in a critically ill patient induced by colistin neurotoxicity: key potential role of hemoadsorption elimination during continuous venovenous hemofiltration. Int J Nephrol Renovasc Dis. 2013;6:107–111. doi: 10.2147/IJNRD.S42791. [DOI] [PMC free article] [PubMed] [Google Scholar]
- 6.Wahby K, Chopra T, Chandrasekar P. Intravenous and inhalational colistin-induced respiratory failure. Clin Infect Dis. 2010;50(6):e38–40. doi: 10.1086/650582. [DOI] [PubMed] [Google Scholar]
- 7.Weinstein L, Doan TL, Smith MA. Neurotoxicity in patients treated with intravenous polymyxin B: Two case reports. Am J Health Syst Pharm. 2009;66(4):345–347. doi: 10.2146/ajhp080065. [DOI] [PubMed] [Google Scholar]
- 8.Falagas ME, Kasiakou SK. Toxicity of polymyxins: a systematic review of the evidence from old and recent studies. Crit Care. 2006;10(1):R27. doi: 10.1186/cc3995. [DOI] [PMC free article] [PubMed] [Google Scholar]
- 9.Liu Y, Dai C, Gao R, et al. Ascorbic acid protects against colistin sulfate-induced neurotoxicity in PC12 cells. Toxicol Mech Methods. 2013;23(8):584–590. doi: 10.3109/15376516.2013.807532. [DOI] [PubMed] [Google Scholar]
- 10.Zhang C, Wang C, Tang S, et al. TNFR1/TNF-alpha and mitochondria interrelated signaling pathway mediates quinocetone-induced apoptosis in HepG2 cells. Food Chem Toxicol. 2013;62:825–838. doi: 10.1016/j.fct.2013.10.022. [DOI] [PubMed] [Google Scholar]
- 11.Biederbick A, Kern HF, Elsasser HP. Monodansylcadaverine (MDC) is a specific in vivo marker for autophagic vacuoles. Eur J Cell Biol. 1995;66(1):3–14. [PubMed] [Google Scholar]
- 12.Shailasree S, Venkataramana M, Niranjana SR, et al. Cytotoxic Effect of p-Coumaric Acid on Neuroblastoma, N2a Cell via Generation of Reactive Oxygen Species Leading to Dysfunction of Mitochondria Inducing Apoptosis and Autophagy. Mol Neurobiol. 2015;51(1):119–130. doi: 10.1007/s12035-014-8700-2. [DOI] [PubMed] [Google Scholar]
- 13.Dai C, Li J, Tang S, et al. Colistin-induced nephrotoxicity in mice involves the mitochondrial, death receptor, and endoplasmic reticulum pathways. Antimicrob Agents Chemother. 2014;58(7):4075–4085. doi: 10.1128/AAC.00070-14. [DOI] [PMC free article] [PubMed] [Google Scholar]
- 14.Koch-Weser J, Sidel VW, Federman EB, et al. Adverse effects of sodium colistimethate. Manifestations and specific reaction rates during 317 courses of therapy. Ann Intern Med. 1970;72(6):857–868. doi: 10.7326/0003-4819-72-6-857. [DOI] [PubMed] [Google Scholar]
- 15.Dai C, Tang S, Li J, et al. Effects of colistin on the sensory nerve conduction velocity and F-wave in mice. Basic Clin Pharmacol Toxicol. 2014;115(6):577–580. doi: 10.1111/bcpt.12272. [DOI] [PubMed] [Google Scholar]
- 16.Bosso JA, Liptak CA, Seilheimer DK, et al. Toxicity of colistin in cystic fibrosis patients. DICP. 1991;25(11):1168–1170. doi: 10.1177/106002809102501101. [DOI] [PubMed] [Google Scholar]
- 17.Dai C, Li J, Li J. New insight in colistin induced neurotoxicity with the mitochondrial dysfunction in mice central nervous tissues. Exp Toxicol Pathol. 2013;65(6):941–948. doi: 10.1016/j.etp.2013.01.008. [DOI] [PubMed] [Google Scholar]
- 18.Dai C, Li J, Lin W, et al. Electrophysiology and ultrastructural changes in mouse sciatic nerve associated with colistin sulfate exposure. Toxicol Mech Methods. 2012;22(8):592–596. doi: 10.3109/15376516.2012.704956. [DOI] [PubMed] [Google Scholar]
- 19.Wallace SJ, Li J, Nation RL, et al. Subacute toxicity of colistin methanesulfonate in rats: comparison of various intravenous dosage regimens. Antimicrob Agents Chemother. 2008;52(3):1159–1161. doi: 10.1128/AAC.01101-07. [DOI] [PMC free article] [PubMed] [Google Scholar]
- 20.Lin B, Zhang C, Xiao X. Toxicity, bioavailability and pharmacokinetics of a newly formulated colistin sulfate solution. J Vet Pharmacol Ther. 2005;28(4):349–354. doi: 10.1111/j.1365-2885.2005.00666.x. [DOI] [PubMed] [Google Scholar]
- 21.Landman WJ, Dwars RM, Keukens HJ, et al. Polymyxin E-1 (colistin sulphate) (neuro-)intoxication in young ostriches (Struthio camelus spp.) Avian Pathol. 2000;29(6):593–601. doi: 10.1080/03079450020016841. [DOI] [PubMed] [Google Scholar]
- 22.Dai C, Zhang D, Li J. Effect of colistin exposure on calcium homeostasis and mitochondria functions in chick cortex neurons. Toxicol Mech Methods. 2013;23(4):281–288. doi: 10.3109/15376516.2012.754533. [DOI] [PubMed] [Google Scholar]
- 23.Dai C, Zhang D, Gao R, et al. In vitro toxicity of colistin on primary chick cortex neurons and its potential mechanism. Environ Toxicol Pharmacol. 2013;36(2):659–666. doi: 10.1016/j.etap.2013.06.013. [DOI] [PubMed] [Google Scholar]
- 24.Fu XY, Yang MF, Cao MZ, et al. Strategy to Suppress Oxidative Damage-Induced Neurotoxicity in PC12 Cells by Curcumin: the Role of ROS-Mediated DNA Damage and the MAPK and AKT Pathways. Mol Neurobiol. 2014 doi: 10.1007/s12035-014-9021-1. [DOI] [PubMed] [Google Scholar]
- 25.Fulda S, Debatin KM. Extrinsic versus intrinsic apoptosis pathways in anticancer chemotherapy. Oncogene. 2006;25(34):4798–4811. doi: 10.1038/sj.onc.1209608. [DOI] [PubMed] [Google Scholar]
- 26.Tait SW, Green DR. Mitochondria and cell death: outer membrane permeabilization and beyond. Nat Rev Mol Cell Biol. 2010;11(9):621–632. doi: 10.1038/nrm2952. [DOI] [PubMed] [Google Scholar]
- 27.Rasola A, Bernardi P. The mitochondrial permeability transition pore and its involvement in cell death and in disease pathogenesis. Apoptosis. 2007;12(5):815–833. doi: 10.1007/s10495-007-0723-y. [DOI] [PubMed] [Google Scholar]
- 28.Li PF, Dietz R, von Harsdorf R. p53 regulates mitochondrial membrane potential through reactive oxygen species and induces cytochrome c-independent apoptosis blocked by Bcl-2. EMBO J. 1999;18(21):6027–6036. doi: 10.1093/emboj/18.21.6027. [DOI] [PMC free article] [PubMed] [Google Scholar]
- 29.Yuan L, Wei S, Wang J, et al. Isoorientin induces apoptosis and autophagy simultaneously by reactive oxygen species (ROS)-related p53, PI3K/Akt, JNK, and p38 signaling pathways in HepG2 cancer cells. J Agric Food Chem. 2014;62(23):5390–5400. doi: 10.1021/jf500903g. [DOI] [PubMed] [Google Scholar]
- 30.Ehrhardt H, Hacker S, Wittmann S, et al. Cytotoxic drug-induced, p53-mediated upregulation of caspase-8 in tumor cells. Oncogene. 2008;27(6):783–793. doi: 10.1038/sj.onc.1210666. [DOI] [PubMed] [Google Scholar]
- 31.Wu HJ, Pu JL, Krafft PR, et al. The molecular mechanisms between autophagy and apoptosis: potential role in central nervous system disorders. Cell Mol Neurobiol. 2015;35(1):85–99. doi: 10.1007/s10571-014-0116-z. [DOI] [PMC free article] [PubMed] [Google Scholar]
- 32.Ikonomidou C, Kaindl AM. Neuronal death and oxidative stress in the developing brain. Antioxid Redox Signal. 2011;14(8):1535–1550. doi: 10.1089/ars.2010.3581. [DOI] [PubMed] [Google Scholar]
- 33.Lee J, Giordano S, Zhang J. Autophagy, mitochondria and oxidative stress: cross-talk and redox signalling. Biochem J. 2012;441(2):523–540. doi: 10.1042/BJ20111451. [DOI] [PMC free article] [PubMed] [Google Scholar]
- 34.Stowe DF, Camara AK. Mitochondrial reactive oxygen species production in excitable cells: modulators of mitochondrial and cell function. Antioxid Redox Signal. 2009;11(6):1373–1414. doi: 10.1089/ars.2008.2331. [DOI] [PMC free article] [PubMed] [Google Scholar]
- 35.Dai C, Tang S, Deng S, et al. Lycopene Attenuates Colistin-Induced Nephrotoxicity in Mice via Activation of the Nrf2/HO-1 Pathway. Antimicrob Agents Chemother. 2015;59(1):579–585. doi: 10.1128/AAC.03925-14. [DOI] [PMC free article] [PubMed] [Google Scholar]
- 36.Altman BJ, Rathmell JC. Autophagy: not good OR bad, but good AND bad. Autophagy. 2009;5(4):569–570. doi: 10.4161/auto.5.4.8254. [DOI] [PMC free article] [PubMed] [Google Scholar]