

Abstract
Over the past decade, use of novel agents, including immunomodulatory drugs (IMiDs) and proteasome inhibitors (PIs) has resulted in high response rates and improvement in overall survival (OS) for patients with multiple myeloma (MM); however, the prognostic significance of refractoriness to these agents when used as initial therapy has not been extensively studied. We reviewed the outcomes of 816 consecutive patients treated for MM at our institution since 2006 to evaluate the survival difference between those achieving at least a partial response (PR) to induction therapy and those who were primary refractory. The median OS from start of therapy was significantly shorter for the primary refractory group at 3.6 years vs 7.6 years for the responding patients (P < 0.001). The difference in median OS persisted when only patients receiving a novel agent as part of induction therapy were considered (3.6 years vs 7.9 years, P < 0.001) and in a four-month landmark analysis (4.2 years vs 7.6 years, P < 0.001). The median OS for patients achieving a complete response (CR), very good partial response (VGPR), PR, or less than PR was not reached (NR), 6.1, 6.4, and 4.2 years from the four-month landmark, respectively (P < 0.001). The comparatively poor outcomes of patients refractory to induction therapy in the current era of novel agents suggests that this high-risk sub-population must be further studied for predictors of resistance and, when identified, should be targeted for clinical trials.
Index words: Neoplasia- myeloma and other plasma cell dyscrasias, New agents, Chemotherapy, Drug resistance
INTRODUCTION
The treatment landscape for multiple myeloma (MM) has changed dramatically in the past decade with introduction of new drug classes such as immunomodulatory drugs (IMiDs) and proteasome inhibitors (PIs), and widespread use of high-dose therapy and autologous stem cell transplant (ASCT). The impact of novel agents has been evident in all phases of the disease, and has been particularly noticeable in the response to initial therapy. Whereas conventional therapies were associated with response rates only slightly better than 50%, novel agents have made it possible for an increasing number of patients to achieve complete response (CR) prior to ASCT [1–5]. Rapid and effective control of the disease, along with reversal of myeloma-related complications such as renal insufficiency, has been instrumental in the improvement of overall survival (OS). Despite the efficacy of these drugs, a small proportion of patients fail to achieve at least a partial response to initial therapy, and are considered to have primary refractory disease. The prognostic relevance of response to induction therapy is a subject of debate, with several early studies showing an absence of benefit among primary responders [6–10]. This has been further observed in the context of high-dose therapy and ASCT, suggesting that this approach may be able to overcome resistance to conventional therapies. These previous reports were generated prior to common use of IMiDs and PIs, and therefore, the impact of novel therapies has not been fully considered. In this study, we evaluated patients treated at our institution after 2006 to determine whether the degree of response to initial therapy altered outcomes in the era of novel agents.
METHODS
Patients
Relevant demographic, clinical, and laboratory characteristics of patients treated for MM at the Mayo Clinic (Rochester, MN) are maintained in a research database that is continuously updated by providers. When patients are followed-up at outside institutions, annual letters are sent to patients requesting updates regarding disease status. For the purpose of this analysis, we identified all consecutive patients with newly diagnosed MM who were seen at the Mayo Clinic within 30 days of diagnosis and started treatment between January 1, 2006 and May 31, 2014. For evaluable patients, initial and subsequent regimens were recorded, along with corresponding start and end dates. Other clinical and laboratory variables were collected from the medical records. The study was conducted with the approval of the Mayo Clinic Institutional Review Board.
Disease definitions
Best response to initial treatment regimen was determined based on the criteria defined by the International Myeloma Working Group (IMWG) [11,12]. Patients were considered primary refractory if they only achieved stable disease (SD) or progressive disease (PD) with front-line treatment. High-risk FISH was defined as the presence of del17p, t(4;14), t(14;16), or t(14;20).
Statistical analysis
Statistical analyses were performed using JMP 10.0.0 (SAS Institute Inc., Cary, NC). Kaplan-Meier curves were generated for analyzing OS, and the log-rank test was used to compare survival curves [13]. Two-sided Fisher exact tests were used to compare differences between nominal variables, and the Mann-Whitney U test or the Kruskal-Wallis test was used for comparison of continuous variables. The significance level was considered to be less than 0.05. Multivariable analyses were performed using the Cox proportional hazards model. In order to diminish the impact of responder analysis, additional landmark analyses were performed including only patients with a follow-up of at least four months from start of treatment.
RESULTS
Patient characteristics
Between January 1, 2006 and May 31, 2014, 816 patients with newly diagnosed MM were seen at the Mayo Clinic and had consented to use of their medical records. The median age of the study cohort was 67 years (range, 29 to 93 years), with 56% older than age 65. The median age of the primary refractory group was 67 years (range, 32 to 88 years) and the median age of the primary responder group was 65 years (range, 29 to 93 years). Fifty-nine percent of patients in the entire cohort were male. The median estimated follow up for the entire cohort was 4.6 years (95% CI; 4.3, 4.9); 331 (41%) were alive at the time of analysis. Laboratory characteristics at diagnosis are presented in Supplementary Table 1. Overall, 754 (92%) patients had received an IMiD, a PI, or both as part of their initial therapy; the distribution of induction chemotherapy regimens is provided in Table 1. Of the 62 patients who did not receive a novel agent with induction, 44 (71%) received additional chemotherapy and were evaluable in our study. Of these 44 patients, 42 (95%) received a novel agent as part of second line therapy.
Table 1.
Distribution of chemotherapy regimens
| Induction regimen | Number of patients, n = 816 |
|---|---|
| IMiD | 489 (59.9%) |
| Lenalidomide dexamethasone | 382 |
| Lenalidomide, cyclophosphamide, dexamethasone | 38 |
| Thalidomide, melphalan, prednisone | 21 |
| Lenalidomide, melphalan, prednisone | 20 |
| Thalidomide dexamethasone | 20 |
| Lenalidomide | 6 |
| Pomalidomide dexamethasone | 1 |
| Lenalidomide bendamustine | 1 |
| PI | 185 (22.6%) |
| Bortezomib, cyclophosphamide, dexamethasone | 110 |
| Bortezomib dexamethasone | 63 |
| Bortezomib, doxorubicin, dexamethasone | 4 |
| Bortezomib, melphalan, prednisone | 3 |
| Bortezomib | 2 |
| Ixazomib, cyclophosphamide, dexamethasone | 2 |
| Bortezomib, cyclophosphamide, prednisone | 1 |
| IMiD and PI | 80 (9.8%) |
| Bortezomib, lenalidomide, dexamethasone | 59 |
| Bortezomib, thalidomide, dexamethasone | 8 |
| Carfilzomib, thalidomide, cyclophosphamide, dexamethasone | 5 |
| VDT-PACE | 3 |
| Ixazomib, lenalidomide, dexamethasone | 3 |
| Bortezomib, lenalidomide, cyclophosphamide, dexamethasone | 1 |
| Carfilzomib, lenalidomide, cyclophosphamide, dexamethasone | 1 |
| No novel agent | 62 (7.6%) |
| Dexamethasone | 31 |
| Melphalan prednisone | 26 |
| Melphalan dexamethasone | 2 |
| Cyclophosphamide prednisone | 1 |
| Cyclophosphamide dexamethasone | 1 |
| Prednisone | 1 |
IMiD indicates immunomodulatory drug; PI, proteosome inhibitor; and VDT-PACE, bortezomib, dexamethasone, lenalidomide, cisplatin, doxorubicin, cyclophosphamide, and etoposide
Response to initial therapy and outcomes
Best response to initial treatment could be assessed in 669 (82%) patients. Of these, 122 (18%) achieved CR, 134 (20%) very good partial response (VGPR), and 301 (45%) partial response (PR). The remaining 112 (17%) patients were primary refractory, with 100 (15%) achieving SD and 12 (2%) with PD to initial therapy. Primary refractory disease was seen in 16% of those receiving a novel agent, compared with 28% of those not receiving a novel agent (P < 0.01).
The median OS for the cohort was 5.7 years (95% CI; 5.2, 6.3) from start of initial therapy. The median OS from start of therapy was significantly shorter for the primary refractory group at 3.6 years (95% CI; 2.8, 4.8) compared with 7.6 years (95% CI; 6.0, 8.6) for the responding patients (P < 0.001, Figure 1A). Among the 605 evaluable patients receiving an IMiD or PI as part of the initial therapy, the median OS for the primary refractory group was 3.6 years (95% CI; 2.8, 4.9) compared with 7.9 years [95% CI; 6.4, not reached (NR)] (P < 0.001, Figure 1B). Given the potential biases inherent to responder vs non-responder studies, we performed a landmark analysis of the cohort at four months from the start of treatment [14]. The decision to perform the landmark analysis at four months was based on the typical duration of initial therapy in patients undergoing early ASCT. Although this study was not limited to only those undergoing ASCT, this time point provided sufficient time for assessment of response to frontline therapy, and diminished the impact of those experiencing early mortality on therapy. Among the 660 patients evaluable at this time point, the median OS for primary refractory patients was 4.2 years (95% CI; 2.9, 4.9) compared with 7.6 years (95% CI; 6.0, 8.6) (P < 0.001, Figure 2A). We also examined the outcomes based on response depth, again using the landmark at four months. The median OS for patients achieving a CR, VGPR, PR or less than PR was NR, 6.1, 6.4, and 4.2 years respectively (P < 0.001, Figure 2B).
Figure 1. Overall survival from start of therapy.
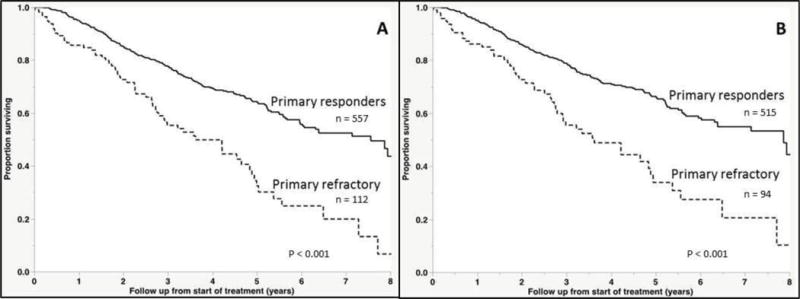
(A) Kaplan-Meier curves demonstrating differences in overall survival between responders and non-responders to induction therapy in the entire cohort. (B) Overall survival excluding those who did not receive a novel agent with induction.
Figure 2. Overall survival in landmark investigation.
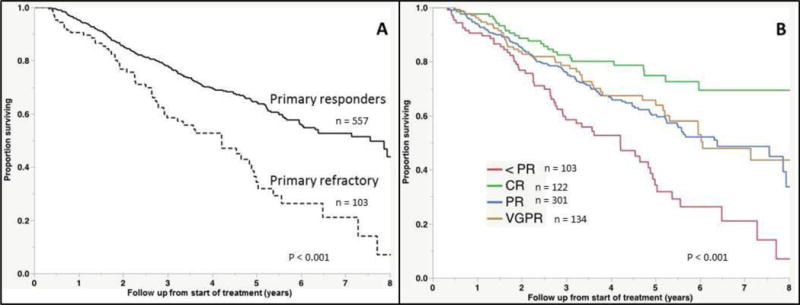
(A) Kaplan-Meier curves demonstrating differences in overall survival between responders and non-responders to induction therapy, including only those who were alive at four months after start of treatment. (B) Overall survival in landmark investigation, with groups separated according to depth of response.
We then explored potential disease characteristics associated with lack of response to initial therapy. Baseline characteristics including age, International Scoring System (ISS) stage 3 [15], abnormal LDH (> upper limit of normal), bone marrow plasma cell (BMPC) percentage > 60%, plasma cell labeling index (PCLI) > 1%, serum creatinine ≥ 2.0 mg/dL, high-risk FISH, and FLC difference (FLC-diff) were considered, but only lack of use of a novel agent as part of initial therapy was associated with primary refractoriness. In a univariable analysis, age > 65 years, ISS stage 3, abnormal LDH, BMPC > 60%, PCLI > 1%, serum creatinine ≥ 2.0 mg/dL, high-risk FISH, and primary refractoriness were all associated with increased hazard of death. In a multivariable analysis restricted only to those patients receiving a novel drug with induction, only age > 65 years, abnormal LDH, and primary refractoriness were independently prognostic for OS (Table 2).
Table 2.
Prognostic factors for overall survival
| Prognostic factor | Univariable analysis | Multivariable analysis* | ||
|---|---|---|---|---|
|
| ||||
| HR | P | HR | P | |
| Older than 65 years | 2.0 | < 0.001 | 2.1 | < 0.001 |
| Serum creatinine at least 2 mg/dL | 1.9 | 0.001 | 1.9 | 0.14 |
| ISS Stage 3 | 2.2 | < 0.001 | 1.4 | 0.25 |
| LDH over upper limit of normal | 1.8 | < 0.001 | 1.9 | 0.02 |
| PCLI at least 1% | 1.5 | 0.006 | 1.3 | 0.34 |
| BMPC at least 60% | 1.4 | 0.02 | 0.9 | 0.63 |
| High-risk FISH | 1.8 | 0.002 | 1.5 | 0.13 |
| Primary refractory MM | 2.3 | < 0.001 | 3.2 | < 0.001 |
Multivariable analysis restricted to patients receiving a novel agent with induction.
ISS indicates international staging system; LDH, lactate dehydrogenase; PCLI, plasma cell labeling index; BMPC, bone marrow plasma cell; and FISH, fluorescent in situ hybridization
Outcomes of primary refractory patients
The outcomes among primary refractory patients were specifically examined in the context of subsequent therapies. Among the 112 patients with primary refractory disease, 24 (21%) proceeded directly to ASCT after the initial regimen, while 75 (67%) received an alternate line of chemotherapy; the remaining 13 (12%) patients either died while receiving induction therapy, or elected to pursue supportive care. The 3-year OS from start of initial treatment for those going to ASCT directly vs another regimen was 67% vs 60%, (P = not significant, Supplementary Figure 1A). In the patients who did not directly proceed to transplant, the most common secondary regimens included bortezomib and dexamethasone (18 patients, 24%), lenalidomide and dexamethasone (14 patients, 19%), and cyclophosphamide, bortezomib, and dexamethasone (11 patients, 15%). The remaining patients received a variety of different regimens as second-line treatment. Overall, 53 patients (47%) underwent ASCT either as second line therapy or later. The median OS from start of initial treatment for this group of patients was 5.4 years (95% CI 4.2, NR) compared with 2.3 years (95% CI; 1.8, 3.6) for the rest (P < 0.001, Supplementary Figure 1B). The beneficial effect of ASCT in the primary refractory group was comparable to that seen in the non-refractory population, with 67% (95% CI; 44, 82) and 74% (95% CI; 41, 91) reduction in the risk of death for the two groups, respectively (Supplementary Figure 1B, C).
DISCUSSION
The advent of novel agents has transformed the therapeutic approach for patients with MM. While the disease remains incurable, considerable progress has been made in recent years, largely due to the success of IMiDs and proteosome inhibitors [16]. Early studies demonstrated response and survival benefit with these agents in relapsed or refractory disease [17–25]. This has translated into increased use of novel therapies as front-line treatment, replacing conventional therapies which had shown comparatively modest efficacy. This study is the first of its kind to evaluate the prognostic impact of primary refractoriness to induction regimens including IMiDs and PIs, and the results suggest that absence of response to initial treatment portends worse outcomes, with non-responders experiencing decreased median survival that is both statistically and clinically significant. Differences in OS were observed in the analysis of the entire cohort and in the analysis of patients specifically refractory to novel agents. Importantly, these differences were preserved in the four-month landmark investigation. In both our univariable and multivariable analysis, primary refractoriness carried the strongest hazard of death, underscoring the prognostic significance of response in the current era.
Our findings understandably differ from those of earlier studies [6–10]. Therapies employed prior to the introduction of targeted agents were poor, both in terms of eliciting response and extending survival, especially in patients ineligible for transplant. Even among those responding to conventional agents, depth of response was not clearly linked to outcomes [8–10, 26], so it is therefore not surprising that induction response has historically been considered inconsequential. This perspective is changing with the widespread adoption of agents consistently shown to prolong survival. In addition to controlling the underlying disease and related complications, these drugs may modify the natural disease course, further conferring benefit when used in a frontline setting.
The 83% of patients achieving at least a PR in our study is comparable to the robust response rate that has been previously observed with novel agents [27–29]. The prognostic benefit of depth of response beyond PR has not been extensively studied in the context of newer therapies. In the present study, median OS was longest for patients achieving CR, consistent with previously published reports [30, 31], but outcomes were similar between those attaining either PR or VGPR. Recent clinical trial data has suggested a benefit with deeper response, though improved OS with VGPR over PR has never been truly established. In a post-hoc analysis of the IFM 2005-01 trial, patients failing to achieve at least VGPR during induction with bortezomib and dexamethasone were found to experience a shorter progression-free survival (PFS), but data on OS were not reported [32]. In a retrospective analysis of two phase III trials (MM-009 and MM-010), patients with either CR or VGPR to treatment with lenalidomide and dexamethasone in a relapsed setting experienced improved PFS and OS compared to those with PR; direct comparison of VGPR alone to PR was not attempted [33]. Taken together, the available data reinforce the predictive value of achieving CR in treatment with novel agents, while the impact of response better than PR (but less than CR) on survival is less certain.
Factors predisposing to primary refractory MM, particularly in treatment with IMiDs and Pis, remain undefined. Aside from absent novel agent use, none of the evaluated clinical characteristics were found to predict response to induction. Notably, while high-risk FISH was found to predict for OS in our univariable analysis, it did not associate with primary refractoriness. This is consistent with the results of other studies, which have demonstrated the ability of novel agents to overcome traditional sources of resistance [34–36]. Historically, low proliferative activity, aneuploid clones, and mutations of certain oncogenes and cell signaling molecules have been associated with treatment failure [37–44]. These risk factors were identified before common use of novel therapies, and whether they continue to hold prognostic value in the current era requires additional investigation.
The retrospective, non-randomized nature of this study limits the scope of its conclusions. However, the relatively large sample size and the similarity of success observed with novel agents in clinical trials allay some concerns about bias. Most importantly, our findings provide further evidence that patients with newly-diagnosed MM are living longer in recent years, building on our prior results [45]. The present study also supports the practice of following M protein decrement in response to therapy, despite arguments to the contrary made in years past. Mere stabilization of disease should raise concerns about treatment course and prompt consideration of alternate lines of treatment, although the best approach to second line therapy remains unknown. We found no survival difference in those who proceeded directly to transplant compared with those who received additional lines of chemotherapy after failing to respond to frontline therapy. Primary refractory patients who underwent ASCT at some point during their treatment course performed better than those who did not, consistent with the benefit observed with primary responders. For appropriate candidates, ASCT should remain a priority, and confirmation of this approach should be attempted in a randomized, prospective setting.
In spite of the triumphs achieved in the management of MM in recent years, our study highlights a group for which outcomes continue to be unsatisfactory. Predictors of resistance and best management strategies remain unclear, and these questions should be specifically addressed in clinical trials designed for this high-risk sub-population.
Supplementary Material
Supplementary Figure 1. Impact of ASCT on overall survival. (A) Kaplan-Meier curves comparing overall survival between primary refractory patients who proceeded directly to ASCT after induction therapy and those who received additional chemotherapy. (B) Overall survival of primary refractory patients who received ASCT at any point compared with those who did not. (C) Overall survival of responding patients who received ASCT at any point compared with those who did not.
Acknowledgments
This work was supported in part by the Mayo Clinic Hematological Malignancies Program, R01 CA 168762-03 (S.K.K. and S.V.R.), R01 CA 107476-11 (S.K.K. and S.V.R.) and R01 CA 167511-2 (S.K.K.).
References
- 1.Combination chemotherapy versus melphalan plus prednisone as treatment for multiple myeloma: an overview of 6,633 patients from 27 randomized trials. Myeloma Trialists’ Collaborative Group. J Clin Oncol. 1998;16:3832–3842. doi: 10.1200/JCO.1998.16.12.3832. [DOI] [PubMed] [Google Scholar]
- 2.Alexanian R, Barlogie B, Tucker S. VAD-based regimens as primary treatment for multiple myeloma. Am J Hematol. 1990;33:86–89. doi: 10.1002/ajh.2830330203. [DOI] [PubMed] [Google Scholar]
- 3.Dimopoulos MA, Pouli A, Zervas K, et al. Prospective randomized comparison of vincristine, doxorubicin and dexamethasone (VAD) administered as intravenous bolus injection and VAD with liposomal doxorubicin as first-line treatment in multiple myeloma. Ann Oncol. 2003;14:1039–1044. doi: 10.1093/annonc/mdg287. [DOI] [PubMed] [Google Scholar]
- 4.Wang L, Ran X, Wang B, et al. Novel agents-based regimens as induction treatment prior to autologous stem-cell transplantation in newly diagnosed multiple myeloma: a meta-analysis of randomized controlled trials. Hematol Oncol. 2012;30:57–61. doi: 10.1002/hon.1007. [DOI] [PubMed] [Google Scholar]
- 5.Huang H, Zhou L, Peng L, et al. Bortezomib-thalidomide-based regimens improved clinical outcomes without increasing toxicity as induction treatment for untreated multiple myeloma: a meta-analysis of phase III randomized controlled trials. Leuk Res. 2014;38:1048–1054. doi: 10.1016/j.leukres.2014.06.009. [DOI] [PubMed] [Google Scholar]
- 6.Baldini L, Radaelli F, Chiorboli O, et al. No correlation between response and survival in patients with multiple myeloma treated with vincristine, melphalan, cyclophosphamide, and prednisone. Cancer. 1991;68:62–67. doi: 10.1002/1097-0142(19910701)68:1<62::aid-cncr2820680112>3.0.co;2-6. [DOI] [PubMed] [Google Scholar]
- 7.Marmont F, Levis A, Falda M, Resegotti L. Original article: Lack of correlation between objective response and death rate in multiple myeloma patients treated with oral melphalan and prednisone. Ann Oncol. 1991;2:191–195. doi: 10.1093/oxfordjournals.annonc.a057902. [DOI] [PubMed] [Google Scholar]
- 8.Oivanen TM, Kellokumpu-Lehtinen P, Koivisto AM, et al. Response level and survival after conventional chemotherapy for multiple myeloma: a Finnish Leukaemia Group study. Eur J Haematol. 1999;62:109–116. doi: 10.1111/j.1600-0609.1999.tb01730.x. [DOI] [PubMed] [Google Scholar]
- 9.Riccardi A, Mora O, Tinelli C, et al. Response to first-line chemotherapy and long-term survival in patients with multiple myeloma: results of the MM87 prospective randomised protocol. Eur J Cancer. 2003;39:31–37. doi: 10.1016/s0959-8049(02)00529-4. [DOI] [PubMed] [Google Scholar]
- 10.Durie BG, Jacobson J, Barlogie B, Crowley J. Magnitude of response with myeloma frontline therapy does not predict outcome: importance of time to progression in southwest oncology group chemotherapy trials. J Clin Oncol. 2004;22:1857–1863. doi: 10.1200/JCO.2004.05.111. [DOI] [PubMed] [Google Scholar]
- 11.Durie BG, Harousseau JL, Miguel JS, et al. International uniform response criteria for multiple myeloma. Leukemia. 2006;20:1467–1473. doi: 10.1038/sj.leu.2404284. [DOI] [PubMed] [Google Scholar]
- 12.Kyle RA, Rajkumar SV. Criteria for diagnosis, staging, risk stratification and response assessment of multiple myeloma. Leukemia. 2008;23:3–9. doi: 10.1038/leu.2008.291. [DOI] [PMC free article] [PubMed] [Google Scholar]
- 13.Kaplan EL, Meier P. Nonparametric Estimation from Incomplete Observations. J Am Stat Assoc. 1958;53:457–481. [Google Scholar]
- 14.Anderson JR, Cain KC, Gelber RD. Analysis of survival by tumor response. J Clin Oncol. 1983;1:710–719. doi: 10.1200/JCO.1983.1.11.710. [DOI] [PubMed] [Google Scholar]
- 15.Greipp PR, Miguel JS, Durie BGM, et al. International Staging System for Multiple Myeloma. J Clin Oncol. 2005;23:3412–3420. doi: 10.1200/JCO.2005.04.242. [DOI] [PubMed] [Google Scholar]
- 16.Pulte D, Gondos A, Brenner H. Improvement in survival of older adults with multiple myeloma: results of an updated period analysis of SEER data. Oncologist. 2011;16:1600–1603. doi: 10.1634/theoncologist.2011-0229. [DOI] [PMC free article] [PubMed] [Google Scholar]
- 17.Singhal S, Mehta J, Desikan R, et al. Antitumor activity of thalidomide in refractory multiple myeloma. N Engl J Med. 1999;341:1565–1571. doi: 10.1056/NEJM199911183412102. [DOI] [PubMed] [Google Scholar]
- 18.Rajkumar SV, Fonseca R, Dispenzieri A, et al. Thalidomide in the treatment of relapsed multiple myeloma. Mayo Clin Proc. 2000;75:897–901. doi: 10.4065/75.9.897. [DOI] [PubMed] [Google Scholar]
- 19.Tosi P, Ronconi S, Zamagni E, et al. Salvage therapy with thalidomide in multiple myeloma patients relapsing after autologous peripheral blood stem cell transplantation. Haematologica. 2001;86:409–413. [PubMed] [Google Scholar]
- 20.Kumar S, Gertz MA, Dispenzieri A, et al. Response rate, durability of response, and survival after thalidomide therapy for relapsed multiple myeloma. Mayo Clin Proc. 2003;78:34–39. doi: 10.4065/78.1.34. [DOI] [PubMed] [Google Scholar]
- 21.Richardson PG, Sonneveld P, Schuster MW, et al. Bortezomib or high-dose dexamethasone for relapsed multiple myeloma. N Engl J Med. 2005;352:2487–2498. doi: 10.1056/NEJMoa043445. [DOI] [PubMed] [Google Scholar]
- 22.Richardson PG, Sonneveld P, Schuster MW, et al. Safety and efficacy of bortezomib in high-risk and elderly patients with relapsed multiple myeloma. Br J Haematol. 2007;137:429–435. doi: 10.1111/j.1365-2141.2007.06585.x. [DOI] [PubMed] [Google Scholar]
- 23.Richardson PG, Sonneveld P, Schuster M, et al. Extended follow-up of a phase 3 trial in relapsed multiple myeloma: final time-to-event results of the APEX trial. Blood. 2007;110:3557–3560. doi: 10.1182/blood-2006-08-036947. [DOI] [PubMed] [Google Scholar]
- 24.Dimopoulos M, Spencer A, Attal M, et al. Lenalidomide plus dexamethasone for relapsed or refractory multiple myeloma. N Engl J Med. 2007;357:2123–2132. doi: 10.1056/NEJMoa070594. [DOI] [PubMed] [Google Scholar]
- 25.Weber DM, Chen C, Niesvizky R, et al. Lenalidomide plus dexamethasone for relapsed multiple myeloma in North America. N Engl J Med. 2007;357:2133–2142. doi: 10.1056/NEJMoa070596. [DOI] [PubMed] [Google Scholar]
- 26.Blade J, Lopez-Guillermo A, Bosch F, et al. Impact of response to treatment on survival in multiple myeloma: results in a series of 243 patients. Br J Haematol. 1994;88:117–121. doi: 10.1111/j.1365-2141.1994.tb04986.x. [DOI] [PubMed] [Google Scholar]
- 27.Mateos MV, Oriol A, Martinez-Lopez J, et al. Bortezomib, melphalan, and prednisone versus bortezomib, thalidomide, and prednisone as induction therapy followed by maintenance treatment with bortezomib and thalidomide versus bortezomib and prednisone in elderly patients with untreated multiple myeloma: a randomised trial. Lancet Oncol. 2010;11:934–941. doi: 10.1016/S1470-2045(10)70187-X. [DOI] [PubMed] [Google Scholar]
- 28.Moreau P, Avet-Loiseau H, Facon T, et al. Bortezomib plus dexamethasone versus reduced-dose bortezomib, thalidomide plus dexamethasone as induction treatment before autologous stem cell transplantation in newly diagnosed multiple myeloma. Blood. 2011;118:5752–5758. doi: 10.1182/blood-2011-05-355081. [DOI] [PubMed] [Google Scholar]
- 29.Garderet L, Iacobelli S, Moreau P, et al. Superiority of the triple combination of bortezomib-thalidomide-dexamethasone over the dual combination of thalidomide-dexamethasone in patients with multiple myeloma progressing or relapsing after autologous transplantation: the MMVAR/IFM 2005-04 Randomized Phase III Trial from the Chronic Leukemia Working Party of the European Group for Blood and Marrow Transplantation. J Clin Oncol. 2012;30:2475–2482. doi: 10.1200/JCO.2011.37.4918. [DOI] [PubMed] [Google Scholar]
- 30.Dingli D, Pacheco JM, Nowakowski GS, et al. Relationship between depth of response and outcome in multiple myeloma. J Clin Oncol. 2007;25:4933–4937. doi: 10.1200/JCO.2007.11.7879. [DOI] [PubMed] [Google Scholar]
- 31.Gay F, Larocca A, Wijermans P, et al. Complete response correlates with long-term progression-free and overall survival in elderly myeloma treated with novel agents: analysis of 1175 patients. Blood. 2011;117:3025–3031. doi: 10.1182/blood-2010-09-307645. [DOI] [PubMed] [Google Scholar]
- 32.Moreau P, Attal M, Pegourie B, et al. Achievement of VGPR to induction therapy is an important prognostic factor for longer PFS in the IFM 2005-01 trial. Blood. 2011;117:3041–3044. doi: 10.1182/blood-2010-08-300863. [DOI] [PubMed] [Google Scholar]
- 33.Harousseau JL, Dimopoulos MA, Wang M, et al. Better quality of response to lenalidomide plus dexamethasone is associated with improved clinical outcomes in patients with relapsed or refractory multiple myeloma. Haematologica. 2010;95:1738–1744. doi: 10.3324/haematol.2009.015917. [DOI] [PMC free article] [PubMed] [Google Scholar]
- 34.Jacobus SJ, Kumar S, Uno H, et al. Impact of high-risk classification by FISH: an eastern cooperative oncology group (ECOG) study E4A03. Br J Haematol. 2011;155:340–348. doi: 10.1111/j.1365-2141.2011.08849.x. [DOI] [PMC free article] [PubMed] [Google Scholar]
- 35.Jagannath S, Richardson PG, Sonneveld P, et al. Bortezomib appears to overcome the poor prognosis conferred by chromosome 13 deletion in phase 2 and 3 trials. Leukemia. 2007;21:151–157. doi: 10.1038/sj.leu.2404442. [DOI] [PubMed] [Google Scholar]
- 36.Avet-Loiseau H, Leleu X, Roussel M, et al. Bortezomib plus dexamethasone induction improves outcome of patients with t(4;14) myeloma but not outcome of patients with del(17p) J Clin Oncol. 2010;28:4630–4634. doi: 10.1200/JCO.2010.28.3945. [DOI] [PubMed] [Google Scholar]
- 37.Drewinko B, Alexanian R, Boyer H, et al. The growth fraction of human myeloma cells. Blood. 1981;57:333–338. [PubMed] [Google Scholar]
- 38.Montecucco C, Riccardi A, Merlini G, et al. Plasma cell DNA content in multiple myeloma and related paraproteinemic disorders. Relationship with clinical and cytokinetic features Eur J Cancer Clin Oncol. 1984;20:81–90. doi: 10.1016/0277-5379(84)90038-5. [DOI] [PubMed] [Google Scholar]
- 39.Riccardi A, Ucci G, Luoni R, et al. Bone marrow biopsy in monoclonal gammopathies: correlations between pathological findings and clinical data. The Cooperative Group for Study and Treatment of Multiple Myeloma J Clin Pathol. 1990;43:469–475. doi: 10.1136/jcp.43.6.469. [DOI] [PMC free article] [PubMed] [Google Scholar]
- 40.Ucci G, Petrini M, Riccardi A, et al. Expression of p170 protein in multiple myeloma: a clinical study. Hematol Oncol. 1992;10:213–220. doi: 10.1002/hon.2900100312. [DOI] [PubMed] [Google Scholar]
- 41.Hata H, Matsuzaki H, Yoshida M, et al. Hyperdiploid myeloma cell as an indicator of poor prognosis and drug refractoriness. Int J Hematol. 1997;66:219–226. doi: 10.1016/s0925-5710(97)00033-9. [DOI] [PubMed] [Google Scholar]
- 42.Bataille R, Harousseau J-L. Multiple Myeloma. N Engl J Med. 1997;336:1657–1664. doi: 10.1056/NEJM199706053362307. [DOI] [PubMed] [Google Scholar]
- 43.Damiano JS, Dalton WS. Integrin-mediated drug resistance in multiple myeloma. Leuk Lymphoma. 2000;38:71–81. doi: 10.3109/10428190009060320. [DOI] [PubMed] [Google Scholar]
- 44.Cheung WC, Van Ness B. The bone marrow stromal microenvironment influences myeloma therapeutic response in vitro. Leukemia. 2001;15:264–271. doi: 10.1038/sj.leu.2402022. [DOI] [PubMed] [Google Scholar]
- 45.Kumar SK, Rajkumar SV, Dispenzieri A, et al. Improved survival in multiple myeloma and the impact of novel therapies. Blood. 2007;111:2516–2520. doi: 10.1182/blood-2007-10-116129. [DOI] [PMC free article] [PubMed] [Google Scholar]
Associated Data
This section collects any data citations, data availability statements, or supplementary materials included in this article.
Supplementary Materials
Supplementary Figure 1. Impact of ASCT on overall survival. (A) Kaplan-Meier curves comparing overall survival between primary refractory patients who proceeded directly to ASCT after induction therapy and those who received additional chemotherapy. (B) Overall survival of primary refractory patients who received ASCT at any point compared with those who did not. (C) Overall survival of responding patients who received ASCT at any point compared with those who did not.