Abstract
The biologic effects of estrogens are transduced by two estrogen receptors (ERs), ERα and ERβ, which function in dimer forms. The ERα/α homodimer promotes and the ERβ/β inhibits estrogen-dependent growth of mammary epithelial cells; the functions of ERα/β heterodimers remain elusive. Using compounds that promote ERα/β heterodimerization, we have previously shown that ERα/β heterodimers appeared to inhibit tumor cell growth and migration in vitro. Further dissection of ERα/β heterodimer functions was hampered by the lack of ERα/β heterodimer-specific ligands. Herein, we report a multistep workflow to identify the selective ERα/β heterodimer-inducing compound. Phytoestrogenic compounds were first screened for ER transcriptional activity using reporter assays and ER dimerization preference using a bioluminescence resonance energy transfer assay. The top hits were subjected to in silico modeling to identify the pharmacophore that confers ERα/β heterodimer specificity. The pharmacophore encompassing seven features that are potentially important for the formation of the ERα/β heterodimer was retrieved and subsequently used for virtual screening of large chemical libraries. Four chemical compounds were identified that selectively induce ERα/β heterodimers over their respective homodimers. Such ligands will become unique tools to reveal the functional insights of ERα/β heterodimers.
Introduction
The biological effects of estrogenic compounds are mediated by two estrogen receptors (ERs), namely ERα and ERβ. These receptors are expressed in a cell-type and tissue-specific manner; however, they can also colocalize within the same cell, and their presence varies based on different disease states (Leygue et al., 1998; Lau et al., 1999; Weihua et al., 2003; Powell et al., 2012; Nilsson and Gustafsson, 2013). Both ERs share a conserved nuclear receptor domain structure that encompasses a DNA binding domain, ligand-binding domain (LBD), a central hinge region, and two activation functional domains. The ligand binding to ERα or ERβ induces a conformational change that leads to receptor dimerization, where either homodimers (ERα/α or ERβ/β) or heterodimers (ERα/β) can be formed.
The existence of the ERα/β heterodimer was first described 20 years ago using in vitro translated receptors and an estrogen response element (ERE) in a gel shift assay. Cowley et al. (1997) showed that ER heterodimers could bind to a consensus ERE and recruit coactivators in vitro. Similar observations were made by others (Pace et al., 1997; Tremblay et al., 1999). Pettersson et al. (1997) showed direct interaction between ERβ and ERα in a glutathione S-transferase pull-down assay and binding of the heterodimer to DNA. Two dimerization domains were mapped to the DNA binding domain and LBD (Brzozowski et al., 1997; Pace et al., 1997). ER heterodimers were shown to form in a ligand-dependent and -independent manner in vitro (Pace et al., 1997). Recent technical advances confirmed the formation of the ERα/β heterodimer in vivo. Our laboratory developed a bioluminescence resonance energy transfer (BRET) assay to monitor ER dimerization in live cells (Powell and Xu, 2008). BRET assays revealed that the types of ER dimer pair being formed depend on the chemical characteristics of the ligand and its concentration (Powell and Xu, 2008). Moreover, ERα/β heterodimers have been detected in vivo using molecular imaging techniques (Paulmurugan et al., 2011) and in breast cancer tissues using proximity ligation assay (Iwabuchi et al., 2017). Evidence also shows that the ERα/β heterodimer is transcriptionally active and may regulate a distinct set of genes from their respective homodimers (Tremblay et al., 1999).
In contrast to the established role that the ERα/α homodimer is a driver of estrogen-mediated cellular proliferation and ERβ/β homodimers elicit an antiproliferative and proapoptotic effect, the function of ERα/β heterodimers in the biologic processes is the least understood. Unlike the ERα/α and ERβ/β homodimers, where subtype-specific ligands for ERα and ERβ aided in elucidating their function (Lindberg et al., 2003; Weihua et al., 2003), ligands that specifically induce ERα/β heterodimers have not been identified, largely due to the absence of a full-length crystal structure for the ERα/β heterodimer.
Indirect evidence suggesting that ERα/β heterodimers might have an antiproliferative role in breast cancer cells have previously been reported (Hall and McDonnell, 1999; Powell et al., 2012). Endoxifen, the primary metabolite of tamoxifen with growth inhibitory effects, stabilizes ERβ and induces the formation of ERα/β heterodimers in cells expressing both ERs (Wu et al., 2011). Furthermore, high-throughput BRET assays identified a phytoestrogen (i.e., cosmosiin) that favors ERα/β heterodimer formation (Powell et al., 2012). This ERα/β heterodimer-inducing compound elicited antiproliferative effects in prostate and breast cancer cells. Although cosmosiin induces the formation of ERα/β heterodimers but not the pro-proliferative ERα/α homodimers, it is only effective at high concentrations (e.g., 10 μM) and also slightly induces ERβ/β homodimers (Powell et al., 2012). More potent and selective ERα/β heterodimer-inducing ligands are needed to elucidate the biologic functions of heterodimers.
Herein, we describe a multistep screening strategy (i.e., cell-based assays and in silico modeling) to identify ERα/β heterodimer-selective ligands. Reporter assays and BRET assays were employed to screen a small library of flavonoid-type phytoestrogenic compounds, from which a pharmacophore model was generated using the SYBYL GALAHAD (i.e., genetic algorithm with linear assignment of hypermolecular alignment of database) program (Tripos, St. Louis, MO). The pharmacophore model was subsequently used in a three-dimensional (3D) search query of two commercial chemical databases to identify new active structures. Four compounds were identified from the in silico screen that selectively induce ERα/β heterodimers. We showed that the representative compounds induce expression of putative ERα/β target genes by corecruiting ERα and ERβ to the target gene promoter. Such ERα/β-selective compounds will be exploited to determine the biologic functions of ERα/β heterodimers, their downstream effectors, and target genes.
Materials and Methods
Cell Culture and Chemicals.
Cell culture media were obtained from Invitrogen (Carlsbad, CA). HEK293 cells were maintained in Dulbecco’s modified Eagle’s medium supplemented with 10% Gibco fetal bovine serum (FBS) (Invitrogen) at 37°C and 5% CO2. T47D-KBLuc cells were routinely maintained in RPMI 1640 medium supplemented with 10% FBS and 100 U/ml (1%) penicillin/streptomycin. Experiments were conducted in phenol-free media and dextran charcoal stripped FBS purchased from Hyclone (Logan, UT).
Compounds were dissolved in 100% dimethylsulfoxide (DMSO) and finally diluted in culture medium prior to the assay. 17β-estradiol (E2) and ICI 182,780 were purchased from Sigma-Aldrich (St. Louis, MO). Thirty-one compounds used in our initial screening were a gift from the Lim Laboratory and have been previously described (Hyun et al., 2010; Hwang et al., 2011; Shin et al., 2011). They were chosen for screening based on their structural similarity to the lead compound cosmosiin, which was previously identified to induce ERα/β heterodimerization (Powell et al., 2012). Test compounds were purchased from ChemBridge (http://www.chembridge.com) and Maybridge (http://www.maybridge.com).
BRET Assays.
Dimerization of ERs was measured by BRET assays as previously described in Powell and Xu (2008). Briefly, HEK293 cells were transfected with either a single BRET fusion plasmid (pCMX-ERα-RLuc or pCMX-RLuc-ERβ) or cotransfected with Renilla luciferase (RLuc) and yellow fluorescent protein (YFP) BRET fusions (pCMX-ERα-RLuc+pCMX-YFP-ERβ for ERα/ERβ heterodimers; pCMX-ERα-RLuc+pCMX-ERα-YFP for ERα homodimers; or pCMX-RLuc-ERβ+pCMX-YFP-ERβ for ERβ homodimers). Twenty-four hours post-transfection, cells were trypsinized and plated in a 96-well white-bottom microplate and incubated with ligands for 1 hour. Coelenterazine h (Promega, Madison, WI) was added in phosphate-buffered saline at a final concentration of 5 µM, and 460 and 530 nm emission detection measurements were immediately taken at 0.1 second/wavelength read/well on a PerkinElmer Victor 3-V plate reader (Akron, OH). Similar assays were done using E2-binding defective mutants of the LBDs of ERα and ERβ, ERαG521R-RLuc, and YFP-ERβG491R. Each compound was an independent experiment tested in a dose response with three biologic replicates per dose. For each condition (ERα/α, ERβ/β, and ERα/β), two-way analysis of variance with random effect was conducted to obtain P values for each comparison of the individual compounds with DMSO controls. Then, these P values were adjusted by multiple comparisons analysis to control false discovery rate less than 0.05.
ER Luciferase Reporter Assays Using T47D-KBLuc Cells.
T47D-KBluc is a well-characterized cell line for the screening of estrogenic compounds (Wilson et al., 2004). These cells express both ERα and ERβ and have been stably transfected with pGL2.TATA.Inr.luc.neo, which contains three estrogen responsive elements upstream of a luciferase reporter gene. Cells were seeded in 96-well plates at an initial concentration of 1 × 10⁴ cells/well in RPMI 1640 phenol-free medium supplemented with 10% charcoal stripped FBS for 24 hours in 5% CO2 atmosphere at 37°C. Cells were allowed to attach overnight and media were removed and replaced with media containing 10 μM compound. Then, 10 nM E2 and 1% DMSO were used as positive and negative controls, respectively. The potent ER antagonist ICI 182,780 was used for counter-screen to determine ER specificity. Cells were incubated with compound for 18–24 hours at 37°C in 5% CO2. Following incubation with compounds, luciferase was measured using the Bright-Glo Luciferase Assay System (Promega) on a PerkinElmer Victor 3-V plate reader. Luciferase activity was normalized according to protein concentration. Values were expressed as fold change over DMSO (mean value of induction as a multiple of the value of vehicle controls) and error bars represent S.D.
Quantitative Real-Time Polymerase Chain Reaction.
Total RNA was extracted from the cells using Trizol reagent (Invitrogen). The first-strand cDNA was synthesized using the RevertAid First Strand cDNA Synthesis Kit (Thermo, Waltham, MA) according to the manufacturer’s instructions. Quantitative polymerase chain reaction was conducted using SYBR Green dye (Roche Scientific, Basel, Switzerland) and a CFX96 instrument (BioRad, Hercules, CA). The following primer sequences (IDT, Coralville, IA) were used in this study:
BAG1-qRT-F: GCCCAAGGATTTGCAAGCTG and
BAG1-qRT-R: CTGTGTCACACTCGGCTAGG;
ATP6V0E1-qRT-F: CCTCACTGTGCCTCTCATTGT and
ATP6V0E1-qRT-R: AGCAAACTGAACAGGTCACCA;
BAG-ChIP-F: AGGAAGCTCTGATAGAAGGCAGA and
BAG-ChIP-R: AGAACAGTCCACAGGAAGAGGT; and
ATP6V0E1-ChIP-F: CCCCTGGCAGTTTCGTCAC and
ATP6V0E1-ChIP-R: TCTTGTTCATAATTTGACTTTGGAG.
Chromatin Immunoprecipitation (ChIP).
Flag-tagged ERβ was stably expressed in MCF7 cells by retroviral induction. MCF7-ERβ cells were cultured in a 10-cm dish and crosslinked with 1% formaldehyde for 10 minutes at room temperature. Crosslink was quenched for 5 minutes at room temperature by the addition of glycine to a final concentration of 0.125 M. Anti-Flag antibody (Sigma-Aldrich) and anti-ERα (HC-20; Santa Cruz, Dallas, TX) were used for ChIP assays. ChIP assays were performed as described previously (Zeng and Xu, 2015; Zeng et al., 2016). The experiment was done in triplicate samples of biologic replicates. Statistical testing was performed using unpaired two-tailed Student’s t test analysis. Experiments were repeated at least twice. A value of P < 0.05 was considered statistically significant.
Fluorescence Polarization Competition Ligand-Binding Assays.
The binding affinity of ligands for ERα and ERβ were measured using the PolarScreen ER Competitive Binding Assay Kit (Invitrogen). Purified ERα and ERβ (30 and 20 nM), were incubated with serial dilutions of test compounds (1 mM to 10 nM) and fluorescein-labeled E2. Fluorescence polarization was measured using a Victor ×5 microplate reader (PerkinElmer). Approximate IC50 values were determined by GraphPad Prism Software (GraphPad Software Inc., La Jolla, CA) from competitive binding curves.
Preparation of the Initial Ligands.
All computational studies were done using the SYBYL molecular modeling package (Tripos) in a Stereo 3D Dell T5500 molecular graphics computer (Intel dual quad, Nvidia FX 4800 graphics). All of the structures used were built using the sketch module, energy minimized and prepared using SYBYL’s ligand preparation module. The quick 3D parameter was used where 3D coordinates were generated and charges were neutralized.
Generation of Ligand-Based Pharmacophore Hypothesis and Virtual Screening.
Pharmacophore hypothesis was generated using the GALAHAD module of the SYBYL software suite. There were seven compounds in the training set to generate the pharmacophore hypothesis. The GALAHAD module was run for 100 generations with a population size of 45, at least five molecules were required to hit for the program to consider it a pharmacophoric feature. Default values were used for all other settings. Between all of the models, the one with the best energy, sterics, and pharmacoric similarity values based on Pareto ranking was selected as the best model. For 3D virtual screening, the generated pharmacophore hypothesis model was converted into a 3D search query using the UNITY-3D module.
3D Virtual Screening of Two Commercial Databases.
The selected pharmacophore model was validated and converted into a UNITY query for pharmacophore-guided virtual screening studies. The query was then used for screening two commercial chemical databases, Maybridge (http://www.maybridge.com) and Chembrige (http://chembridge.com), which were obtained from the ZINC public database. A flexible 3D search was executed and no filters or restrictions were applied. The UNITY module uses a conformationally flexible 3D-searching algorithm to result in rapid identification of molecules that match with the given pharmacophore. Compounds that had their chemical groups spatially overlap with the features of the pharmacophore model were captured as hits. Subsequent hits were then confirmed to match all seven key pharmacophoric features by visual analysis. Hits were then ranked by Qfit and by the integrated ranking features in SYBYL.
Results
Identification of ER Agonists Using the T47D-KBluc Reporter Cell Line.
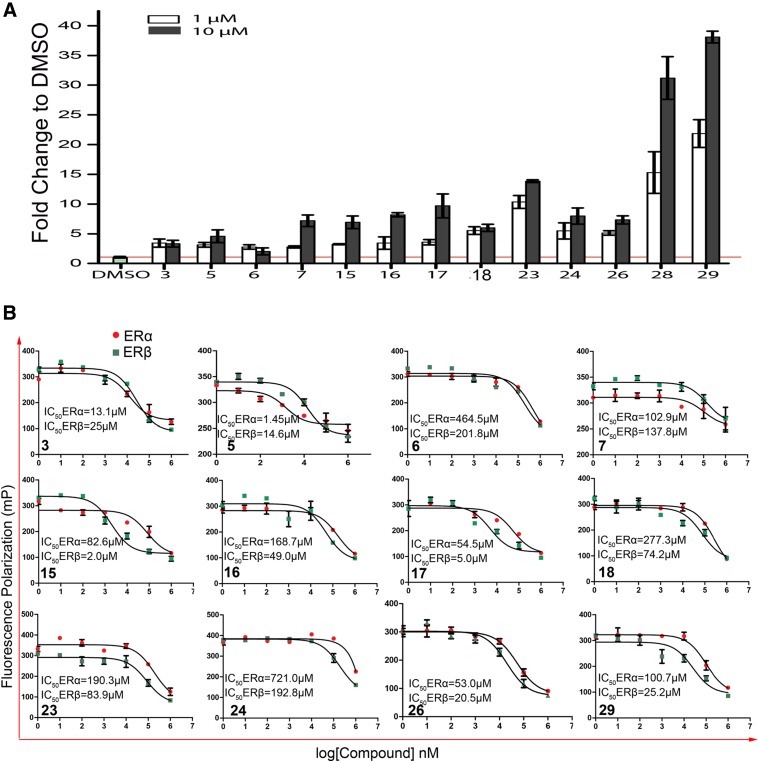
The T47D-KBluc breast cancer cell line is a well-characterized cell line that has an ERE-driven luciferase reporter stably integrated. It is considered a versatile cell system for screening estrogenic compounds because it expresses both ERα and ERβ (Wilson et al., 2004). Using this cell line, 37 flavonoids in the subclass chemical compound library (Table 1) were screened due to their structural similarity to cosmosiin, a previously identified ERα/β heterodimer–inducing compound (Powell et al., 2012). All compounds were tested at one final concentration of 10 μM, because at this concentration even weak estrogenic compounds are able to activate ER transcriptional activity in T47D-KBLuc (Powell et al., 2012). With a 2-fold cutoff, 13 out of 37 compounds from three out of the four subclasses were identified as hits (Fig. 1; Supplemental Fig. 1). Seven compounds in the flavone subset were identified as hits. Compared with the DMSO control, compounds 3, 5, 6, and 7 showed moderate activation, compounds 15 and 16 elicited almost 10-fold induction, and compound 17 elicited nearly 20-fold induction of ERE reporter. Three compounds (18, 23, and 24) in the flavanone subset and two compounds (26 and 29) in the isoflavone subset were retained as hits. Compound 28 is genistein, an isoflavone known to be an ER agonist that has been shown to induce all three ER dimer pairs (Powell and Xu, 2008). The 12 compounds were then subjected to a counter-screen in the presence of ER antagonist ICI 182,780. Cotreatment of ICI 182,780 completely ablated ERE-luciferase activation, demonstrating that their transcriptional response is ER dependent (Supplemental Fig. 2).
TABLE 1.
Core structures and names of flavonoid compounds used in this study
Thirty-seven flavonoid compounds from four different subclasses: flavones, flavanones, isoflavones, and chalcones were previously tested.
| Compound | Number | Nomenclature | R1 | R2 | R3 | Molecular Weight |
|---|---|---|---|---|---|---|
Flavone 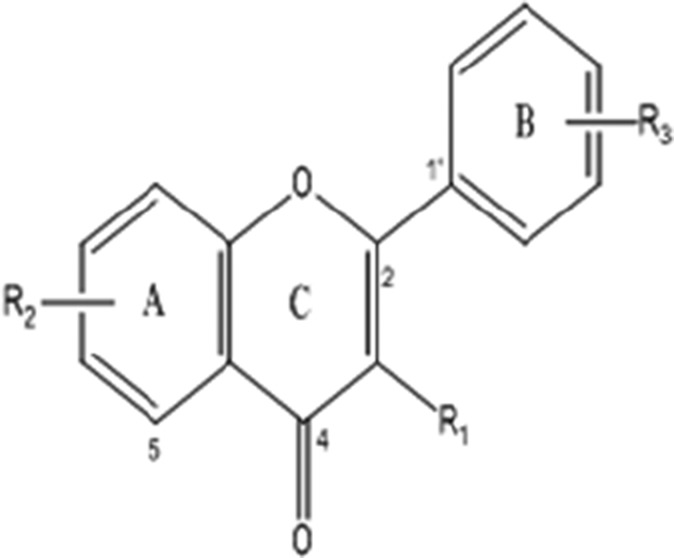
|
1 | Flavone | H | H | H | 222.24 |
| 2 | 5-Hydroxyflavone | H | 5-OH | H | 238.24 | |
| 3 | 2′,3′-Dihydroxyflavone | H | H | 2′,3′-Di-OH | 254.24 | |
| 4 | 2′,3′-Dimethoxyflavone | H | H | 2′,3′-Di-OCH3 | 282.29 | |
| 5 | 4′-Hydroxy-3′methoxyflavone | H | H | 4′-OH-3′-OCH3 | 268.26 | |
| 6 | 3′,5-Dihydroxyflavone | H | 5-OH | 3′-OH | 254.24 | |
| 7 | 4′-Hydroxy-5-methoxyflavone | H | 5-OCH3 | 3′-OH | 268.26 | |
| 8 | 5-Methoxyflavone | H | 5-OCH3 | H | 252.26 | |
| 9 | 4′,5,7-Trimethoxyflavone | H | 5,7-Di-OCH | 4′-OCH3 | 312.32 | |
| 10 | 8-Carboxyl-3-methylflavone | CH3 | 8-COOH | H | 280.27 | |
| 11 | 5,6-Benzoflavone | H | 5,6-Benzo | H | 272.3 | |
| 12 | 7,8-Benzoflavone | H | 7,8-Benzo | H | 272.3 | |
| 13 | 2′-Methoxy-ᾳ-naphthoflavone | H | 7,8-Benzo | 2′-OCH3 | 302.32 | |
| 14 | 3,3′,4′,5,7-Pentahydroxyflavone-8-O-glucoside (Gossypin) | OH | 5,7-Di-OH-8-O-Glucoside | 3′,4′-Di-OH | 480.38 | |
| 15 | 3,4′,5,7-Tetrahydroxyflavone (Kaempferol) | OH | 5,7-Di-OH | 4′-OH | 286.24 | |
| 16 | 5,7-Dihydroxyflavone (Luteolin) | H | 5,7-Di-OH | H | 286.24 | |
| 17 | 3,7-Dihydroxyflavone | H | 3,7-Di-OH | H | 254.24 | |
Flavanone 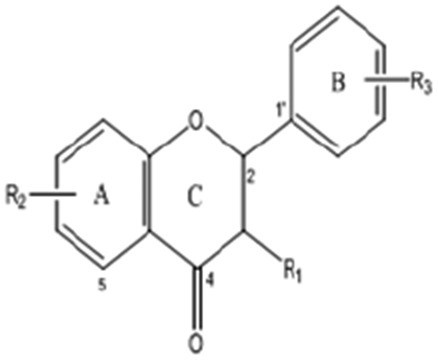
|
18 | 4′,5,7′-Trihydroxyflavanone (Naringenin) | H | 5,7-Di-OH | 4′-OH | 272.25 |
| 19 | 5-Methoxyflavanone | H | 5-OCH3 | H | 254.28 | |
| 20 | 5,7-Dimethoxyflavanone | H | 5,7-OCH3 | H | 284.31 | |
| 21 | 3′,4′,5′,7-Tetramethoxyflavanone | H | 7-OCH3 | 3′,4′,5′-Tri-OCH3 | 344.36 | |
| 22 | Flavanone | H | H | H | 224.08 | |
| 23 | 7-Hydroxyflavanone | H | 7-OH | H | 240.25 | |
| 24 | 4-Hydroxyflavanone | H | 4-OH | H | 254.24 | |
Isoflavone 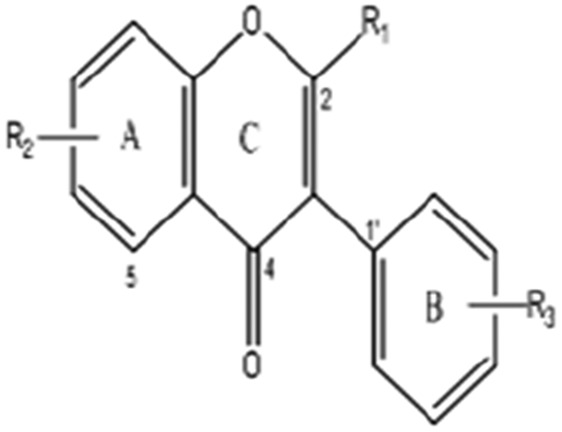
|
25 | 7-Methoxyisoflavone | H | 7-OCH3 | H | 252.26 |
| 26 | 4′,6,7-Trihydroxyisoflavone (Demethyltexasin) | H | 6,7-OH | 4′-OH | 270.24 | |
| 27 | 4′-Hydroxy-6-methoxyisoflavone-7-D-guloside (Glycitin) | H | 6-OCH3-7-D-Glucoside | 4′-OH | 446.4 | |
| 28 | 5,7,4′-Trihydroxyisoflavone (Genistein) | H | 5,7-Di-OH | 4′-OH | 270.24 | |
| 29 | 5,7-Dihydroxy-4′-methoxyisoflavone(Biochanin A) | H | 5,7-Di-OH | 4′-OCH3 | 284.26 | |
| 30 | 5,7,3′,4′-Tetramethoxyisoflavone (Orobol) | H | 5,7-Di-OCH3 | 3′,4′-Di-OCH3 | 342.34 | |
Chalcone 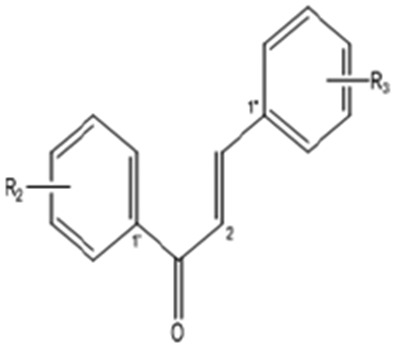
|
31 | 2′,3′′,5′′-Trimethoxychalcone | — | 2′-OCH3 | 3′′,5′′-Di-OCH3 | 298.33 |
| 32 | 3′,3′′,5′′-Trimethoxychalcone | — | 3′-OCH3 | 3′′,5′′-Di-OCH3 | 298.33 | |
| 33 | 3′,3′′,5′-Trimethoxychalcone | — | 3′5′-Di-OCH3 | 3′′-OCH3 | 298.33 | |
| 34 | 2′′,3′,5′-Trimethoxychalcone | — | 3′5′-Di-OCH3 | 2′OCH3 | 314.33 | |
| 35 | 3′,3′′,5′,5′′-Tetramethoxychalcone | — | 3′5′-Di-OCH3 | 3′′,5′′-Di-OCH3 | 328.36 | |
| 36 | 2′-Hydroxy-4′,4′′-dimethoxychalcone | — | 2′-OH-4′-OCH3 | 4′′-OCH3 | 284.31 | |
| 37 | 2′-Hydroxy-3′′,4′,5′′-trimethoxychalcone | — | 2′-OH-4′-OCH3 | 3′′,5′′-Di-OCH3 | 298.33 |
, no chemical group considered.
Fig. 1.
Transcriptional and ligand-binding assays of 37 flavonoid compounds. (A) T47D-KBLuc transcriptional assays showing ERE-luciferase reporter activity of 13 out of 37 flavonoid compounds from four different subclasses, revealed 13 phytoestrogenic compounds able to transcriptionally activate ER in a dose-dependent manner. The red line represents a 2-fold cutoff for positive hits. RLU, relative luciferase unit, normalized to β-gal control. Data are shown as mean ± S.D. (B) Relative ligand-binding affinity of 12 compounds to ERα or ERβ.
In vitro fluorescence polarization assays were used to determine the relative binding affinities of the phytochemicals that activated the ER in reporter assays. Fluorescence polarization assays are a competitive ligand-binding assay that measures the replacement of a fluorescein-labeled E2 by unliganded compounds from the LBDs of ERα and ERβ. The dose-response curves for representative ligands and the relative binding affinities are shown in Fig. 1B with half-maximal inhibitory concentration (IC50) ranging from 1.45 to 721 μM.
Ligand-Induced ER Dimerization Measured by BRET Assay.
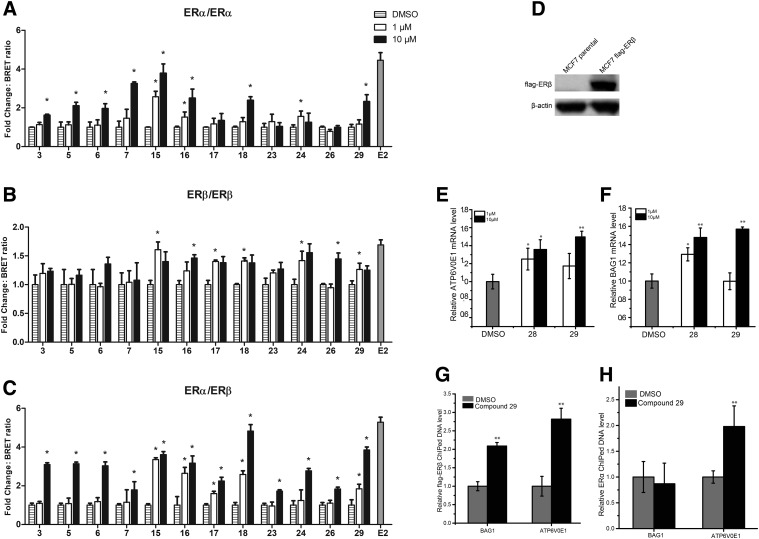
The 12 compounds were subsequently tested for their ability to induce ERα/α, ERβ/β, and ERα/β ER dimers in the BRET assay (Fig. 2, A–C). Of the flavones, compounds 3, 5, 6, and 7 induced dimerization of ERα/α homodimers and ERα/β heterodimers at 10 μM. Compound 15 induced all three dimer pairs at 1 μM. Compound 16 induced ERα/α and ERβ/β at 1 μM and all dimer pairs at 10 μM. Compound 17 induced ERβ/β and ERα/β dimerization while restricting the induction of ERα/α homodimers at 1 μM, but only induced the formation of ERα/β at 10 μM (Fig. 2, A–C). From the flavanones, ERα/β heterodimers were selectively induced by compounds 23 and 24 at 10 μM, whereas compound 18 induced ERβ/β and ERα/β dimerization at 1 μM Fig. 2, A–C). Of the isoflavone subclass (Fig. 2, A–C), compound 26 induced ERα/β and ERβ/β dimerization at 10 μM, whereas compound 29 induced ERα/β and ERβ/β dimerization at 1 μM.
Fig. 2.
BRET assays in HEK293 cells show dimer selectivity of different flavonoid subclasses. (A–C) Fold change of BRET ratios when cells were treated with indicated compounds: (A) ERα/α, (B) ERβ/β, and (C) ERα/β (10 nM E2 was used as a positive control). Each compound represents an individual experiment; those that induced dimer interaction at a threshold value of P < 0.05 were considered statistically significant. Fold change is relative to the negative control DMSO. Data are shown as mean ± S.D. of three biologic replicates. *Indicates compounds that significantly induced dimerization as determined by two-way analysis of variance. (D) Western blot analysis of Flag-tagged ERβ in MCF7-Flag-ERβ cells. (E and F) Relative ATP6V0E1 and BAG1 mRNAs levels in MCF7-Flag-ERβ cells treated with indicated compounds. (G) Compound 29-induced recruitment of ERβ to the BAG1 and ATP6V0E1 promoters in MCF7-Flag-ERβ cells shown by ChIP assays. (H) The enrichment of ERα on the BAG1 and ATP6V0E1 promoters in MCF7-Flag-ERβ cells after compound 29 treatment shown by ChIP assays. *Indicates statistically significant P < 0.05, **P < 0.01.
To determine if newly identified compounds from the reporter and BRET assays indeed activate ER target gene expression, we measured mRNA levels of two ER target genes, BAG1 and ATP6V0E1, after compound 29 treatment, using compound 28 (genistein) as a positive control. These compounds were selected since they exhibited the highest activities in the reporter assay (Fig. 1A). Because most breast cancer cell lines do not express ERβ, we constructed MCF7 cells that stably express Flag-tagged ERβ (Fig. 2D). Treatment of Flag-ERβ MCF7 cells with compounds 28 and 29 significantly increased the mRNA levels of BAG1 and ATP6V0E1 compared with the DMSO control (Fig. 2, E and F). BAG1 has been implicated to be an ERβ/β-specific target gene and ATP6V0E1 has been implicated to be an ERα/β-specific target gene (Grober et al., 2011). Because compound 29 was found to induce ERα/β and ERβ/β dimerization but not ERα/α homodimers at 1 μM, we went on to examine if compound 29 differentially recruited ERα and ERβ to the target gene promoters at a dose (1 μM) that elicits dimer specificity. Chromatin immunoprecipitation (ChIP) and quantitative polymerase chain reaction analysis showed that compound 29 treatment increased ERβ association at the promoters of both BAG1 and ATP6V0E1 genes compared with the DMSO control. In contrast, compound 29 was only able to increase ERα recruitment to ATP6V0E1 but not to the BAG1 promoter. This result is consistent with the classification of compound 29 as an ERβ/β and ERα/β dimer inducer by BRET assay and that ATP6V0E1 is likely regulated by ERα/β heterodimer versus BAG1, which is likely regulated by ERβ/β homodimer (Fig. 2, G and H).
Of the tested compounds, only three selectively induced ERα/β heterodimerization at select concentrations (compounds 17, 23, and 24); however, three other compounds 18, 26, and 29 preferentially induced ERα/β and ERβ/β dimers over ERα/α homodimers. Interestingly, compounds 17, 18, 23, 24, 26, and 29, which induced ERα/β and ERβ/β dimers, showed higher binding affinity for ERβ than for ERα (Fig. 1B). These six compounds, together with the ERα/β heterodimer–inducing compound cosmosiin, constitute a lead heterodimer-selective compound library for pharmacophore development.
Pharmacophore Development Using the GALAHAD Module in SYBYL.
The structures of 37 compounds from the initial data set (Table 1) were built into the SYBYL software platform using the sketch module, where hydrogens were added to every structure and energy minimized, and saved as Mol2 files. All structures were then converted into a 3D conformation for each input structure.
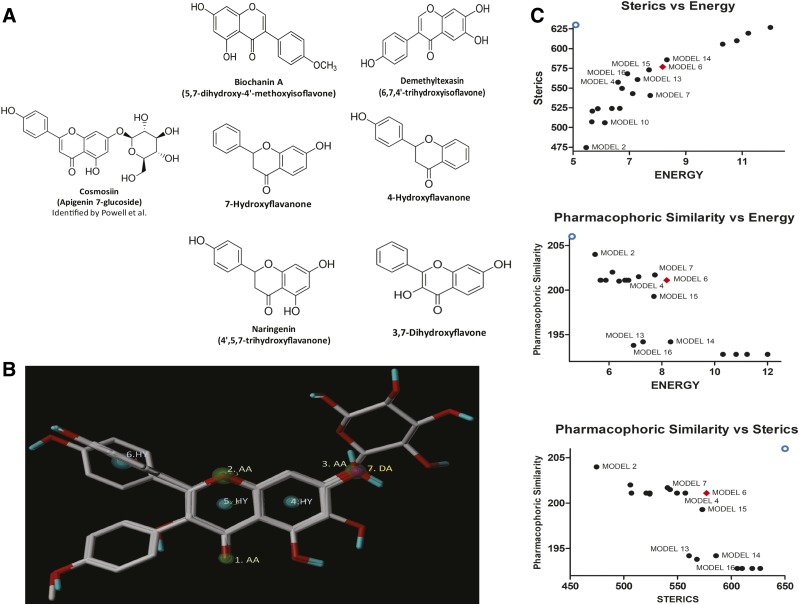
Compounds 17, 18, 23, 24, 26, and 29 plus cosmosiin were used as the training set (Fig. 3) to build a pharmacophore model in the GALAHAD module. Ligands were flexibly aligned to each other completely independent of a template. This generates a molecular alignment based on the pharmacophoric features of the final conformations of the training set. Twenty pharmacophore models were generated by GALAHAD; each of the models represents a different trade-off among competing criteria (Supplemental Table 1). These models contained the same number of features and specificity. The most significant pharmacophore hypothesis models are characterized by assessing the relation between maximizing pharmacophore consensus, maximizing steric consensus, and minimizing conformer potential energy (Caballero, 2010). Within each set of hypotheses, models were first ranked by Pareto surface score (sterics vs. energy), of where the best model has the lowest energy and the highest steric score, as illustrated in the upper left-hand corner of Fig. 3B. Concerning the energy and pharmacophoric similarity criteria, the best model with low energy and high hydrogen-bond score lies in the upper left-hand corner of the graph in Fig. 3B. Finally, the best model judged by the pharmacophoric similarity and sterics scores lies at the upper-right corner of Fig. 3B (bottom). In Fig. 3B, the ideal model in each ranking is depicted by an open circle. Taking all models into consideration, Model 6 (represented by a red diamond in Fig. 3) had a balanced consensus ranking in all three criteria, and thus was chosen as the best GALAHAD model (Fig. 3C).
Fig. 3.
Generation and selection of a pharmacophore hypothesis model of ERα/β heterodimer-inducing ligands. A ligand-based pharmacophore hypothesis was generated using GALAHAD. (A) Structures and bioactivity values of the training set chemicals used to generate ligand-based pharmacophore. The structures of the six lead compounds (cosmosiin, two isoflavones, four flavanones, and a flavone) identified from the cell-based assays. (B) Plot of the different criteria used to select the best model. Plot of the energy, sterics, Mol_QRY and H_Bond values for GALAHAD models with selected four ligands that contribute to the consensus feature. (A) Sterics vs. energy (B) Pharmacophore similarity vs. energy (C) Pharmacophore similarity vs. sterics. The open circle represents the ideal best scoring for each condition. The red diamond represents model 6. (C) Selected pharmacophore hypothesis GALAHAD model. GALAHAD assumes pharmacophore/shape and alignments from sets of ligand molecules, to generate a pharmacophore hypothesis that can be used for a 3D search query. GALAHAD models were derived by using the ligands in the training set, which contains seven features identified by GALAHAD represented by blue, green, and purple spheres. The three hydrophobes are centered in the benzopyran and phenyl rings. The three acceptor atoms are in green and a donor atom is in purple.
Model 6 is comprised of one conformer for each molecule in the training set. All conformers aligned represent low-energy conformations of the molecules, and the final alignment shows a satisfactory superimposition of the pharmacophoric points. Model 6 contains seven key features, including three hydrophobes, three acceptor atoms, and one donor atom. The pharmacophore model clearly shows the importance of the hydrophobic center that is essential in the ER pharmacophores for ERα and ERβ-selective ligands (Anstead et al., 1997; Brzozowski et al., 1997). The pharmacophore model was validated for its ability to identify ERα/β heterodimer-selective compounds from the full data set (Supplemental Table 2).
3D Virtual Screening of the ChemBridge and Maybridge Databases Identified 167 Compounds as Potential Hits.
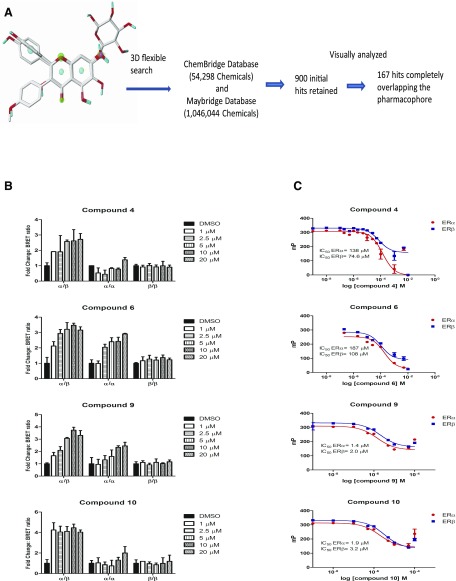
The pharmacophore model was converted into a 3D search query using SYBYL’s UNITY-3D module. The search query was then used to screen the commercial chemical databases from ChemBridge and Maybridge. Both chemical libraries were retrieved from the Zinc Database (http://zinc.docking.org/), a free database of commercially available libraries for virtual screening. Flexible 3D screening with no restrictions of both databases was performed using the UNITY tool (Fig. 4A). A total number of 900 initial molecules were identified as hits, many of which contained different chemical scaffolds.
Fig. 4.
3D search query of two commercially available databases, the Chembridge and the Maybridge databases, which together have over a million chemicals, resulted in a refined hit list of 167 compounds. (A) Represents a schematic of the 3D virtual screening of the ChemBridge and Maybridge databases. (B) Dose-response data of BRET assays in HEK293 cells, illustrating dimerization profile of selected hits. Data are shown as mean ± S.D. of three biologic replicates. Data are normalized to DMSO control. (C) Measurement of compound binding to ERα and ERβ using in vitro fluorescence polarization competition binding assays.
The hits were manually inspected to ensure all chemical groups from the compounds spatially overlapped with the corresponding features of the pharmacophore model. After visual inspection, 81% of the hits failed to match all seven pharmacophoric features, and thus were discarded. The 167 remaining hits contained 19 different core scaffolds that matched the spatial arrangements of our pharmacophore hypothesis. Subsequently, the hits were ranked using SYBYL’s integrated ranking features (Supplemental Tables 3 and 4), among which the top 22 hits were purchased and further characterized (Supplemental Table 5).
Validation and Characterization of Hits.
The hits were confirmed to activate ER transcription in T47D-KBLuc reporter assay at 10 μM final concentration (Supplemental Fig. 3) and to induce dimerization in BRET assays (Supplemental Table 6). The ability of compounds to induce all three ER dimer pairs were tested at increasing doses between 1 and 20 μM in BRET assays (data not shown). Four compounds selectively induced the ERα/β heterodimer but not the ERα/α or ERβ/β homodimer at specific concentrations (Fig. 4B). The lowest concentration at which these four compounds selectively induce ERα/β heterodimer is 1 μM.
The binding affinity of compounds 4, 6, 9, and 10 to ERα and ERβ were measured by in vitro fluorescence polarization assay (Fig. 4C). The relative binding affinities are calculated as IC50 values. Compounds 9 and 10 elicit the highest binding affinity. The IC50 values for compound 9 to ERα and ERβ were 1.4 and 2.0 μM, respectively. The IC50 values for compound 10 to ERα and ERβ were 1.9 and 3.2 μM, respectively. Although like compound 29, which was used to build the pharmacophore model, compounds 9 and 10 induced ERα/β heterodimer at 1 μM, but they elicited improved binding affinity to ERα and ERβ (Fig. 4C), suggesting that in silico modeling expedites identification of stronger ER agonists with similar heterodimer specificity. Thus, compounds 9 and 10 would be better compounds to pursue for probing ERα/β heterodimer functions.
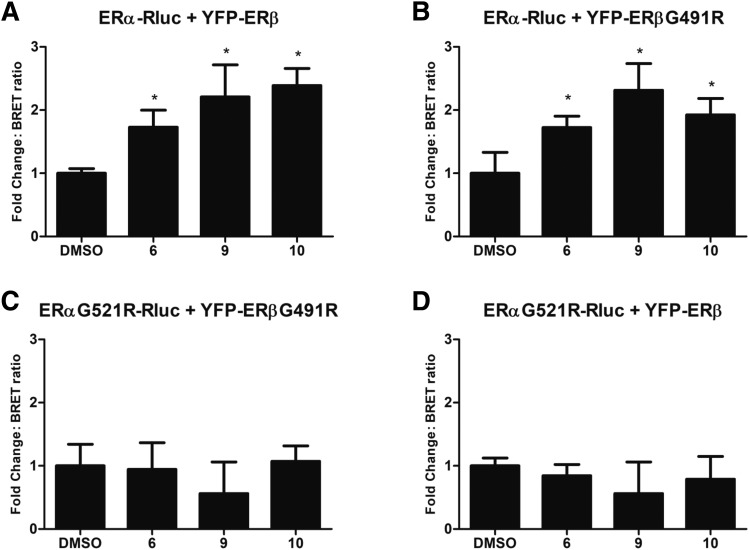
ERα Is the Dominant Heterodimeric Partner in the Presence of Selective ERα/β Heterodimer Compounds.
We previously reported that E2 induces heterodimer formation by binding to ERα (Powell and Xu, 2008). To examine whether the selective heterodimer-inducing compounds also induce heterodimer via binding to ERα, BRET assays were performed with a combination of wild-type and mutant ERα and ERβ constructs (Powell and Xu, 2008). The expressed mutant proteins contained a single mutation in the LBD (ERαG521R and ERβG491R) of receptors that ablate ligand binding (Tremblay et al., 1999; Powell and Xu, 2008). A combination of wild-type and mutant ERα and ERβ fusion proteins were used: ERαG521R-RLuc with wild-type YFP-ERβ, YFP-ERβG491R with wild-type ERα-RLuc, wild-type YFP-ERβ with wild-type ERα-RLuc, and ERαG521R-RLuc with YFP-ERβG491R. As has been previously reported for E2 (Powell and Xu, 2008), ligand-binding competent ERα LBD but not ERβ LBD is required for heterodimerization in the presence of compounds, reinforcing that ERα is the dominant partner for heterodimerization (Fig. 5).
Fig. 5.
Mutant ERα and ERβ LBDs reveal ERα as the dominant heterodimeric partner in the presence of selective ERα/β heterodimer compounds. (A) Heterodimerization of the wild-type ERα and ERβ. (B) Mutation in the ERβ LBD does not affect heterodimerization with ERα. (C) Heterodimerization of mutant ERα with mutant ERβ. (D) No dimerization is observed between mutant ERα and wild-type ERβ. Data are shown as mean ± S.D. * Indicates statistically significant <0.05.
Discussion
Current ER-positive breast cancer therapies target ERα, either using selective ER modulators to inhibit ERα transcriptional activity or selective ER degraders to reduce ERα protein levels. However, the therapeutic potential of ERβ in breast cancer has been poorly investigated. Our previous studies using ERα/β heterodimer-selective ligands show that ERβ, via heterodimerization with ERα, can antagonize the pro-proliferative effects of ERα, rendering the heterodimer as a novel preventive or therapeutic target for hormone-dependent diseases. However, few ERα/β heterodimer-inducing selective compounds have been discovered and they generally elicit only weak binding affinities to ERs. Therefore, the goal of this study was to combine computational and experimental approaches to identify compounds with improved binding affinity and dimerization specificity.
Emerging biochemical evidence supports the formation of ERα/β heterodimers when two receptors are coexpressed (Cowley et al., 1997; Pettersson et al., 1997); in particular, ERα/β heterodimers were recently detected in breast tissue using proximity ligation assay (Iwabuchi et al., 2017). However, the functions of ERα/β heterodimers remain elusive due to the lack of a crystal structure and heterodimer-specific compounds. Uncovering the biologic function of the ERα/β heterodimer is important for understanding ER signaling and designing ER-targeted therapeutics based on receptor dimerization status. The main distinction of heterodimer-inducing compounds from the existing selective ER modulators and degraders is that they target different steps in ER activation. ER heterodimer compounds target ER dimerization, a step between the ligand binding and the receptor association with chromatin. In our previously published report, we have shown that selective ER modulators such as tamoxifen, raloxifene, and the full ER antagonist ICI 182,780 do not interfere with the formation of all three dimer pairs (Powell and Xu, 2008). Although more studies are needed to demonstrate that the ERα/β heterodimer indeed serves as a therapeutic target, the concept of inducing ERβ to pair with ERα, thus antagonizing ERα’s proliferative function, is distinct from the existing breast cancer therapies to target ERα alone.
We reason that identifying and improving chemical probes would be an essential step toward understanding the biologic role of ERα/β heterodimers. Natural phytoestrogens often elicit higher binding affinity to ERβ than to ERα (Kuiper et al., 1997, 1998). Several phytoestrogens showing slight selectivity for ERα/β heterodimers were found to be antiproliferative in cancer cell lines coexpressing ERα and ERβ (Powell and Xu, 2008; Powell et al., 2010, 2012). However, the slight selectivity and low potency of these compounds prevent definitive elucidation of the functions of ERα/β heterodimers. Pharmacophore-based techniques and virtual screening have successfully been employed for the discovery of ER subtype–selective ligands (Huang et al., 2015). Herein, using a combination of cell-based assays (i.e., reporter and BRET), pharmacophore modeling, and virtual screening, we identified four ERα/β heterodimer-selective ligands (Table 2) with improved efficacy compared with cosmosiin, a previously identified compound with slight preference for the ERα/β heterodimer. The main hurdle in identifying ERα/β heterodimer-selective ligands lies in the lack of a crystal structure. Ligand binding is necessary but insufficient for the formation of ERα/β heterodimers. Previous studies suggest that ligand binding is essential to induce a conformational change of ER to accommodate helix 12 in functional dimers. In this process, ERα and ERβ appear to play separate roles such that ligand-bound ERα is the dominant partner in heterodimer formation. We have shown that ERβ subtype–specific ligands promote the formation of ERβ/β homodimers but ERα subtype–specific ligands could induce both ERα/α homodimers and ERα/β heterodimers (Powell and Xu, 2008). Because of the lack of protein crystal structures needed to build a structure-based pharmacophore model for a virtual ligand screen, we combined a multistep screening strategy with a ligand-based pharmacophore model to identify ERα/β heterodimer-selective ligands. We confirmed that ligand binding is necessary but insufficient for inducing ER dimerization. Furthermore, the formation of ER homo- versus heterodimers appears to be ligand concentration dependent (Figs. 2 and 4). Our results also showed that a ligand must induce a conformational change in ERα in a manner such that it preferentially selects the other ER subtype as a partner (Fig. 5). Finally, we characterized the estrogenic activity and dimerization ability of 59 compounds, leading to the identification of four ERα/β heterodimer-selective ligands. To our knowledge, building a pharmacophore model to identify the chemical features responsible for induction of ERα/β heterodimers is unprecedented. Thus, the more selective and potent compounds identified in this study will serve as useful probes to elucidate ERα/β heterodimer functions in vitro and in vivo.
TABLE 2.
The structural arrangement of 5 ERα/β heterodimer-selective compounds
| Compound Number | Structure | BRET |
|---|---|---|
| 4 | 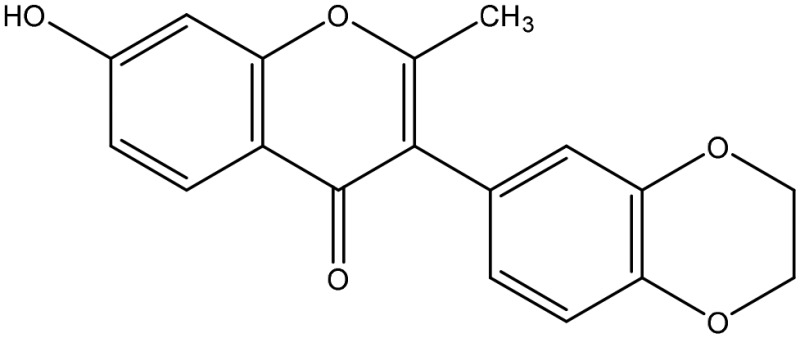 |
α/β at 10 μM |
| 6 | 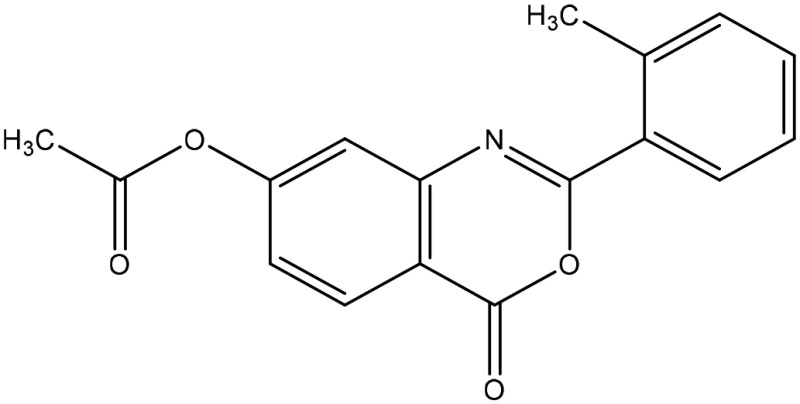 |
α/β at 1 μM |
| 9 | 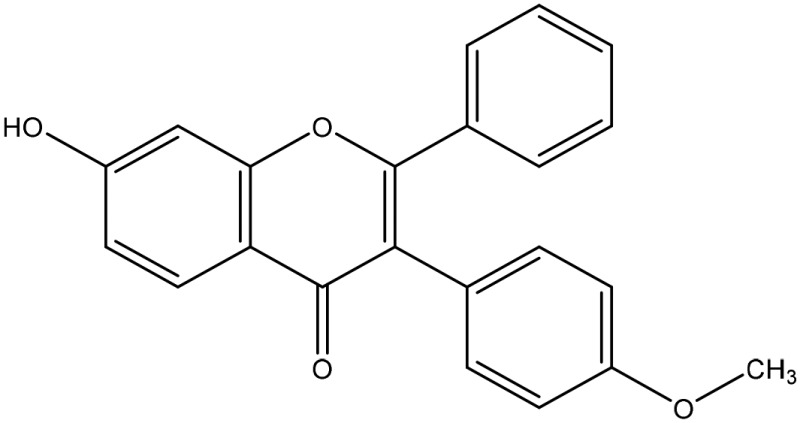 |
α/β at 1 μM |
| 10 | 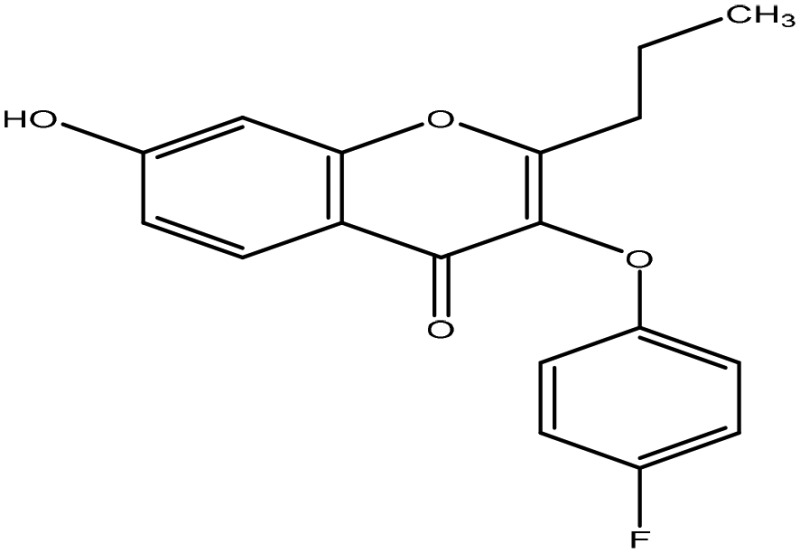 |
α/β at 1 μM |
Acknowledgments
The authors thank the Small Molecule Screening Facility at the University of Wisconsin-Madison for providing access to computational hardware. We also thank Dr. William Ricke (University of Wisconsin-Madison) for generously sharing cell lines and Carol J. Diaz-Diaz and Taryn James for helpful discussions.
Abbreviations
- BRET
bioluminescence resonance energy transfer
- ChIP
chromatin immunoprecipitation
- DMSO
dimethylsulfoxide
- 3D
three-dimensional
- E2
17β-estradiol
- ER
estrogen receptor
- ERE
estrogen response element
- FBS
fetal bovine serum
- GALAHAD
genetic algorithm with linear assignment of hypermolecular alignment of database
- LBD
ligand-binding domain
- RLuc
Renilla luciferase
- YFP
yellow fluorescent protein
Authorship Contributions
Participated in research design: Coriano, Liu, Xu, Lim.
Conducted experiments: Coriano, Liu, Sievers, Wang.
Performed data analysis: Coriano, Liu, Liang, Wang, Yu.
Wrote or contributed to the writing of the manuscript: Coriano, Liu, Xu.
Footnotes
This work was supported by the National Institutes of Health National Cancer Institute [Grant R01 CA213293] to W.X.; the National Institutes of Health National Institute of Environmental Health Sciences [Grant T32ES007015] to C.G.C.; the University of Wisconsin Comprehensive Cancer Center Support [Grant P30CA014520] (for partial support of this work); and the National Institutes of Health National Institute of Diabetes and Digestive and Kidney Diseases [Grant U54DK104310].
 This article has supplemental material available at molpharm.aspetjournals.org.
References
- Anstead GM, Carlson KE, Katzenellenbogen JA. (1997) The estradiol pharmacophore: ligand structure-estrogen receptor binding affinity relationships and a model for the receptor binding site. Steroids 62:268–303. [DOI] [PubMed] [Google Scholar]
- Brzozowski AM, Pike AC, Dauter Z, Hubbard RE, Bonn T, Engström O, Ohman L, Greene GL, Gustafsson JA, Carlquist M. (1997) Molecular basis of agonism and antagonism in the oestrogen receptor. Nature 389:753–758. [DOI] [PubMed] [Google Scholar]
- Caballero J. (2010) 3D-QSAR (CoMFA and CoMSIA) and pharmacophore (GALAHAD) studies on the differential inhibition of aldose reductase by flavonoid compounds. J Mol Graph Model 29:363–371. [DOI] [PubMed] [Google Scholar]
- Cowley SM, Hoare S, Mosselman S, Parker MG. (1997) Estrogen receptors α and β form heterodimers on DNA. J Biol Chem 272:19858–19862. [DOI] [PubMed] [Google Scholar]
- Grober OMV, Mutarelli M, Giurato G, Ravo M, Cicatiello L, De Filippo MR, Ferraro L, Nassa G, Papa MF, Paris O, et al. (2011) Global analysis of estrogen receptor beta binding to breast cancer cell genome reveals an extensive interplay with estrogen receptor alpha for target gene regulation. BMC Genomics 12:36. [DOI] [PMC free article] [PubMed] [Google Scholar]
- Hall JM, McDonnell DP. (1999) The estrogen receptor β-isoform (ERβ) of the human estrogen receptor modulates ERα transcriptional activity and is a key regulator of the cellular response to estrogens and antiestrogens. Endocrinology 140:5566–5578. [DOI] [PubMed] [Google Scholar]
- Huang W, Wei W, Yang Y, Zhang T, Shen Z. (2015) Discovery of novel selective ERα/ERβ ligands by multi-pharmacophore modeling and virtual screening. Chem Pharm Bull (Tokyo) 63:780–791. [DOI] [PubMed] [Google Scholar]
- Hwang D, Hyun J, Jo G, Koh D, Lim Y. (2011) Synthesis and complete assignment of NMR data of 20 chalcones. Magn Reson Chem 49:41–45. [DOI] [PubMed] [Google Scholar]
- Hyun J, Woo Y, Hwang DS, Jo G, Eom S, Lee Y, Park JC, Lim Y. (2010) Relationships between structures of hydroxyflavones and their antioxidative effects. Bioorg Med Chem Lett 20:5510–5513. [DOI] [PubMed] [Google Scholar]
- Iwabuchi E, Miki Y, Ono K, Onodera Y, Suzuki T, Hirakawa H, Ishida T, Ohuchi N, Sasano H. (2017) In situ detection of estrogen receptor dimers in breast carcinoma cells in archival materials using proximity ligation assay (PLA). J Steroid Biochem Mol Biol 165:159–169. [DOI] [PubMed] [Google Scholar]
- Kuiper GG, Carlsson B, Grandien K, Enmark E, Häggblad J, Nilsson S, Gustafsson JA. (1997) Comparison of the ligand binding specificity and transcript tissue distribution of estrogen receptors α and β. Endocrinology 138:863–870. [DOI] [PubMed] [Google Scholar]
- Kuiper GG, Lemmen JG, Carlsson B, Corton JC, Safe SH, van der Saag PT, van der Burg B, Gustafsson JA. (1998) Interaction of estrogenic chemicals and phytoestrogens with estrogen receptor β. Endocrinology 139:4252–4263. [DOI] [PubMed] [Google Scholar]
- Lau KM, Mok SC, Ho SM. (1999) Expression of human estrogen receptor-α and -β, progesterone receptor, and androgen receptor mRNA in normal and malignant ovarian epithelial cells. Proc Natl Acad Sci USA 96:5722–5727. [DOI] [PMC free article] [PubMed] [Google Scholar]
- Leygue E, Dotzlaw H, Watson PH, Murphy LC. (1998) Altered estrogen receptor α and β messenger RNA expression during human breast tumorigenesis. Cancer Res 58:3197–3201. [PubMed] [Google Scholar]
- Lindberg MK, Movérare S, Skrtic S, Gao H, Dahlman-Wright K, Gustafsson JA, Ohlsson C. (2003) Estrogen receptor (ER)-β reduces ERα-regulated gene transcription, supporting a “ying yang” relationship between ERα and ERβ in mice. Mol Endocrinol 17:203–208. [DOI] [PubMed] [Google Scholar]
- Nilsson S, Gustafsson JÅ. (2010) Estrogen Receptors: Their Actions and Functional Roles in Health and Disease, in Nuclear Receptors (Bunce C and Campbell M eds), vol 8, Springer, Dordrecht. [Google Scholar]
- Pace P, Taylor J, Suntharalingam S, Coombes RC, Ali S. (1997) Human estrogen receptor β binds DNA in a manner similar to and dimerizes with estrogen receptor α. J Biol Chem 272:25832–25838. [DOI] [PubMed] [Google Scholar]
- Paulmurugan R, Tamrazi A, Massoud TF, Katzenellenbogen JA, Gambhir SS. (2011) In vitro and in vivo molecular imaging of estrogen receptor α and β homo- and heterodimerization: exploration of new modes of receptor regulation. Mol Endocrinol 25:2029–2040. [DOI] [PMC free article] [PubMed] [Google Scholar]
- Pettersson K, Grandien K, Kuiper GG, Gustafsson JA. (1997) Mouse estrogen receptor β forms estrogen response element-binding heterodimers with estrogen receptor α. Mol Endocrinol 11:1486–1496. [DOI] [PubMed] [Google Scholar]
- Powell E, Huang SX, Xu Y, Rajski SR, Wang Y, Peters N, Guo S, Xu HE, Hoffmann FM, Shen B, et al. (2010) Identification and characterization of a novel estrogenic ligand actinopolymorphol A. Biochem Pharmacol 80:1221–1229. [DOI] [PMC free article] [PubMed] [Google Scholar]
- Powell E, Shanle E, Brinkman A, Li J, Keles S, Wisinski KB, Huang W, Xu W. (2012) Identification of estrogen receptor dimer selective ligands reveals growth-inhibitory effects on cells that co-express ERα and ERβ. PLoS One 7:e30993. [DOI] [PMC free article] [PubMed] [Google Scholar]
- Powell E, Xu W. (2008) Intermolecular interactions identify ligand-selective activity of estrogen receptor α/β dimers. Proc Natl Acad Sci USA 105:19012–19017. [DOI] [PMC free article] [PubMed] [Google Scholar]
- Shin SY, Woo Y, Hyun J, Yong Y, Koh D, Lee YH, Lim Y. (2011) Relationship between the structures of flavonoids and their NF-κB-dependent transcriptional activities. Bioorg Med Chem Lett 21:6036–6041. [DOI] [PubMed] [Google Scholar]
- Tremblay GB, Tremblay A, Labrie F, Giguère V. (1999) Dominant activity of activation function 1 (AF-1) and differential stoichiometric requirements for AF-1 and -2 in the estrogen receptor α-β heterodimeric complex. Mol Cell Biol 19:1919–1927. [DOI] [PMC free article] [PubMed] [Google Scholar]
- Weihua Z, Andersson S, Cheng G, Simpson ER, Warner M, Gustafsson JA. (2003) Update on estrogen signaling. FEBS Lett 546:17–24. [DOI] [PubMed] [Google Scholar]
- Wilson VS, Bobseine K, Gray LE., Jr (2004) Development and characterization of a cell line that stably expresses an estrogen-responsive luciferase reporter for the detection of estrogen receptor agonist and antagonists. Toxicol Sci 81:69–77. [DOI] [PubMed] [Google Scholar]
- Wu X, Subramaniam M, Grygo SB, Sun Z, Negron V, Lingle WL, Goetz MP, Ingle JN, Spelsberg TC, Hawse JR. (2011) Estrogen receptor-beta sensitizes breast cancer cells to the anti-estrogenic actions of endoxifen. Breast Cancer Res 13:R27. [DOI] [PMC free article] [PubMed] [Google Scholar]
- Zeng H, Lu L, Chan NT, Horswill M, Ahlquist P, Zhong X, Xu W. (2016) Systematic identification of Ctr9 regulome in ERα-positive breast cancer. BMC Genomics 17:902. [DOI] [PMC free article] [PubMed] [Google Scholar]
- Zeng H, Xu W. (2015) Ctr9, a key subunit of PAFc, affects global estrogen signaling and drives ERα-positive breast tumorigenesis. Genes Dev 29:2153–2167. [DOI] [PMC free article] [PubMed] [Google Scholar]


