Abstract
Diabetes mellitus (DM) and its complications have been implicated in hyperglycemia-induced oxidative stress. Antioxidants can improve glycemic control, lipid profile, and cognitive functions. We assessed the effect of Vitamin E and omega 3 fatty acids (OFA) on the above parameters. One hundred patients with type 2 DM receiving metformin 500 mg and glimepiride 1 mg were randomized to receive add-on therapy of Vitamin E 400 mg or OFA once daily for 12 weeks and the third group served as control. Fasting blood sugar (FBS), postprandial blood sugar (PPBS), glycated hemoglobin (HbA1c), body mass index (BMI), waist-hip ratio (WHR), lipid profile, and mini-mental state examination were done at baseline and 12 weeks. Eighty-seven patients completed the study. A significant reduction in FBS, PPBS, and HbA1c was observed in all the three groups at 12 weeks. There was significant reduction in total cholesterol and triglycerides (TG) in patients receiving either of the antioxidants and also significant reduction in low-density lipoprotein in patients receiving OFA at 12 weeks compared to baseline. BMI and WHR were significantly increased in control group. Intergroup analysis showed that in patients receiving Vitamin E and OFA, the reduction of FBS, PPBS, and HbA1c were similar. The patients receiving OFA had significant reduction in TG compared to control. There was no significant effect on cognitive function. Vitamin E and OFA had beneficial effects on lipid profile and anthropometric measurements; however, the glycemic control was similar to the patients in control group.
Key words: Diabetes mellitus, glimepiride, metformin, omega 3 fatty acids, Vitamin E
INTRODUCTION
Diabetes mellitus (DM) is a prevalent noncommunicable disease.[1] Hyperglycemia leads to activation of polyol pathway, increased formation of intracellular advanced glycation end products, activation of protein kinase C isoforms, and overactivity of the hexosamine pathway. These pathways induce excessive production of free radicals (superoxide, hydrogen peroxide, and hydroxyl radical).[2] These free radicals lead to increase in oxidative stress which damages the vascular endothelial cells, resulting in microvascular (diabetic retinopathy, nephropathy, and neuropathy) and macrovascular (coronary artery disease, peripheral arterial disease, and stroke) complications in type 2 DM.[3,4] Currently, oral antidiabetic drugs are the first-line treatment in type 2 DM.
Type 2 DM is also characterized by insulin resistance, resulting in depletion of the cellular antioxidant defense system secondary to increased oxidative stress.[5] Anthropometric measurements are simple, noninvasive tools to assess the insulin sensitivity.[6] Brain is more susceptible to damage by free radicals because of its high oxygen consumption rate; hence, hyperglycemia can cause cognitive decline. Mini-mental state examination (MMSE) is used to assess the cognitive function.[7] The aim was to compare the effects of Vitamin E and omega 3 fatty acids (OFA) on glycemic control, insulin sensitivity (body mass index [BMI] and waist-hip ratio [WHR]), lipid profile, and cognitive function in type 2 DM patients.
MATERIALS AND METHODS
A prospective, randomized, parallel, and open-label study was conducted in patients attending the Outpatient Department of Medicine and Diabetology from February 2014 to June 2015. Pro forma was designed to capture detailed information of each patient, and the protocol was approved by Institutional Ethics Committee No. DMC/KLR/IEC-CER/60. Written informed consent was obtained from patients willing to participate.
Patients of either gender aged between 35 and 60 years, from Kolar district, clinically diagnosed with type 2 DM and duration of < 10 years (fasting blood sugar [FBS] – 125–250 mg/dl), receiving combination of metformin and glimepiride were recruited. Diabetic patients having central obesity of WHR >1.0 (males), ≥0.9 (females), and/or hypertension (JNC 7) with systolic blood pressure ranging between 120 and 159 mmHg and diastolic blood pressure between 80 and 99 mmHg on treatment were included. Diabetic patients with total cholesterol (TC) ranging between 200 and 239 mg/dl and triglycerides (TG) between 150 and 499 mg/dl were included. Patients with type 2 DM on insulin therapy, renal or hepatic dysfunction, history of myocardial infarction or cardiac intervention, history of hypersensitivity to the test drugs, pregnant, and lactating women were excluded.
Patients were randomized into three groups by simple randomization: Group 1 received (metformin 500 mg + glimepiride 1 mg + Vitamin E 400 mg), Group 2 (metformin 500 mg + glimepiride 1 mg + OFA) (eicosapentaenoic acid – 180 mg, docosahexaenoic acid – 120 mg), Group 3 served as control (metformin 500 mg + glimepiride 1 mg); treatment duration was 12 weeks for all the patients.
Anthropometric measurements, FBS, postprandial blood sugar (PPBS), glycated hemoglobin (HbA1c), lipid profile, and MMSE scale[7] consisting of 11 questions with maximum score of 30 were assessed at the baseline and at the end of 12 weeks. Patients were instructed to take the study drugs once daily orally and 30 min before food and to follow the diabetic diet (avoiding sweet dishes, 1 cup rice/day, including wheat and ragi daily in diet, 3 major meals converted to 5 minor meals, 50% food, and 50% vegetables).[8] Patient's compliance was assessed by advising them to return the used tablet strips during follow-up. All the adverse events were assessed in accordance with the WHO causality assessment scale.[9]
Statistical methods
Sample size calculation: To detect the mean difference of 1.24 in the HbA1c at the end of 12 weeks with an effect size of 0.765, alpha error of 5%, power of 80% with a dropout rate of 10%, the required sample was 31 in each group. The demographic data were analyzed using descriptive statistics. The quantitative data within the group were analyzed using paired t-test and for between the groups ANOVA. Adverse effects were analyzed using Chi-square test. P < 0.05 was considered statistically significant.
RESULTS
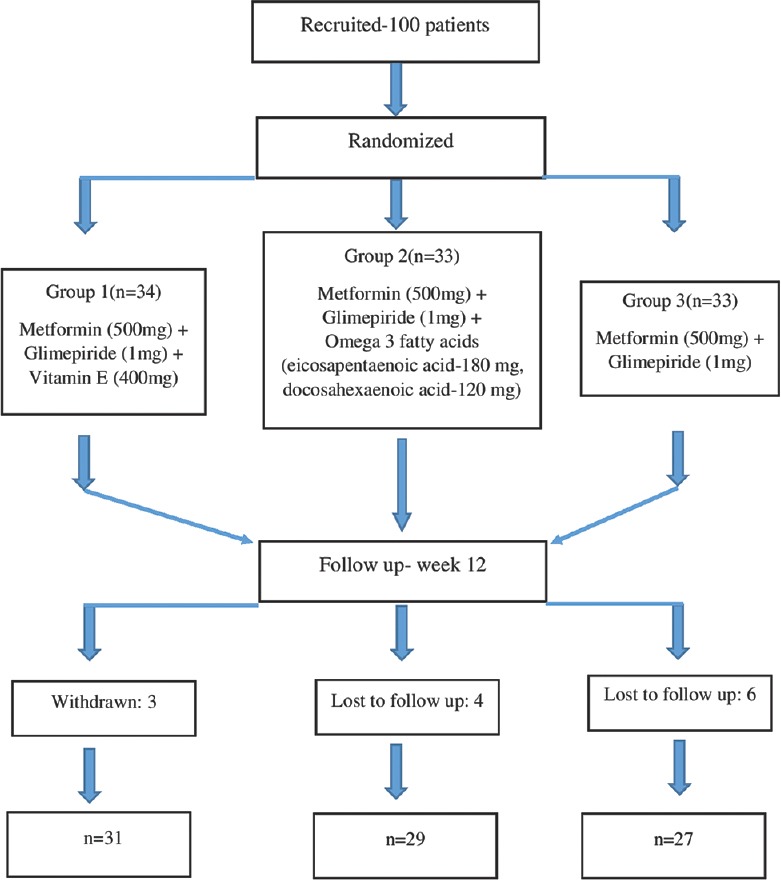
A total of 100 patients were recruited in the study. Among them, 87 completed the study, 10 patients were lost to follow-up, and three patients withdrew from the study [Figure 1].
Figure 1.

Patient recruitment, randomization, and follow-up
All the demographic characteristics were comparable between the groups at baseline [Table 1].
Table 1.
Demographic data at baseline

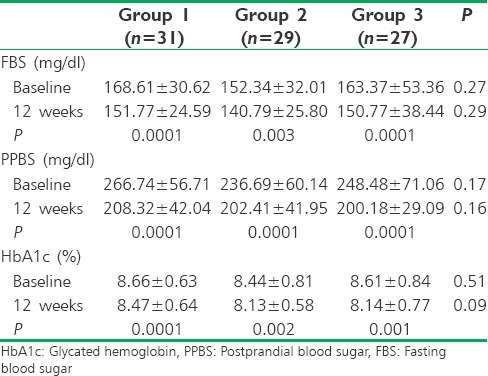
FBS, PPBS, and HbA1c were significantly reduced in patients of all three groups at 12 weeks compared to baseline. The reduction in FBS, PPBS, and HbA1c at 12 weeks between the groups was not statistically significant [Table 2].
Table 2.
Comparison of blood glucose and glycated hemoglobin within and between the groups

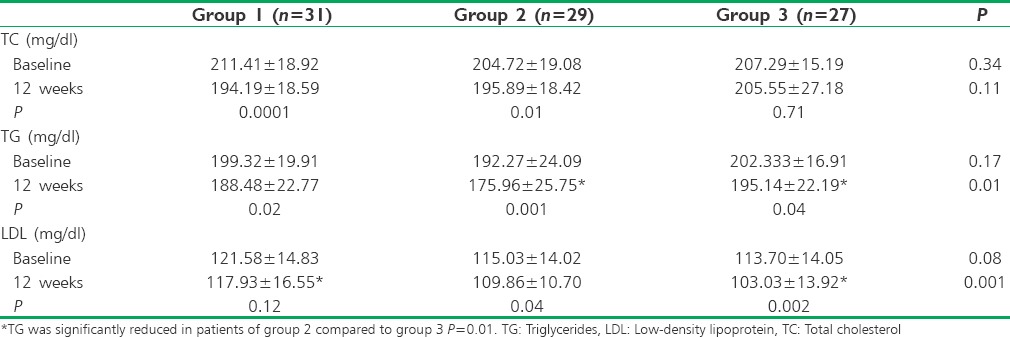
TC was significantly reduced in patients of Group 1 and Group 2, and there was no significant reduction in Group 3 at 12 weeks compared to baseline. TG was significantly reduced in patients of all three groups at 12 weeks compared to baseline. Low-density lipoprotein (LDL) was significantly reduced in patients of Group 2 and Group 3, but it was insignificant in Group 1 after 12 weeks [Table 3].
Table 3.
Comparison of lipid profile within and between the groups

The reduction of TC at 12 weeks between the groups was not statistically significant. Post hoc Bonferroni test was carried out, and it was observed that TG was significantly reduced in patients of Group 2 compared to Group 3 (P = 0.01) and LDL was significantly reduced in patients of Group 3 compared to Group 1 (P = 0.001) at 12 weeks. There was no statistically significant increase in high-density lipoprotein (HDL) in patients of all three groups at 12 weeks (Group 1: P =0.56, Group 2: P =0.90, and Group 3: P =0.27).
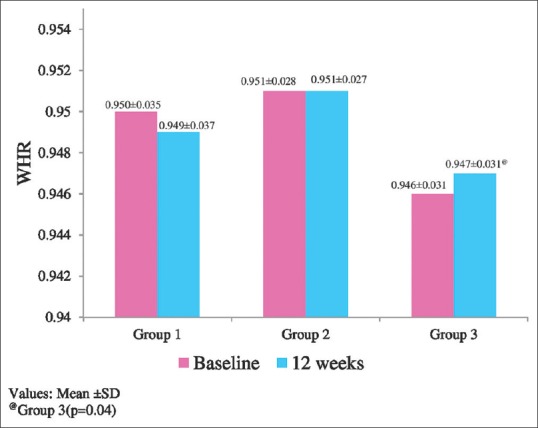
BMI was significantly increased in Group 3, but there was no significant increase in Group 1 (P = 0.10) and Group 2 (P = 0.82) after 12 weeks [Figure 2]. The mean reduction in BMI between groups at 12 weeks was statistically insignificant. WHR was significantly increased in Group 3 and no significant change was observed in Group 1 (P = 0.42) and Group 2 (P = 1.00) after 12 weeks [Figure 3]. There was no statistically significant difference in WHR at 12 weeks between the groups. MMSE scores were not significantly increased from baseline to 12 weeks in any of the groups (Group 1: P =0.08, Group 2: P =0.16, Group 3: P =0.10).
Figure 2.

Comparison of body mass index within the groups
Figure 3.

Comparison of waist-hip ratio within the groups
DISCUSSION
The staple food consumed by this locality people is rice, ragi, and wheat; therefore, supplementation of antioxidants through diets such as vegetables, fish, and fruits may be inadequate. In this study, we assessed the effect of antioxidants (Vitamin E and OFA) on FBS, PPBS, HbA1c, BMI, WHR, TC, TG, LDL, HDL, and MMSE. One hundred patients diagnosed with type 2 DM receiving combination of metformin (500 mg) and glimepiride (1 mg) were recruited; among them, 87 completed the study. Majority of the patients were in the fifth decade, and their common complaints were generalized weakness and body pain. The demographic characteristics were comparable [Table 1].
There was significant reduction in FBS, PPBS, and HbA1c of the patients at 12 weeks compared to baseline, but the glycemic control between the groups was similar [Table 2]. This implies that add-on therapy in our study did not significantly contribute to reduction of blood sugar levels. These results are similar to Xu et al.'s study, a meta-analysis of the randomized controlled trials, which described twelve studies, and they concluded that Vitamin E supplementation did not significantly reduce FBS and HbA1c.[10] Systematic reviews conducted by Hartweg et al. and Hendrich also concluded that there was no significant reduction in FBS and HbA1c with OFA supplementation.[11,12] However, the study conducted by Udupa et al. showed a significant reduction of HbA1c in patients receiving add-on therapy (alpha lipoic acid, OFA, and Vitamin E) after 12 weeks, and maximum reduction was attributed to OFA.[13] A study conducted by Haliga et al. observed that the addition of flaxseed (rich in OFA) and/or Vitamin E to the high-fat diet had produced a significant reduction of serum glucose levels in diabetic hamsters.[14]
Significant reduction in TC and TG was observed in patients receiving either of the antioxidants and also significant reduction in LDL in patients receiving OFA at 12 weeks compared to baseline [Table 3]. Intergroup analysis showed that patients receiving OFA had significant reduction in TG compared to control [Table 3]. BMI and WHR were significantly increased in the patients who received only antidiabetic drugs which signify that the OFA and Vitamin E prevented weight gain [Figure 2]. There was no significant effect on cognitive function in patients of any of the groups.
Hartweg et al. and Hendrich reported that OFA supplementation significantly reduced TG compared to control, whereas Hendrich also observed reduction in LDL.[11,12] In a study conducted by Haliga et al., the addition of Vitamin E alone or in combination with flaxseed to the high-fat diet showed the reduction in serum concentrations of TC, TG, and LDL but failed to increase the HDL level in diabetic hamsters.[14] In Udupa et al.'s study, at the end of 12 weeks, there was significant reduction in the TC, BMI, and waist circumference in patients who received add-on therapy (alpha lipoic acid, OFA, and Vitamin E).[13] Three patients in Vitamin E group developed abdominal pain which was probable according to causality assessment; hence, they were withdrawn from the study [Figure 1]. All other drugs were well tolerated.
Limitation of this study was patients should have been followed up for longer duration to observe the beneficial effect on glycemic control.
CONCLUSION
The glycemic control achieved with the supplementation of Vitamin E or OFA was similar to the control group, but they had a beneficial effect on lipid profile and anthropometric measurements.
Financial support and sponsorship
Nil.
Conflicts of interest
There are no conflicts of interest.
REFERENCES
- 1.Powers AC. In: Harrison's Principles of Internal Medicine. 18th ed. Longo D, Fauci A, Kasper D, Hauser S, Jameson J, Loscalzo J, editors. New York: McGraw Hill; 2012. pp. 2968–3003. [Google Scholar]
- 2.Madhu SV. In: RSSDI Textbook of Diabetes Mellitus. 3rd ed. Chandalia HB, Sridar GR, Das AK, Madhu SV, Mohan V, Rao PV, editors. New Delhi: Jaypee The Health Sciences Publishers Ltd; 2014. pp. 773–86. [Google Scholar]
- 3.Maitra A. In: Robbins and Cotran Pathologic Basis of Disease. 8th ed. Kumar V, Abbas KA, Fausta N, Aster CJ, editors. Philadelphia: Elsevier Inc; 2010. pp. 1130–48. [Google Scholar]
- 4.Shinde SN, Dhadke VN, Suryakar AN. Evaluation of oxidative stress in type 2 diabetes mellitus and follow-up along with Vitamin E supplementation. Indian J Clin Biochem. 2011;26:74–7. doi: 10.1007/s12291-010-0041-y. [DOI] [PMC free article] [PubMed] [Google Scholar]
- 5.Risérus U, Arnlöv J, Brismar K, Zethelius B, Berglund L, Vessby B, et al. Sagittal abdominal diameter is a strong anthropometric marker of insulin resistance and hyperproinsulinemia in obese men. Diabetes Care. 2004;27:2041–6. doi: 10.2337/diacare.27.8.2041. [DOI] [PubMed] [Google Scholar]
- 6.Singh Y, Garg MK, Tandon N, Marwaha RK. A study of insulin resistance by HOMA-IR and its cut-off value to identify metabolic syndrome in urban Indian adolescents. J Clin Res Pediatr Endocrinol. 2013;5:245–51. doi: 10.4274/Jcrpe.1127. [DOI] [PMC free article] [PubMed] [Google Scholar]
- 7.Folstein MF, Folstein SE, McHugh PR. “Mini-mental state”. A practical method for grading the cognitive state of patients for the clinician. J Psychiatr Res. 1975;12:189–98. doi: 10.1016/0022-3956(75)90026-6. [DOI] [PubMed] [Google Scholar]
- 8.American Diabetes Association. Clinical Practice Recommendations- 2007.Diabetes management in correctional institutions. Diabetes Care. 2007;30(Supp 1):S77–84. doi: 10.2337/dc07-S077. [DOI] [PubMed] [Google Scholar]
- 9.WHO-UMC Causality Assessment. Uppsala Monitoring Center. Sweden. 1978. [Last accessed on 2013 Oct 15]. Available from: http://www.who-umc-org/graphics/24734.pdf .
- 10.Xu R, Zhang S, Tao A, Chen G, Zhang M. Influence of Vitamin E supplementation on glycaemic control: A meta-analysis of randomised controlled trials. PLoS One. 2014;9:e95008. doi: 10.1371/journal.pone.0095008. [DOI] [PMC free article] [PubMed] [Google Scholar]
- 11.Hartweg J, Perera R, Montori V, Dinneen S, Neil HA, Farmer A. Omega-3 polyunsaturated fatty acids (PUFA) for type 2 diabetes mellitus. Cochrane Database Syst Rev. 2008;1:CD003205. doi: 10.1002/14651858.CD003205.pub2. [DOI] [PMC free article] [PubMed] [Google Scholar]
- 12.Hendrich S. Omega-3 fatty acids: Clinical trials in people with type 2 diabetes. Am J Clin Nutr Adv Nutr. 2010;1:3–7. doi: 10.3945/an.110.1003. [DOI] [PMC free article] [PubMed] [Google Scholar]
- 13.Udupa AS, Nahar PS, Shah SH, Kshirsagar MJ, Ghongane BB. Study of comparative effects of antioxidants on insulin sensitivity in type 2 diabetes mellitus. J Clin Diagn Res. 2012;6:1469–73. doi: 10.7860/JCDR/2012/4464.2535. [DOI] [PMC free article] [PubMed] [Google Scholar]
- 14.Haliga RE, Mocanu V, Badescu M. Antioxidative and antiatherogenic effects of flaxseed, α-tocopherol and their combination in diabetic hamsters fed with a high-fat diet. Exp Ther Med. 2015;9:533–8. doi: 10.3892/etm.2014.2102. [DOI] [PMC free article] [PubMed] [Google Scholar]


