

Abstract
Background
Studies have suggested that type 2 diabetes (T2D) increases the risk of active pulmonary tuberculosis (TB) infection. T2D might exacerbate TB severity and adversely impact the treatment of TB patients by suppressing the immune response of TB. However, how the immune cell profiles are changed in Chinese TB patients with coincident of T2D compared with TB patients without T2D is still unclear.
Material/Methods
To explore the immune cell profile alteration in TB patients with T2D, we collected blood samples from 46 TB patients with or without T2D and measured the profiles of T cell subsets.
Results
We found TB patients with coincident of T2D had higher percentages of Th2 and Th17 cells after TB antigens stimulation, while they had unchanged Th1 cells and decreased CD8+ cytotoxic T cells compared to TB patients without T2D. However, no significant difference in baseline percentages of these T cells subsets was observed.
Conclusions
T2D has important impacts on regulating anti-TB immunity by increasing Th2 and Th17 cell differentiation, but reducing the activity of CD8+ T cells. Our study supports the need to perform longitudinal studies to evaluate the roles of immunological interaction between T2D and TB in TB development.
MeSH Keywords: Diabetes Mellitus, Type 2; Immunity, Active; Mycobacterium Tuberculosis; Receptors, Antigen, T-Cell; Receptors, Cytokine
Background
Although death and incidence rates of tuberculosis (TB) have continued to decrease in recent years, TB remains one of the major disease burdens in developing countries [1]. According to the World Health Organization, there were an estimated 10.4 million new TB cases in 2015 [1]. TB coincident with other diseases, such as HIV and type 2 diabetes mellitus (T2D), further aggravated the TB epidemic and make treatment harder [1–4]. Studies have suggested that diabetes increases the risk of active pulmonary TB infection [5]. As a complication of diabetes, TB is very common among diabetic patients [4,6,7]. A large proportion of TB patients (ranging from 5% to 30%) have been reported to be coincident with diabetes [7,8]. However, the mechanisms by which diabetes impacts the presentation and treatment response of TB is still unclear.
TB immunity depends on multiple immune cells, such as macrophages, CD4+ T cells, and CD8+ T cells. Cytokines produced by these immune cells extensively regulate TB immunity [9]. T2D has been identified as a chronic inflammatory disease with alterations in immune cell functions [10–12]. In an animal model, T2D reduced the innate immune response to TB antigen-stimulated macrophages in alveolar, thus delaying the priming of adaptive immune response [13]. Furthermore, T cell subset imbalance in the T2D mouse model caused elevated levels of pro-inflammatory cytokines such as IL-6, IL-17, TNF-α, and IFN-γ [10–12]. Differentiation of naive T cells into effector cells is required for optimal immune response. Differentiation of T cells was influenced by inflammatory factors, such as IL-6, IL-17, TGF-β, which can be altered by the T2D condition [10–12]. Based on these facts, we hypothesize that the coincident of T2D might change the repertoire of T cells systemically in TB patients, thus suppressing anti-TB immunity.
To test our hypothesis, we collected blood samples from TB patients with or without T2D and measured the profiles of T cell subsets. Understanding the adaptive immunity changes will help better understand of T2D coincident TB and provide novel treatment strategies for such patients.
Material and Methods
Patients
This study included 46 TB patients diagnosed in Xinjiang Uygur Autonomous Region Chest Hospital from July 2015 to Jun 2016. Twenty-three of these patients had coincident T2D, and the other 23 did not. All the 46 TB patients were diagnosed with active pulmonary TB based on sputum smear and culture examine. T2D was diagnosed based on random blood glucose and glycated hemoglobin (HbA1c) tests. The patients with random blood glucose ≥11.1 mmol/L or HbA1c ≥6.5% were diagnosed with T2D. All the patients did not have anti-TB treatment before the first study blood draw. The patients who met the following criteria were excluded from this study: 1) age >70 years; 2) coincident with other severe cardiac, renal, hepatic, or pulmonary diseases or tumors; or 3) had a history of immunodeficiency diseases. The TB severity of each patient was evaluated by scoring the infection lesions on the x-ray. There was no significant difference between the means of patients with T2D and without T2D (data not shown). All the included patients were Uyghur people. All the patients signed the informed consent before the study. This study was approved by the Clinical Research Committee of Xinjiang Uygur Autonomous Region Chest Hospital.
Cell culture
Whole blood cells were cultured to determine the T cell subsets. The whole blood was diluted (1: 1) with RPMI-1640 medium supplemented with 10% heat-inactivated fetal bovine serum, 2 mM l-glutamine, gentamicin (50 μg/mL), 100 U/mL penicillin, 100 μg/mL streptomycin, and 10 mM HEPES buffer. An equal number of cells were distributed to 12-well tissue culture plates. Then TB antigens ESAT-6 (final concentration: 10 μg/mL, from Abcam, USA) or CFP-10 (final concentration: 10 μg/mL, from Abcam, USA) with CD49d/CD28 was added to the plates to culture for seven hours at 37 °C The antigen was replaced with the medium in the negative control group. At the end of the second hour, brefeldin A (Thermo Fisher Scientific) was added. After the culture, the suspension was centrifuged. Then the red blood cells were lysed via ACK lysing buffer (Thermo Fisher Scientific). Finally, the rest of the cells were fixed with cytofix buffer (BD Biosciences) and stored at −80 °C.
Flow cytometry
All the antibodies were obtained from BioLegend. The cells were washed and stained with surface antibodies of CD8 and CD4 at room temperature for 15 minutes. To stain intracellular proteins (TNF-α, IFN-γ, IL-2, IL-4, IL-6, IL-10, IL-17a, perforin, Granzyme B), the cells were fixed with fixation buffer at room temperature for 15 minutes, followed by permeabilization with BD Perm/Wash buffer (BD Biosciences) at room temperature for 30 minutes. Then cells were then washed with PBS three times. Fluorescence-conjugated secondary antibodies were added to incubate for 15 minutes at room temperature. Then cells were washed with PBS three times. Finally, the stained cells were analyzed with a FACSCanto II machine (Becton Dickinson, USA). The results were analyzed with FlowJo software.
Statistical analysis
All the statistical analysis was performed using SPSS 24.0 software and GraphPad Prism software. The difference of means from the study groups was analyzed by t-test. The independence of variables was analyzed by chi-square test. Two tail p values less than 0.05 was statistically significant. Data in the plots was presented as the mean and standard deviation.
Results
Characteristics of the study population
The study included 46 TB patients, of which half (23) had coincident T2D. The demographic profile and hematologic profile of all patients are summarized in Table 1. The mean age was 44.28 years, ranging from 32 to 58 years. The mean T2D duration history of the patients with DM was 3.98 years. There was no statistical significant difference in age between the TB patients with T2D and without T2D. However, significantly higher levels of BMI, random blood glucose level, and HbA1c were observed in the TB patients with T2D compared to the TB patients without T2D (Table 1).
Table 1.
Characteristics of the TB patients with or without DM.
| Features | TB patients with DM (n=23) | TB patients without DM (n=23) | P value |
|---|---|---|---|
| Age (year) | 45.83 (37–58) | 42.74 (32–58) | 0.082 |
| Gender | |||
| Female | 10 | 11 | 0.767 |
| Male | 13 | 12 | |
| BMI | 24.05 (19.20–28.16) | 21.47 (18.03–25.37) | 0.003 |
| DM history (year) | 3.98 (1.5–11) | – | NA |
| Random blood glucose (mmol/L) | 15.41 (11.84–23.74) | 8.29 (4.07–9.86) | <0.0001 |
| HbA1c | 9.64 (6.63–13.87) | 4.86 (4.15–5.65) | <0.0001 |
| RBC count (×1012 cells/L) | 4.86 (3.81–5.55) | 4.66 (4.17–5.51) | 0.124 |
| WBC count (×1012 cells/L) | 13.34 (8.00–21.18) | 11.44 (5.87–17.71) | 0.057 |
| Neutrophil count (×109 cells/L) | 8.10 (2.49–12.88) | 6.89 (3.09–12.10) | 0.162 |
| Lymphocyte count (×109 cells/L) | 2.21 (1.08–3.35) | 2.19 (1.01–3.50) | 0.921 |
| Monocyte count (×109 cells/L) | 0.83 (0.55–1.22) | 0.81 (0.31–1.17) | 0.941 |
| Platelet count (×109 platelets/L) | 350.30 (260.88–435.66) | 322.35 (202.11–464.25) | 0.173 |
NA – not available; TB – tuberculosis; DM – diabetes mellitus; BMI – body mass index; HbA1c – hemoglobin A1c; RBC – red blood cell count; WBC – white blood cell count. The data was shown as mean and range, except the data of gender (frequency).
Impact of T2D on Th1 cells of TB patients
Th1 cells play key roles in anti-TB immunity. Thus, we examined the ratio and activity of Th1 in TB patients coincident with/without T2D. The gating strategy for the investigated immune cells is shown in Figure 1. As shown in Figure 2, the percentage of CD4+INF-γ+, CD4+TNF-α+, and CD4+IL-2+ cells in blood cells of TB patients were measured. The baseline percentages of these cells were very close among the TB patients with/without T2D. Upon TB antigen stimulation, the percentages of Th1 cells in TB with T2D patients became higher than those in TB without T2D patients. However, no significant difference was observed. This data suggested that Th1 cells were not the primary adaptive immune cells impacted by coincident of T2D in TB patients.
Figure 1.

Gating strategy of T-cell subtypes. The whole blood cell cultures of TB patients were collected and stimulated by TB antigens. Then the lymphocyte population was gated based on their forward-scatter and side-scatter parameters. Then the total T-cell population was gated as CD3+CD19− lymphocytes. The total T-cell population was then separated into CD4+ and CD8+ subsets. In the CD4+ subset, cells were further divided into Th1 (IL-2, IFN-γ, and TNF-α), Th2 (IL-4, IL-6, and IL-10), and Th17 (IL-17a) cells. Functional markers (IFN-γ, granzyme B, and perforin) were evaluated in CD8+ T-cells.
Figure 2.

The ratio of CD4+ cells expressing IFN-γ, TNF-α, and IL-2 in TB patients with or without T2D. The whole blood cell cultures of TB patients were stimulated by TB antigens. The immune cell classification was performed by flow cytometry. Each dot represents a patients’ sample. There was no significant difference of CD4+ cells expressing IFN-γ (A), TNF-α (B) and IL-2 (C) between TB patients with T2D and without T2D after TB antigens ESAT-6 and CFP-10 stimulation. NS – none significance; NAS – none antigen stimulation; TB-ND – TB patients without T2D; TB-D – TB patients with T2D; N=23 in each group.
Impact of T2D on Th17 cells of TB patients
Th17 cells are characterized by producing of IL-17. Primary TB infection usually induces IL-17 production. Thus, we also measured the level of Th17 cells in TB patients with/without T2D. As shown in Figure 3, the baseline percentage of CD4+IL-17a+ cells was very close in TB patients with/without T2D. However, after ESAT-6 and CFP-10 antigen stimulation, the percentages of CD4+IL-17a+ were much higher in TB patients with T2D than in TB patients without T2D (p value less than 0.0001).
Figure 3.
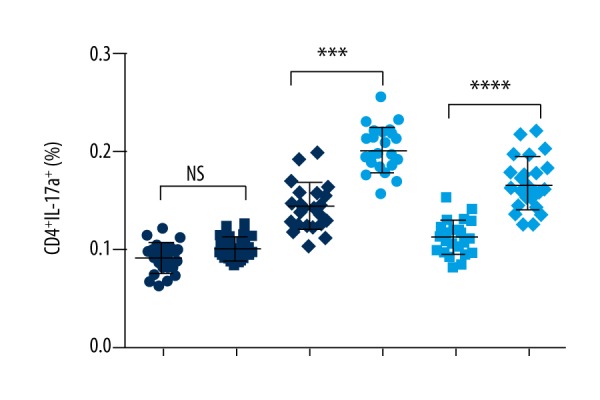
Ratio of Th17 cells in TB patients with T2D. The whole blood cell cultures of TB patients were stimulated by TB antigens. The immune cell classification was performed by flow cytometry. Each dot represents a patients’ sample. The percentage of CD4+, IL-17+ T cells was higher in TB patients with T2D than the TB patients without T2D. **** P value less than 0.0001; NS – none significance; NAS – none antigen stimulation; TB-ND – TB patients without T2D; TB-D – TB patients with T2D; N=23 in each group.
Impact of T2D on Th2 cells of TB patients
Th1 and Th2 cells are two key helper T cells in response to TB infection. The balance between Th1 and Th2 is essential for the efficiency and efficacy of eliminating TB. Upon antigen stimulation, the percentages of CD4+IL-4+, CD4+IL-6+, and CD4+IL-10+ cells were significantly higher in the TB patients with T2D than in the TB patients without T2D (Figure 4). These data suggested that coincident of T2D might stimulate classification and function of Th2 cells during TB infection.
Figure 4.

Ratio of Th2 cells in TB patients with or without T2D. The whole blood cell cultures of TB patients were stimulated by TB antigens. The immune cell classification was performed by flow cytometry. Each dot represents a patients’ sample. The percentages of CD4+IL-4+ cells (A), CD4+IL-6+ cells (B), and CD4+IL-10+ (C) was significantly increased by TB antigens, ESAT-6 and CFP-10, stimulation in vitro. NS: none significance; NAS: none antigen stimulation; TB-ND – TB patients without T2D; TB-D – TB patients with T2D; N=23 in each group. **** P value less than 0.0001; *** P value less than 0.001.
Impact of T2D on the functions of CD8+ T cells of TB patients
CD8+ T cells were one of the major effector cells in anti-TB immunity. Our results indicated that the percentage of CD8+IFN-γ+ T cells was significantly increased in TB patients without T2D by TB antigen stimulation compared to the TB patients with T2D (Figure 5A). Similarly, the ratio of CD8+Granzyme B+ cells was also higher in TB patients without T2D (Figure 5B). However, the ratio of CD8+perforin+ cells was not significantly decreased by the coincident of T2D (Figure 5C). Taken together, this data suggested that T2D might suppress the function of CD8+ T cells in TB patients.
Figure 5.

Ratio of CD8+ T cells expressing IFN-γ, Granzyme B, and perforin from TB patients with T2D. The whole blood cell cultures of TB patients were stimulated by TB antigens. The immune cell classification was performed by flow cytometry. Each dot represents a patients’ sample. (A, B) The percentages of CD8+ cells expressing IFN-γ (A) or Granzyme B (B) were decreased in the TB patients with T2D. (C) There was no significant difference in the percentage of CD8+perforin+ T cells between the TB patients with or without T2D. TB-ND – TB patients without DM; TB-D – TB patients with DM; NS – none significance; NAS – none antigen stimulation; number of patients in each group: 23; ** P value less than 0.0001; *** P value less than 0.0001; **** P value less than 0.001.
Discussion
TB is among the top 10 death causes worldwide and remains a big health care concern, especially in developing countries. T2D patients have been shown to have increased TB susceptibility than others [4,5]. Moreover, TB patients with coincident of T2D tends to have a worse response to TB treatment compare to the patients without T2D [5,14]. Previous studies revealed that some direct effects of T2D, such as hyperglycemia and insulin deficiency, led to TB development [4,5,10,13]. TB patients with T2D showed more symptoms and higher sputum culture positive rate than the TB patients without T2D [9]. Meanwhile, the coincident of TB and T2D is very common in clinics. As high as 30% of TB patients have been reported to be coincident with diabetes [7,8]. The influence of T2D on immune profiles of TB patients has also been reported in an Indian patient cohort [15,16]. However, the effects of T2D on Chinese TB patients’ immune cell profiles have not yet been investigated.
The immune response is the most effective mechanism eliminating TB infection. T2D is considered a chronic inflammatory disease [17,18]. It causes extensive alterations in systemic pro-inflammatory cytokines and inflammation inhibitory cytokines [17–19]. Studies evaluating the innate and adaptive immune response to microbial antigens in T2D patients suggest that these responses are compromised by T2D [20,21]. In our study, we found that the proportion of Th2 and Th17 cells, but not the Th1 cells, was significantly increased by antigen stimulation in TB patients with T2D. Th1 cell is known to be the key cell to mediate the adaptive immune response of TB by producing cytokines inclusive IFN-γ, TNF-α, and IL-2. The balance of Th1 and Th2 cells is critical for anti-TB immune response [22,23]. Elevated Th2 differentiation in TB patients with T2D suggests that T2D might suppress anti-TB immunity via promoting Th2 differentiation.
CD8+ T cells play a protective role in anti-TB immune response in animal models and Mycobacterium tuberculosis-specific CD8+ T cells have been identified in humans [24]. CD8+ T cells have the ability to secrete IFN-γ and TNF-α, which can activate macrophage defense mechanisms [25]. Also, CD8+ T cells help in eliminating bacteria by the granule exocytosis mechanisms [25]. We observed that there were significantly higher ratios of CD8+Granzyme B+ and CD8+IFN-γ+ cells in TB patients without T2D in response to TB antigen stimulation than in TB patients with T2D. This data indicated that the CD8+ T cells mediated protective anti-TB immunity was compromised in T2D conditions. A previous study conducted in an Indian patient cohort indicated that T2D was associated with suppressed CD8+ T cell function [16]. Additionally, the former study also observed decreased function of NK cells in T2D patients with TB [16]. Our data were in line with previous data, indicating that T2D potentially suppressed anti-TB immune responses.
Conclusions
T2D has been found to have important impacts on regulating immune intensity, thus potentially interfering TB immunity. In Chinese TB patients, we first investigated the impacts of T2D on adaptive immune cells profiles. We observed that T2D might increase Th2 and Th17 cell differentiation, but reduce the activity of CD8+ T cells. Our study supports the need to perform longitudinal studies to examine the roles of complex immunological interaction between T2D and TB in TB development.
Footnotes
Source of support: The work was supported by National Natural Science Foundation of China (81673160) and The Xinjiang Uygur Autonomous Region Natural Science Foundation (2016D01B015)
Conflicts of interest
None.
Reference
- 1.World Health Organization. Global tuberculosis report 2016. Available from: http://www.who.int/tb/publications/global_report/en/
- 2.Corbett EL1, Watt CJ, Walker N, et al. The growing burden of tuberculosis: Global trends and interactions with the HIV epidemic. Arch Intern Med. 2003;163(9):1009–21. doi: 10.1001/archinte.163.9.1009. [DOI] [PubMed] [Google Scholar]
- 3.Stevenson CR, Forouhi NG, Roglic G, et al. Diabetes and tuberculosis: the impact of the diabetes epidemic on tuberculosis incidence. BMC Public Health. 2007;7:234. doi: 10.1186/1471-2458-7-234. [DOI] [PMC free article] [PubMed] [Google Scholar]
- 4.Dooley KE, Chaisson RE. Tuberculosis and diabetes mellitus: Convergence of two epidemics. Lancet Infect Dis. 2009;9(12):737–46. doi: 10.1016/S1473-3099(09)70282-8. [DOI] [PMC free article] [PubMed] [Google Scholar]
- 5.Jeon CY, Murray MB. Diabetes mellitus increases the risk of active tuberculosis: A systematic review of 13 observational studies. PLoS Med. 2008;5(7):e152. doi: 10.1371/journal.pmed.0050152. [DOI] [PMC free article] [PubMed] [Google Scholar]
- 6.Young F, Critchley JA, Johnstone LK, Unwin NC, et al. A review of co-morbidity between infectious and chronic disease in Sub Saharan Africa: TB and diabetes mellitus, HIV and metabolic syndrome, and the impact of globalization. Global Health. 2009;5:9. doi: 10.1186/1744-8603-5-9. [DOI] [PMC free article] [PubMed] [Google Scholar]
- 7.Niazi AK, Kalra S. Diabetes and tuberculosis: A review of the role of optimal glycemic control. J Diabetes Metab Disord. 2012;11(1):28. doi: 10.1186/2251-6581-11-28. [DOI] [PMC free article] [PubMed] [Google Scholar]
- 8.Ruslami R, Aarnoutse RE, Alisjahbana B, et al. Implications of the global increase of diabetes for tuberculosis control and patient care. Trop Med Int Health. 2010;15(11):1289–99. doi: 10.1111/j.1365-3156.2010.02625.x. [DOI] [PubMed] [Google Scholar]
- 9.Alisjahbana B, Sahiratmadja E, Nelwan EJ, et al. The effect of type 2 diabetes mellitus on the presentation and treatment response of pulmonary tuberculosis. Clin Infect Dis. 2007;45(4):428–35. doi: 10.1086/519841. [DOI] [PubMed] [Google Scholar]
- 10.Jagannathan-Bogdan M, McDonnell ME, Shin H, et al. Elevated proinflammatory cytokine production by a skewed T cell compartment requires monocytes and promotes inflammation in type 2 diabetes. J Immunol. 2011;186(2):1162–72. doi: 10.4049/jimmunol.1002615. [DOI] [PMC free article] [PubMed] [Google Scholar]
- 11.Pickup JC. Inflammation and activated innate immunity in the pathogenesis of type 2 diabetes. Diabetes Care. 2004;27(3):813–23. doi: 10.2337/diacare.27.3.813. [DOI] [PubMed] [Google Scholar]
- 12.Spranger J, Kroke A, Möhlig M, et al. Inflammatory cytokines and the risk to develop type 2 diabetes: results of the prospective population – based European Prospective Investigation into Cancer and Nutrition (EPIC) – Potsdam Study. Diabetes. 2003;52(3):812–17. doi: 10.2337/diabetes.52.3.812. [DOI] [PubMed] [Google Scholar]
- 13.Vallerskog T, Martens GW, Kornfeld H. Diabetic mice display a delayed adaptive immune response to Mycobacterium tuberculosis. J Immunol. 2010;184(11):6275–82. doi: 10.4049/jimmunol.1000304. [DOI] [PMC free article] [PubMed] [Google Scholar]
- 14.Chang JT, Dou HY, Yen CL, et al. Effect of type 2 diabetes mellitus on the clinical severity and treatment outcome in patients with pulmonary tuberculosis: A potential role in the emergence of multidrug-resistance. J Formos Med Assoc. 2011;110(6):372–81. doi: 10.1016/S0929-6646(11)60055-7. [DOI] [PubMed] [Google Scholar]
- 15.Kumar NP, Sridhar R, Banurekha VV, et al. Expansion of pathogen-specific T-helper 1 and T-helper 17 cells in pulmonary tuberculosis with coincident type 2 diabetes mellitus. J Infect Dis. 2013;208(5):739–48. doi: 10.1093/infdis/jit241. [DOI] [PMC free article] [PubMed] [Google Scholar]
- 16.Kumar NP, Sridhar R, Nair D, et al. Type 2 diabetes mellitus is associated with altered CD8(+) T and natural killer cell function in pulmonary tuberculosis. Immunology. 2015;144(4):677–86. doi: 10.1111/imm.12421. [DOI] [PMC free article] [PubMed] [Google Scholar]
- 17.Donath MY, Shoelson SE. Type 2 diabetes as an inflammatory disease. Nat Rev Immunol. 2011;11(2):98. doi: 10.1038/nri2925. [DOI] [PubMed] [Google Scholar]
- 18.Dandona P, Aljada A, Bandyopadhyay A. Inflammation: The link between insulin resistance, obesity and diabetes. Trends Immunol. 2004;25(1):4–7. doi: 10.1016/j.it.2003.10.013. [DOI] [PubMed] [Google Scholar]
- 19.Wellen KE, Hotamisligil GS. Inflammation, stress, and diabetes. J Clin Invest. 2005;115(5):1111–19. doi: 10.1172/JCI25102. [DOI] [PMC free article] [PubMed] [Google Scholar]
- 20.Geerlings SE, Hoepelman AI. Immune dysfunction in patients with diabetes mellitus (DM) FEMS Immunol Med Microbiol. 1999;26(3–4):259–65. doi: 10.1111/j.1574-695X.1999.tb01397.x. [DOI] [PubMed] [Google Scholar]
- 21.Nikolajczyk BS, Jagannathan-Bogdan M, Shin H, Gyurko R. State of the union between metabolism and the immune system in type 2 diabetes. Genes Immun. 2011;12(4):239–50. doi: 10.1038/gene.2011.14. [DOI] [PMC free article] [PubMed] [Google Scholar]
- 22.Infante-Duarte C, Kamradt T. Th1/Th2 balance in infection. Springer Semin Immunopathol. 1999;21(3):317–38. doi: 10.1007/BF00812260. [DOI] [PubMed] [Google Scholar]
- 23.Lienhardt C, Azzurri A, Amedei A, et al. Active tuberculosis in Africa is associated with reduced Th1 and increased Th2 activity in vivo. Eur J Immunol. 2002;32(6):1605–13. doi: 10.1002/1521-4141(200206)32:6<1605::AID-IMMU1605>3.0.CO;2-6. [DOI] [PubMed] [Google Scholar]
- 24.North RJ, Jung YJ. Immunity to tuberculosis. Annu Rev Immunol. 2004;22:599–623. doi: 10.1146/annurev.immunol.22.012703.104635. [DOI] [PubMed] [Google Scholar]
- 25.Cooper AM. Cell-mediated immune responses in tuberculosis. Ann Rev Immunol. 2009;27(1):393–424. doi: 10.1146/annurev.immunol.021908.132703. [DOI] [PMC free article] [PubMed] [Google Scholar]