

Summary
nRNPA2, a component of RNA processing membraneless organelles, forms inclusions when mutated in a syndrome characterized by degeneration of neurons (bearing features of ALS and frontotemporal dementia), muscle, and bone. Here we provide a unified structural view of hnRNPA2 self-assembly, aggregation and interaction, and the distinct effects of small chemical changes - disease mutations and arginine methylation - on these assemblies. The hnRNPA2 low complexity (LC) domain is compact and intrinsically disordered as a monomer, retaining predominant disorder in a liquid-liquid phase separated form. Disease mutations D290V and P298L induce aggregation by enhancing and extending, respectively, the aggregation-prone region. hnRNPA2 LC directly interacts with and induces phase separation of TDP-43, which co-aggregate in disease inclusions. Conversely, arginine methylation reduces hnRNPA2 phase separation, disrupting arginine-mediated contacts. These results highlight the mechanistic role of specific LC domain interactions and modifications conserved across many hnRNP family members but altered by aggregation-causing pathological mutations.
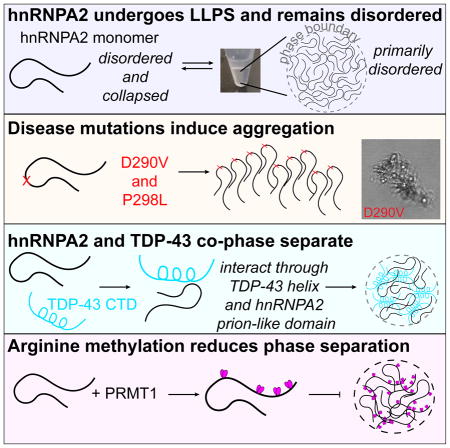
eTOC Blurb
The RNA-binding protein hnRNPA2 is mutated in disease and found in membraneless organelles but the mechanistic details of phase separation are unknown. Using NMR, simulation, and microscopy, Ryan et al. show how molecular alterations and interactions, common to a large family of disease-associated hnRNPs, alter phase separation and aggregation.
Introduction
Liquid-liquid phase separation (LLPS) has emerged as a model for the formation of membraneless organelles (Courchaine et al., 2016) including cytoplasmic stress and mRNA transport granules. These dynamic puncta are enriched in RNA and RNA-binding proteins (Brangwynne et al., 2009) many of which have low complexity (LC) domains composed primarily of polar and aromatic residues but with few aliphatic or charged residues. Similar in composition to aggregation-prone yeast prion proteins with high glutamine/asparagine content, these domains are known as “prion-like” LC domains and are found in nearly 30 human RNA-binding proteins (King et al., 2012). A number of proteins with prion-like LC domains, including FUS and TDP-43, undergo LLPS in vitro and in cells (Conicella et al., 2016; Molliex et al., 2015; Patel et al., 2015), suggesting phase separation of disordered domains underlies membraneless organelle formation. Furthermore, prion-like LC domains are found in a growing list of more than a dozen human proteins that drive in cell inclusion formation in the pathogenesis of amyotrophic lateral sclerosis (ALS) (Deng et al., 2010) and multisystem proteinopathy (MSP), a degenerative disease with elements of ALS, frontotemporal dementia, inclusion body myopathy, and Paget’s disease of bone (PDB) (Kim et al., 2013). Familial MSP-associated mutations change a conserved aspartic acid to valine at sequence-identical segments in the LC domains of hnRNPA1 (D262V) and hnRNPA2 (D290V), two homologous heterogeneous nuclear ribonuclear proteins (hnRNPs). These mutations appear to cause MSP by increasing the LC aggregation propensity of hnRNPA1 and hnRNPA2, which feature similar GYG and RGG repeats common to aggregation-prone hnRNPs (King et al., 2012). Additionally, a P298L mutation in hnRNPA2 was found in a family exhibiting clinical features of PDB alone (Qi et al., 2017) though its effect on structure and aggregation, and hence the disease mechanism, is unclear.
hnRNPA2 is best known for its physiological role in mRNA transport. It contains two folded RNA recognition motif domains (RRMs) and a C-terminal ~150 residue LC domain. Unlike hnRNPA1 which preferentially binds UAGG splice sites (Bruun et al., 2016), hnRNPA2 specifically binds and transports mRNA containing an A2 recognition element (A2RE), requiring both RRMs, but not its LC domain, to bind in vitro with maximal affinity (Hoek et al., 1998; Munro et al., 1999; Shan et al., 2000). Instead, the LC domain mediates protein-protein interactions in both nuclear and cytoplasmic granules. In the cytoplasm, phosphorylation of hnRNPA2 by Fyn kinase is essential for release of myelin basic protein mRNA from transport granules at local translation sites in oligodendrocytes and neurons (White et al., 2008). Furthermore, hnRNPA2 localizes to stress granules (Jain et al., 2016; Kato et al., 2012) while D290V increases hnRNPA2 stress granule recruitment and causes accumulation of TDP-43-positive inclusions in Drosophila muscle, mimicking patient muscle inclusions (Kim et al., 2013). In the nucleus, D290V hnRNPA2 alters alternative splicing of several genes, including ALS-associated gene DAO, in a manner consistent with a gain-of-function mechanism (Martinez et al., 2016). Therefore hnRNPA2 LC is essential for its proper nuclear and cytoplasmic function and altering the sequence in disease leads to changes in several cellular processes. Yet, little is known about hnRNPA2 LC structure, the mechanism by which it facilities normal granule assembly, or how disease mutation alters function.
Previous work shoed that mCherry-tagged hnRNPA2 LC forms hydrogels composed of labile amyloid-like fibrils that bind other proteins with prion-like LCs found in cytoplasmic granules (Kato et al., 2012). Similar LC domain chemical modification footprints for SNAP/PTB-RNA binding domain/hnRNPA2 LC fusion LLPS forms, mCherry-hnRNPA2 LC hydrogels, and cellular-derived hnRNPA2 suggest similar LC structures may be populated in each state (Xiang et al., 2015). However, direct residue-level characterization of hnRNPA2 structure and interactions is essential to understand the molecular interactions leading to LLPS and granule formation. Furthermore, hnRNPA2 LC mediates contacts with the LC domain of physiological binding partner TDP-43 (Buratti et al., 2005; D’Ambrogio et al., 2009; Romano et al., 2014), yet the structural details of this interaction as well as the effect of protein-protein interactions on phase separation have yet to be revealed. Finally, like the charged-residue-rich LC domain of RNA-binding protein Ddx4 whose methylation alters phase separation (Nott et al., 2015), the charged-residue-poor hnRNPA2 LC is asymmetrically dimethylated by protein arginine methyltransferase 1 (PRMT1) (Friend et al., 2013). Changes in PRMT1 levels and arginine methylation have been shown to alter cytoplasmic/nuclear shuttling of the related RNA-binding protein FUS and may contribute to FUS aggregation in ALS (Tradewell et al., 2012; Yamaguchi and Kitajo, 2012). However the modified sites and impact of methylation of the LC domains of hnRNPA2 and other prion-like domains is unclear. Therefore, a unified molecular picture of hnRNPA2 LC is necessary to understand the mechanistic roles of hnRNPA2 and its functional and disease-associated modifications common to the entire class of hnRNPs containing prion-like LC domains. Here we use nuclear magnetic resonance (NMR) spectroscopy, molecular simulation, and microscopy to probe hnRNPA2 structure, LLPS, and protein-protein interactions as well as the mechanistic effect of disease mutation and arginine modifications on self-assembly.
RESULTS
The monomeric LC domain of hnRNPA2 is primarily structurally disordered but compact
The LC domain of hnRNPA2 contains unusual GYG, NYN, and RGG repeats and is predicted to be intrinsically disordered. We used solution NMR spectroscopy to determine the structure of soluble, monomeric hnRNPA2 LC. The two-dimensional 1H-15N NMR correlation spectra (heteronuclear single quantum coherence, HSQC) of wild type (WT), D290V, and P298L hnRNPA2 LC have a narrow chemical shift range, characteristic of a disordered protein (Figure 1A). Chemical shift deviations (CSDs) between wild type and the disease mutations (Figure 1B,C) or engineered variants (Figure S1A) localize to the region of mutations, suggesting no change in global disordered structure. Indeed, secondary structure metrics derived from the observed chemical shifts are consistent with random coil structure (Figure S1B–D). Similarly, atomistic molecular simulations of a 44-residue subpeptide (residues 265–308) of WT, D290V, and P298L, using the approach we used for other disordered and LC domains (Conicella et al., 2016; Janke et al., 2017; Monahan et al., 2017) show disorder with little change in secondary structure due to mutation (Figure S1E–G). Furthermore, the values and uniformity of experimental backbone amide NMR spin relaxation parameters sensitive to local reorientational motion at each backbone position are also consistent with predominantly disordered local structure (Figure 1D–F).
Figure 1. Monomeric LC domain of hnRNPA2 is primarily structurally disordered but compact.

a) 1H-15N HSQC of WT hnRNPA2 LC (blue) is consistent with intrinsic disorder. (b) MSP mutation D290V (red) and (c) PDB mutation P298L (orange) show small chemical shift deviations but do not change the global disorder of hnRNPA2 LC. NMR spin relaxation parameters (d) 15N R2, (e) 15N R1, and (f) hetNOE values for hnRNPA2 LC monomer are consistent with disorder across the entire domain.
g) Consistent with significant transient interactions, extensive intramolecular PRE attenuation after incorporation of a paramagnetic probe at either S285C or S329C occurs across the domain, particularly between residues 220 and 325.
h) PFG NMR diffusion curves for hnRNPA2 LC compared to FUS LC WT and phosphomimetic (12E), and lysozyme. hnRNPA2 LC diffuses faster and thus is more collapsed than FUS LC or its phosphomimetic mutant. Solid line is best-fit solution to I/I0 = Ae−dx2 where d is the diffusion rate constant.
i) Simulated conformational ensemble of hnRNPA2 LC fragment 265–308 is more compact than wild-type or phosphomimetic FUS fragment of the same length (1–44), as judged by intramolecular distance as a function of chain separation and average Rg. Data are mean ± SD. See also Figure S1.
We next sought to characterize structural details of long-range, intradomain contacts formed by hnRNPA2 LC. We used intramolecular paramagnetic relaxation enhancement (PRE) NMR experiments (analogous to ensemble FRET experiments). PREs arise from transient close approach of a small, stabilized nitroxide spin label placed at single engineered cysteine positions to any 1H backbone position. WT, D290V, and P298L show extremely large PREs over the majority of the domain, suggestive of transient population of contacts between residues in the vicinity of the label and the attenuated positions (Figure 1G). Placement of the spin label at S285C near D290 results in near complete attenuation of NMR resonances nearly 100 residues away while significant attenuations across the entire domain are evident when a label is placed at S329C. Differences between the observed PREs for wild type and mutants are small. hnRNPA2 LC PREs are much larger than similar quantifications for FUS LC (Figure S1H), suggesting that hnRNPA2 LC may be particularly prone to transient collapse. To test compactness, we measured the hydrodynamic radius of hnRNPA2 LC, FUS LC, phosphomimetic FUS LC, and lysozyme (reference) (Wilkins et al., 1999) by a series of NMR pulsed-field gradient (PFG) diffusion experiments. hnRNPA2 LC and FUS LC are similar in length (151 and 163 residues, respectively) and hence would be predicted to have similar radii of hydration, Rh (3.20 and 3.33 nm, respectively) (Marsh and Forman-Kay, 2010). However, PFG-measured diffusion of hnRNPA2 LC is faster (Figure 1H) hence Rh is smaller (2.89 nm) than FUS LC (3.32 nm) or the phosphomimetic FUS LC which is expanded (3.97 nm) and shows lower intramolecular PREs (Monahan et al., 2017). Analogously, the simulated ensemble for the prion-like segment of hnRNPA2 LC is more compact than a same length region of FUS LC or its phosphomimetic variant (Figure 1I). Collapse of hnRNPA2 LC may be due in part to the high glycine content (47%) decreasing the expected size compared to average-sized IDPs (e.g. FUS LC: 16.6% glycine). The Rh of hnRNPA2 is ~50% larger than that of a similar length globular protein (lysozyme=2.05 nm), showing hnRNPA2 LC is not fully collapsed. Taken together, hnRNPA2 LC forms close contacts with distant parts of the chain and is smaller than average LC domains, potentially due to its high glycine content.
Aggregation-prone region of hnRNPA2 LC forms transient intermolecular interactions distributed across LC domain
To probe the initial intermolecular LC-LC interactions preceding self-assembly, we conducted experiments in dilute conditions where hnRNPA2 LC is not phase separated. First, we noticed changes in both NMR chemical shift deviations (CSDs) and transverse relaxation rate values, 15N R2, as a function of increasing hnRNPA2 LC concentration (15 μM to 90 μM) (Figure S2A), consistent with weak (Kd ~mM) interactions. CSDs are spread across the entire domain with the largest CSDs in the central region from residue 230 to 320, consistent with interactions at multiple sites. Maximal interactions for D290V is found at the site of the mutation, suggesting that D290V locally enhances contact formation, potentially seeding aggregation. A similar picture emerges from mapping enhanced 15N R2 values, ΔR2, which increase where local motions are slowed by formation of structure/contacts or at sites undergoing conformational exchange (Figure 2A, S2C,D). Other spin relaxation parameters, which are not sensitive to short-lived complexes, do not perceptibly change for WT, D290V, or P298L with increasing concentration (Figure S2E).
Figure 2. Aggregation-prone region of hnRNPA2 LC forms transient intermolecular interactions distributed across LC domain.

a) Consistent with intermolecular interactions, at high concentration (90 μM) WT and P298L hnRNPA2 LC show increased 15N R2 compared to D290V, particularly for residues 295–305.
b) Intermolecular paramagnetic relaxation enhancements (PREs, Γ2) are spread across the domain, consistent with transient contacts without specific register. Larger PREs are found for the label at S285C compared to S329C, consistent with more frequent intermolecular contacts made by the aggregation-prone 285–305 region. PREs are larger for WT than D290V or P298L; however reducing the WT sample pH to equalize predicted hnRNPA2 LC net charge decreases the Γ2 value observed for WT (cyan, pH 4.9) to the level observed for D290V (red) at pH 5.5. Data represent mean ± SD. See also Figure S2,S3.
The CSDs and ΔR2 suggest transient intermolecular contacts are distributed across the central section of the domain. Therefore, we performed relaxation dispersion NMR relaxation experiments to probe the interconversion of transiently populated states (μs to ms lifetimes). Only slight dispersion effects less than 1 s−1 are observed (Figure S2F), precluding quantitative analysis of interactions. Instead, we probed structural details of assembly using intermolecular PRE NMR. For both label positions tested, PREs are distributed across the entire domain. Importantly, we do not observe PRE profiles with a single large peak that would be consistent with preferential transient sampling of specific ordered structures, as we saw for TDP-43 CTD helix interactions or might be expected for intermolecular β-sheets with a specified register as in amyloid fibrils. However, slightly higher PREs are observed in the tyrosine-rich regions of the domain (221–235, 250–301, 319–341) (Figure 2B, Figure S3A), which may be due to favorable interactions with the tyrosine-containing regions near the labels (at S285C or S329C). In addition, PREs are higher when the spin label is placed at residue 285 compared to 329, suggesting that the aggregation-prone region forms more frequent transient intermolecular contacts than other regions. A control where no PREs are observed for unconjugated MTSL (Figure S3B) suggest that the PREs report on true contacts. Similar to the 15N R2 values and CSDs (see above), PRE values for WT are higher than those for D290V (Figure 2B), in part explained by a difference in net charge caused by the mutation (Figure 2B, Figure S3C). Despite no difference in charge, P298L shows lower PREs than WT but had the highest ΔR2 and large CSDs, suggesting that details of residue type, charge, and sequence context contribute to self-interactions probed by each technique. Taken together, CSDs, NMR spin relaxation enhancements, and paramagnetic relaxation enhancement experiments suggest initial contacts between monomers of hnRNPA2 LC are dynamic and transient, occur across the majority of the domain, lack a single specific register, and are not qualitatively altered by disease mutation.
hnRNPA2 undergoes liquid-liquid phase separation which seeds aggregate formation in the disease mutants
We hypothesized that disease mutants alter the propensity for phase separation or induce conversion to aggregates as demonstrated for hnRNPA1 (Molliex et al., 2015) and FUS (Patel et al., 2015). As we observed for FUS LC (Burke et al., 2015), hnRNPA2 LC WT, D290V, and P298L show increasing propensity for phase separation (as measured by reduced protein remaining in the supernatant, i.e. a lower saturation concentration in the dilute phase, csl (Harmon et al., 2017)) with increasing salt concentration (Figure 3A), suggesting the interactions stabilizing hnRNPA2 LC phase separation are not primarily electrostatic. D290V is also less prone to phase separate than either WT or P298L both by this experimental measure where we find an approximate doubling of csl compared to WT, as well as in coarse-grained simulations (Figure 3B) like we saw for charged variants of FUS (Monahan et al., 2017). In addition, all hnRNPA2 LC variants show initial turbidity consistent with liquid-liquid phase separation but only D290V and P298L show turbidity at time points longer than 3 hours (Figure S4A), suggesting formation of static aggregates. In our control conditions (0 mM NaCl), no LLPS is observed for WT, D290V, or P298L by microscopy (Figure 3C). At 50 mM NaCl, FRAP experiments indicate that droplets of WT, D290V, P298L are liquid at early time points, as the fluorescent signal redistributes after bleaching part of individual droplets (Figure 3D). Samples incubated individually and placed on a coverslip for observation at the specified time show fewer LLPS droplets over time for WT, consistent with fusion, sedimentation, and surface adhesion of liquid droplets (Figure 3C) explaining the observed decrease in turbidity versus time. In contrast, D290V LC forms droplets which convert to aggregates (Figure 3C, S4B), similar to what was observed for ALS-associated mutations of TDP-43 CTD (Conicella et al., 2016). Absent in the WT, fibrous structures emerge from D290V droplets (Figure S4B), reminiscent of aggregates formed for FUS mutations (Patel et al., 2015). P298L shows non-spherical species at long time points (Figure 3C). In sum, turbidity and microscopy suggest both disease variants alter hnRNPA2 LC behavior, inducing conversion of liquid forms to aggregates.
Figure 3. hnRNPA2 undergoes LLPS and mutations induce aggregation.

a) With increasing salt, hnRNPA2 LC WT, D290V, and P298L show decreasing protein remaining in the supernatant after sedimentation of droplets. WT and P298L are similar, while D290V has comparably more protein remaining, indicating decreased propensity for phase separation. Data represent mean ± SD.
b) Coexistence curve from coarse-grained slab simulations of hnRNPA2 LC with temperature normalized by the critical temperature of WT. Insert shows snapshot of a region of the simulation box containing both low and high protein density phases.
c) DIC micrographs show hnRNPA2 LC WT, D290V, and P298L form liquid droplets. Over time, D290V droplets seed persistent aggregates with fibrous structure. P298L forms non-spherical clusters consistent with aggregation. In the absence of salt (NMR conditions), no micron-sized species are observed. Scale bar represents 30 μm.
d) Fluorescence recovery after photobleaching experiments show that freshly made WT, D290V, and P298L hnRNPA2 LC droplets recover similarly from partial droplet bleach, consistent with liquid behavior. Scale bar represents 5 μm.
e) Full-length WT hnRNPA2 undergoes LLPS after cleavage of a solubility tag. At the same conditions, D290V quickly forms aggregates. Over time, WT droplets fuse and grow while D290V aggregates grow larger. P298L forms droplets initially but aggregates over time. Deletion of LC domain (residues 1–189, ΔLC) prevents both LLPS and aggregation. Scale bar, 30 μm.
f) D290V has amyloid zipper propensity at the NYNVFG peptide exceeding an estimated Rosetta energy threshold for amyloid formation (line at −23 kcal/mol), while P298L shows both increased zipper propensity at the QQLSNY peptide and extended zipper-favoring region (peptides starting at residues 293 to 297).
See also Figure S4.
We next evaluated LLPS maturation of full-length hnRNPA2 by cleavage of an N-terminal maltose binding protein solubility tag as we performed for FUS previously. Full-length WT hnRNPA2 undergoes robust LLPS after cleavage of the solubility tag (Figure 3E). Full-length P298L appears to undergo LLPS but these droplets convert into aggregates at longer time. Full-length D290V appears to immediately form aggregates after cleavage of the solubility tag that grow larger with time. A variant lacking the LC domain, ΔLC, does not undergo LLPS or aggregation at these conditions, suggesting that the LC domain is necessary for both phase separation and aggregation.
To elucidate a mechanism for the aggregation differences between WT and the disease mutations, we tested the effect of the mutations on quantification of steric zipper (Zipper DB (Thompson et al., 2006)) and prion-like (PLAAC (Lancaster et al., 2014)) propensity. Removal of the charged aspartic acid residue by D290V slightly enhances hnRNPA2 LC prion-like sequence composition (Figure S4C) and increases the favorability of packing the mutated 6-residue peptide region into “steric zipper” amyloid fibril models (Figure 3F) (Kim et al., 2013). Hence prion-like composition correlates with aggregation propensity for D290V. Conversely, P298L mutation in fact decreases the prion-like propensity (Figure S4C) because leucine is much less likely than proline to be found in prion-like domains. However, P298L results in a peptide with slightly higher local zipper propensity (QQLSNY) and also significantly extends the length of the amyloid-prone region by 5 additional residues (Figure 3F, S4D). Therefore, prion-like sequence composition alone cannot explain the heightened aggregation and disease mechanism caused by mutations.
hnRNPA2 LC remains predominantly disordered in the phase separated state
We sought to characterize the underlying structure of wild-type hnRNPA2 LC assembled after LLPS. Based on the significant population of disordered structure of FUS LC after LLPS (Burke et al., 2015), we hypothesized that hnRNPA2 LC also remains predominantly disordered after LLPS. Analogous to our method of generating a large droplet of FUS LC (Burke et al., 2015), we induced hnRNPA2 LC phase separation by diluting highly concentrated denatured protein into buffer with 150 mM NaCl to a final protein concentration of 280 μM which instantaneously phase separates into a turbid solution. The sample was then cooled on ice to increase the extent of phase separation and centrifuged to collect phase separated hnRNPA2 LC at the bottom of the tube with effectively no protein remaining in the supernatant (< 1 μM). The condensed phase formed at this high protein concentration remains opaque and does not flow at room temperature, unlike the room temperature liquid forms of FUS LC we generated previously. However, upon heating the phase to 65°C, the condensed phase becomes transparent and flows like a liquid, forming a clear liquid-liquid phase boundary with the protein-dilute phase above it (Figure 4A). We transferred the liquid condensed phase along with a similar volume of the dilute phase to an NMR tube at high temperature. Subsequent cooling to room temperature resulted in reversible opaque gel formation, similar to macroscopic volumes of liquid-liquid phase separated FUS LC when cooled below room temperature (Burke et al., 2015). We suspect that the solution conditions (including protein, salt, and buffer concentrations) create a phase that is very high in protein density, leading to gelation (i.e. forming a system spanning network) (Harmon et al., 2017) due to entangled polymers. Because ionic strength can alter protein concentration in condensed phases formed by LLPS (Brady et al., 2017), we tested samples made in lower salt concentrations (50 mM NaCl) to see if low salt would result in a phase that is liquid at lower temperatures. However, this lower salt phase also remained an opaque gel at room temperature, becoming liquid near 65°C. As the biophysical interactions underlying phase separation of low complexity domains appears to be the same at low and high temperatures (Brady et al., 2017), we performed our analysis of the dense phase of hnRNPA2 LC at 65°C.
Figure 4. hnRNPA2 LC remains predominantly disordered in the phase separated state.

a) NMR spectrum of phase separated (apparent concentration 30 mM, green) hnRNPA2 LC is highly similar to the spectrum of the monomeric peptide in dispersed phase (65 μM, black), indicating that the conformations that give rise to the observed LLPS resonances remain disordered. Insert shows the two-phase LLPS system (condensed phase below the dilute phase) at 65°C immediately before transfer to NMR tube. All samples at 65°C.
b) Overlay of 15N edited one-dimensional spectra of 65 μM monomer (reference) and phase separated state without scaling. The monomeric signals are so weak compared to the phase separated state, they appear as a straight line. c) The monomeric spectrum is visible at much lower intensity than the phase separated state, d) about 470 times less intense than the condensed phase signals, providing an estimated concentration in the condensed phase.
e) NMR spin relaxation parameters R2, R1, NOE sensitive to local motions at observable resonances of phase-separated (green) and monomer (black) hnRNPA2 LC are consistent with structural disorder but slowed motions after LLPS. Slightly lower values of R2 for dispersed phase reference sample at lower pH (grey) suggest some contribution from water exchange to measured R2. All samples were run at 65°C.
Data are mean ± SD. See also Figure S4.
LLPS condensed phases of hnRNPA2 LC are approximately 440 mg/mL (~30 mM) as determined by estimation of the 1H signal intensity compared to a monomeric sample of known concentration (reference sample concentration (65 μM) * signal intensity factor (470x)) (Figure 4B–D). Estimates based on the observed volume of phase-separated material are similar (~40 mM). This value is similar to the concentration observed for the highly charged Ddx4 LC domain at 100 mM NaCl (up to ~400 mg/mL at 25 °C and ~300 mg/mL at 70 °C) (Brady et al., 2017), but markedly higher than our estimate of 120 mg/mL (7 mM) for FUS LC prepared in a similar fashion, possibly explaining the higher temperature needed to liquefy the hnRNPA2 LC phase. Given the correspondence between the estimates of concentration derived from protein density and NMR signal intensity, it appears that the observed resonances arise from a large fraction (at least 75%) of the hnRNPA2 LC molecules. Providing a snapshot of the chemical environment at each backbone position, the 1H-15N HSQC shows broad but resolved resonances with minimal differences compared to the monomer in the same conditions, indicating that the observable conformations within LLPS hnRNPA2 LC maintains a similar structure as in the monomer (Figure 4A, S4E). Providing further details about side chain conformations, the 1H-13C HSQC also showed minimal differences between the monomer and condensed phase further demonstrating there are no major structural differences for the conformations giving rise to the observable resonances (Figure S4F). The condensed phase made in lower salt conditions showed similar spectra, suggesting that the LC domain conformations are not globally different in the LLPS phases created in different conditions (Figure S4G).
Site-specifically resolved NMR spin relaxation experiments were performed to determine if local structure formation (either transient or stable) could be detected through alterations of local motions in the LLPS condensed phase (Figure 4E). 15N R1 and heteronuclear NOE values for phase-separated hnRNPA2 LC are higher than those of the monomeric reference sample at the high temperature. Changes in these values are both consistent with slowed local motions compared to the monomer. However, local motions are more rapid than in folded proteins and correlation times remain in the nanosecond range, similar to LLPS forms of FUS LC (Burke et al., 2015), Ddx4 (Brady et al., 2017), and elastin-like proteins (Reichheld et al., 2017). Importantly, relatively uniform values suggest similar dynamic environments across the domain. Unlike R1 and NOE, 15N R2 for the dense phase and monomer appear similar except for a local increase in the region near D290 in the dense phase. This local enhancement may indicate that the NYN-repeat-rich aggregation-prone region makes more contacts in the dense phase, consistent findings from chemical foot printing for both hydrogel fibrils and cellular hnRNPA2 (Xiang et al., 2015). Rapid amide hydrogen exchange with water hydrogens complicates R2 measurement at high temperatures and can dominate the measured rate (Jurt and Zerbe, 2012) which may explain the similarity of R2 in other sequence regions. In summary, for the LLPS conformations giving rise to the observed resonances, the chemical shifts and relaxation parameters are consistent with predominant structural disorder and partially restricted motion across the entire LC domain.
hnRNPA2 LC co-phase separates and aggregates with TDP-43 CTD
To understand how hnRNPA2 LC binds other LC domains, we probed contacts between hnRNPA2 LC and the TDP-43 C-terminal LC domain (CTD). In a titration, small CSDs (Figure S5A) and nearly uniform decrease hnRNPA2 LC NMR resonance intensity upon addition of TDP-43 CTD (Figure S5B) suggest weak interactions spread across the entire LC domain or fractional incorporation into small droplets. To further probe site-specific interactions in dilute solution (no LLPS), we performed intermolecular PRE experiments with labels at each of four different positions on TDP-43 CTD and measured site-specific contacts formed with NMR-visible (15N) hnRNPA2 LC (Figure 5E). Highest observed PRE values occur when the spin label is placed near the helix of TDP-43 (S317C) suggesting interaction with hnRNPA2 near residues 225 and 275. Correspondingly, the largest PREs are observed near S317 when NMR-visible TDP-43 CTD is mixed with spin labeled hnRNPA2 LC (Figure 5F). In accordance with this finding, the lowest PRE values for 15N hnRNPA2 LC occur when TDP-43 is labeled at S350C, a region that also shows the lowest PREs when NMR-visible TDP-43 CTD is mixed with spin-labeled hnRNPA2 LC. Therefore, transient interactions probed by PRE are self-consistent. Taken together, these data suggest that at these conditions hnRNPA2 LC directly interacts with TDP-43 CTD broadly and weakly but with some sequence-specificity, particularly for the helical region of TDP-43.
Figure 5. hnRNPA2 LC co-phase separates and aggregates with TDP-43 CTD.

a) In 0 mM NaCl, neither hnRNPA2 LC (AlexaFluor-488, green) nor TDP-43 CTD (AlexaFluor-555, red) phase separate on their own even at 40 μM (2:0 and 0:2). However, mixing them at equal concentrations (20 μM, 1:1), induces co-localization to structures resembling droplets (see d).
b) In 50 mM NaCl, TDP-43 CTD does not phase separate on its own even at 40 μM (0:2) but hnRNPA2 LC phase separates at both concentrations. Upon mixing, hnRNPA2 LC and TDP-43 CTD co-localize in droplets.
c) After 2 hours in 50 mM NaCl, TDP-43 CTD shows faint elongated species distinct from droplets. When mixed 1:1 and left to incubate for 2 hours, hnRNPA2 LC and TDP-43 CTD form spherical structures connected by elongated assemblies.
d) Brightfield images of 1:1 hnRNPA2 LC:TDP-43 CTD at each salt concentration. At 0 mM NaCl, 1:1 hnRNPA2:TDP-43 form structures wetting the surface of the coverslip. At 50 mM NaCl, liquid droplets form initially and convert to aggregates.
e) Intermolecular PRE experiments mixing 15 μM 15N hnRNPA2 LC with 10 μM (black) or 5 μM (gray) natural abundance TDP-43 CTD conjugated to an MTSL at S273C, S317C, S350C, or S387C show that hnRNPA2 interacts with TDP-43 CTD primarily in the region of the helix (S317C) and the C-terminal region (S387C). These interactions are weaker than those observed for homotypic interaction.
f) Intermolecular PRE experiments mixing 10 μM 15N TDP-43 CTD with 15 μM natural abundance hnRNPA2 LC conjugated to an MTSL at S285C or S329C show that hnRNPA2 interacts with TDP-43 CTD primarily in the region of the helix (residues 320–340).
Data are mean ± SD. Scale bar represents 4 μm. See also Figure S5.
Efforts to increase PREs by increasing protein concentration were limited by sample LLPS. Therefore, we tested if TDP-43 stimulates hnRNPA2 phase separation. We quantified turbidity and found that hnRNPA2 LC shows increased turbidity in the presence of TDP-43 CTD (Figure S5C). To test the hypothesis that hnRNPA2 LC and TDP-43 CTD co-phase separate, we performed microscopy with AlexaFluor488-tagged hnRNPA2 LC and AlexaFluor555-tagged TDP-43 CTD. In 0 mM NaCl, neither hnRNPA2 LC nor TDP-43 CTD phase separate on their own at 20 μM or 40 μM, but when mixed together at 20 μM each, they co-localize to small (~1 μm) assemblies which appear to wet the glass slide surface (Figure 5A,D). At 50 mM NaCl, hnRNPA2 LC, but not TDP-43, phase separates alone while hnRNPA2 LC and TDP-43 CTD mixtures co-localize to liquid droplets, indicating hnRNPA2 LC phase separation recruits TDP-43 CTD (Figure 5B). After 2 hours, higher concentrations of TDP-43 alone show evidence of aggregation (Figure 5C). Therefore, although TDP-43 CTD and hnRNPA2 LC interact weakly in conditions disfavoring phase separation, hnRNPA2 LC avidly recruits TDP-43 CTD to co-assemble in LLPS.
hnRNPA2 LC is methylated by PRMT1 only at RGG positions, decreasing hnRNPA2 LC phase separation
Conflicting evidence from proteomic analyses on the number of sites methylated has hampered efforts to understand the role of PRMT1 methylation of hnRNPA2 LC. One study found that hnRNPA2 LC is dimethylated by PRMT1 only at R254 (Friend et al., 2013), another found dimethylation at all four RGG sites and monomethylation at five additional sites (Geoghegan et al., 2015), while a third suggested that PRMT1 can methylate substrates at non-RGG positions including RGF which is present in hnRNPA2 LC (Wooderchak et al., 2008). Therefore we used in vitro methylation and NMR detection to directly identify the positions in hnRNPA2 LC that PRMT1 can modify. By directly observing the arginine side chain positions, we detect robust arginine asymmetric dimethylation after treatment of MBP-tagged (solubilized) hnRNPA2 LC with PRMT1 in vitro followed by TEV cleavage of tag and complete re-purification to remove all PRMT1 and S-adenosyl methionine (Figure 6A–C). In the NMR spectrum providing residue-level resolution of backbone positions, we observe small chemical shifts deviations for the R and first G residues of 191RGG and 254RGG after methylation (Figure 6D–E, S6A). However, mass spectrometry of methylated hnRNPA2 LC shows up to 8 methylation events, consistent with dimethylation of four positions (Figure S6B). Because the modification is far from the amino NH detected in backbone HSQCs (Theillet et al., 2012), it is possible that all four RGG sites are methylated but backbone chemical shift deviations are too small to be detected at all sites. Therefore, we introduced arginine to lysine mutations R191K and R254K (2KGG) to determine if 201RGG and 216RGG are methylated despite absence of backbone CSDs. Indeed, we observe a robust peak corresponding to asymmetric dimethylation in the 2KGG sample incubated with PRMT1 (Figure 6B). To determine if PRMT1 can methylate non-RGG arginine positions including the similar 226RGF, we generated hnRNPA2 LC R191K/R201K/R216K/R254K (4KGG) that showed no methylation (Figure 6C). Therefore, in vitro methylation of hnRNPA2 LC by PRMT1 is consistent with modification at all four RGG sites and no other arginine positions.
Figure 6. hnRNPA2 LC is methylated by PRMT1 only at RGG positions, decreasing hnRNPA2 LC phase separation.

a) 1H-15N NMR spectrum of hnRNPA2 LC WT centered on arg-side chain region shows characteristic HNη and HNε resonances for asymmetric dimethylation of arginine Nη. A minor peak for monomethylation is observed.
b) 2KGG variant (R191K, R254K) shows resonances characteristic for asymmetric dimethylation and monomethylation, suggesting other Arg sites are modified.
c) 4KGG (R191K, R201K, R216K, and R254K) does not show arginine methylation, suggesting that the RGG positions are the only methylated sites.
1H-15N backbone centered HSQC of hnRNPA2 LC after PRMT1 methylation (magenta) and mock treatment (blue) show slight shifts near RGG motif residues (d) glycine 192 and 255 and (e) arginine 191 and 254.
f) Methylation reduces phase separation, quantified by the amount remaining in supernatant after centrifugation. Data are mean ± SD.
g) Diffusion of methylated and mock treated hnRNPA2 LC is similar.
h) Simulation conformational ensemble of asymmetrically dimethylated hnRNPA2 LC fragment (190–233, methylated at R191, R201, R216) is structurally expanded with a larger Rg, compared to unmethylated form.
i) Intra-molecular contact propensity from the low-Rg (<1.2 nm) sub-ensemble of unmodified (76% of total conformers) and methylated (22%) simulations shows specific contacts are destabilized by methylation.
j) Contact propensities between given arginine residues and other residues of the simulated 190–233 hnRNPA2 show that methylation at RGGs disrupts arginine-aromatic interactions. See also Figure S6.
As RGG methylation by PRMT1 reduces phase separation of the highly-charged Ddx4 LC (Nott et al., 2015), we hypothesized that the same would be true for prion-like hnRNPA2 LC. By quantifying the critical concentration for phase separation via droplet sedimentation (see above), methylated hnRNPA2 LC remains at up to 50% higher concentration in the dilute phase (i.e. raised critical concentration for phase separation, csl) compared to unmethylated hnRNPA2 LC at all three salt conditions tested (Figure 6F). At 25 mM NaCl where phase separation is not yet maximal, turbidity is also decreased for methylated hnRNPA2 LC (Figure S6C). DIC microscopy suggests that the turbid species observed in these assays are droplets (Figure S6D). Importantly, these data directly suggest arginine residues mediate contacts in prion-like domain phase separation. We attempted to study the effect of methylation on phase separation of full-length hnRNPA2 using our MBP-solubilized construct. Unfortunately, the long incubation at 37°C in the presence of high concentration of S-adenosyl methionine induced aggregation of MBP-tagged hnRNPA2 protein even for mock reactions lacking PRMT1 (Figure S6E).
Because of the collapsed structure and repetitive sequence features of hnRNPA2 LC, we hypothesized that characterization of the effects of methylation on the monomeric domain could shed light on the molecular mechanisms resulting in decreased phase separation due to altered intermolecular interaction. At low salt conditions disfavoring phase separation, we do not see significant differences in local motions and structure as probed by NMR spin relaxation (15N R2) (Figure S6F) and global compaction (Rh) as probed by NMR diffusion experiments (Figure 6G), though these experiments are challenging due to limited sample and the diffusion experiment is not site specific. To focus on the potential interactions altered by arginine asymmetric dimethylation, we used the same molecular simulation approach as above, this time on a short 44-residue peptide containing three of the four RGG sites (190–233). While the secondary structure of this primarily disordered region is not affected (Figure S6G), methylation does increase the overall radius of gyration (Rg) of the short simulated peptide (Figure 6H). For the collapsed population fraction (Rg < 1.2 nm), the unmethylated peptide forms interaction hot spots absent in the methylated form (Figure 6I, S6H). Plotting the intramolecular contact propensity for each arginine residue shows that RGG arginine positions R191, R201, and R216 form preferential contacts with aromatic residues that are largely disrupted by methylation (Figure 6J). Taken together, these data suggest that asymmetric dimethylation of hnRNPA2 LC decreases LLPS by disrupting arginine-aromatic interactions.
DISCUSSION
Like disease mutations in hnRNPA1, TDP-43, and FUS (Conicella et al., 2016; Molliex et al., 2015; Patel et al., 2015), disease variants D290V and P298L induce hnRNPA2 aggregation. Mutations in hnRNPA2 and hnRNPA1 LC domains have previously been suggested to cause disease-associated aggregation by removing unfavorable like-charge interactions (Kim et al., 2013). Conversely, hnRNPA2 P298L probed here does not alter charge and in fact decreases the prion-like propensity yet still leads to aggregation. This highly conserved proline (Kim et al., 2013) is replaced by a hydrophobic residue, removing structural incompatiblity with β-sheet amyloids, hence extending the region compatible with steric zippers. Therefore, proline residues (Steward et al., 2002) may be particularly important for inhibiting aggregation in prion-like low complexity domains that lack significant charged-residue content.
LLPS forms of hnRNPs serve as in vitro models of granule structures. We find that our LLPS preparations of hnRNPA2 LC, like FUS LC (Burke et al., 2015) and Ddx4 (Brady et al., 2017), remain predominantly disordered across the LC domain. Hence, formation of predominant structure is not required for phase separation of hnRNPA2 LC. It is important to note that our solution NMR approach is biased to observe the most mobile or fast-moving segments or chains in the LLPS dense phase. However, the signal intensity is extremely large, amounts to hundreds of times that observed for an entirely monomeric reference sample at identical conditions, and is similar to our concentration estimate derived from the volume of condensed phase, we can quantitatively estimate that we are observing resonances from the majority of the sample and thus observing the major conformational state. These observations do not preclude the presence of other secondary structures but does place limits on the population of unobserved conformations at these conditions. Our approach is complementary to analyses of liquid phases both in vitro and in cells (Xiang et al., 2015). Future work directly interrogating LC domain structure and contacts within complex RNP granules in living remains a critical frontier to understand their conserved functional roles. Furthermore, multiple hnRNPs are found together in physiological granules where their LC domains mediate contacts and function. Here, we show how hnRNPA2 LC dynamically and transiently interacts with the LC domain of TDP-43 and induces TDP-43 CTD LLPS. These data provide direct structural support for a model where hnRNP LC domains can mediate granule recruitment (Falkenberg et al., 2017) and form dynamic molecular contacts (Lin et al., 2015).
An emerging area involves functional regulation of granule protein self-assembly via posttranslational modifications. Arginine methylation decreases Ddx4 phase separation (Nott et al., 2015) but induces granule formation of Lsm4 (Arribas-Layton et al., 2016). Here we show that PRMT1 can methylate hnRNPA2 LC at 4 RGG sites and not at other arginine positions. Our simulations suggest methylation disrupts interactions between arginine guanidyl group and aromatic residues, consistent with methylation-induced changes in arginine charge distribution (Khoury et al., 2013). The role of posttranslational modifications in regulating low complexity domains and phase separation is therefore emerging as a critical area of research and potential modifier of toxicity (Monahan et al., 2017).
In conclusion, these results provide structural insight in the extensively characterized biochemical, physiological, and pathological roles of hnRNPA2. The differing effects of posttranslational modification and disease mutation on self-assembly and aggregation characterized here will enable future efforts to modify function and aggregation in disease. Indeed, altering self-assembly by changing post translational state via endogenous signaling pathways may prove useful to discourage disease-associated inclusion formation by wild-type or mutated forms of the dozens of hnRNP family members bearing similar sequence features with overlapping roles in disease.
Star Methods
Key Resources Table
The table highlights the genetically modified organisms and strains, cell lines, reagents, software, and source data essential to reproduce results presented in the manuscript. Depending on the nature of the study, this may include standard laboratory materials (i.e., food chow for metabolism studies), but the Table is not meant to be comprehensive list of all materials and resources used (e.g., essential chemicals such as SDS, sucrose, or standard culture media don’t need to be listed in the Table). Items in the Table must also be reported in the Method Details section within the context of their use. The number of primers and RNA sequences that may be listed in the Table is restricted to no more than ten each. If there are more than ten primers or RNA sequences to report, please provide this information as a supplementary document and reference this file (e.g., See Table S1 for XX) in the Key Resources Table.
Please note that ALL references cited in the Key Resources Table must be included in the References list. Please report the information as follows:
REAGENT or RESOURCE: Provide full descriptive name of the item so that it can be identified and linked with its description in the manuscript (e.g., provide version number for software, host source for antibody, strain name). In the Experimental Models section, please include all models used in the paper and describe each line/strain as: model organism: name used for strain/line in paper: genotype. (i.e., Mouse: OXTRfl/fl: B6.129(SJL)-Oxtrtm1.1Wsy/J). In the Biological Samples section, please list all samples obtained from commercial sources or biological repositories. Please note that software mentioned in the Methods Details or Data and Software Availability section needs to be also included in the table. See the sample Table at the end of this document for examples of how to report reagents.
SOURCE: Report the company, manufacturer, or individual that provided the item or where the item can obtained (e.g., stock center or repository). For materials distributed by Addgene, please cite the article describing the plasmid and include “Addgene” as part of the identifier. If an item is from another lab, please include the name of the principal investigator and a citation if it has been previously published. If the material is being reported for the first time in the current paper, please indicate as “this paper.” For software, please provide the company name if it is commercially available or cite the paper in which it has been initially described.
-
IDENTIFIER: Include catalog numbers (entered in the column as “Cat#” followed by the number, e.g., Cat#3879S). Where available, please include unique entities such as RRIDs, Model Organism Database numbers, accession numbers, and PDB or CAS IDs. For antibodies, if applicable and available, please also include the lot number or clone identity. For software or data resources, please include the URL where the resource can be downloaded. Please ensure accuracy of the identifiers, as they are essential for generation of hyperlinks to external sources when available. Please see the Elsevier list of Data Repositories with automated bidirectional linking for details. When listing more than one identifier for the same item, use semicolons to separate them (e.g. Cat#3879S; RRID: AB_2255011). If an identifier is not available, please enter “N/A” in the column.
A NOTE ABOUT RRIDs: We highly recommend using RRIDs as the identifier (in particular for antibodies and organisms, but also for software tools and databases). For more details on how to obtain or generate an RRID for existing or newly generated resources, please visit the RII or search for RRIDs.
Please use the empty table that follows to organize the information in the sections defined by the subheading, skipping sections not relevant to your study. Please do not add subheadings. To add a row, place the cursor at the end of the row above where you would like to add the row, just outside the right border of the table. Then press the ENTER key to add the row. Please delete empty rows. Each entry must be on a separate row; do not list multiple items in a single table cell. Please see the sample table at the end of this document for examples of how reagents should be cited.
KEY RESOURCES TABLE.
| REAGENT or RESOURCE | SOURCE | IDENTIFIER |
|---|---|---|
| Antibodies | ||
| Bacterial and Virus Strains | ||
| BL21 Star DE3 | Life Technologies | C601003 |
| Biological Samples | ||
| Chemicals, Peptides, and Recombinant Proteins | ||
| AlexaFluor 488 maleimide | ThermoFisher | A10254 |
| AlexaFluor 555 NHS ester | ThermoFisher | A37571 |
| hnRNPA2 LC (190-341) hnRNPA2 LC D290V hnRNPA2 LC P298L hnRNPA2 LC WT S285C hnRNPA2 LC WT S329C hnRNPA2 LC D290V S285C hnRNPA2 LC D290V S329C hnRNPA2 LC P298L S285C hnRNPA2 LC P298L S329C MBP-hnRNPA2 full length MBP-hnRNPA2 full length D290V MBP-hnRNPA2 full length P298L MBP-hnRNPA2 ΔLC (i.e. hnRNPA2 1-189) MBP-hnRNPA2 LC (190-341) MBP-hnRNPA2 LC (190-341) R191K R254K MBP-hnRNPA2 LC (190-341) R191K R201K R216K R254K |
This study | n/a |
| TDP-43 CTD | This study/Conicella et al | n/a |
| PRMT1 | AtGen | PRM0802 |
| Critical Commercial Assays | ||
| Deposited Data | ||
| hnRNPA2 LC WT | This study | BMRB: 27123 |
| hnNRPA2 LC D290V | This study | BMRB: 27124 |
| hnRNPA2 LC P298L | This study | BMRB: 27299 |
| TDP-43 CTD | Conicella et al. | BMRB: 26823 |
| Experimental Models: Cell Lines | ||
| Experimental Models: Organisms/Strains | ||
| Oligonucleotides | ||
| Recombinant DNA | ||
| hnRNPA2_LC_WT | This study | Addgene: 98657 |
| hnRNPA2_LC_D290V | This study | Addgene: 98658 |
| hnRNPA2_LC_P298L | This study | Addgene: 104465 |
| hnRNPA2_LC_D220V | This study | Addgene: 98659 |
| hnRNPA2_LC_D230V | This study | Addgene: 98660 |
| hnRNPA2_LC_WT_S285C | This study | Addgene: 98665 |
| hnRNPA2_LC_WT_S329C | This study | Addgene: 98667 |
| hnRNPA2_LC_D290V_S285C | This study | Addgene: 98666 |
| hnRNPA2_LC_D290V_S329C | This study | Addgene: 98668 |
| hnRNPA2_LC_P298L_S285C | This study | Addgene: 104469 |
| hnRNPA2_LC_P298L_S329C | This study | Addgene: 104470 |
| MBP-hnRNPA2_LC | This study | Addgene: 98661 |
| MBP-hnRNPA2_LC_R191K_R254K | This study | Addgene: 104466 |
| MBP-hnRNPA2_LC_R191K_R201K_R216K_R254K | This study | Addgene: 104467 |
| MBP-hnRNPA2_FL_WT | This study | Addgene: 98662 |
| MBP-hnRNPA2_FL_D290V | This study | Addgene: 98663 |
| MBP-hnRNPA2_FL_P298L | This study | Addgene: 104468 |
| MBP-hnRNPA2_ΔLC | This study | Addgene: 98664 |
| TDP-43 CTD | Conicella et al. 2016 | Addgene: 98669 |
| Software and Algorithms | ||
| nmrPipe | Frank Delagio | https://www.ibbr.umd.edu/nmrpipe/install.html |
| ImageJ | NIH | https://imagej.nih.gov/ij/download.html |
| SSP | Julie Forman-Kay | http://abragam.med.utoronto.ca/software.html |
| Delta2D | Michele Vendruscolo | http://www-mvsoftware.ch.cam.ac.uk/ |
| GROMACS-4.6.7 | Lindahl et al., 2001 | |
| HOOMD-Blue v2.1.5 | Anderson et al., 2008 | |
| Plumed 2.1 | Tribello et al., 2014 | |
| Other | ||
| TABLE WITH EXAMPLES FOR AUTHOR REFERENCE | ||
|---|---|---|
| REAGENT or RESOURCE | SOURCE | IDENTIFIER |
| Antibodies | ||
| Rabbit monoclonal anti-Snail | Cell Signaling Technology | Cat#3879S; RRID: AB_2255011 |
| Mouse monoclonal anti-Tubulin (clone DM1A) | Sigma-Aldrich | Cat#T9026; RRID: AB_477593 |
| Rabbit polyclonal anti-BMAL1 | This paper | N/A |
| Bacterial and Virus Strains | ||
| pAAV-hSyn-DIO-hM3D(Gq)-mCherry | Krashes et al., 2011 | Addgene AAV5; 44361-AAV5 |
| AAV5-EF1a-DIO-hChR2(H134R)-EYFP | Hope Center Viral Vectors Core | N/A |
| Cowpox virus Brighton Red | BEI Resources | NR-88 |
| Zika-SMGC-1, GENBANK: KX266255 | Isolated from patient (Wang et al., 2016) | N/A |
| Staphylococcus aureus | ATCC | ATCC 29213 |
| Streptococcus pyogenes: M1 serotype strain: strain SF370; M1 GAS | ATCC | ATCC 700294 |
| Biological Samples | ||
| Healthy adult BA9 brain tissue | University of Maryland Brain & Tissue Bank; http://medschool.umaryland.edu/btbank/ | Cat#UMB1455 |
| Human hippocampal brain blocks | New York Brain Bank | http://nybb.hs.columbia.edu/ |
| Patient-derived xenografts (PDX) | Children’s Oncology Group Cell Culture and Xenograft Repository | http://cogcell.org/ |
| Chemicals, Peptides, and Recombinant Proteins | ||
| MK-2206 AKT inhibitor | Selleck Chemicals | S1078; CAS: 1032350-13-2 |
| SB-505124 | Sigma-Aldrich | S4696; CAS: 694433-59-5 (free base) |
| Picrotoxin | Sigma-Aldrich | P1675; CAS: 124-87-8 |
| Human TGF-β | R&D | 240-B; GenPept: P01137 |
| Activated S6K1 | Millipore | Cat#14-486 |
| GST-BMAL1 | Novus | Cat#H00000406-P01 |
| Critical Commercial Assays | ||
| EasyTag EXPRESS 35S Protein Labeling Kit | Perkin-Elmer | NEG772014MC |
| CaspaseGlo 3/7 | Promega | G8090 |
| TruSeq ChIP Sample Prep Kit | Illumina | IP-202-1012 |
| Deposited Data | ||
| Raw and analyzed data | This paper | GEO: GSE63473 |
| B-RAF RBD (apo) structure | This paper | PDB: 5J17 |
| Human reference genome NCBI build 37, GRCh37 | Genome Reference Consortium | http://www.ncbi.nlm.nih.gov/projects/genome/assembly/grc/human/ |
| Nanog STILT inference | This paper; Mendeley Data | http://dx.doi.org/10.17632/wx6s4mj7s8.2 |
| Affinity-based mass spectrometry performed with 57 genes | This paper; and Mendeley Data | Table S8; http://dx.doi.org/10.17632/5hvpvspw82.1 |
| Experimental Models: Cell Lines | ||
| Hamster: CHO cells | ATCC | CRL-11268 |
| D. melanogaster: Cell line S2: S2-DRSC | Laboratory of Norbert Perrimon | FlyBase: FBtc0000181 |
| Human: Passage 40 H9 ES cells | MSKCC stem cell core facility | N/A |
| Human: HUES 8 hESC line (NIH approval number NIHhESC-09-0021) | HSCI iPS Core | hES Cell Line: HUES-8 |
| Experimental Models: Organisms/Strains | ||
| C. elegans: Strain BC4011: srl-1(s2500) II; dpy-18(e364) III; unc-46(e177)rol-3(s1040) V. | Caenorhabditis Genetics Center | WB Strain: BC4011; WormBase: WBVar00241916 |
| D. melanogaster: RNAi of Sxl: y[1] sc[*] v[1]; P{TRiP.HMS00609}attP2 | Bloomington Drosophila Stock Center | BDSC:34393; FlyBase: FBtp0064874 |
| S. cerevisiae: Strain background: W303 | ATCC | ATTC: 208353 |
| Mouse: R6/2: B6CBA-Tg(HDexon1)62Gpb/3J | The Jackson Laboratory | JAX: 006494 |
| Mouse: OXTRfl/fl: B6.129(SJL)-Oxtrtm1.1Wsy/J | The Jackson Laboratory | RRID: IMSR_JAX:008471 |
| Zebrafish: Tg(Shha:GFP)t10: t10Tg | Neumann and Nuesslein-Volhard, 2000 | ZFIN: ZDB-GENO-060207-1 |
| Arabidopsis: 35S::PIF4-YFP, BZR1-CFP | Wang et al., 2012 | N/A |
| Arabidopsis: JYB1021.2: pS24(AT5G58010)::cS24:GFP(-G):NOS #1 | NASC | NASC ID: N70450 |
| Oligonucleotides | ||
| siRNA targeting sequence: PIP5K I alpha #1: ACACAGUACUCAGUUGAUA | This paper | N/A |
| Primers for XX, see Table SX | This paper | N/A |
| Primer: GFP/YFP/CFP Forward: GCACGACTTCTTCAAGTCCGCCATGCC | This paper | N/A |
| Morpholino: MO-pax2a GGTCTGCTTTGCAGTGAATATCCAT | Gene Tools | ZFIN: ZDB-MRPHLNO-061106-5 |
| ACTB (hs01060665_g1) | Life Technologies | Cat#4331182 |
| RNA sequence: hnRNPA1_ligand: UAGGGACUUAGGGUUCUCUCUAGGGACUUAGGGUUCUCUCUAGGGA | This paper | N/A |
| Recombinant DNA | ||
| pLVX-Tight-Puro (TetOn) | Clonetech | Cat#632162 |
| Plasmid: GFP-Nito | This paper | N/A |
| cDNA GH111110 | Drosophila Genomics Resource Center | DGRC:5666; FlyBase:FBcl0130415 |
| AAV2/1-hsyn-GCaMP6-WPRE | Chen et al., 2013 | N/A |
| Mouse raptor: pLKO mouse shRNA 1 raptor | Thoreen et al., 2009 | Addgene Plasmid #21339 |
| Software and Algorithms | ||
| Bowtie2 | Langmead and Salzberg, 2012 | http://bowtie-bio.sourceforge.net/bowtie2/index.shtml |
| Samtools | Li et al., 2009 | http://samtools.sourceforge.net/ |
| Weighted Maximal Information Component Analysis v0.9 | Rau et al., 2013 | https://github.com/ChristophRau/wMICA |
| ICS algorithm | This paper; Mendeley Data | http://dx.doi.org/10.17632/5hvpvspw82.1 |
| Other | ||
| Sequence data, analyses, and resources related to the ultra-deep sequencing of the AML31 tumor, relapse, and matched normal. | This paper | http://aml31.genome.wustl.edu |
| Resource website for the AML31 publication | This paper | https://github.com/chrisamiller/aml31SuppSite |
Contact for reagent and resource sharing
Further information and requests for resources and reagents should be directed to and will be fulfilled by the Lead Contact, Nicolas Fawzi (nicolas_fawzi@brown.edu).
Experimental model and subject details
Bacterial culture
Uniformly 15N or 13C labeled proteins were expressed in M9 with 15N ammonium chloride as the sole nitrogen source or 13C-glucose as the sole carbon source as appropriate. Unlabeled proteins were expressed in LB. Cell pellets were harvested from 1 liter cultures induced with IPTG at an OD600 of 0.6–1 after 4 hours at 37°C. LC cell pellets were resuspended in 20 mM NaPi pH 7.4, 300 mM NaCl, 10 mM imidazole while MBP-tagged pellets were resuspended in 20 mM NaPi pH 7.4, 1 M NaCl, 10 mM imidazole with a Roche Complete EDTA-free protease inhibitor. Resuspended pellets were lysed on an Emulsiflex C3 and the cell lysate cleared by centrifugation (20,000 xg for 60 minutes at 4°C).
Method Details
Constructs
The following constructs and general purification strategies were used for protein expression in BL21 Star (DE3) E. coli cultures (Life Technologies):
hnRNPA2 LC (190-341), insoluble histag purification
hnRNPA2 LC D290V, insoluble histag purification
hnRNPA2 LC WT and D290V S285C and S329C variants for PRE, insoluble histag purification
MBP-hnRNPA2 full length, soluble histag purification
MBP-hnRNPA2 full length D290V, soluble histag purification
MBP-hnRNPA2 ΔLC (i.e. hnRNPA2 1-189), soluble histag purification
MBP-hnRNPA2 LC (190-341), soluble histag purification
MBP-hnRNPA2 LC (190-341) R191K R254K, soluble histag purification
MBP-hnRNPA2 LC (190-341) R191K R201K R216K R254K, soluble histag purification
Unless otherwise specified, N-terminal his-tags were removed with TEV leaving untagged proteins with only 3 residue (GHM) cleavage (G for TEV) and cloning (HM as the in-frame translation of the NdeI cloning site) artifacts.
Protein purification
TDP-43 CTD was purified as described (Conicella et al., 2016). FUS constructs were purified as described (Monahan et al., 2017). Samples for NMR spectroscopy were produced in M9 minimal media with 15N and 13C precursors as appropriate for the experiment.
Protein expression of WT, D290V, and P298L hnRNPA2 was performed in E. coli. hnRNPA2 LC inclusion bodies were resuspended in 8 M urea, 20 mM NaPi pH 7.4, 300 mM NaCl, 10 mM imidazole and cleared by centrifugation at 20,000 xg for 60 minutes at 4°C. The cleared supernatant was filtered using a 0.2 μm filter and loaded onto a HisTrap HP 5 mL column. Protein was eluted in a gradient of 10 to 300 mM imidazole over five column volumes. Fractions containing hnRNPA2 LC were pooled, concentrated, and diluted into pH 5.5 MES to a final urea concentration of <500 mM. Protein was then incubated with TEV protease overnight at room temperature. After TEV cleavage, protein was solubilized in 8 M urea and loaded onto a HisTrap HP 5 mL column. Flow through containing cleaved hnRNPA2 LC was collected, concentrated, buffer exchanged into 8 M urea, pH 5.5 MES (pH adjusted with Bis/Tris). Protein was flash frozen at concentrations of 2–4 mM.
Cleared MBP-hnRNPA2 lysate was loaded onto a HisTrap HP 5 mL column. Protein was eluted in a gradient of 10 to 300 mM imidazole over five column volumes. Fractions containing MBP-hnRNPA2 were pooled and loaded onto a Superdex 200 sizing column equilibrated in 20 mM sodium phosphate 1 M sodium chloride pH 7.4. Protein fractions determined to contain minimal degradation products by gel were pooled, concentrated by centrifugal concentration, and stored at 4°C until assays could be performed the following day for full length hnRNPA2 constructs. MBP-hnRNPA2 LC constructs were flash frozen in 25% glycerol and glycerol was buffer exchanged out by centrifugal concentration before assays.
MTSL labeling
Single cysteine variants were stored in 8 M urea pH 5.5 MES with 1 mM DTT. Prior to conjugating the label, stocks were diluted into 8 M urea, 20 mM HEPES pH 8 and desalted on a HiPrep 26/10 Desalting column (GE) equilibrated in the same buffer, to remove DTT. Protein was then split in two portions and incubated with 1 mM MTSL label (more than 10x excess) or a diamagnetic analog for 1 hour at room temperature. Protein was desalted to remove excess label. Labeled protein was then concentrated and buffer exchanged into 8 M urea 20 mM MES pH 5.5 using centrifugal filtration with a 3 kDa cutoff (Amicon, Millipore) and flash frozen.
Methylation by PRMT1
Low complexity domain methylated samples were generated by mixing purified 100 μM MBP-A2 LC with 100 μL of recombinant His-MBP tagged human PRMT1 (AtGen) and excess SAM and incubating overnight at 37°C. An unmethylated control was generated the same way, replacing the 100 μL of PRMT1 with 100 μL of 40 mM Tris pH 8 with 50% glycerol (PRMT1 storage buffer). The sample was then diluted into pH 5.5 MES (pHed with Bis/Tris) and TEV was added to cleave the MBP tag from hnRNPA2 LC. The next morning, the cleavage reaction was brought to 8 M urea, 20 mM NaPi pH 7.4, 300 mM NaCl, 10 mM imidazole with solid urea and NaCl, 1 M stock of NaPi and 5 M stock of imidazole. The reaction was purified on a 1 mL HisTrap HP, the flow through containing cleaved hnRNPA2 LC collected, and the bound (waste) MBP, TEV, and PRMT1 (all his-tagged) eluted from the column in 8 M urea, 20 mM NaPi pH 7.4, 300 mM NaCl, 300 mM imidazole. The collected flow through containing only cleaved hnRNPA2 LC was concentrated, buffer exchanged into 8 M urea pH 5.5 MES (Bis/Tris), and flash frozen for later NMR and turbidity experiments.
Methylation reactions on full length protein were performed on MBP-tagged protein. Immediately after purification, protein was concentrated to 130 μM and diluted to 45 μM in the reaction conditions. Reaction conditions are as follows: 50 μL PRMT1 (or 40 mM Tris pH 8 for -PRMT1 conditions), 25 μL SAM (~8 mM, or water for -SAM conditions) for a total volume of 110 μL. Reactions were then incubated at 37°C overnight.
Phase separation, turbidity, and microscopy
Phase separation quantification of critical concentration
Phase separation was assessed by inducing phase separation by diluting hnRNPA2 LC WT, D290V, or P298L from 8 M urea into 20 mM MES pH 5.5 containing the appropriate salt concentration in triplicate at 20 μM. Final residual urea concentration 150mM. Samples were allowed to equilibrate for 10 minutes then spun down at 17,000 xg for 10 minutes at room temperature. Protein concentration remaining in the supernatant was determined by NanoDrop, using the extinction coefficient of 25330 M−1cm−1. Phase separation assays comparing methylated and unmethylated hnRNPA2 LC were performed the same way with 20 μM protein and 250 mM urea (due to low protein concentration after methylation reaction and subsequent purification).
Turbidity
hnRNPA2 LC was prepared for turbidity or microscopy experiments by diluting protein stored in 8 M urea into the final experimental conditions (150 mM urea). Turbidity experiments were performed in 96 well clear plates (Costar®) with 65 μL samples sealed with clear optical adhesive film (MicroAmp®, ThermoFisher). Turbidity measurements were recorded by measuring the optical density at 600 nm using a Cytation 3 Cell Imaging Multi-Mode Reader (BioTek) at 2 minute time intervals for up to 12 hours after dilution into experimental condition. The microplate reader pre-mixed samples 5 seconds before beginning the kinetic experiment and read from the bottom of the plate. Experiments were conducted in triplicate and then averaged. Turbidity values were reported after subtracting the average optical density of buffer control at 600 nm at each time point.
Turbidity experiments with TDP-43 were performed as follows. WT hnRNPA2 LC was diluted to 20 μM final concentration from 8 M urea storage buffer. TDP-43 was desalted into 20 mM MES pH 6.1 from the 8 M urea storage buffer with a Zeba desalting column (Pierce) equilibrated in the MES 6.1 buffer. Amounts of TDP-43 were added in appropriate ratios to hnRNPA2 LC concentration. Equivalent volumes of pH 6.1 buffer were added to all wells with lower concentrations of TDP-43 (including the no TDP-43 conditions) to ensure equivalent pH across all samples. Experiments were performed in 96 well clear plates (Costar®) with 65 μL samples create samples sealed with clear optical adhesive film (MicroAmp®, ThermoFisher). Turbidity measurements were recorded on a Cytation 3 Cell Imaging Multi-Mode Reader (BioTek) at 5 minute time intervals for 12 hours after dilution into experimental condition. The microplate reader pre-mixed samples 5 seconds before beginning the kinetic experiment and read from the bottom of the plate. Experiments were conducted in triplicate and then averaged. Turbidity values were reported after subtracting the average optical density of buffer control at 600 nm at each time point.
Methylated LC samples were diluted from 8 M urea into 20 mM 0 or 25 mM NaCl 20 mM MES pH 5.5 (Bis/Tris). Final hnRNPA2 concentration was 10 μM. Unmethylated controls were treated the same. Experiments were performed in 96 well clear plates (Costar®) with 65 μL samples create samples sealed with clear optical adhesive film (MicroAmp®, ThermoFisher). Turbidity measurements were recorded on a Cytation 3 Cell Imaging Multi-Mode Reader (BioTek) at 5 minute time intervals for 12 hours after dilution into experimental condition. The microplate reader pre-mixed samples 5 seconds before beginning the kinetic experiment and read from the bottom of the plate. Experiments were conducted in duplicate (+PRMT1) or triplicate (-PRMT1) and then averaged. Turbidity values were reported after subtracting the average optical density of buffer control at 600 nm at each time point.
Microscopy
hnRNPA2 LC samples were prepared for microscopy by diluting protein into experimental conditions with a final volume of 50 μL. Droplets and aggregates were observed with differential interference contrast on an Axiovert 200M microscope (Zeiss) after pipetting 20 μL of sample onto a coverslip – samples were aged in microtubes and fresh coverslips samples were prepared for each time point. FRAP experiments were performed on a Zeiss LSM 510 confocal microscope with a 40x water objective. Images were acquired with 1 second intervals and processed with ImageJ (NIH) using the FRAP_Calculator v3 macro. Briefly, after background intensity was subtracted, fluorescence intensities were normalized to unbleached, reference droplets in order to account for any illumination changes during acquisition.
MBP-hnRNPA2 full length morphological changes over time were assessed using differential interference microscopy on an Axiovert 200M microscope (Zeiss). 50 μL samples of 15 μM protein in 20 mM Tris pH 7.5, with a final NaCl concentration of 50 mM were prepared for each time point. Protein was diluted directly from the 20 mM sodium phosphate pH 7.4, 1 M NaCl pH 7.4 size exclusion chromatography buffer. TEV protease was added at time 0. 20 μL of sample was spotted onto a coverslip and the water drop imaged.
Microscopy for TDP-43 CTD hnRNPA2 LC co-phase separation was performed on an LSM 710 (Zeiss). Samples with given concentration of hnRNPA2 or TDP-43 were made using unlabeled protein and AlexaFluor labeled protein (maleamide at S285 for hnRNPA2 and NHS-ester for TDP-43) was doped in at <1 μM to prevent oversaturation of the detector. Samples were 50 μL and contained 150 mM urea. TDP-43 was diluted from 20 mM NaOAc/HOAc pH 3.7 buffer, hnRNPA2 was diluted from 8 M urea. Snapshots were taken of the red and green channels and merged using ImageJ (NIH).
For microscopy, methylated and unmethylated LC samples were diluted from 8 M urea to a final protein concentration of 20 μM with 250 mM urea. Samples were made in 20 mM 0 mM, 25 mM. or 50 mM NaCl 20 mM MES pH 5.5 (Bis/Tris) at 50 uL and mixed before spotting 20 μL on a coverslip for imaging using differential interference microscopy on an Axiovert 200M microscope (Zeiss).
After methylation reactions on full length proteins were complete, samples were made for microscopy. 30 μL samples were prepared with 15 μM protein in Tris pH 7.5. Final salt concentration was 110 mM due to the remaining salt concentration in the PRMT1 reactions. Samples were exposed to TEV protease for 30 minutes and 15 μL spotted on a coverslip for imaging with differential interference microscopy as described above.
NMR spectroscopy
Solution NMR samples
Monomeric samples
hnRNPA2 LC NMR samples were made by diluting protein from 8 M urea into 20 mM MES, pH 5.5 or lower including 10% 2H2O, to a final urea concentration of 150 mM. Sample concentrations were estimated using the extinction coefficients calculated by ProtParam.
Dense phase samples
~15 mM stock of 15N hnRNPA2 LC in 8 M urea, 20 mM MES, pH 5.5 was diluted to 10 mL with a final urea concentration of 150 mM in 20 mM MES pH 5.5, 50 or 150 mM NaCl (final protein concentration of ~280 μM). Sample was heated to 42°C to clear initial cloudiness and ensure mixing, then cooled on ice and centrifuged at 4000 xg for 10 min at 4°C. After one 10 mL sample, a dense phase of about 65 μL was evident at the bottom of the tube. The supernatant was removed and replaced with new supernatant and the process repeated 2 times (30 mL disperse droplets total), for a final dense phase volume of about 200 μL. The pooled supernatant had almost no protein remaining (< 1 μM) as measured by A280. At room temperature, the dense phase appeared to be a gel and could not be transferred to an NMR tube. As such, the dense phase was heated to 65°C, where it began to flow like a liquid and was able to be transferred by Pasteur pipette to a 3 mm NMR tube (Norell). Sample was maintained at 65°C for the duration of the NMR experiments.
Solution NMR experiments
NMR experiments were recorded at 25°C (or 65°C, only for the phase separated state and corresponding monomeric controls) using Bruker Avance III HD NMR spectrometer operating at 850 MHz or, if indicated 500 MHz, 1H frequency equipped with a Bruker TCI z-axis gradient cryogenic probe. Experimental sweep widths, acquisition times, and the number of transients were optimized for the necessary resolution, experiment time, and signal to noise for each experiment type.
Assignment experiments
Triple resonance assignment experiments were performed on samples of 13C/15N uniformly labeled hnRNPA2 LC (conditions: 20 mM MES pH 5.5, 10% 2H2O, 25°C). CBCA(CO)NH, HNCACB, HNCO, HN(CA)CO, a high resolution HNCA, and HNN experiments with sweep widths 10 ppm (CBCA(CO)NH only) or 13 ppm in 1H (center 4.7), 17 ppm in 15N (center 115.5), 6 ppm (center 175.5) in 13C for CO experiments, 42 ppm (center 46.7) in 13C for CA/CB experiments, 22 ppm (center 53.7) for HNCA, and 20 ppm (center 116) in 13C for HNN using standard Bruker Topspin3.2 pulse programs with default parameter sets (cbcaconhgp3d, hncagp3d, hncacbgp3d, hncacogp3d, hncogp3d, and hncannhgp3d). Experiments comprised 72–130, 218,72–94, 86, 3072–4096 total points in the indirect 15N, indirect 13Cα, indirect 13Cα/Cβ, indirect 13CO, and direct 1H dimensions, respectively. Carbon HSQC: 13C carbon HSQCs were performed with 700 and 3072 total points in the 15N indirect and 1H direct dimensions, corresponding to acquisition times of 23 ms and 139 ms, and sweep widths of 70 ppm and 13 ppm centered around 42.75 ppm and 4.7 ppm, respectively.
Relaxation
Motions of the backbone of hnRNPA2 LC in the dispersed/monomeric phase were probed using 15N R1, temperature-compensated 15N R2, and heteronuclear NOE experiments using standard pulse sequences (hsqct1etf3gpsitc3d, hsqct2etf3gpsitc3d, hsqcnoef3gpsi, respectively, from Topspin 3.2, Bruker). Interleaved experiments comprised 256×3072 total points in the indirect 15N and direct 1H dimensions, respectively, with corresponding acquisition times of 87 ms and 172 ms, sweep width of 17 ppm and 10.5 ppm, centered at 115.5 ppm and 4.7 ppm, respectively. 15N R2 experiments had an interscan delay of 2.5 s, a Carr-Purcell-Meiboom-Gill (CPMG) field of 556 Hz, and total R2 relaxation CMPG loop-lengths of 16.5 ms, 264.4 ms, 181.8 ms, 33.1 ms, 115.7 ms, 82.6 ms, and 165.3 ms. 15N R1 experiments had an interscan delay of 1.2 s, and total R1 relaxation loop-lengths of 100 ms, 1000 ms, 200 ms, 800 ms, 300 ms, 600 ms, and 400 ms. Heteronuclear NOE experiments were conducted with an interscan delay of 5 s.
hnRNPA2 LC backbone motions in the phase separated state and corresponding monomeric controls were measured at 65°C. Interleaved experiments comprised 256×3072 total points in the indirect 15N and direct 1H dimensions, respectively, with corresponding acquisition times of 87 ms and 172 ms, sweep width of 17 ppm and 10.5 ppm, centered at 115.5 ppm and 4.3 ppm, respectively. 15N R2 experiments had an interscan delay of 2.5 s, a Carr-Purcell-Meiboom-Gill (CPMG) field of 556 Hz, and total R2 relaxation CMPG loop-lengths of 16.525 ms, 33.05 ms, 115.675 ms, and 82.625 ms. 15N R1 experiments had an interscan delay of 1.2 s, and total R1 relaxation loop-lengths of 100 ms, 1000 ms, 200 ms, 800 ms, 300 ms, 600 ms, and 400 ms. Heteronuclear NOE experiments were conducted with an interscan delay of 5 s.
Relaxation dispersion
15N Carr Purcell Meiboom Gill (CPMG) relaxation dispersion experiments (Wang et al., 2001) were used to measure effective transverse relaxation rates, 15N R2eff, as a function of applied radiofrequency field, B1, to interrogate the μs-ms timescale conformational exchange of hnRNPA2 LC WT. Samples were 90 μM or 15 μM. Each 15N CPMG relaxation dispersion experiment comprises 10 interleaved 15N B1 fields: 0 Hz, 44 Hz, 88 Hz, 133 Hz, 177 Hz, 266 Hz, 355 Hz, 488 Hz, 577 Hz, and 666 Hz, with a total CPMG relaxation delay of 90 ms. Each experiment was acquired with 256 and 3072 total points in the indirect 15N and direct 1H dimensions, with corresponding acquisition time of 87 ms and 172 ms, and sweep widths 17 ppm and 10.5 ppm centered around 115.5 ppm and 4.7 ppm respectively.
Paramagnetic relaxation enhancement
Transient intermolecular interactions between monomers were probed using paramagnetic relaxation enhancement experiments. Backbone amide proton transverse relaxation rate constant, 1HN R2, were measured as described(Fawzi et al., 2010) using hsqcf3gpph19 at 850 MHz 1H frequency for paramagnetic and diamagnetic samples, with 256 and 3072 total points in the 15N indirect and 1H direct dimensions, corresponding acquisition times of 87 ms and 172 ms, and sweep widths of 17 ppm and 10.5 ppm centered around 115.5 ppm and 4.7 ppm, respectively. Each 1HN R2 experiment comprised six interleaved 1HN R2 relaxation delays: 0.2 ms, 90.2 ms, 10.2 ms, 60.2 ms, 20.2 ms, and 40.2 ms.
We attempted to measure intramolecular PREs (Γ2) using explicit measurement of 1HN R2 experiments. However, extremely large PREs across the LC domain precluded quantitation of PREs this way. Instead, we quantified the peak intensity of paramagnetic samples and then added ascorbate to reduce the paramagnetic nitroxide spin label and re-measured the peak intensity. HSQCs were performed with 160 and 2560 total points, in the 15N indirect and 1H direct dimensions, corresponding to acquisition times of 54 ms and 143 ms, and sweep widths of 17 ppm and 10.5 ppm centered around 115.5 ppm and 4.7 ppm, respectively.
Methylation
In vitro methylation was detected by a backbone HSQC and an HSQC centered on the arginine side chains. Backbone HSQCs were performed with 512 and 3072 total points in the 15N indirect and 1H direct dimensions, corresponding to acquisition times of 175 ms and 172 ms, and sweep widths of 17 ppm and 10.5 ppm centered around 115.5 ppm and 4.7 ppm, respectively. HSQCs centered on the arginine side chains were performed with 128 and 3072 total points in the 15N indirect and 1H direct dimensions, corresponding to acquisition times of 43 ms and 172 ms, and sweep widths of 24 ppm and 10.5 ppm centered around 76 ppm and 4.7 ppm, respectively.
TDP-43 Interaction
Titration of 15N hnRNPA2 LC with natural abundance TDP-43 CTD was performed at 500 1H frequency. Individual samples with constant hnRNPA2 LC concentration but different TDP-43 concentrations were made. HSQCs were performed with 512 and 3072 total points in the 15N indirect and 1H direct dimensions, corresponding to acquisition times of 301 ms and 292 ms, and sweep widths of 17 ppm and 10.5 ppm centered around 115.5 ppm and 4.7 ppm, respectively. Chemical shifts and intensity ratios were quantified by subtracting the chemical shift value for each 1H-15N crosspeak of the 1:0 hnRNPA2 LC:TDP-43 CTD reference sample from the respective crosspeak at higher TDP-43 CTD concentration. hnRNPA2 LC-TDP-43 CTD paramagnetic relaxation enhancement experiments were performed by diluting hnRNPA2 LC from 8 M urea to a final protein and urea concentration of 15 μM and 150 mM respectively. TDP-43 was frozen in 8 M urea and then buffer exchanged into 20 mM HOAc/NaOAc at pH 3.7 and diluted into the NMR buffer. NMR was performed in 20 mM MES pH 5.5 (Bis/Tris). Intermolecular PRE experiments were performed and analyzed as described above at 850 MHz 1H frequency.
Pulsed-Field Gradient Diffusion
Diffusion measurements were performed at 500 MHz 1H frequency on 500 μL samples with 150 mM urea and 50 μL 20 mM CAPS pH 11 in 20 mM MES pH 5.5 (Bis/Tris). Proteins were diluted to 30 μM or 60 μM (lysozyme). Diffusion was measured as 1D experiments using the standard Bruker ledbpgppr2s1d pulse sequence. Gradient strength was 5%, 15%, 25%, 35%, 45%, 55%, 65%, 75%, 85%, 95%. Data was analyzed by extracting the intensity values from 6.6 ppm to 7.38 ppm (side chains) and determining the slope of the correlation between each gradient strength and 5%.
Simulations
Molecular dynamics simulations were performed on hnRNPA2 265–308 WT, D290V, and P298L, as well as methylated and unmethylated versions of hnRNPA2 190–233 using parallel tempering in the well-tempered ensemble (PTWTE) (Bonomi and Parrinello, 2010) with explicit TIP4P/2005 water (Abascal and Vega, 2005) and the Amber ff03ws or Amber ff99SBws (Best et al., 2014) protein force fields. Asymmetrically dimethylated arginine was parameterized for use with the Amber99SBws force field by utilizing a similar approach as that applied to the original parameterization of the force field using Restrained Electrostatic Potential (RESP) fitting (Wang et al., 2000). Atomistic simulations are conducted using GROMACS-4.6.7 (Lindahl et al., 2001) and Plumed 2.1 (Tribello et al., 2014). NMR shifts are calculated using the SPARTA+ algorithm (Shen and Bax, 2010), while secondary structure is determined using the DSSP dictionary (Kabsch and Sander, 1983). All simulations are conducted at constant temperature using Langevin dynamics.
Coarse-grained simulations are conducted with the same amino acid resolution model we used for FUS LC (Monahan et al., 2017), which implements a hydrophobicity scale from Kapcha and Rossky (Kapcha and Rossky, 2014) and a coulombic term with Debye-Hückel screening (Debye and Huckel, 1923). Efficient sampling of the phase coexistence is attained using slab method at a set of temperatures (Silmore et al., 2017). The critical temperature is obtained by fitting the high and low density phases for each of the temperature values to:
in which the critical exponent β=0.325 (universality class of 3D Ising model) and A is a protein-specific fitting parameter, as done by Silmore et al. (Silmore et al., 2017). Slab simulations are conducted using HOOMD-Blue v2.1.5 (Anderson et al., 2008).
List of simulations and system sizes presented in this work:
| System | Force field/model | # Atoms/Particle |
|---|---|---|
| hnRNPA2265-308 WT + TIP4P/2005 | Amber 99SBws | 27639 |
| hnRNPA2265-308 D290V + TIP4P/2005 | Amber 99SBws | 27618 |
| hnRNPA2265-308 P298L + TIP4P/2005 | Amber 99SBws | 27600 |
| hnRNPA2265-308 WT + TIP4P/2005 | Amber 03ws | 27639 |
| hnRNPA2265-308 D290V + TIP4P/2005 | Amber 03ws | 27618 |
| hnRNPA2265-308 P298L + TIP4P/2005 | Amber 03ws | 27600 |
| hnRNPA2190-233 WT + TIP4P/2005 | Amber 99SBws | 27656 |
| hnRNPA2190-233 ADMA + TIP4P/2005 | Amber 99SBws | 27682 |
| hnRNPA2190-341 WT x 100 | CG HPS model | 15200 |
| hnRNPA2190-341 D290V x 100 | CG HPS model | 15200 |
| hnRNPA2190-341 P298L x 100 | CG HPS model | 15200 |
Data availability
NMR chemical shift assignments in this paper for hnRNPA2 LC WT (27123), D290V (27124), and P298L (27299) can be obtained online from the Biological Magnetic Resonance Database (BMRB, http://www.bmrb.wisc.edu/). TDP-43 CTD chemical shifts were obtained from the BMRB (26823). Plasmids generated for this project can be found at Addgene.org.
Quantification and statistical analysis
Phase separation, Turbidity, and FRAP
Statistical analysis was performed in Microsoft Office Excel. All data are shown as mean +/− standard deviation. A two tailed t-test was performed to determine significance of methylated versus unmethylated hnRNPA2 LC turbidity, no further statistical tests were performed.
NMR Spectroscopy
Assignments
Data were processed with nmrPipe using default linear prediction parameters for either constant time or real time indirect dimensions and assigned in CARA (Keller, 2005). Chemical shift perturbations and intensity ratio: Chemical shifts were calculated by subtracting the chemical shifts of a reference peak from the chemical shift of a experimental peak. Intensity ratios were calculated from the height of each peak and error was propagated from the signal to noise values of each spectrum.
Relaxation
Data were processed with nmrPipe (Delaglio et al., 1995), apodized with a cosine squared bell function in the 1H dimension and a cosine bell function in the 15N dimension. Best-fit R2 relaxation rates were calculated using least squares optimization of 1H/15N peak intensities to a single exponential function.
Paramagnetic relaxation enhancement values
Data were processed with nmrPipe (Delaglio et al., 1995), apodized with a cosine squared bell function in the 1H dimension and a cosine bell function in the 15N dimension. Best-fit relaxation rates were calculated using least squares optimization of 1H/15N peak intensities to a single exponential function. PRE rates (Γ2) rates were obtained from the difference in 1HN R2 rates for the paramagnetic and diamagnetic samples 1HN R2para − 1HN R2dia.
Diffusion
Data was plotted and fit to the equation I/I0 = Ae−dx2 where I/I0 is the ratio of the signal intensity at any gradient strength normalized to the intensity at the reference strength (i.e. 5%), d is the decay rate, and x is the gradient strength (Wilkins et al., 1999). Rh was calculated using the reported Rh value of lysozyme (2.05 nm) and the equation described in Wilkins et al. Rhprot = dref/dprot(Rhref) where the reference molecule is lysozyme and dref is the value calculated from our data for lysozyme.
Simulations
Values are plotted as mean ± SEM derived from 10 equal divisions of the converged ensemble.
Supplementary Material
Figure 7. Model: hnRNPA2 phase separation is modulated by disease mutations, TDP-43 interaction, and posttranslational modifications.

The LC of hnRNPA2 is collapsed and undergoes LLPS, which readily converts to aggregates for disease mutations. hnRNPA2 LC and the C-terminal domain of TDP-43 interact and co-phase phase separate via transient interactions while hnRNPA2 LC methylation by PRMT1 reduces phase separation.
Highlights.
hnRNPA2 LC monomer is disordered but compact and undergoes LLPS.
hnRNPA2 LC remains predominantly disordered in the phase separated state.
P298L and D290V mutations enhance aggregation, Arg methylation decreases LLPS.
hnRNPA2 LC and TDP-43 CTD co-phase separate and induce co-aggregation.
Acknowledgments
We thank Kaylee Mathews and Carolina Meija Peña for preliminary PRMT1 assay testing and Elif Senyurt for early participation in simulations. Research was supported in part by NIGMS R01GM118530 (to N.L.F), P20GM104937, ALS Association 17-IIP-342 (to N.L.F.), and a grant from the Judith & Jean Pape Adams Charitable Foundation (to N.L.F). V.H.R. and A.E.C were supported in part by T32MH020068 and T32GM07601, respectively, and BIBS Graduate Awards. Work at Lehigh University was supported by the U.S. Department of Energy (DOE), Office of Science, Basic Energy Sciences (BES), Division of Material Sciences and Engineering, under Award DE-SC0013979 (to J.M.). Use of the high-performance computing capabilities of the Extreme Science and Engineering Discovery Environment (XSEDE), which is supported by the National Science Foundation (NSF) Grant TG-MCB-120014, is gratefully acknowledged. This research used resources of the National Energy Research Scientific Computing Center, a DOE Office of Science User Facility supported by the Office of Science of the U.S. Department of Energy under Contract No. DE-AC02-05CH11231. The content is solely the responsibility of the authors and does not necessarily represent the official views of the funding agencies.
Footnotes
Author Contributions
V.H.R., C.V.C, A.E.C., J.A., R.S., K.A.B., and N.L.F. designed, performed, and analyzed in vitro experiments. G.L.D., G.H.Z., and J.M. designed and performed simulation experiments and analyzed the related data. V.H.R. and N.L.F. wrote the manuscript.
Declaration of Intrests
The authors declare no competing interests.
Publisher's Disclaimer: This is a PDF file of an unedited manuscript that has been accepted for publication. As a service to our customers we are providing this early version of the manuscript. The manuscript will undergo copyediting, typesetting, and review of the resulting proof before it is published in its final citable form. Please note that during the production process errors may be discovered which could affect the content, and all legal disclaimers that apply to the journal pertain.
References
- Abascal JL, Vega C. A general purpose model for the condensed phases of water: TIP4P/2005. J Chem Phys. 2005;123:234505. doi: 10.1063/1.2121687. [DOI] [PubMed] [Google Scholar]
- Anderson JA, Lorenz CD, Travesset A. General purpose molecular dynamics simulations fully implemented on graphics processing units. J Comput Phys. 2008;227:5342–5359. [Google Scholar]
- Arribas-Layton M, Dennis J, Bennett EJ, Damgaard CK, Lykke-Andersen J. The C-Terminal RGG Domain of Human Lsm4 Promotes Processing Body Formation Stimulated by Arginine Dimethylation. Mol Cell Biol. 2016;36:2226–2235. doi: 10.1128/MCB.01102-15. [DOI] [PMC free article] [PubMed] [Google Scholar]
- Best RB, Zheng W, Mittal J. Balanced Protein-Water Interactions Improve Properties of Disordered Proteins and Non-Specific Protein Association. J Chem Theory Comput. 2014;10:5113–5124. doi: 10.1021/ct500569b. [DOI] [PMC free article] [PubMed] [Google Scholar]
- Bonomi M, Parrinello M. Enhanced sampling in the well-tempered ensemble. Phys Rev Lett. 2010;104:190601. doi: 10.1103/PhysRevLett.104.190601. [DOI] [PubMed] [Google Scholar]
- Brady JP, Farber PJ, Sekhar A, Lin YH, Huang R, Bah A, Nott TJ, Chan HS, Baldwin AJ, Forman-Kay JD, et al. Structural and hydrodynamic properties of an intrinsically disordered region of a germ cell-specific protein on phase separation. Proc Natl Acad Sci U S A. 2017;114:E8194–E8203. doi: 10.1073/pnas.1706197114. [DOI] [PMC free article] [PubMed] [Google Scholar]
- Brangwynne CP, Eckmann CR, Courson DS, Rybarska A, Hoege C, Gharakhani J, Julicher F, Hyman AA. Germline P granules are liquid droplets that localize by controlled dissolution/condensation. Science. 2009;324:1729–1732. doi: 10.1126/science.1172046. [DOI] [PubMed] [Google Scholar]
- Bruun GH, Doktor TK, Borch-Jensen J, Masuda A, Krainer AR, Ohno K, Andresen BS. Global identification of hnRNP A1 binding sites for SSO-based splicing modulation. BMC Biol. 2016;14:54. doi: 10.1186/s12915-016-0279-9. [DOI] [PMC free article] [PubMed] [Google Scholar]
- Buratti E, Brindisi A, Giombi M, Tisminetzky S, Ayala YM, Baralle FE. TDP-43 binds heterogeneous nuclear ribonucleoprotein A/B through its C-terminal tail: an important region for the inhibition of cystic fibrosis transmembrane conductance regulator exon 9 splicing. J Biol Chem. 2005;280:37572–37584. doi: 10.1074/jbc.M505557200. [DOI] [PubMed] [Google Scholar]
- Burke KA, Janke AM, Rhine CL, Fawzi NL. Residue-by-Residue View of In Vitro FUS Granules that Bind the C-Terminal Domain of RNA Polymerase II. Mol Cell. 2015;60:231–241. doi: 10.1016/j.molcel.2015.09.006. [DOI] [PMC free article] [PubMed] [Google Scholar]
- Camilloni C, De Simone A, Vranken WF, Vendruscolo M. Determination of secondary structure populations in disordered states of proteins using nuclear magnetic resonance chemical shifts. Biochemistry. 2012;51:2224–2231. doi: 10.1021/bi3001825. [DOI] [PubMed] [Google Scholar]
- Conicella AE, Zerze GH, Mittal J, Fawzi NL. ALS Mutations Disrupt Phase Separation Mediated by alpha-Helical Structure in the TDP-43 Low-Complexity C-Terminal Domain. Structure. 2016;24:1537–1549. doi: 10.1016/j.str.2016.07.007. [DOI] [PMC free article] [PubMed] [Google Scholar]
- Courchaine EM, Lu A, Neugebauer KM. Droplet organelles? EMBO J. 2016;35:1603–1612. doi: 10.15252/embj.201593517. [DOI] [PMC free article] [PubMed] [Google Scholar]
- D’Ambrogio A, Buratti E, Stuani C, Guarnaccia C, Romano M, Ayala YM, Baralle FE. Functional mapping of the interaction between TDP-43 and hnRNP A2 in vivo. Nucleic Acids Res. 2009;37:4116–4126. doi: 10.1093/nar/gkp342. [DOI] [PMC free article] [PubMed] [Google Scholar]
- Debye P, Huckel E. De la theorie des electrolytes. I. abaissement du point decongelation et phenomenes associes. Physikalische Zeitschrift. 1923;24:185–206. [Google Scholar]
- Delaglio F, Grzesiek S, Vuister GW, Zhu G, Pfeifer J, Bax A. NMRPipe: a multidimensional spectral processing system based on UNIX pipes. J Biomol NMR. 1995;6:277–293. doi: 10.1007/BF00197809. [DOI] [PubMed] [Google Scholar]
- Deng HX, Zhai H, Bigio EH, Yan J, Fecto F, Ajroud K, Mishra M, Ajroud-Driss S, Heller S, Sufit R, et al. FUS-immunoreactive inclusions are a common feature in sporadic and non-SOD1 familial amyotrophic lateral sclerosis. Ann Neurol. 2010;67:739–748. doi: 10.1002/ana.22051. [DOI] [PMC free article] [PubMed] [Google Scholar]
- Falkenberg CV, Carson JH, Blinov ML. Multivalent Molecules as Modulators of RNA Granule Size and Composition. Biophys J. 2017 doi: 10.1016/j.bpj.2017.01.031. [DOI] [PMC free article] [PubMed] [Google Scholar]
- Fawzi NL, Ying J, Torchia DA, Clore GM. Kinetics of amyloid beta monomer-to-oligomer exchange by NMR relaxation. J Am Chem Soc. 2010;132:9948–9951. doi: 10.1021/ja1048253. [DOI] [PMC free article] [PubMed] [Google Scholar]
- Friend LR, Landsberg MJ, Nouwens AS, Wei Y, Rothnagel JA, Smith R. Arginine methylation of hnRNP A2 does not directly govern its subcellular localization. PLoS One. 2013;8:e75669. doi: 10.1371/journal.pone.0075669. [DOI] [PMC free article] [PubMed] [Google Scholar]
- Geoghegan V, Guo A, Trudgian D, Thomas B, Acuto O. Comprehensive identification of arginine methylation in primary T cells reveals regulatory roles in cell signalling. Nat Commun. 2015;6:6758. doi: 10.1038/ncomms7758. [DOI] [PMC free article] [PubMed] [Google Scholar]
- Harmon TS, Holehouse AS, Rosen MK, Pappu RV. Intrinsically disordered linkers determine the interplay between phase separation and gelation in multivalent proteins. Elife. 2017;6 doi: 10.7554/eLife.30294. [DOI] [PMC free article] [PubMed] [Google Scholar]
- He F, Krans A, Freibaum BD, Taylor JP, Todd PK. TDP-43 suppresses CGG repeat-induced neurotoxicity through interactions with HnRNP A2/B1. Hum Mol Genet. 2014;23:5036–5051. doi: 10.1093/hmg/ddu216. [DOI] [PMC free article] [PubMed] [Google Scholar]
- Hoek KS, Kidd GJ, Carson JH, Smith R. hnRNP A2 selectively binds the cytoplasmic transport sequence of myelin basic protein mRNA. Biochemistry. 1998;37:7021–7029. doi: 10.1021/bi9800247. [DOI] [PubMed] [Google Scholar]
- Jain S, Wheeler JR, Walters RW, Agrawal A, Barsic A, Parker R. ATPase-Modulated Stress Granules Contain a Diverse Proteome and Substructure. Cell. 2016;164:487–498. doi: 10.1016/j.cell.2015.12.038. [DOI] [PMC free article] [PubMed] [Google Scholar]
- Janke AM, Seo DH, Rahmanian V, Conicella AE, Mathews KL, Burke KA, Mittal J, Fawzi NL. Lysines in the RNA Polymerase II C-Terminal Domain Contribute to TAF15 Fibril Recruitment. Biochemistry. 2017 doi: 10.1021/acs.biochem.7b00310. [DOI] [PMC free article] [PubMed] [Google Scholar]
- Jurt S, Zerbe O. A study on the influence of fast amide exchange on the accuracy of (15)N relaxation rate constants. J Biomol NMR. 2012;54:389–400. doi: 10.1007/s10858-012-9682-x. [DOI] [PubMed] [Google Scholar]
- Kabsch W, Sander C. Dictionary of protein secondary structure: pattern recognition of hydrogen-bonded and geometrical features. Biopolymers. 1983;22:2577–2637. doi: 10.1002/bip.360221211. [DOI] [PubMed] [Google Scholar]
- Kapcha LH, Rossky PJ. A simple atomic-level hydrophobicity scale reveals protein interfacial structure. J Mol Biol. 2014;426:484–498. doi: 10.1016/j.jmb.2013.09.039. [DOI] [PubMed] [Google Scholar]
- Kato M, Han TW, Xie S, Shi K, Du X, Wu LC, Mirzaei H, Goldsmith EJ, Longgood J, Pei J, et al. Cell-free formation of RNA granules: low complexity sequence domains form dynamic fibers within hydrogels. Cell. 2012;149:753–767. doi: 10.1016/j.cell.2012.04.017. [DOI] [PMC free article] [PubMed] [Google Scholar]
- Keller RLJ. Optimizing the process of nuclear magnetic resonance spectrum analysis and computer aided resonance assignment. Zurich: Swiss Federal Institute of Technology; 2005. p. 147S. [Google Scholar]
- Khoury GA, Thompson JP, Smadbeck J, Kieslich CA, Floudas CA. Forcefield_PTM: Ab Initio Charge and AMBER Forcefield Parameters for Frequently Occurring Post-Translational Modifications. J Chem Theory Comput. 2013;9:5653–5674. doi: 10.1021/ct400556v. [DOI] [PMC free article] [PubMed] [Google Scholar]
- Kim HJ, Kim NC, Wang YD, Scarborough EA, Moore J, Diaz Z, MacLea KS, Freibaum B, Li S, Molliex A, et al. Mutations in prion-like domains in hnRNPA2B1 and hnRNPA1 cause multisystem proteinopathy and ALS. Nature. 2013;495:467–473. doi: 10.1038/nature11922. [DOI] [PMC free article] [PubMed] [Google Scholar]
- King A, Maekawa S, Bodi I, Troakes C, Al-Sarraj S. Ubiquitinated, p62 immunopositive cerebellar cortical neuronal inclusions are evident across the spectrum of TDP-43 proteinopathies but are only rarely additionally immunopositive for phosphorylation-dependent TDP-43. Neuropathology. 2011;31:239–249. doi: 10.1111/j.1440-1789.2010.01171.x. [DOI] [PubMed] [Google Scholar]
- King OD, Gitler AD, Shorter J. The tip of the iceberg: RNA-binding proteins with prion-like domains in neurodegenerative disease. Brain Res. 2012;1462:61–80. doi: 10.1016/j.brainres.2012.01.016. [DOI] [PMC free article] [PubMed] [Google Scholar]
- Lancaster AK, Nutter-Upham A, Lindquist S, King OD. PLAAC: a web and command-line application to identify proteins with prion-like amino acid composition. Bioinformatics. 2014;30:2501–2502. doi: 10.1093/bioinformatics/btu310. [DOI] [PMC free article] [PubMed] [Google Scholar]
- Lin Y, Protter DS, Rosen MK, Parker R. Formation and Maturation of Phase-Separated Liquid Droplets by RNA-Binding Proteins. Mol Cell. 2015;60:208–219. doi: 10.1016/j.molcel.2015.08.018. [DOI] [PMC free article] [PubMed] [Google Scholar]
- Lindahl E, Hess B, van der Spoel D. GROMACS 3.0: a package for molecular simulation and trajectory analysis. J Mol Model. 2001;7:306–317. [Google Scholar]
- Marsh JA, Forman-Kay JD. Sequence determinants of compaction in intrinsically disordered proteins. Biophys J. 2010;98:2383–2390. doi: 10.1016/j.bpj.2010.02.006. [DOI] [PMC free article] [PubMed] [Google Scholar]
- Marsh JA, Singh VK, Jia Z, Forman-Kay JD. Sensitivity of secondary structure propensities to sequence differences between alpha- and gamma-synuclein: implications for fibrillation. Protein Sci. 2006;15:2795–2804. doi: 10.1110/ps.062465306. [DOI] [PMC free article] [PubMed] [Google Scholar]
- Martinez FJ, Pratt GA, Van Nostrand EL, Batra R, Huelga SC, Kapeli K, Freese P, Chun SJ, Ling K, Gelboin-Burkhart C, et al. Protein-RNA Networks Regulated by Normal and ALS-Associated Mutant HNRNPA2B1 in the Nervous System. Neuron. 2016;92:780–795. doi: 10.1016/j.neuron.2016.09.050. [DOI] [PMC free article] [PubMed] [Google Scholar]
- Molliex A, Temirov J, Lee J, Coughlin M, Kanagaraj AP, Kim HJ, Mittag T, Taylor JP. Phase separation by low complexity domains promotes stress granule assembly and drives pathological fibrillization. Cell. 2015;163:123–133. doi: 10.1016/j.cell.2015.09.015. [DOI] [PMC free article] [PubMed] [Google Scholar]
- Monahan Z, Ryan VH, Janke AM, Burke KA, Rhoads SN, Zerze GH, O’Meally R, Dignon GL, Conicella AE, Zheng W, et al. Phosphorylation of the FUS low-complexity domain disrupts phase separation, aggregation, and toxicity. EMBO J. 2017 doi: 10.15252/embj.201696394. [DOI] [PMC free article] [PubMed] [Google Scholar]
- Munro TP, Magee RJ, Kidd GJ, Carson JH, Barbarese E, Smith LM, Smith R. Mutational analysis of a heterogeneous nuclear ribonucleoprotein A2 response element for RNA trafficking. J Biol Chem. 1999;274:34389–34395. doi: 10.1074/jbc.274.48.34389. [DOI] [PubMed] [Google Scholar]
- Nichols RC, Wang XW, Tang J, Hamilton BJ, High FA, Herschman HR, Rigby WF. The RGG domain in hnRNP A2 affects subcellular localization. Exp Cell Res. 2000;256:522–532. doi: 10.1006/excr.2000.4827. [DOI] [PubMed] [Google Scholar]
- Nott TJ, Petsalaki E, Farber P, Jervis D, Fussner E, Plochowietz A, Craggs TD, Bazett-Jones DP, Pawson T, Forman-Kay JD, et al. Phase transition of a disordered nuage protein generates environmentally responsive membraneless organelles. Mol Cell. 2015;57:936–947. doi: 10.1016/j.molcel.2015.01.013. [DOI] [PMC free article] [PubMed] [Google Scholar]
- Patel A, Lee HO, Jawerth L, Maharana S, Jahnel M, Hein MY, Stoynov S, Mahamid J, Saha S, Franzmann TM, et al. A Liquid-to-Solid Phase Transition of the ALS Protein FUS Accelerated by Disease Mutation. Cell. 2015;162:1066–1077. doi: 10.1016/j.cell.2015.07.047. [DOI] [PubMed] [Google Scholar]
- Qi X, Pang Q, Wang J, Zhao Z, Wang O, Xu L, Mao J, Jiang Y, Li M, Xing X, et al. Familial Early-Onset Paget’s Disease of Bone Associated with a Novel hnRNPA2B1 Mutation. Calcif Tissue Int. 2017;101:159–169. doi: 10.1007/s00223-017-0269-0. [DOI] [PubMed] [Google Scholar]
- Reichheld SE, Muiznieks LD, Keeley FW, Sharpe S. Direct observation of structure and dynamics during phase separation of an elastomeric protein. Proc Natl Acad Sci U S A. 2017;114:E4408–E4415. doi: 10.1073/pnas.1701877114. [DOI] [PMC free article] [PubMed] [Google Scholar]
- Romano M, Buratti E, Romano G, Klima R, Del Bel Belluz L, Stuani C, Baralle F, Feiguin F. Evolutionarily conserved heterogeneous nuclear ribonucleoprotein (hnRNP) A/B proteins functionally interact with human and Drosophila TAR DNA-binding protein 43 (TDP-43) J Biol Chem. 2014;289:7121–7130. doi: 10.1074/jbc.M114.548859. [DOI] [PMC free article] [PubMed] [Google Scholar]
- Schwarzinger S, Kroon GJ, Foss TR, Chung J, Wright PE, Dyson HJ. Sequence-dependent correction of random coil NMR chemical shifts. J Am Chem Soc. 2001;123:2970–2978. doi: 10.1021/ja003760i. [DOI] [PubMed] [Google Scholar]
- Shan J, Moran-Jones K, Munro TP, Kidd GJ, Winzor DJ, Hoek KS, Smith R. Binding of an RNA trafficking response element to heterogeneous nuclear ribonucleoproteins A1 and A2. J Biol Chem. 2000;275:38286–38295. doi: 10.1074/jbc.M007642200. [DOI] [PubMed] [Google Scholar]
- Shen Y, Bax A. SPARTA+: a modest improvement in empirical NMR chemical shift prediction by means of an artificial neural network. J Biomol NMR. 2010;48:13–22. doi: 10.1007/s10858-010-9433-9. [DOI] [PMC free article] [PubMed] [Google Scholar]
- Silmore KS, Howard MP, Panagiotopoulos AZ. Vapour-liquid phase equilibrium and surface tension of fully flexible Lennard-Jones chains. Mol Phys. 2017;115:320–327. [Google Scholar]
- Steward A, Adhya S, Clarke J. Sequence conservation in Ig-like domains: the role of highly conserved proline residues in the fibronectin type III superfamily. J Mol Biol. 2002;318:935–940. doi: 10.1016/S0022-2836(02)00184-5. [DOI] [PubMed] [Google Scholar]
- Theillet FX, Smet-Nocca C, Liokatis S, Thongwichian R, Kosten J, Yoon MK, Kriwacki RW, Landrieu I, Lippens G, Selenko P. Cell signaling, post-translational protein modifications and NMR spectroscopy. J Biomol NMR. 2012;54:217–236. doi: 10.1007/s10858-012-9674-x. [DOI] [PMC free article] [PubMed] [Google Scholar]
- Thompson MJ, Sievers SA, Karanicolas J, Ivanova MI, Baker D, Eisenberg D. The 3D profile method for identifying fibril-forming segments of proteins. Proc Natl Acad Sci U S A. 2006;103:4074–4078. doi: 10.1073/pnas.0511295103. [DOI] [PMC free article] [PubMed] [Google Scholar]
- Tradewell ML, Yu Z, Tibshirani M, Boulanger MC, Durham HD, Richard S. Arginine methylation by PRMT1 regulates nuclear-cytoplasmic localization and toxicity of FUS/TLS harbouring ALS-linked mutations. Hum Mol Genet. 2012;21:136–149. doi: 10.1093/hmg/ddr448. [DOI] [PubMed] [Google Scholar]
- Tribello GA, Bonomi M, Branduardi D, Camilloni C, Bussi G. PLUMED 2: New feathers for an old bird. Comput Phys Commun. 2014;185:604–613. [Google Scholar]
- Wang C, Grey MJ, Palmer AG., 3rd CPMG sequences with enhanced sensitivity to chemical exchange. J Biomol NMR. 2001;21:361–366. doi: 10.1023/a:1013328206498. [DOI] [PubMed] [Google Scholar]
- Wang JM, Cieplak P, Kollman PA. How well does a restrained electrostatic potential (RESP) model perform in calculating conformational energies of organic and biological molecules? J Comput Chem. 2000;21:1049–1074. [Google Scholar]
- White R, Gonsior C, Kramer-Albers EM, Stohr N, Huttelmaier S, Trotter J. Activation of oligodendroglial Fyn kinase enhances translation of mRNAs transported in hnRNP A2-dependent RNA granules. J Cell Biol. 2008;181:579–586. doi: 10.1083/jcb.200706164. [DOI] [PMC free article] [PubMed] [Google Scholar]
- Wilkins DK, Grimshaw SB, Receveur V, Dobson CM, Jones JA, Smith LJ. Hydrodynamic radii of native and denatured proteins measured by pulse field gradient NMR techniques. Biochemistry. 1999;38:16424–16431. doi: 10.1021/bi991765q. [DOI] [PubMed] [Google Scholar]
- Wooderchak WL, Zang T, Zhou ZS, Acuna M, Tahara SM, Hevel JM. Substrate profiling of PRMT1 reveals amino acid sequences that extend beyond the “RGG” paradigm. Biochemistry. 2008;47:9456–9466. doi: 10.1021/bi800984s. [DOI] [PubMed] [Google Scholar]
- Xiang S, Kato M, Wu LC, Lin Y, Ding M, Zhang Y, Yu Y, McKnight SL. The LC Domain of hnRNPA2 Adopts Similar Conformations in Hydrogel Polymers, Liquid-like Droplets, and Nuclei. Cell. 2015;163:829–839. doi: 10.1016/j.cell.2015.10.040. [DOI] [PMC free article] [PubMed] [Google Scholar]
- Yamaguchi A, Kitajo K. The effect of PRMT1-mediated arginine methylation on the subcellular localization, stress granules, and detergent-insoluble aggregates of FUS/TLS. PLoS One. 2012;7:e49267. doi: 10.1371/journal.pone.0049267. [DOI] [PMC free article] [PubMed] [Google Scholar]
Associated Data
This section collects any data citations, data availability statements, or supplementary materials included in this article.
Supplementary Materials
Data Availability Statement
NMR chemical shift assignments in this paper for hnRNPA2 LC WT (27123), D290V (27124), and P298L (27299) can be obtained online from the Biological Magnetic Resonance Database (BMRB, http://www.bmrb.wisc.edu/). TDP-43 CTD chemical shifts were obtained from the BMRB (26823). Plasmids generated for this project can be found at Addgene.org.