

Abstract
Breast cancer is the most commonly diagnosed cancer among females, and chemoresistance constitutes a major clinical obstacle to the treatment of this disease. MicroRNAs (miRNAs) are related to human cancer development, progression and drug resistance. To identify breast cancer chemoresistance-associated miRNAs, miRNA microarray dataset GSE71142, including five chemoresistant breast cancer tissues and five chemosensitive tissues, was downloaded from the Gene Expression Omnibus (GEO) database. Differentially expressed miRNAs (DE-miRNAs) were obtained by t-test and the potential target genes were predicted by miRWalk2.0. Functional and pathway enrichment analysis by WebGestalt was performed for the potential target genes of DE-miRNAs. Protein-protein interaction (PPI) network was established by STRING database and visualized by Cytoscape software. Enriched transcription factors by the target genes were obtained from FunRich. Breast cancer-associated miRNA-gene pairs were identified from miRWalk2.0. A total of 22 DE-miRNAs were screened out, including 10 upregulated miRNAs (e.g., miR-196a-5p) and 12 downregulated miRNAs (e.g., miR-4472) in the chemoresistant breast cancer tissues, compared with chemosensitive tissues. In total 1,278 target genes were screened out, and they were involved in breast cancer-related pathways such as pathways in cancer, signaling pathways regulating pluripotency of stem cells, endocrine resistance, breast cancer, mTOR signaling and Hippo signaling pathway. NOTCH1 and MAPK14 were identified as hub genes in the PPI network. EGR1 and SP1 were the most enriched transcription factors by the target genes. Several breast cancer-associated miRNA-gene pairs including miR-214-TP53 and miR-16-PPM1D were identified. The current bioinformatics study of miRNAs based on microarray may offer a new understanding into the mechanisms of breast cancer chemoresistance, and may identify novel miRNA therapeutic targets.
Keywords: breast cancer, miRNA microarray, chemoresistance, enrichment analysis, network of miRNA targets
Introduction
Breast cancer is the most frequently diagnosed malignancy and the leading cause of cancer-related death among females worldwide, with an estimated 1.7 million cases and 521,900 deaths in 2012 (1). Current breast cancer treatment strategies include surgery and adjuvant therapy, such as chemotherapy, radiotherapy, hormonal therapy and targeted drugs (2). The backbone of current chemotherapy regimens includes anthracyclines (e.g., adriamycin and epirubicin) and taxanes (e.g., Cytoxan®) given either sequentially or concurrently. Anti-estrogen drugs (e.g., tamoxifen) and aromatase inhibitors (e.g., letrozole) dominate breast cancer endocrine therapy. HER-2-positive breast cancer patients could be treated with targeted therapy, and the main drug is trastuzumab monoclonal antibody (Herceptin®). Chemotherapy forms an important part of a successful treatment regimen; however, half of the patients may fail to benefit from this, as a result of drug resistance (3). Thus, chemoresistance constitutes a major clinical obstacle for the successful treatment of breast cancer.
MicroRNAs (miRNAs) are small non-coding RNAs that negatively regulate gene expression at the post-transcriptional level (4). Studies have shown that miRNAs are often aberrantly expressed in human cancers and are associated with tumorigenesis, metastasis, invasiveness and drug resistance (5–8). For example, miR-214 is downregulated in gastric cancer and inhibits cell migration and invasion through targeting CSF1 (5). Most recently, Zhang et al identified five miRNAs (miR-30b-5p, miR-96-5p, miR-182-5p, miR-374b-5p and miR-942-5p) as candidate blood biomarkers in breast cancer patients (9). However, studies concerning chemoresistance-associated miRNAs in breast cancer based on human tissues are scarce. In the present study, differentially expressed miRNAs (DE-miRNAs) in chemoresistant and chemosensitive breast cancer tissues were screened using miRNA expression profile of GSE71142. The genes targeted by DE-miRNAs were predicted, and their potential functions were analyzed by functional and pathway enrichment analysis. Furthermore, a protein-protein interaction (PPI) network of the predicted target genes was constructed. Potential transcription factors that may regulate the target genes were screened. Through these comprehensive bioinformatic analyses, the present study aimed to explore the molecular mechanisms underlying breast cancer chemoresistance and identify important miRNA therapeutic targets.
Materials and methods
miRNA microarray
Breast cancer chemoresistance-associated miRNA microarray dataset GSE71142 was downloaded from the National Center for Biotechnology Information (NCBI) Gene Expression Omnibus (GEO) database (http://www.ncbi.nlm.nih.gov/geo). The dataset GSE71142, based on the platform of GPL20717 µParaflo™ miRNA microarray (LC Sciences, Houston, TX, USA), included five cases of chemoresistant breast cancer tissues and five cases of chemosensitive tissues. The chemotherapy drugs used for treating the breast cancer patients are provided in Fig. 1B.
Figure 1.

Differentially expressed miRNAs (DE-miRNAs) in five cases of drug-resistant (DR) breast cancer tissues and five cases of drug-sensitive (DS) tissues. (A) Data are presented as a heat map. FC, fold change. (B) The chemotherapy drugs used for treating the breast cancer patients.
Screening for DE-miRNAs
Data were analyzed by subtracting the background and then the signals were normalized using a locally-weighted regression (LOWESS) filter (10). The t-test analysis was conducted between chemoresistant and chemosensitive samples, and miRNAs with P-values <0.05 and fold change (FC) >2 were selected for cluster analysis. Mean values of each group were used in the cluster analysis by HemI software (Heatmap Illustrator, version 1.0) (11).
Prediction of genes targeted by DE-miRNAs
The miRWalk2.0 database generated possible miRNA-target interactions by gathering information from 12 types of existing prediction software (e.g., Targetscan, miRanda and RNAhybrid) (12). In the present study, miRWalk2.0 was used to predict the target genes of the DE-miRNAs. Only the common target genes predicted by at least nine types of software were selected, which were defined as potential target genes.
GO and pathway analysis
WEB-based GEne SeT AnaLysis Toolkit (WebGestalt) (13) was used to perform functional enrichment analysis including Gene Ontology (GO) and Kyoto Encyclopedia of Genes and Genomes (KEGG) pathway analysis, for the potential target genes of DE-miRNAs. P<0.05 was considered statistically significant.
Protein-protein interaction (PPI) network and miRNA-target network construction
To evaluate the interactive relationships among target genes, we mapped the target genes to the STRING database (http://string-db.org) (14), and only the interactions with a combined score >0.4 were considered as significant. The degree of connectivity in networks was analyzed using Cytoscape software (version 3.4.0), to obtain the significant nodes or hub proteins (15) in the PPI networks.
Screening of potential transcription factors
FunRich (http://www.funrich.org) (16) is a functional enrichment and interaction network analysis tool that identifies the enriched transcription factors for gene sets. In the present study, FunRich was used to identify transcription factors that regulate the DE-miRNA target genes.
Identification of breast cancer-associated miRNAs validated in previous studies
The miRWalk2.0 database (12) provided information on experimentally validated miRNA-gene-Human Phenotype Ontology (HPO) interactions. In the present study, we used the Validated Targets Module of miRWalk2.0 to identify breast cancer-associated miRNAs and miRNA-gene interactions.
Results
Identification of DE-miRNAs and their target genes
A total of 22 DE-miRNAs were screened out, including 10 upregulated and 12 downregulated miRNAs (Fig. 1) in chemoresistant breast cancer tissues, compared with chemosensitive tissues. Based on FC, miR-196a-5p, miR-4286 and miR-200b-3p were the top three most upregulated miRNAs; and miR-4472, miR-4467 and miR-572 were the top three most downregulated miRNAs. miRWalk2.0 was used to predict the target genes of DE-miRNAs, generating 1,278 potential target genes, including 1,155 genes for upregulated miRNAs and 123 genes for downregulated miRNAs.
Functional and pathway enrichment analyses
GO functional and KEGG pathway enrichment analyses were performed on the aforementioned potential target genes. The enriched GO functions for the target genes are presented in Tables I and II, including the positive regulation of gene expression, positive regulation of transcription (DNA-templated) and positive regulation of cellular biosynthetic process in the biological process (BP) category; cell junction and nuclear transcriptional repressor complex in the cellular component (CC) category; and transcription factor activity and enzyme binding in the molecular function (MF) category.
Table I.
Enriched functions for the target genes of the upregulated miRNAs.
| GO terms | P-value | FDR |
|---|---|---|
| Biological process (BP) | ||
| GO:0006366, transcription from RNA polymerase II promoter | P<0.001 | P<0.001 |
| GO:0009790, embryo development | P<0.001 | P<0.001 |
| GO:0010628, positive regulation of gene expression | P<0.001 | P<0.001 |
| GO:0045893, positive regulation of transcription, DNA-templated | P<0.001 | P<0.001 |
| GO:1903508, positive regulation of nucleic acid-templated transcription | P<0.001 | P<0.001 |
| Cellular component (CC) | ||
| GO:0031410, cytoplasmic vesicle | 2.354E-14 | 1.407E-11 |
| GO:0097708, intracellular vesicle | 2.731E-14 | 1.407E-11 |
| GO:0098588, bounding membrane of organelle | 1.391E-13 | 4.776E-11 |
| GO:0030054, cell junction | 3.435E-13 | 8.845E-11 |
| GO:0097458, neuron part | 4.348E-13 | 8.956E-11 |
| Molecular function (MF) | ||
| GO:0000981, RNA polymerase II transcription factor activity, sequence-specific DNA binding | P<0.001 | P<0.001 |
| GO:0000982, transcription factor activity, RNA polymerase II core promoter proximal region sequence-specific binding | 1.199E-14 | 1.096E-11 |
| GO:0001228, transcriptional activator activity, RNA polymerase II transcription regulatory region sequence-specific binding | 4.663E-14 | 2.841E-11 |
| GO:0019899, enzyme binding | 1.765E-13 | 8.067E-11 |
| GO:0044212, transcription regulatory region DNA binding | 5.079E-13 | 1.654E-10 |
GO, Gene Ontology; FDR, false discovery rate.
Table II.
Enriched functions of the target genes of the downregulated miRNAs.
| GO terms | P-value | FDR |
|---|---|---|
| Biological process (BP) | ||
| GO:0001501, skeletal system development | 5.75E-05 | 1.05E-01 |
| GO:0051173, positive regulation of nitrogen compound metabolic process | 6.77E-05 | 1.05E-01 |
| GO:0045935, positive regulation of nucleobase-containing compound metabolic process | 7.03E-05 | 1.05E-01 |
| GO:0031328, positive regulation of cellular biosynthetic process | 1.36E-04 | 1.05E-01 |
| GO:2000113, negative regulation of cellular macromolecule biosynthetic process | 1.43E-04 | 1.05E-01 |
| Cellular component (CC) | ||
| GO:0005578, proteinaceous extracellular matrix | 3.42E-04 | 8.81E-02 |
| GO:0030054, cell junction | 3.45E-04 | 8.81E-02 |
| GO:0070603, SWI/SNF superfamily-type complex | 4.87E-04 | 8.81E-02 |
| GO:0090568, nuclear transcriptional repressor complex | 4.90E-04 | 8.81E-02 |
| GO:0016589, NURF complex | 5.10E-04 | 8.81E-02 |
| Molecular function (MF) | ||
| GO:0003682, chromatin binding | 3.34E-05 | 3.18E-02 |
| GO:0019899, enzyme binding | 4.13E-05 | 3.18E-02 |
| GO:0019903, protein phosphatase binding | 5.22E-05 | 3.18E-02 |
| GO:0003700, transcription factor activity, sequence-specific DNA binding | 1.10E-04 | 4.08E-02 |
| GO:0001071, nucleic acid binding transcription factor activity | 1.12E-04 | 4.08E-02 |
GO, Gene Ontology; FDR, false discovery rate.
The enriched KEGG pathways for target genes of upregulated miRNAs (Fig. 2A) included miRNAs in cancer, pathways in cancer, signaling pathways regulating pluripotency of stem cells, endocrine resistance, breast cancer, mTOR signaling and Hippo signaling pathway. Of note, 23 genes (CDK6, JAG1, DVL3, E2F3, FGF9, DLL1/4, IGF1R, JUN, LRP6, NOTCH1/2, NRAS, PIK3R1/3, MAPK1/3, FZD3/4/5/7, AXIN2 and WNT3A) were specifically involved in the breast cancer pathway. For downregulated miRNAs (Fig. 2B), the enriched KEGG pathways included cAMP signaling pathway, proteoglycans in cancer, signaling pathways regulating pluripotency of stem cells, Hippo signaling pathway and basal cell carcinoma.
Figure 2.

KEGG pathway analysis of DE-miRNA target genes. (A) For upregulated miRNAs; and (B) for downregulated miRNAs. The top 10 enriched pathways are presented.
Construction and analysis of PPI network and miRNA-target network
Data from the STRING database showed that many of the target genes interacted with each other. For better visualization, the top 10 hub nodes with higher degrees were screened (Table III). For the upregulated miRNAs, the hub genes were NOTCH1, JUN, NRAS, MAPK1, BCL2, MAPK3, NFKB1, ITGA2, CDK6 and IGF1R. Among these genes, NOTCH1 showed the highest node degree (degree=103). For the downregulated miRNAs, the hub genes were MAPK14, PRKCA, SMARCA5, UBE2I, DVL3, WNT7B, CREB5, SLC9A1, FZD3 and NFKB1. Among these genes, MAPK14 showed the highest node degree (degree=10).
Table III.
Hub genes identified in the PPI network.
| Upregulated miRNAs | Downregulated miRNAs | ||
|---|---|---|---|
| Gene symbol | Degree | Gene symbol | Degree |
| NOTCH1 | 103 | MAPK14 | 10 |
| JUN | 102 | PRKCA | 5 |
| NRAS | 83 | SMARCA5 | 4 |
| MAPK1 | 81 | UBE2I | 4 |
| BCL2 | 80 | DVL3 | 3 |
| MAPK3 | 74 | WNT7B | 3 |
| NFKB1 | 66 | CREB5 | 3 |
| ITGA2 | 64 | SLC9A1 | 2 |
| CDK6 | 52 | FZD3 | 2 |
| IGF1R | 52 | NFKB1 | 2 |
PPI, protein-protein interaction.
As shown in Fig. 3, the miRNA-hub gene network was constructed. The hub target genes of the upregulated miRNAs could be potentially regulated by miR-107, miR-16-5p, miR-196a-5p, miR-200b-3p, miR-214-3p and miR-23a-3p (Fig. 3A). Particularly, miR-16-5p was predicted to target the most hub genes (n=4). The hub target genes of the downregulated miRNAs could be potentially regulated by miR-1275, miR-489 and miR-572 (Fig. 3B). In addition, miR-489 was predicted to target the most hub genes (n=5).
Figure 3.

miRNA-gene regulatory network based on the hub target genes. (A) For upregulated miRNAs; and (B) for downregulated miRNAs.
Screening of potential transcription factors
Based on data from FunRich, the top 10 enriched transcription factors for the target genes of the upregulated miRNAs were EGR1, SP1, SP4, POU2F1, NKX6-1, MEF2A, PBX1, ARID3A, MYC and HOXB9 (Fig. 4A). For the targets of the downregulated miRNAs, the top 10 enriched transcription factors were EGR1, SP1, POU2F1, HOXA7, ATF4, LHX4, NFIC, SP4, EN1 and ELF1 (Fig. 4B).
Figure 4.

Enriched transcription factors by DE-miRNA target genes. (A) For upregulated miRNAs; and (B) for downregulated miRNAs. The top 10 most significant transcription factors are presented.
Validated breast carcinoma-associated miRNA-gene interactions
The miRWalk2.0 database was used to search for experimentally validated miRNA-gene-Human Phenotype Ontology (HPO) interactions in breast carcinoma. Eight of the DE-miRNAs (miR-23a-3p, miR-200b-3p, miR-4286, miR-23b-3p, miR-107, miR-214-3p, miR-3141 and miR-16-5p) were previously proven to be breast carcinoma-associated miRNAs (Fig. 5A) by targeting a series of oncogenes or tumor suppressors such as PTEN, PPM1D, TP53, KRAS, MSH2, CTNNB1, TWIST1, CDH1 and STK11 (Fig. 5B).
Figure 5.
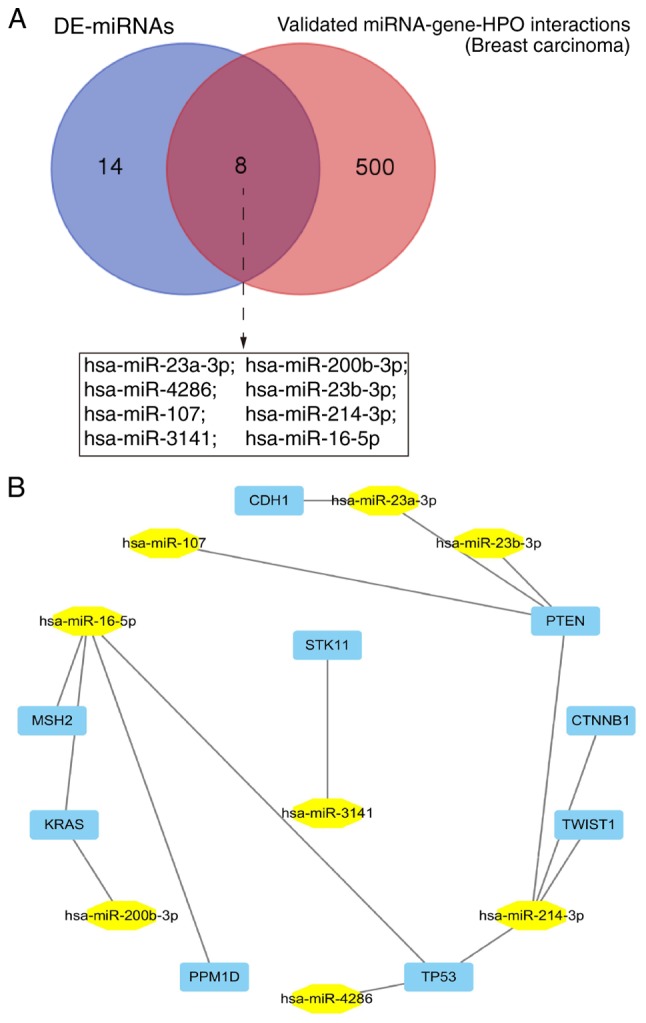
Validated miRNA-gene interactions in breast carcinoma. (A) The validated miRNA-gene-human phenotype ontology (HPO) interactions in breast carcinoma were searched from miRWalk2.0. (B) The validated miRNA-gene network was constructed.
Discussion
Chemoresistance is a major limitation for breast cancer therapy. In the present study, bioinformatics analyses were performed to investigate microRNA (miRNA)-mediated mechanism of breast cancer chemoresistance and to identify molecular targets. In the present study, we identified 22 DE-miRNAs in chemoresistant breast cancer and chemosensitive tissues based on the GEO database GSE71142. Then, by the target gene software of miRWalk2.0, we identified the potential target genes of these chemoresistance-related miRNAs. The enrichment and function analyses showed that these target genes may participate in many important cancer-related biological processes, molecular functions and signaling pathways.
Among the dysregulated miRNAs, miR-196a-5p (upregulation) and miR-4472 (downregulation) were found to have the greatest expression fold change between chemoresistant and chemosensitive tissues. miR-196a-5p has been previously reported to be overexpressed in triple-negative breast cancer compared with hormone receptor-positive breast cancer by microarray (17). miR-4472 has been found to be located in common fragile sites that are frequently affected by DNA double-strand breaks, which may be associated with carcinogenesis from its earliest stages (18). These two miRNAs (miR-196a-5p and miR-4472) have not been systemically investigated in breast cancer. This is the first report to link these two miRNAs with breast cancer chemotherapy resistance.
Functional enrichment analysis was performed on the target genes of identified DE-miRNAs. The most enriched GO terms were significantly associated with regulation processes at the BP level, and transcription activity at the MF level, respectively. KEGG pathway analysis was performed to check the potentially involved pathways of the target genes. Several breast cancer-associated pathways were identified from the top enriched KEGG terms, namely miRNAs in cancer, pathways in cancer, signaling pathways regulating pluripotency of stem cells, endocrine resistance, breast cancer, mTOR signaling pathway, Hippo signaling pathway, cAMP signaling pathway, and proteoglycans in cancer. Since stem cells are believed to play an important role in drug resistance (19), understanding of target genes involved in signaling pathways regulating the pluripotency of stem cells may help us to uncover mechanisms of drug resistance. The mTOR pathway is pivotal not only in tumorigenesis, but also in cancer chemotherapy and hormonal drug sensitivity (20). Various mTOR inhibitors have been developed to overcome breast cancer drug resistance and increase the therapeutic efficacy of breast cancer therapy (21). Recently, evidence suggests that the Hippo tumor suppressor pathway may confer cells with more aggressive traits and regulate the response of cancer cells to chemotherapeutics (22,23). The cAMP signaling pathway has been shown to regulate multidrug resistance of breast cancer by modulating MDR1 transcription (24). Enrichment of the target genes of DE-miRNAs in these signaling pathways further supports the potential involvement of the DE-miRNAs in breast cancer chemoresistance.
PPI network was constructed and it was found that NOTCH1 and mitogen-activated protein kinase 14 (MAPK14) were the hub genes with the highest connectivity degree of 103 and 10, among the targets of upregulated and downregulated miRNAs, respectively. Notch1 has been shown to upregulate multidrug resistance-associated protein 1 (MRP1) expression in breast cancer, and Notch 1 inhibitor was found to sensitize breast cancer cells to doxorubicin and paclitaxel (25,26). Mechanically, Notch 1 has been found to be targeted by miR-34a to reduce breast cancer stemness and chemoresistance (27). Cleator et al enrolled a cohort of breast cancer patients who received doxorubicin and cyclophosphamide (adriamycin/cytoxan, AC) chemotherapy treatment, and found that MAPK14 was upregulated in chemosensitive tumors (28). These data support that NOTCH1 and MAPK14 may be candidate targets associated with breast cancer chemoresistance.
Exploring the possible transcription factors may be helpful in understanding the mechanisms of target genes in DE-miRNAs. Early growth response 1 (EGR1) and SP1 are the common transcription factors that targeted the most genes both for upregulated and downregulated miRNAs. A recent study indicated that EGR1 increased drug resistance of breast cancer by enhancing multidrug resistance 1 (MDR1) expression (29). Saha et al revealed that aberrant overexpression of SP1 in breast cancer stem cells transcriptionally upregulated resistance-promoting genes to decrease doxorubicin therapy sensitivity (30). Enrichment of EGR1 and SP1 by the target genes of DE-miRNAs implies the potential roles of the target genes and the DE-miRNAs in drug resistance.
By searching the validated miRNA-gene-human phenotype ontology (HPO) interactions in miRWalk2.0, several miRNA-target pairs in breast cancer were screened. For example, the miR-214-tumor protein p53 (TP53) axis promotes apoptosis and sensitizes breast cancer cells to doxorubicin (31). The protein phosphatase, Mg2+/Mn2+-dependent 1D (miR-16-PPM1D) signaling suppresses the self-renewal and proliferation of mouse breast cancer stem cells and sensitizes MCF-7 human breast cancer cells to doxorubicin (32). Screening of these validated breast cancer-associated miRNAs suggests that the current methods to identify breast cancer- and chemoresistance-related miRNAs are credible.
In conclusion, our data provide a comprehensive bioinformatic analysis of DE-miRNAs, which may be involved in breast cancer chemoresistance. The target genes of DE-miRNAs are associated with important signaling pathways in cancer, including breast carcinogenesis, progression and drug resistance. The DE-miRNAs such as miR-196a-5p, miR-4472, miR-16-5p and miR-489, and the hub target genes including NOTCH1 and MAPK14 may have the potential to be used as targets for breast cancer treatment. However, the biological function and mechanism of these DE-miRNAs and the target genes in breast cancer chemoresistance need further experimental excavation and research.
Acknowledgements
We thank LC Sciences for assistance in the microarray data analysis. This work was supported by the Shandong Key Research and Development Plan (no. 2016GSF201128), the National Natural Science Foundation of China (no. 81402192), the Initial Funding for New Clinical and Practical Techniques of Qilu Hospital of Shandong University (no. 2016–1) and the Science and Technology Development Plan of Jinan (the medical and health science and technology innovation plan, no. 201704091).
Competing interests
The authors declare that they have no competing interests.
References
- 1.Torre LA, Bray F, Siegel RL, Ferlay J, Lortet-Tieulent J, Jemal A. Global cancer statistics, 2012. CA Cancer J Clin. 2015;65:87–108. doi: 10.3322/caac.21262. [DOI] [PubMed] [Google Scholar]
- 2.Kutanzi KR, Yurchenko OV, Beland FA, Checkhun VF, Pogribny IP. MicroRNA-mediated drug resistance in breast cancer. Clin Epigenetics. 2011;2:171–185. doi: 10.1007/s13148-011-0040-8. [DOI] [PMC free article] [PubMed] [Google Scholar]
- 3.ODriscoll L, Clynes M. Biomarkers and multiple drug resistance in breast cancer. Curr Cancer Drug Targets. 2006;6:365–384. doi: 10.2174/156800906777723958. [DOI] [PubMed] [Google Scholar]
- 4.Calin GA, Croce CM. MicroRNA signatures in human cancers. Nat Rev Cancer. 2006;6:857–866. doi: 10.1038/nrc1997. [DOI] [PubMed] [Google Scholar]
- 5.Wang YW, Shi DB, Chen X, Gao C, Gao P. Clinicopathological significance of microRNA-214 in gastric cancer and its effect on cell biological behaviour. PLoS One. 2014;9:e91307. doi: 10.1371/journal.pone.0091307. [DOI] [PMC free article] [PubMed] [Google Scholar]
- 6.Wang YW, Chen X, Gao JW, Zhang H, Ma RR, Gao ZH, Gao P. High expression of cAMP-responsive element-binding protein 1 (CREB1) is associated with metastasis, tumor stage and poor outcome in gastric cancer. Oncotarget. 2015;6:10646–10657. doi: 10.18632/oncotarget.3392. [DOI] [PMC free article] [PubMed] [Google Scholar]
- 7.Chen X, Wang YW, Xing AY, Xiang S, Shi DB, Liu L, Li YX, Gao P. Suppression of SPIN1-mediated PI3K-Akt pathway by miR-489 increases chemosensitivity in breast cancer. J Pathol. 2016;239:459–472. doi: 10.1002/path.4743. [DOI] [PubMed] [Google Scholar]
- 8.Wang YW, Chen X, Ma R, Gao P. Understanding the CREB1-miRNA feedback loop in human malignancies. Tumour Biol. 2016;37:8487–8502. doi: 10.1007/s13277-016-5050-x. [DOI] [PubMed] [Google Scholar]
- 9.Zhang K, Wang YW, Wang YY, Song Y, Zhu J, Si PC, Ma R. Identification of microRNA biomarkers in the blood of breast cancer patients based on microRNA profiling. Gene. 2017;619:10–20. doi: 10.1016/j.gene.2017.03.038. [DOI] [PubMed] [Google Scholar]
- 10.Bolstad BM, Irizarry RA, Astrand M, Speed TP. A comparison of normalization methods for high density oligonucleotide array data based on variance and bias. Bioinformatics. 2003;19:185–193. doi: 10.1093/bioinformatics/19.2.185. [DOI] [PubMed] [Google Scholar]
- 11.Deng W, Wang Y, Liu Z, Cheng H, Xue Y. HemI: A toolkit for illustrating heatmaps. PLoS One. 2014;9:e111988. doi: 10.1371/journal.pone.0111988. [DOI] [PMC free article] [PubMed] [Google Scholar]
- 12.Dweep H, Gretz N. miRWalk2.0: A comprehensive atlas of microRNA-target interactions. Nat Methods. 2015;12:697. doi: 10.1038/nmeth.3485. [DOI] [PubMed] [Google Scholar]
- 13.Wang J, Duncan D, Shi Z, Zhang B. WEB-based GEne SeT AnaLysis toolkit (WebGestalt): Update 2013. Nucleic Acids Research. 2013;41:W77–W83. doi: 10.1093/nar/gkt439. [DOI] [PMC free article] [PubMed] [Google Scholar]
- 14.Szklarczyk D, Franceschini A, Wyder S, Forslund K, Heller D, Huerta-Cepas J, Simonovic M, Roth A, Santos A, Tsafou KP, et al. STRING v10: Protein-protein interaction networks, integrated over the tree of life. Nucleic Acids Res. 2015;43:D447–D452. doi: 10.1093/nar/gku1003. [DOI] [PMC free article] [PubMed] [Google Scholar]
- 15.He X, Zhang J. Why do hubs tend to be essential in protein networks? PLoS Genet. 2006;2:e88. doi: 10.1371/journal.pgen.0020088. [DOI] [PMC free article] [PubMed] [Google Scholar]
- 16.Pathan M, Keerthikumar S, Ang CS, Gangoda L, Quek CY, Williamson NA, Mouradov D, Sieber OM, Simpson RJ, Salim A, et al. FunRich: An open access standalone functional enrichment and interaction network analysis tool. Proteomics. 2015;15:2597–2601. doi: 10.1002/pmic.201400515. [DOI] [PubMed] [Google Scholar]
- 17.Li Z, Meng Q, Pan A, Wu X, Cui J, Wang Y, Li L. MicroRNA-455-3p promotes invasion and migration in triple negative breast cancer by targeting tumor suppressor EI24. Oncotarget. 2017;8:19455–19466. doi: 10.18632/oncotarget.14307. [DOI] [PMC free article] [PubMed] [Google Scholar]
- 18.Georgakilas AG, Tsantoulis P, Kotsinas A, Michalopoulos I, Townsend P, Gorgoulis VG. Are common fragile sites merely structural domains or highly organized ‘functional’ units susceptible to oncogenic stress? Cell Mol Life Sci. 2014;71:4519–4544. doi: 10.1007/s00018-014-1717-x. [DOI] [PMC free article] [PubMed] [Google Scholar]
- 19.Zhou C, Grottkau BE, Zou S. regulators of stem cells proliferation in tissue regeneration. Curr Stem Cell Res Ther. 2016;11:177–187. doi: 10.2174/1574888X10666150531172108. [DOI] [PubMed] [Google Scholar]
- 20.Margariti N, Fox SB, Bottini A, Generali D. ‘Overcoming breast cancer drug resistance with mTOR inhibitors’. Could it be a myth or a real possibility in the short-term future? Breast Cancer Res Treat. 2011;128:599–606. doi: 10.1007/s10549-010-0986-9. [DOI] [PubMed] [Google Scholar]
- 21.Carraway H, Hidalgo M. New targets for therapy in breast cancer: Mammalian target of rapamycin (mTOR) antagonists. Breast Cancer Res. 2004;6:219–224. doi: 10.1186/bcr927. [DOI] [PMC free article] [PubMed] [Google Scholar]
- 22.Lai D, Visser-Grieve S, Yang X. Tumour suppressor genes in chemotherapeutic drug response. Biosci Rep. 2012;32:361–374. doi: 10.1042/BSR20110125. [DOI] [PMC free article] [PubMed] [Google Scholar]
- 23.Shi P, Feng J, Chen C. Hippo pathway in mammary gland development and breast cancer. Acta Biochim Biophys Sin. 2015;47:53–59. doi: 10.1093/abbs/gmu114. [DOI] [PubMed] [Google Scholar]
- 24.Rohlff C, Glazer RI. Regulation of multidrug resistance through the cAMP and EGF signalling pathways. Cell Signal. 1995;7:431–443. doi: 10.1016/0898-6568(95)00018-K. [DOI] [PubMed] [Google Scholar]
- 25.Kim B, Stephen SL, Hanby AM, Horgan K, Perry SL, Richardson J, Roundhill EA, Valleley EM, Verghese ET, Williams BJ, et al. Chemotherapy induces Notch1-dependent MRP1 up-regulation, inhibition of which sensitizes breast cancer cells to chemotherapy. BMC Cancer. 2015;15:634. doi: 10.1186/s12885-015-1625-y. [DOI] [PMC free article] [PubMed] [Google Scholar]
- 26.Zhao L, Ma Y, Gu F, Fu L. Inhibition of Notch1 increases paclitaxel sensitivity to human breast cancer. Chin Med J. 2014;127:442–447. [PubMed] [Google Scholar]
- 27.Park EY, Chang E, Lee EJ, Lee HW, Kang HG, Chun KH, Woo YM, Kong HK, Ko JY, Suzuki H, et al. Targeting of miR34a-NOTCH1 axis reduced breast cancer stemness and chemoresistance. Cancer Res. 2014;74:7573–7582. doi: 10.1158/0008-5472.CAN-14-1140. [DOI] [PubMed] [Google Scholar]
- 28.Cleator S, Tsimelzon A, Ashworth A, Dowsett M, Dexter T, Powles T, Hilsenbeck S, Wong H, Osborne CK, O'Connell P, Chang JC. Gene expression patterns for doxorubicin (Adriamycin) and cyclophosphamide (Cytoxan) (AC) response and resistance. Breast Cancer Res Treat. 2006;95:229–233. doi: 10.1007/s10549-005-9009-7. [DOI] [PubMed] [Google Scholar]
- 29.Tao W, Shi JF, Zhang Q, Xue B, Sun YJ, Li CJ. Egr-1 enhances drug resistance of breast cancer by modulating MDR1 expression in a GGPPS-independent manner. Biomed Pharmacother. 2013;67:197–202. doi: 10.1016/j.biopha.2013.01.001. [DOI] [PubMed] [Google Scholar]
- 30.Saha S, Mukherjee S, Mazumdar M, Manna A, Khan P, Adhikary A, Kajal K, Jana D, Sa G, Mukherjee S, et al. Mithramycin a sensitizes therapy-resistant breast cancer stem cells toward genotoxic drug doxorubicin. Transl Res. 2015;165:558–577. doi: 10.1016/j.trsl.2014.10.011. [DOI] [PubMed] [Google Scholar]
- 31.Zhang J, Su B, Gong C, Xi Q, Chao T. miR-214 promotes apoptosis and sensitizes breast cancer cells to doxorubicin by targeting the RFWD2-p53 cascade. Biochem Biophys Res Commun. 2016;478:337–342. doi: 10.1016/j.bbrc.2016.07.054. [DOI] [PubMed] [Google Scholar]
- 32.Zhang X, Wan G, Mlotshwa S, Vance V, Berger FG, Chen H, Lu X. Oncogenic Wip1 phosphatase is inhibited by miR-16 in the DNA damage signaling pathway. Cancer Res. 2010;70:7176–7186. doi: 10.1158/0008-5472.CAN-10-0697. [DOI] [PMC free article] [PubMed] [Google Scholar]