Abstract
We have developed an imaging system for 3D time-lapse polarization microscopy of living biological samples. Polarization imaging reveals the position, alignment and orientation of submicroscopic features in label-free as well as fluorescently labeled specimens. Optical anisotropies are calculated from a series of images where the sample is illuminated by light of different polarization states. Due to the number of images necessary to collect both multiple polarization states and multiple focal planes, 3D polarization imaging is most often prohibitively slow. Our MF-PolScope system employs multifocus optics to form an instantaneous 3D image of up to 25 simultaneous focal-planes. We describe this optical system and show examples of 3D multi-focus polarization imaging of biological samples, including a protein assembly study in budding yeast cells.
OCIS codes: (180.6900) Three-dimensional microscopy, (260.5430) Polarization, (110.4190) Multiple imaging, (050.1970) Diffractive optics, (180.2520) Fluorescence microscopy, (260.1440) Birefringence
1. Introduction
Polarization microscopy is a powerful imaging modality that can provide more information about a specimen than what is available through conventional imaging. Many structures in living cells and tissues, such as microtubules, spindle fibers, chromosomes and muscle sarcomeres, are intrinsically optically active or birefringent. They contain ordered anisotropic molecules which alter the polarization of transmitted light, or give rise to a difference in refractive index depending on the polarization of the transmitted light. Jumps in refractive index at edges of cellular compartments also yield optical anisotropy (edge birefringence). To probe the polarization properties of a specimen, a sequence of images is recorded under illumination by light of different polarization directions. The differential phase shift, or retardance, is calculated and illustrated along with its slow axis at every pixel in the image [1–3]. Transmission polarization imaging provides excellent contrast in unlabeled specimens, such as meiotic spindles in living oocytes [4]. This is crucial in sensitive medical imaging applications such as in vitro fertilization, where staining is prohibitive [5]. Polarization imaging can also be applied in clinical imaging applications in back-scattered imaging mode [6].
Polarization microscopy can also be applied to fluorescently labeled samples in polarization anisotropy imaging. An individual fluorescent molecule (such as GFP) has a transition dipole moment that renders its excitation and emission polarization dependent [7]. The efficiency of excitation therefore depends on the orientation of the fluorophore relative to the polarization orientation of the excitation light. By attaching fluorophores to molecules of interest using rigid linkers, the orientation of the target molecules can be inferred from the measured polarized fluorescence. In polarization anisotropy studies, the orientation of either a single fluorophore or the population average orientation of an ensemble of fluorophores can be measured. This localization- and orientation-resolved imaging method enables detailed studies of the assembly and disassembly of protein structures inside living cells [8–10].
Live biological polarization microscopy of moving samples has previously been applied in 2D imaging over time. 3D imaging has been challenging, due to the long acquisition time required to sequentially record both polarization and 3D information. The ability to study living, moving samples over time in 3D is one of the major advancements of modern biological imaging [11]. Pioneering 3D time-lapse polarization studies of living (but non-moving) biological samples have been carried out using polarization confocal microscopy with acquisition times of a single image on the time scale of minutes [12], and in high-speed configuration of tens of seconds [13]. We here report a fast 3D polarization microscopy technique for imaging living, moving biological samples. Our multifocus polarization microscope (MF PolScope) is based on OpenPolscope technology [1] for polarization capability and widefield multifocus microscopy (MFM) [14] for 3D imaging capability. MFM optics form an instant 3D image, consisting of a focal stack of up to 25 focal planes. The acquisition time of each 3D polarization image in the MF PolScope is thereby limited to the time required for recording the polarization acquisition sequence, which currently is faster than one second. We describe in detail the optical layout of the MF PolScope and demonstrate the power of this versatile 3D microscopy system through biological imaging examples. We show a fluorescence polarization anisotropy study of protein assembly dynamics in budding yeast, and transmission polarization imaging of cell division in C. elegans embryos.
2. The MF PolScope
Our MF PolScope (Fig. 1) uses an electronically controlled liquid crystal (LC) compensator to produce the desired polarization properties of the illumination light. We have integrated polarization optics with an inverted Olympus IX-83 microscope body, equipped with an Olympus 60 × , NA = 1.3, silicon oil immersion objective and standard tube lens, as shown in Fig. 1(a). The LC compensator is mounted on top of the high-NA condenser lens in the illumination path. In birefringence imaging configuration, an analyzer is also inserted after the objective in the microscope filter cube turret, to transform the changes in polarization state of the excitation light caused by the specimen birefringence into measurable intensities. The freely available software OpenPolScope (www.openpolscope.org), developed by the Oldenbourg lab, and FIJI/ImageJ were used for hardware control, data acquisition and data analysis. OpenPolScope runs as a plugin to micro-manager (www.micro-manager.org) [15] and can be used to capture and analyze polarization data in the form of images and movies in birefringence, diattenuation or fluorescence mode. An example of fluorescence polarization image acquisition and analysis is provided in Appendix A. The acquisition speed for each 3D polarization image frame depends on how fast the sequence of polarization illumination can be generated, and the resulting images recorded. Typical switching time of the LC is 50-100ms, and each polarization image consists of a sequence of two to five image frames. For an image consisting of five frames the minimum acquisition time is currently below one second, the exact acquisition time depending on camera exposure time. This acquisition rate makes it possible to study living, slowly moving samples in 2D. To obtain the same acquisition rate in 3D imaging, we integrated multifocus optics into the polarization imaging system. Multifocus imaging modalities employ optical techniques to simultaneously capture multiple 2D focal planes of a specimen [16,17]. We recently demonstrated an MFM system based on a specially designed diffractive multi-focus grating (MFG) [14]. Keeping the polarization optical train unchanged, multifocus optical components were inserted in a separate location from the polarization sensitive path between the polarizer/LC and the analyzer. The MFG was integrated into the microscope's imaging path and did not compromise polarization sensitivity. This is demonstrated on easily interpreted, fixed test samples in Appendix A.
Fig. 1.
(a) Schematic illustration of the MF PolScope. The polarization controller (LC universal compensator) was placed in the illumination path on top of the condenser lens. An analyzer was inserted in one slot of the filter cube turret, for use in birefringence imaging. MFM optics were appended to one of the side ports. (b) MFM optics form an instant 3D image consisting of a simultaneously formed focal stack of 2D planes, laid out in a tile pattern on the camera and captured in a single snapshot. (c) The multi-focus grating is placed in a secondary Fourier (objective pupil) plane formed by Relay Lens 1. The final (multi-focus) image is formed on the camera by Relay Lens 2. (d) To acquire polarization information, a series of images with the sample illuminated by light of different polarization states is recorded. Here we show the orientations used to form a birefringence image. This layout is for monochromatic imaging. For the chromatically corrected system, see Fig. 2.
Our MFG is a highly efficient phase-only transmission diffractive grating made of fused silica. When inserted in the Fourier plane of a regular wide-field microscope, the MFG produces an instant focal series of 2D images of the specimen (Fig. 1). The grating function (the shape of the basic pattern that is repeated across the surface of the MFG) determines how many diffractive orders (focal planes) are generated [14,18–20]. The focus shift is introduced by a carefully calibrated geometrical distortion of the grating pattern across the surface. In our MFM system, the shape of distortion is designed so as to refocus the light while also compensating for depth-induced spherical aberration [14]. Images of one of our multifocus gratings, illustrating the basic pattern and its distortion across the surface of the grating, are shown in Appendix B.
In the MF PolScope we have implemented a chromatically corrected MFM configuration with nine focal planes (Fig. 2) and an extended volume MFM imaging system with 25 focal planes (Fig. 3) for higher sampling resolution in deeper imaging volumes. All polarization sensitive parts are located before the primary image plane, after which the multifocus optics are inserted. We have applied the nine-plane system in fluorescence polarization mode to study live 3D protein dynamics of septin structures in living budding yeast (Fig. 4- and Media 1 (88.6KB, MOV) , Media 2 (111.8KB, MOV) , and Media 3 (1.8MB, MOV) ) and the 25-plane system in transmission polarization imaging of early cell division in nematode embryos (Fig. 7 and Media 4 (6.3MB, MOV) , Media 5 (6.3MB, MOV) , Media 6 (6.8MB, MOV) , and Media 7 (8.8MB, MOV) ).
Fig. 2.
Schematic ray diagram of multi-focus fluorescence polarization imaging at nine simultaneous focal planes, with chromatic correction. Grating function of the phase-only, transmission multi-focus grating (MFG) for 3 × 3 = 9 planes is shown in the orange inlay (at lower left), where black and white correspond to zero and pi phase step.
Fig. 3.
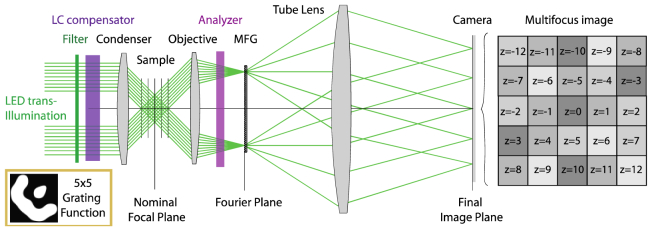
Schematic illustration of transmission polarization microscopy functionality with 25 simultaneously formed focal planes for monochromatic imaging. The grating function of our MFG for 5 × 5 = 25 planes is shown in the orange inlay (at lower left), where black and white correspond to zero and pi phase step.
Fig. 4.
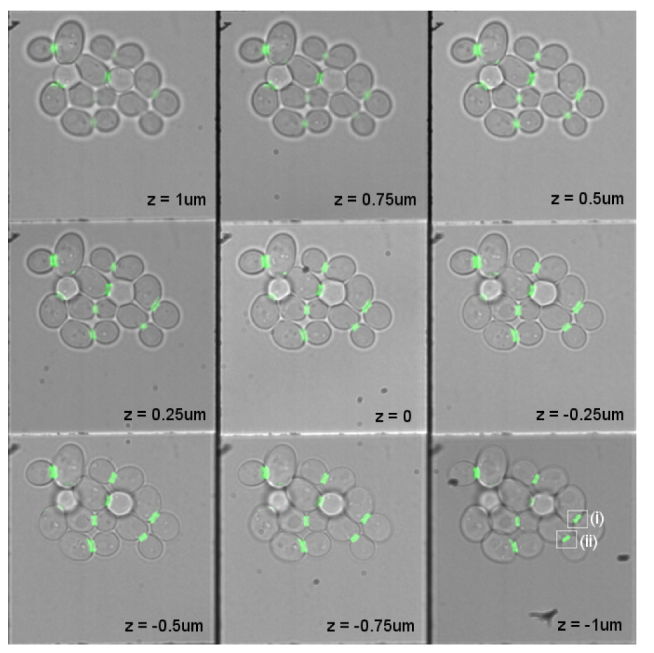
Overlaid multi-focus fluorescence and transmission images of living budding yeast (S. cerevisiae) cells expressing green fluorescent protein (GFP) tagged with a rigid linker to septin. Septin incorporates into the hourglass/ring structure at the bud neck during cell division. 3D protein organization analysis of the cells (i) and (ii), marked with white rectangles, are shown in Fig. 5. Multi-focus imaging allows screening of many cells simultaneously, and allows stable imaging over long time periods. The focus step is 250nm between planes and the lateral size of each focal slice is 33 × 33 μm. See Media 1 (88.6KB, MOV) for a 3D visualization of the septin rings.
Fig. 5.
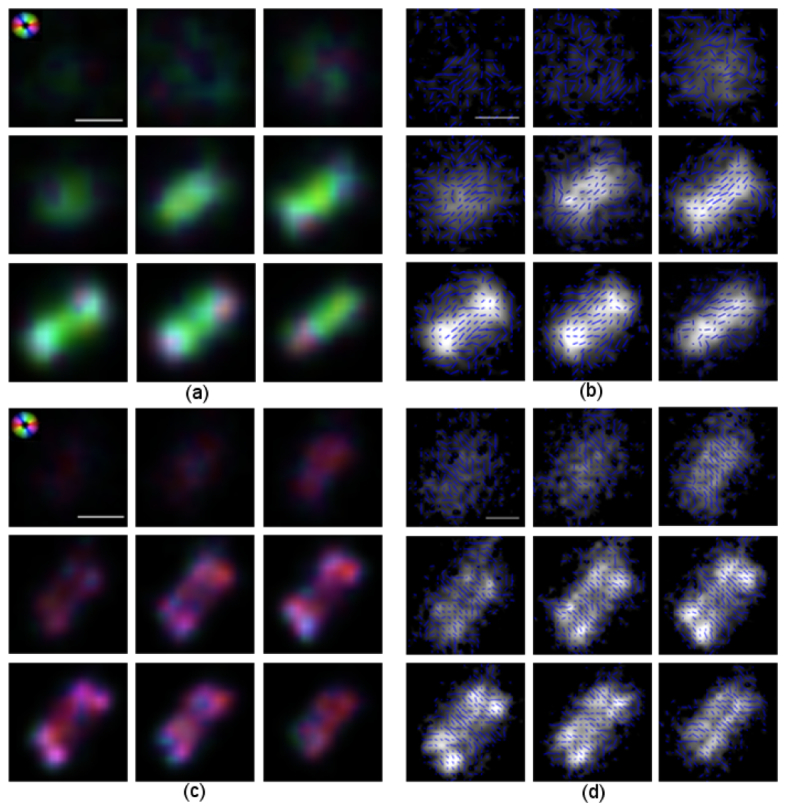
Polarization analysis of yeast cells reveals protein organization. We here show zoomed-in views of the cells (i) and (ii) indicated by white rectangles in Fig. 4. All nine focal planes of each MFM image are shown. (a) Protein orientation in cell (i) indicated by color, according to the aster in the upper left corner. (b) Protein orientation in cell (i) indicated by lines. In this cell, the septin complex is in the single hourglass conformation with protein organized orthogonally to the mother-bud axis. (c) Protein orientation in cell (ii) indicated by color according to the aster in the upper left corner. (d) Protein orientation of cell (ii) indicated by lines. In this cell, the hourglass structure has split into two rings preparing for cell division. The protein has undergone a 90-degree orientation change and is aligned along the mother-bud axis. The data has been resampled and contrast adjusted for display. Scale bar 1μm.
Fig. 6.

Time-lapse 3D polarization imaging of the septin ring split. Protein orientation is indicated by computed color according to the aster in the upper left corner. Just prior to cytokinesis, the septin hourglass splits into two rings. (a) Before the ring has split, the average organization of septin is orthogonal to the mother-bud axis, indicated by yellow computed color. (b) The septin ring has split in two, and the protein has reoriented by 90 degrees. The orientation is parallel to the mother-bud axis, direction indicated by blue computed color. Media 2 (111.8KB, MOV) and Media 3 (1.8MB, MOV) show 3D movie visualizations of the split. Scale bar 5μm.
Fig. 7.
Two time-points from an extended volume 25-plane multifocus movie showing a developing C. elegans embryo inside an adult worm, recorded at one frame per second. Polarization imaging is used to obtain contrast, revealing chromatin and spindles rearranging during the first cell division into the two-cell stage. This movie and an additional movie of another embryo undergoing cell division from two- to four-cell stage are included in downsized, compressed movies as Media 4 (6.3MB, MOV) and Media 5 (6.3MB, MOV) . Cropped but less compressed movies of selected focal planes containing the spindles are included in Media 6 (6.8MB, MOV) and Media 7 (8.8MB, MOV) . The size of each image tile (focal plane) is 55 μm × 55 μm laterally and the focus step between planes is 1.5 μm, providing an imaging depth of 38 μm covering the entire embryo.
To encourage other microscopists to implement their own MFM systems – appended to a side port of their existing wide-field microscopes – we include a fabrication procedure for making a binary phase grating in Appendix B; example MATLAB code for designing grating functions in Appendix C; the blueprint of a favorite microscope alignment tool (invented in the Mats G.L. Gustafsson lab at UCSF) in Appendix D and detailed instructions on aligning the entire MFM optical system in appendix E. For detailed information on how to implement polarization microscopy, we refer to the online OpenPolScope resource [1].
2.1 Fluorescence and transmission polarization imaging at 9 simultaneous focal planes
Nine-plane multifocus imaging optics were set for a focal plane spacing of 250 nm, rendering a volume of view of 33 × 33 × 2.5 μm3 (Nyquist sampling). A schematic illustration of this setup is shown in Fig. 2. In fluorescence mode we used the blue LED module of an X-cite XLED1 (Lumen Dynamics) and the LC-compensator for polarization-controlled excitation light, with a green 515/30nm emission filter (Semrock) placed before an EMCCD camera (Andor iXon-888).
The configuration in Fig. 2 was used for imaging budding yeast (Fig. 4-6). For birefringence imaging (Appendix A and Media 8 (1.5MB, AVI) ), we added a circular polarization analyzer to the light path (after the objective, before the MFG) and used the green LED module with a 515/30 nm emission filter (Semrock). (For optical alignment instructions, see Appendix E.)
2.2 Transmission polarization imaging at 25 simultaneous focal planes
For extended volume MFM imaging of 25 focal planes we designed and fabricated a new MFG using the previously described pixelflipper algorithm [14]. We generated the grating function pattern (shown in the orange frame inlay in Fig. 3), which distributes light evenly into 25 diffractive orders with 78% light-efficiency at the design wavelength (here 515nm). We fabricated the grating using direct laser writing and wet etching as described in Appendix B. In order to fit all 25 focal planes next to each other in a single camera-frame, we used a large-chip sCMOS sensor (Orca Flash4, Hamamatsu). Our 3D volume of view was 55 × 55 × 38 μm3, with a focus step between consecutive image planes of 1.5 μm. Figure 1 shows the actual optical configuration with relay lenses, and Fig. 3 conceptually illustrates the polarization functionality of the system. Our 25-plane MFM currently lacks chromatic correction and is therefore not optimally suited for fluorescence microscopy. This configuration was applied in transmission polarization imaging (Fig. 7), where a narrow wavelength spectrum can be used. Extending the 3 × 3 chromatic correction scheme to 5 × 5 is conceptually straightforward, but requires additional hardware that we have not presently manufactured.
3.3 Acquisition sequence and data analysis
At each 3D timepoint in a movie, the appropriate OpenPolScope acquisition sequence of five images was recorded with the specimen illuminated by light of different polarization states. For birefringence imaging (Fig. 1) the sequence consists of one illumination setting for circular polarization and four for elliptical polarizations in different directions [2]. For measurement of polarized fluorescence we use a different algorithm [21] with a sequence of excitation light polarized at 0, 45, 90 and 135 degrees with the 0 degree frame repeated at the end. Before cutting out and assembling the many focal planes into a focal stack, we generated retardance, anisotropy and orientation images using the complete camera frame data. Initial verification of fluorescence polarization imaging functionality in the MF PolScope was done with the fixed test samples shown in Appendix A.
3. Biological imaging using multifocus polarization microscopy
3.1 Protein assembly during cell division in budding yeast
To illustrate MF the PolScope capability of imaging living biological samples, we imaged budding yeast (Saccharomyces cerevisiae) cells expressing green fluorescent protein (GFP) tagged to the Cdc12 subunit of the septin complex. Budding yeast is a model organism for cell division, and the septin assembly is involved in cytokinesis. The septin subunit Cdc12 is part of a higher order septin structure in the shape of an hourglass at the neck between mother and bud. During cytokinesis, the hourglass splits into two rings, before the mother and bud cell separate. In the yeast strain we used [21], GFP is fused to Cdc12 with a rigid linker so that the fluorophore is rotationally constrained and its orientation reports the septin protein alignment. Previous work applying 2D fluorescence polarization microscopy to examine the cell cycle demonstrated that septins undergo a dramatic reorientation by 90 degrees when the split rings form [21]. Using the MF PolScope we were here able to directly visualize this reorganization in 3D (Fig. 4-6 and Media 1 (88.6KB, MOV) , Media 2 (111.8KB, MOV) , and Media 3 (1.8MB, MOV) ). Our data confirms existing literature on septin dynamics during cell division, and extends the capability of imaging these vital biological processes to 3D. We are able to simultaneoulsy image many cells (Fig. 4) for extended time periods, which will enable us to perform septin mutant screens to detect changes in the orientation dynamics of the septin higher order structure throughout the ring in 3D during cell division. Consequently, this could provide further insight into the regulatory mechanisms of protein assemblies during the cell cycle.
This protein assembly study demonstrates the power of the MF PolScope system to allow unbiased examination of the fast dynamics of macromolecules in living tissues. The technique is expected to have wide applicability in biological imaging of living samples.
3.2 Birefringence imaging of 25 simultaneous focal planes in a nematode embryo
In order to demonstrate extended volume MFM with 25 simultaneous focal planes, we here imaged developing C. elegans embryos (Fig. 7 and Media 4 (6.3MB, MOV) , Media 5 (6.3MB, MOV) , Media 6 (6.8MB, MOV) , and Media 7 (8.8MB, MOV) ). Specimens were mounted in water on microscope slides. We used polarized illumination to obtain contrast in the semi-transparent embryo. The embryos were here imaged inside the worm, and tissue from the worm itself can be seen in the first and last focal planes. Improved images may be obtained with the more invasive method of surgically removing embryos from the worm before imaging. Illumination-light bandwidth was here limited to 7nm using a fluorescence emission filter (Semrock) centered at 515nm, to limit chromatic dispersion. A small amount of residual dispersion can still be seen – there is a slight blur in the higher order images. In experiments where higher resolution is desired, this blurring can be eliminated by using an even more narrow wavelength bandwidth, for example by using a laser source for illumination. We include this data as proof of concept of extended volume multifocus imaging of 25 simultaneous focal planes.
4. Summary and conclusions
We here describe the MF PolScope, a widefield imaging system that combines polarization and multifocus microscopy (MFM) in 3D imaging of living, moving biological specimens. MF PolScope allows fast polarization analysis of an extended sample volume at the full resolution of the microscope optics used. We apply the system in a fluorescence anisotropy imaging study of protein assembly dynamics in a protein structure, the septin ring complex, in budding yeast. Collection of orientation information simultaneously across a volume enables analysis of the rearrangements of septin at cytokinesis in 3D. Many yeast cells can be simultaneously imaged over extended time periods. This capability enables high-throughput screens for comparing the coherence and coordination of septin rearrangements in wild-type and mutant cells.
Another application of MF PolScope is label-free transmission polarization microscopy, which non-invasively provides information about molecular orientation in birefringent structures inside sensitive living samples such as embryos. We demonstrate this type of application with in vivo imaging of entire C. elegans embryos during early cell division. To cover the entire embryo, we use an extended volume multi-focus microscopy optic covering a volume of 55 × 55 × 38 μm3 at 25 simultaneously recorded focal planes. We here demonstrate extended volume 25-plane MFM for the first time. The technique allows significantly improved sampling of thicker specimens.
We believe that multi-focus polarization microscopy will have applicability in many fields of live biological and medical imaging, and could be extended for imaging applications in other branches of the engineering and physical sciences.
Acknowledgments
We thank Martin Eber and Alec Degrand at Olympus for generous loan of the Olympus IX-83 system; Jim Sims at Hamamatsu for loan of an Orca Flash 4 camera; Niko Stuurman and the μManager team for assistance with hard- and software; Jim Macilvain at Zeiss for loan of an illumination system; Shinya Inoue, Louie Kerr, David Remsen, Bill Mohler, Trevor Wardill, Tomomi and Maki Tani, Diane Cook, Josh Hamilton, Stephen Senft, Hari Shroff, Abishek Kumar and Grant Harris at the MBL, Woods Hole, for scientific and practical assistance and discussions and Thomas Geer at BioVision for crucial scientific enabling. We further thank Michael Skavarla, John Treichler, Garry Bordonaro, Meredith Metzler, Daron Westly and the entire wonderful team at the Cornell Nanoscale Science and Technology Facility (CNF) in Ithaca, NY, for assistance in diffractive optics fabrication and Brann Dailor and the Mastodon group for sonic influences. SA thanks HHMI Janelia Farm for funding initial multi-focus microscopy development, the Whitman Center at the MBL for her visiting investigator fellowship in the summer of 2013 that made this collaborative microscopy project possible and her late mentor Mats Gustafsson, with whom the original MFM rig was developed. SA is supported by a Leon Levy postdoctoral fellowship at the Rockefeller University. CIB is an investigator of the Howard Hughes Medical Institute. RO acknowledges support from grant R01EB002045 from the National Institute of Biomedical Imaging and Bioengineering.
Appendix A
Acquisition sequence and data analysis of polarization data
We here show example data of commonly used test samples for polarization microscopy. Figures 8(a)-(f)
Fig. 8.
(a)-(f) Fluorescence polarization images of E. coli labeled with FM 1-43 membrane dye (Molecular Probes). (a) Raw data of the fluorescence polarization acquisition sequence: From left to right, the sample is illuminated by elliptically polarized light of directions 0, 45, 90, 135 degrees and the 0 degree orientation repeated at the end. (b) Color-processed data of a, showing dipole orientation encoded by color, according to the color reference aster in c. (c) The color orientation aster shows how the polarization anisotropy data is displayed. For example, horizontal dipole orientation in the image is displayed as red and vertical by turquoise. (d) Dye orientation in E. coli cell indicated by color, according to the orientation color reference aster in c. (e) Dye orientation of cell in d indicated by lines. Data has been smoothed and contrast adjusted. (f) Cropped out region of all nine planes of a multifocus image of bacteria shows that the orientation direction is correct and consistent in the entire multifocus image. Region of interest shown is 5.4 × 6.3 μm2 cropped out from an image of 33 × 33 μm2 total lateral field of view. (g) Birefringence multifocus image of the frustule of a diatom. (Sample by Klaus Kemp, U.K. “Test plate 8 forms”.) See Media 8 (1.5MB, AVI) for a 3D projection of the image.
show fixed E. coli bacteria fluorescently labeled with FM 1-43 membrane dye (Molecular Probes). FM dye aligns along lipids in the bacterial membrane, so that its dipole moment is orthogonal to the membrane when bound. A single cell imaged with the fluorescence anisotropy OpenPolScope image acquisition sequence is shown in Fig. 8(a). Polarization information can be displayed using computed color, Fig. 8(b), according to the reference color aster in Fig. 8(c). Data can also be displayed as lines overlaid on the average image. A comparison of computed color vs. line display is shown in Fig. 8(d) and 8(e). Figure 8(f) illustrates that multi-focus polarization imaging of the E. coli bacteria detects the expected orientation of the dye in the membrane consistently through the depth of the sample. This assures that the polarization illumination, when calibrated using the Open PolScope software, is uniform through the imaging volume and that polarization information is not destroyed by the multifocus optics. Figure 8(g) shows the frustule of the diatom P. angulatum, a type of phytoplankton, imaged in birefringence (transmission) mode. The puncta of the shell have a pitch of 525 nm. In birefringence data, color indicates the direction of the slow axis, which runs along edges in this sample. A 3D projection of the diatom is shown in Media 8 (1.5MB, AVI) .
Appendix B
Fabrication process for binary diffractive grating
For 25-plane imaging we designed an MFG pattern using the pixelflipper algorithm and an aberration-free distortion function as described in our previous publication [14]. The algorithmically generated pattern was transferred onto a photosensitive chrome coated fused silica mask plate of refractive index n = 1.46 using direct laser writing (Heidelberg Mask Writer DWL2000, Cornell NanoScale Science and Technology Facility, CNF). The mask was immersed in a buffered oxide etch (BOE) solution of concentration 6:1 for 7 minutes, achieving a smooth etched surface, aiming for a pi phase shift depth of 560 nm for green light of 515 nm wavelength. Photoresist and chrome was stripped from the mask. Resulting etch depth of 567 nm and surface roughness Ra = 0.5 were measured by tapping mode atomic force microscopy (AFM). Images of the grating captured using a transmitted light microscope are shown in Figs. 9
Fig. 9.
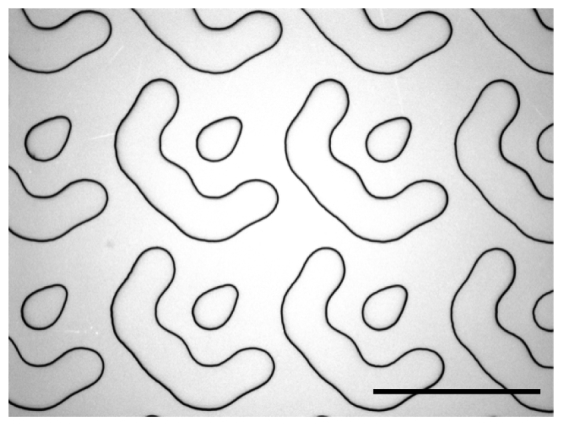
Microscope image (Nikon 100 × microscope objective) of the 25-plane multifocus grating (MFG) shows the quality of the features obtained using direct laser writing and wet etching. The flat features protrude straight up from the surface, edges showing up dark in the image. Scale bar 29 μm.
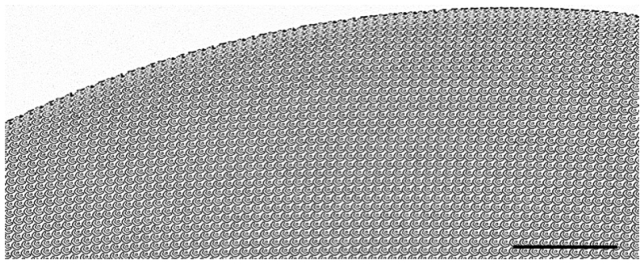
and 10
Fig. 10.
Microscope image (Nikon 5 × objective) recorded over a larger field of view, showing the 25-plane multi-focus grating in Fig. 9. This image shows the intentional geometrical distortion of the grating pattern period across the surface of the grating, which introduces the focus shift. Scale bar 300 μm.
.
Appendix C
IFTA (Iterative Fourier Transform) for generating grating functions for MFGs
The code in Table 1
Table 1. MATLAB code.
| P=1024; % Number of pixels of grating function (unit cell pattern of diffractive optical element) assumed square niter=200; % Number of iterations to obtain the result N=3; % Orders of diffraction to send light to (e.g. 3 means 3x3) NP=8; % Number of phase steps (2 is binary phase 0 and pi, 8 is eight uniform steps between 0 and 2pi) goodmask=zeros(P); %Binary mask containing the desired diffraction orders goodmask(floor(P/2)-floor(N/2)+1:floor(P/2)+floor(N/2)+1,floor(P/2)-floor(N/2)+1:floor(P/2)+floor(N/2)+1)=1; m = exp(2*pi*i*floor(rand(P)*NP)/NP); % Generates initial grating function guess GoalMean = sum(sum(abs(fft2(m)).^2)) / (N*N); % Mean of the expected power in each desired order (Parseval) GoalInten = GoalMean * goodmask; % Desired output assuming 100% of the power go into the desired orders GoalAmp = fftshift(sqrt(GoalInten)); % Corresponding magnitude of the amplitude for q=1:niter curAmp=GoalAmp.*exp(i*angle(fft2(m))); % Enforce full transmission (thus GoalAmp) of the diffraction orders m=ifft2(curAmp); % Back to the space of the grating function mPhase=2*pi*round(NP*angle(m)/(2*pi))/NP; % Discretize the phase of the continuous grating function m=exp(i*mPhase); % Apply the discretized phase to the current estimate of the grating function end imagesc(angle(m*exp(2*pi*0.01i))); % Display the result |
, written by Rainer Heintzmann, uses IFTA to generate high-resolution grating-function patterns in a matter of minutes, instead of the many hours required by the “pixelflipper” algorithm written by Sara Abrahamsson [14]. The code generates a phase-only grating function with NP phase levels for distributing light evenly and with high efficiency into N×N diffractive orders. More elaborate code that obtains the same preciseness of results as the “pixelflipper” can be downloaded at http://www.nanoimaging.de/MFG. Examples of patterns generated by the code in Table 1 are shown in Fig. 11
Fig. 11.
Results of running the code in Table 1 in MATLAB with different parameters. (a) Example of a grating function generated with parameters P = 512 (512 × 512 pixel matrix); NP = 2 (binary phase); N = 5 (5 × 5 diffractive orders). (b) Relative energy distribution in the central 5 × 5 diffraction orders produced by the pattern in a. Distribution evenness is so high that variation can hardly be distinguished by eye. Total efficiency is 77.4% and distribution evenness 99%. (c) Example of eight-phase grating function generated with parameters P = 1024 (1024 × 1024 pixel matrix); NP = 8 (eight phases); N = 3 (3 × 3 diffractive orders.) (d) Theoretical energy distribution obtained by the pattern in c. This type of pattern was previously described in patent US 20130176622 A1 by Sara Abrahamsson and Mats G.L. Gustafsson. It was then calculated using the pixelflipper algorithm to obtain optimal results (even intensity distribution with 89% efficiency). Grating functions with similar efficiencies have been described before by Mait [20], however the solutions presented here have the advantage of consisting only of discrete fields of geometrical shapes, making them practical to fabricate using photolithography masks.
.
Appendix D
Blueprint of the handy laser alignment objective (Halo)
In addition to the housing in Fig. 12
Fig. 12.
Original blueprint from the Gustafsson, Sedat and Agard applied microscopy groups at UCSF, of the mechanical housing of the “handy laser alignment objective” (Halo). To users outside the US, we apologize for the Imperial units. (Please note that 0-80 is a thread size.) This drawing is for a microscope with RMS objective thread objectives, if necessary, please substitute to what you are using. You can also use a high precision thread adapter that is flat and true and does not destroy the orthogonality of your beam.
you will need a small, cylindrical laser diode that fits nicely inside the housing, and six hex socket set screws to hold the diode inside the housing through the threaded side holes. Choose a laser diode unit of a safe (preferably adjustable) intensity and a wavelength suitable for your dichroic and filters. A cheaper alternative to machining parts is to assemble commercially available lens tubes to hold the laser diode, however we believe this solid brass piece will be more stable and accurate.
Appendix E
Guide to optical alignment of MFM system
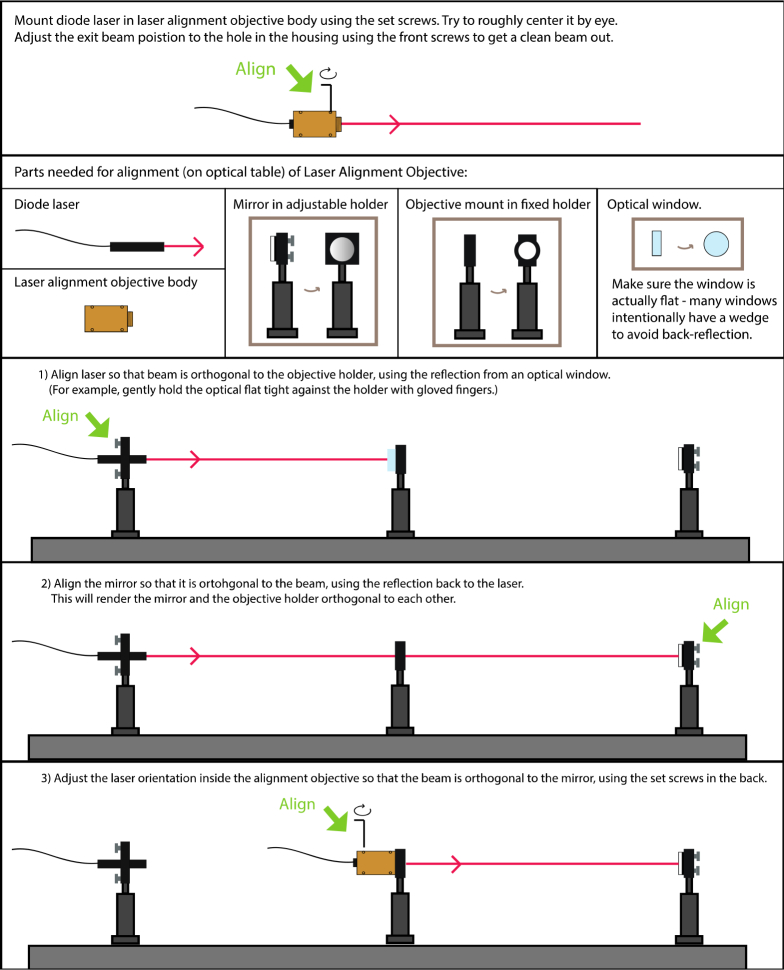
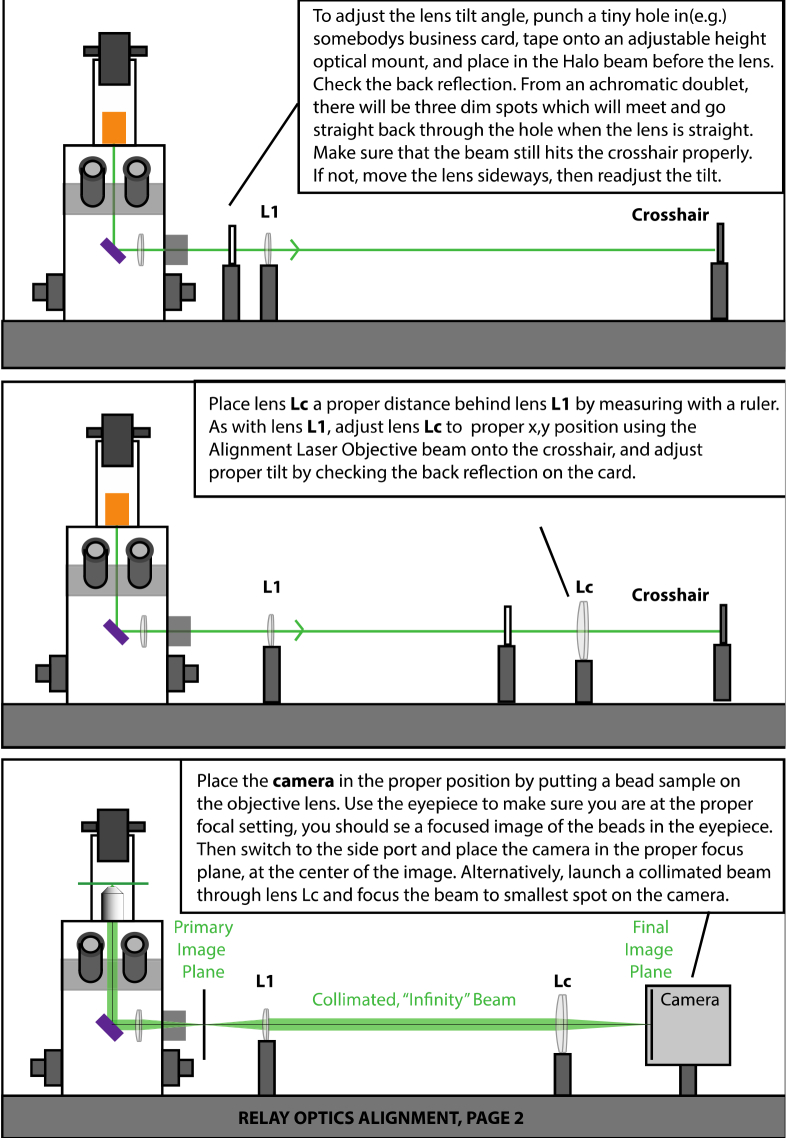
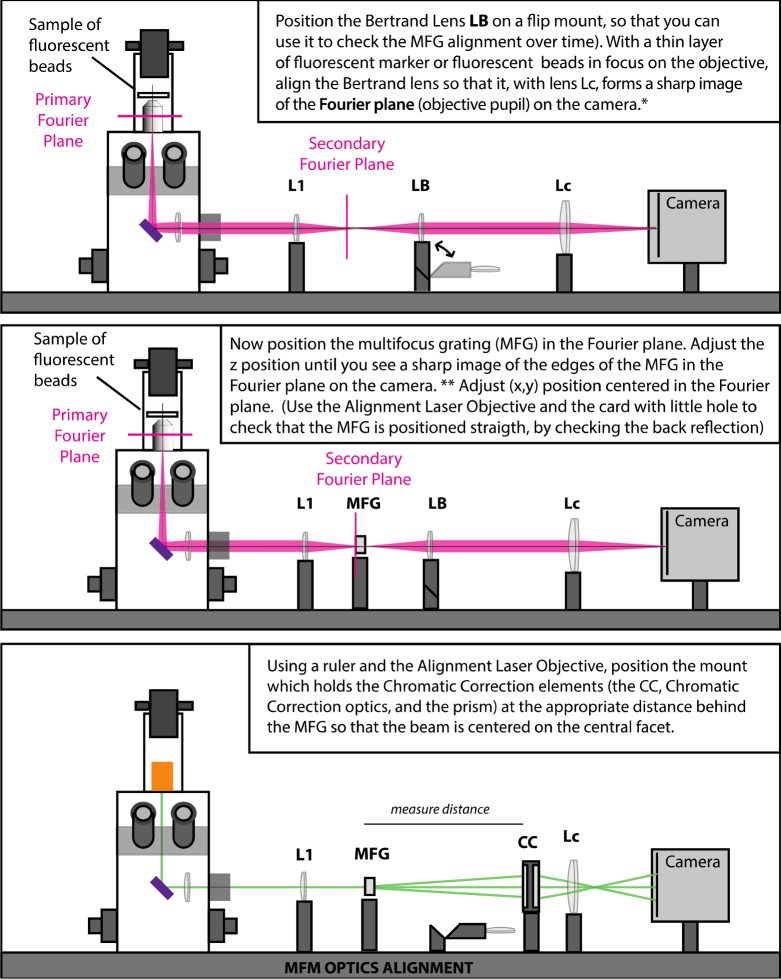
This guide provides instructions for aligning the optics used for our multifocus microscope (MFM). Figure 13
Fig. 13.
Alignment of Halo.
shows how to align the Halo alignment tool, Fig. 14
Fig. 14.
Overview of microscope configurations.
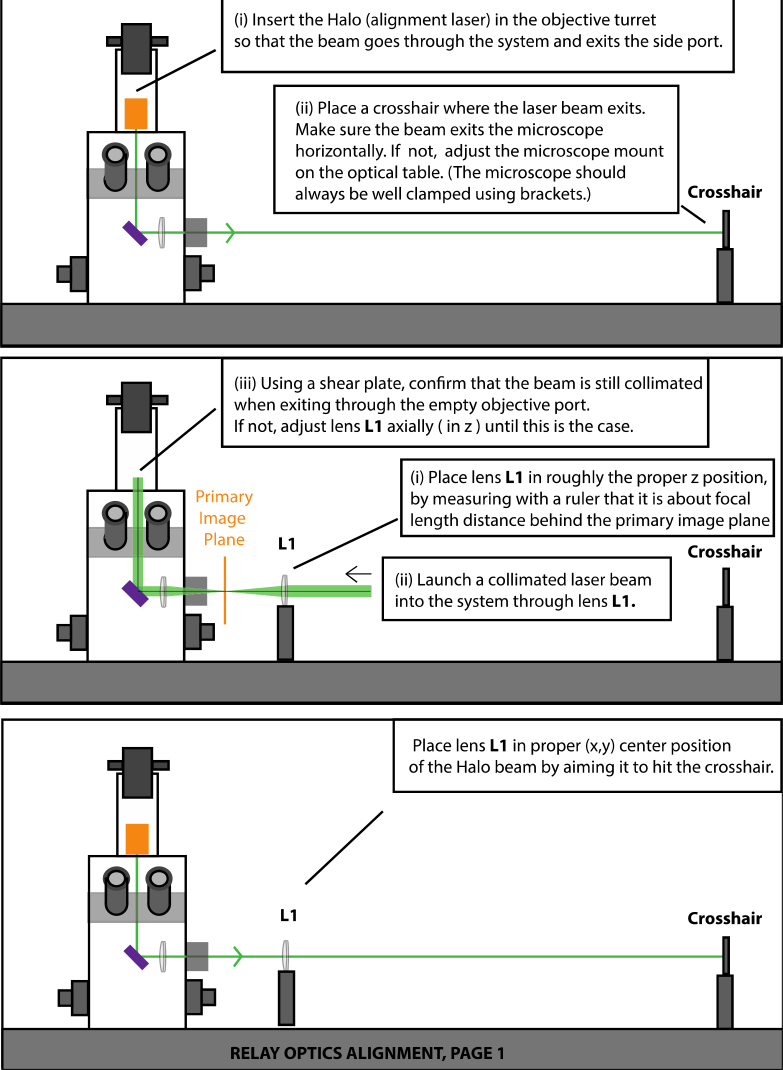
shows an overview of the microscope in different configurations, Figs. 15
Fig. 15.
Alignment of relay optics, page 1.
-16
Fig. 16.
Alignment of relay optics, page 2.
show how to align the relay optics, Fig. 17
Fig. 17.
Alignment of MFM optics.
shows how to align the multifocus optics, and Fig. 18
Fig. 18.
Square slit to limit field of view overlap between focal planes.
shows how to insert a square slit to limit the field of view.
References and links
- 1.Oldenbourg R., Mei G., “New polarized light microscope with precision universal compensator,” J. Microsc. 180(2), 140–147 (1995), www.openpolscope.org. 10.1111/j.1365-2818.1995.tb03669.x [DOI] [PubMed] [Google Scholar]
- 2.Mehta S. B., Shribak M., Oldenbourg R., “Imaging birefringence and diattenuation with high sensitivity and high resolution,” J. Opt. 15, 094007 (2013). 10.1088/2040-8978/15/9/094007 [DOI] [PMC free article] [PubMed] [Google Scholar]
- 3.Shribak M., Oldenbourg R., “Techniques for fast and sensitive measurements of two-dimensional birefringence distributions,” Appl. Opt. 42(16), 3009–3017 (2003). 10.1364/AO.42.003009 [DOI] [PubMed] [Google Scholar]
- 4.Inoue S., “[Polarization optical studies of the mitotic spindle. I. The demonstration of spindle fibers in living cells],” Chromosoma 5(5), 487–500 (1953). 10.1007/BF01271498 [DOI] [PubMed] [Google Scholar]
- 5.Liu L., Trimarchi J. R., Oldenbourg R., Keefe D. L., “Increased birefringence in the meiotic spindle provides a new marker for the onset of activation in living oocytes,” Biol. Reprod. 63(1), 251–258 (2000). 10.1095/biolreprod63.1.251 [DOI] [PubMed] [Google Scholar]
- 6.Demos S. G., Alfano R. R., “Optical polarization imaging,” Appl. Opt. 36(1), 150–155 (1997). 10.1364/AO.36.000150 [DOI] [PubMed] [Google Scholar]
- 7.Inoué S., Shimomura O., Goda M., Shribak M., Tran P. T., “Fluorescence polarization of green fluorescence protein,” Proc. Natl. Acad. Sci. U.S.A. 99(7), 4272–4277 (2002). 10.1073/pnas.062065199 [DOI] [PMC free article] [PubMed] [Google Scholar]
- 8.Corrie J. E. T., Brandmeier B. D., Ferguson R. E., Trentham D. R., Kendrick-Jones J., Hopkins S. C., van der Heide U. A., Goldman Y. E., Sabido-David C., Dale R. E., Criddle S., Irving M., “Dynamic measurement of myosin light-chain-domain tilt and twist in muscle contraction,” Nature 400(6743), 425–430 (1999). 10.1038/22704 [DOI] [PubMed] [Google Scholar]
- 9.Vrabioiu A. M., Mitchison T. J., “Symmetry of septin hourglass and ring structures,” J. Mol. Biol. 372(1), 37–49 (2007). 10.1016/j.jmb.2007.05.100 [DOI] [PubMed] [Google Scholar]
- 10.Kampmann M., Atkinson C. E., Mattheyses A. L., Simon S. M., “Mapping the orientation of nuclear pore proteins in living cells with polarized fluorescence microscopy,” Nat. Struct. Mol. Biol. 18(6), 643–649 (2011). 10.1038/nsmb.2056 [DOI] [PMC free article] [PubMed] [Google Scholar]
- 11.Fischer R. S., Wu Y., Kanchanawong P., Shroff H., Waterman C. M., “Microscopy in 3D: a biologist’s toolbox,” Trends Cell Biol. 21(12), 682–691 (2011). 10.1016/j.tcb.2011.09.008 [DOI] [PMC free article] [PubMed] [Google Scholar]
- 12.Kress A., Wang X., Ranchon H., Savatier J., Rigneault H., Ferrand P., Brasselet S., “Mapping the local organization of cell membranes using excitation-polarization-resolved confocal fluorescence microscopy,” Biophys. J. 105(1), 127–136 (2013). 10.1016/j.bpj.2013.05.043 [DOI] [PMC free article] [PubMed] [Google Scholar]
- 13.Wang X., Kress A., Brasselet S., Ferrand P., “High frame-rate fluorescence confocal angle-resolved linear dichroism microscopy,” Rev. Sci. Instrum. 84(5), 053708 (2013). 10.1063/1.4807318 [DOI] [PubMed] [Google Scholar]
- 14.Abrahamsson S., Chen J., Hajj B., Stallinga S., Katsov A. Y., Wisniewski J., Mizuguchi G., Soule P., Mueller F., Dugast Darzacq C., Darzacq X., Wu C., Bargmann C. I., Agard D. A., Dahan M., Gustafsson M. G., “Fast multicolor 3D imaging using aberration-corrected multifocus microscopy,” Nat. Methods 10(1), 60–63 (2012). 10.1038/nmeth.2277 [DOI] [PMC free article] [PubMed] [Google Scholar]
- 15.Edelstein A., Amodaj N., Hoover K., Vale R., Stuurman N., “Computer control of microscopes using µManager,” Curr. Protoc. Mol. Biol. Chapter 14, 20 (2010), www.micro-manager.org. [DOI] [PMC free article] [PubMed]
- 16.Blanchard P. M., Greenaway A. H., “Simultaneous multiplane imaging with a distorted diffraction grating,” Appl. Opt. 38(32), 6692–6699 (1999). 10.1364/AO.38.006692 [DOI] [PubMed] [Google Scholar]
- 17.Ram S., Prabhat P., Chao J., Ward E. S., Ober R. J., “High accuracy 3D quantum dot tracking with multifocal plane microscopy for the study of fast intracellular dynamics in live cells,” Biophys. J. 95(12), 6025–6043 (2008). 10.1529/biophysj.108.140392 [DOI] [PMC free article] [PubMed] [Google Scholar]
- 18.Born M., Wolf E., “Diffraction gratings,” in Principles of Optics, 7th (expanded) edition (Cambridge, 2002), pp. 446–461. [Google Scholar]
- 19.Goodman J. W., “Diffractive Optical Elements,” in Introduction to Fourier Optics, 3rd edition (Roberts & Co; ), pp. 212–218. [Google Scholar]
- 20.Mait J. N., “Understanding diffractive optic design in the scalar domain,” J. Opt. Soc. Am. A 12(10), 2145–2158 (1995). 10.1364/JOSAA.12.002145 [DOI] [Google Scholar]
- 21.DeMay B. S., Noda N., Gladfelter A. S., Oldenbourg R., “Rapid and quantitative imaging of excitation polarized fluorescence reveals ordered septin dynamics in live yeast,” Biophys. J. 101(4), 985–994 (2011). 10.1016/j.bpj.2011.07.008 [DOI] [PMC free article] [PubMed] [Google Scholar]


