

Abstract
Pancreatic ductal adenocarcinoma (PDA) is a lethal malignancy resistant to most therapies, including immune checkpoint blockade. To elucidate mechanisms of immunotherapy resistance, we assessed immune parameters in resected human PDA. We demonstrate significant interpatient variability in T-cell number, localization, and phenotype. CD8+ T cells, Foxp3+ regulatory T cells and PD-1+ and PD-L1+ cells were preferentially enriched in tertiary lymphoid structures that were found in most tumors compared to stroma and tumor cell nests. Tumors containing more CD8+ T cells also had increased granulocytes, CD163+ (M2 immunosuppressive phenotype) macrophages, and FoxP3+ regulatory T cells. PD-L1 was rare on tumor cells, but was expressed by CD163+ macrophages and an additional stromal cell subset commonly found clustered together adjacent to tumor epithelium. The majority of tumoral CD8+ T cells did not express molecules suggestive of recent T-cell receptor (TCR) signaling. However, 41BB+PD-1+ T cells were still significantly enriched in tumors compared to circulation. Tumoral PD-1+ CD8+ T cells commonly expressed additional inhibitory receptors, yet were mostly T-bethi and Eomeslo, consistent with a less terminally exhausted state. Analysis of gene expression and rearranged TCR genes by deep sequencing suggested most patients have a limited tumor-reactive T-cell response. Multiplex immunohistochemistry revealed variable T-cell infiltration based on abundance and location, which may result in different mechanisms of immunotherapy resistance. Overall, the data support the need for therapies that either induce endogenous, or provide engineered, tumor-specific T-cell responses and concurrently relieve suppressive mechanisms operative at the tumor site.
Keywords: Pancreatic ductal adenocarcinoma, PDA, T cell, TCR, immunotherapy, tumor microenvironment
INTRODUCTION
Pancreatic ductal adenocarcinoma (PDA) is currently the 3rd leading cause of cancer-related mortality. Most patients present with advanced unresectable or metastatic disease that is resistant to therapy. Immune checkpoint blockade (e.g., anti–PD-1/PD-L1 and/or anti–CTLA-4) produces clinical responses in a variety of solid tumors, including melanoma and lung cancer but shows limited activity in PDA thus far (1, 2). Mutational load and T-cell neoantigen recognition contributes to clinical responses following checkpoint blockade (3-5), but unlike the commonly responsive tumors, PDA has relatively few coding mutations and thus few antigenic targets (6). Thus, endogenous PDA-reactive T cells may not be sufficiently robust for checkpoint blockade to have clinical benefit in PDA.
In addition to few mutational targets, additional mechanisms may curb effective anti-cancer T-cell responses in PDA. As reported in genetically engineered mouse models, the complex and immunosuppressive tumor microenvironment may interfere with intratumoral T-cell accumulation and T-cell activation (7-15). During persistent viral infection and some anti-tumor responses, persistent T-cell receptor (TCR) signaling can mediate terminal differentiation and exhaustion of T cells that could also contribute to resistance to checkpoint blockade (16-18). We previously demonstrated that the adoptive transfer of engineered T cells specific for a PDA self/tumor antigen, mesothelin, has marked anti-cancer activity in a genetically engineered PDA mouse model, but over time the transferred T cells are rendered dysfunctional, specifically in tumors (19). Thus, a greater understanding of the properties of human PDA-infiltrating T cells could inform immune-based strategies.
Four pancreatic cancer subtypes have been described based on transcriptional profiling, including an immunogenic subset that contains relatively more transcripts for T-cell signature genes (20, 21). However, T cells must be more fully characterized in PDA in order to better understand potential anti-tumor activity, operative inhibitory pathways, and other obstacles to effective immunotherapies. Previous human PDA studies have suggested that endogenous CD8+ T cells are trapped in peritumoral tissue and may be excluded from tumor nests (22-25)., However, T cells have also been suggested to be the dominant PDA-infiltrating immune cell type (15, 26), a distinction from other reports that included findings in genetically engineered mouse models showing limited T-cell infiltrates and, in particular, few CD8+ T cells in tumor cell nests or in the surrounding stroma (10-12, 19, 27). Tertiary lymphoid structures (TLS), ectopic lymphoid formations commonly found in chronic inflammatory sites and in many solid tumors, have many of the characteristics of lymphoid follicles, suggestive of a role in T-cell priming and/or regulation of in situ immune responses (28). TLS are seen in pancreatic cancer tissue, but the origin and function of these structures in PDA is unclear (29, 30).
To better understand the naturally occurring, adaptive T-cell response to invasive PDA, we have characterized the abundance, localization, and qualities of tumor-infiltrating CD8+ T cells and suppressive cells in resected specimens. Because most PDA patients present with inoperable disease, the results described herein are necessarily biased toward the minority of patients that present with early-stage disease.
MATERIALS & METHODS
Pancreatic cancer samples
Surgically resected tumor specimens were obtained from PDA (n=20) and pancreatic neuroendocrine tumor (PNET, n=7) patients who provided written informed consent by NWBioTrust (Department of Pathology, University of Washington School of Medicine). PDA samples were selected from patients who underwent surgery without neoadjuvant therapy (14/20), and we selected 11/14 from these based on having sufficient tumoral tissue available for comprehensive analyses. All studies using human specimens were approved by the Fred Hutchinson Cancer Research Center Institutional Review Board and conducted according to the principles expressed in the Declaration of Helsinki.
Tissue preparation
PBMCs were collected prior to surgery. Resected tumor, normal adjacent (Nadj) pancreas, and spleen were collected immediately following surgery and placed into ice cold complete media (DMEM containing 10% FBS + 1% Penicillin/Streptomycin). Tissues were subdivided for flash frozen (RNA/DNA), formalin (immunohistochemistry), optimum cutting temperature compound (O.C.T., immunofluorescence), or were further processed to generate single cell suspensions of mononuclear cells. In the latter case, tumors were weighed, minced with a razor blade, incubated for 30 min in collagenase (1 mg/ml), mechanically filtered (70 μM), and washed 2X in complete media. Peripheral blood was collected in heparin-containing tubes, mixed 1:1 with PBS/EDTA, layered over histopaque, and centrifuged (2,000 rpm for 20 minutes). PBMCs were isolated at the interface of the gradient, washed 1X, counted, and cryopreserved in 10% DMSO for subsequent analysis.
Immunohistochemistry
Tissues were fixed in 10% formalin, paraffin-embedded, and 5 μM-thick sections stained with hematoxylin and eosin (H&E) or prepared for immunohistochemistry by optimized standard antigen-retrieval methods. Each antibody was titrated and compared with isotype-matched controls. Primary antibodies used include: CD8 (Abcam ab4055, 1:200), Foxp3 (Abcam 236A/E7, 1:100), CD20 (eBioscience L26, 1:100), iNOS (Abcam ab15326, neat), CD163 (Novocastra 10D6, 1:200), DC-Lamp (Dendritics 1010E1.01, 1:100), pan-HLA (eBioscience A4, 1:250), HLA-DR (Dako M0746, 1:400), Galectin-3 (eBioscience M3/38, 1:100) and Galectin-9 (Abcam ab69630, 1:250). A 20X objective using a Nanozoomer Digital Pathology slide scanner (Hamamatsu; Bridgewater, New Jersey) was used to scan stained slides. In Fig. 4C and Supplementary Fig. S1F, a project-specific configuration based on a threshold of pixel values (Visiopharm software, Hoersholm, Denmark) detected immunoreactivity. In Figs. 1D and 1E, CD8+ and Foxp3+ T-cell numbers were counted in three to five areas and mean T-cell number normalized to area (mm2) was plotted. In Figs. 4A and 4B, staining intensity in cell types was based on morphology. For each specimen, three to five regions were graded on a scale (0, no staining detected; 1, light; 2, moderate; 3, high; 4 very high), and averaged for each patient sample. All staining and analyses were reviewed by a pathologist R.H.P.
Figure 4.
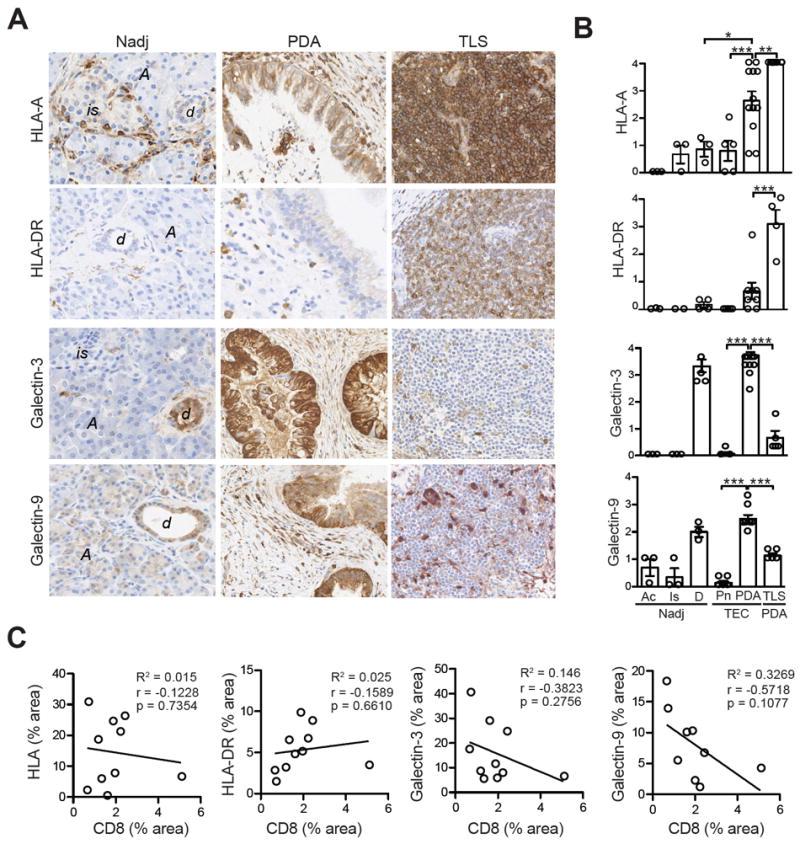
Antigen-presentation molecule and inhibitory ligand expression in human pancreatic tumors. A, Representative IHC of MHC class I (HLA-A), MHC class II (HLA-DR), Galectin-3 and Galectin-9 in Nadj pancreas, PDA and TLS. is, islet; Ac, acinar; d, normal duct. Scale bar represents 25 μm. B, Quantification of IHC staining in acinar cells (Ac), islets (Is) and ducts (D) from Nadj pancreas, PNET tumor epithelial cells (TEC, Pn), PDA TEC and PDA TLS. C, Evaluation of the correlation between CD8 T-cell staining and ligand expression in PDA.
Figure 1.
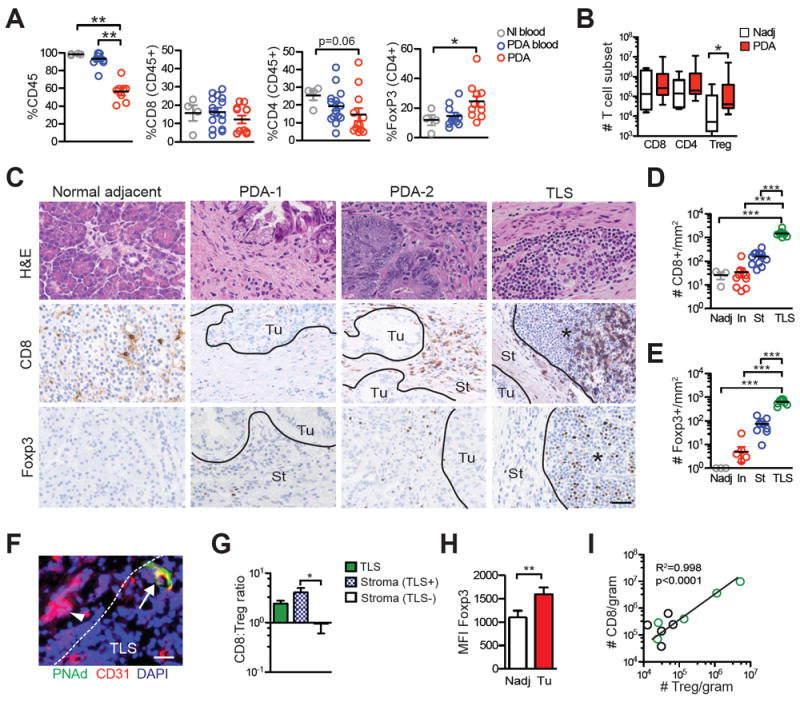
Effector and regulatory T-cell abundance and localization in PDA. A, Immune cell frequency in normal individual blood (Nl blood), PDA patient blood (PDA blood) and resectable tumor specimens (PDA) was assessed by flow cytometric analysis of mononuclear cells. B, CD8+, CD4+Foxp3- and CD4+Foxp3+ Treg cell number in Nadj and resected tumors normalized to gram of tissue. C, Immunohistochemistry (IHC) for CD8 and Foxp3 in representative Nadj pancreas, 2 tumors that differ in the CD8 T-cell infiltrate (PDA-1 and PD1-2) and TLS in PDA. Ac, acinar; TEC, tumor epithelial cell nests; St, stroma; TLS, tertiary lymphoid structures; and black line, demarcating TEC vs. stroma vs. TLS. Scale bar represents 25 μm. D, CD8+ T-cell number per mm2 in Nadj, tumor epithelial cell nests (TEC), stroma (St) and TLS. Each circle represents the mean number of cells per mm2 in the specified location for each resected specimen. E, Foxp3+ T-cell number per mm2 in Nadj, tumor epithelial cell nests (TEC), stroma (St) and TLS. Each circle is the mean number of cells per mm2 in the specified location for each resected specimen. F, Immunofluorescent staining of TLS in PDA for CD31 and PNAd for HEVs. Arrowhead, CD31+ vessel in tumor stroma; arrow, CD31+PNAd+ HEVs in TLS; and dashed white line demarcates TLS vs. stroma. Scale bar represents 25 μm. G, CD8:Treg ratio was determined in TLS and in tumor stroma that were either TLS+ or TLS- by IHC. H, Mean fluorescence intensity (MFI) of Foxp3 in Treg isolated from Nadj pancreas and tumors was determined by flow cytometry. I, Correlation between CD8 T-cell and Treg numbers in PDA was determined by flow cytometry. Green circles represent tumors with TLS.
Immunofluorescence
Tissues were embedded in O.C.T. compound (Tissue-Tek), frozen, and stored at -80°C. 7 μM sections were cut and fixed in cold (-20°C) acetone for 15 min. Sections were rehydrated with PBS +2% BSA, blocked with 2% goat serum and incubated for 1 h at room temperature with primary antibody diluted in PBS + 2.5% BSA. Primary antibodies used include peripheral lymph node addressin (PNAd)-FITC (eBioscience MECA79, 1:100), rabbit polyclonal CD8 (Abcam ab4055, 1:25), pan-cytokeratin-FITC (Sigma-Aldrich F3418, 1:200), CD15 (Thermo Scientific MMA/LeuM1, 1:25), αSMA (DAKO 1A4, 1:100) and CD31 (eBioscience WM-59, 1:100). Slides were washed 3X in PBS+2% BSA and incubated with species-specific secondary Alexa-conjugated antibodies (Invitrogen, 1:1000) for 30 min, washed, and mounted with Prolong Gold anti-fade plus DAPI (ThermoFisher Scientific).
Multiplex staining and image analysis
4 μM formalin-fixed paraffin-embedded tissue sections were baked for 1 h at 60°C, dewaxed (Dewax Solution, Leica), and stained on a Leica BOND Rx stainer. Antigen retrieval and antibody stripping steps were performed at 100°C using Epitope Retrieval Solution 2 and Bond Wash Solution (Leica). All other steps were performed at room temperature. Endogenous peroxidase was blocked with 3% H2O2 for 8 min followed by protein blocking with TCT buffer (0.05M Tris, 0.15M NaCl, 0.25% Casein, 0.1% Tween 20, pH 7.6) for 30 m. A high stringency wash of high-salt TBST solution (0.05M Tris, 0.3M NaCl, and 0.1% Tween-20, pH 7.2-7.6) was performed after the secondary and tertiary applications. The first primary antibody (position 1) was applied for 60 min followed by the secondary antibody application for 10 min and the application of the tertiary TSA-amplification reagent (PerkinElmer OPAL fluor) for 10 min. The primary and secondary antibodies were stripped with retrieval solution for 20 min before repeating the process with the second primary antibody (position 2) starting with a new application of 3% H2O2. The process was repeated for all 6 positions. Antibody position, clone and concentration are provided in Supplementary Table 1. Slides were stained with Spectral DAPI (Perkin Elmer) for 5 min, rinsed for 5 min, and coverslipped with Prolong Gold Antifade. OPAL Polymer HRP Mouse plus Rabbit (PerkinElmer) was used for all secondary applications. Slides were cured for 24 h at room temperature, then representative images from each slide were acquired on PerkinElmer Vectra 3.0 Automated Imaging System. Images were spectrally unmixed using PerkinElmer inForm software and exported as multi-image TIFF files and analyzed using HALO (Indica Labs). Two sections per tumor were sampled at 100%. Regions of interest were defined based on the tumor cell stain and cell morphology.
Flow cytometry
Mononuclear cell preparations were stained with the following fluorophore-conjugated monoclonal antibodies obtained from eBioscience: Lag3 (3DS223H), CD244 (eBioDM244), CD25 (BC96), CCR7 (3D12), CD45RO (UCHL1), Foxp3 (236A/E7), CD137 (4B4-1), CD62L (DREG-56), CD11b (1CRF44), HLA-DR (L243), Eomes (WD1928), and Tim-3 (F38-2E2); from BD Biosciences: T-bet (4B10), CD4 (RPA-T4), and PD-1 (M1H4); and from Biolegend: CD15 (SSEA-1), CD45RA (HI100), and CD160 (B755). For detection of transcription factors Foxp3, Eomes, and T-bet, cells were stained first for cell surface antigens and subsequently fixed and permeabilized using eBioscience fixation buffer. The number of positively stained cells was normalized to gram of tissue for enumeration.
TCRβ CDR3 amplification and sequencing
The DNeasy Blood and Tissue Kit (Qiagen) was used to extract genomic DNA from PBMC (n=7) and flash-frozen tumor specimens (n=9). Samples were treated with Proteinase K and RNAse and genomic DNA purified using the spin column method. High-throughput sequencing of the TCR V-beta CDR3 region (TRB) was performed at Fred Hutchinson Cancer Research Center using the hsTCRB kit (Adaptive Biotechnologies) and an Illumina HiSeq system (Illumina), a method that has been previously validated (31). Sequencing reads were analyzed using the ImmunoSEQ software (Adaptive Biotechnologies). TCR repertoire diversity was assessed using the clonality metric. Clonality score was derived from Shannon’s entropy, which measures the uncertainty associated with a random variable. In the case of CDR3 TCRβ sequences, Shannon’s entropy calculates the uncertainty in predicting a sequence from a large dataset of total CDR3 TCRβ sequences within a sample. To normalize between samples that contain different numbers of total CDR3 TCRβ sequencing reads, entropy was divided by log2 of the number of unique productive sequences. This method has been previously described (32) and used to obtain clonality, where clonality = 1 – (normalized entropy). Clonality values range from 0 (most diverse, every T-cell in a sample contains a unique TCR) to 1 (monoclonal T-cell population). The sequencing product was organized and nonproductive TCR sequences (premature stop or frame-shift) were excluded from the final analyses. TCR sequence data is publicly available (https://doi.org/10.21417/B7305D).
TLS quantification
R.H.P. evaluated 3 Nadj pancreas samples, 7 PNET, and 20 PDA tumors histologically for TLS using H&E and a large fraction (n=16) were further validated by CD20, DC-Lamp, and PNAd staining. Specimens underwent serial sectioning to cover >60 μm of tumor depth within each sample.
Gene expression analysis
Gene expression data were generated from RNA prepared from flash frozen tumor or Nadj pancreas and directly measured via counts of corresponding mRNA in each sample using nCounter PanCancer Immune Profiling Panel at the Fred Hutchinson Cancer Research Institute. The detection and counting of genes was done via reporter gene-specific nucleic acid probes appended with fluorophore barcodes and biotinylated capture probes that attach to microscopic beads (33). Gene expression was normalized to internal housekeeping genes and was analyzed using the nSolver software and the Advanced Analysis package (Nanostring). The Cancer Genome Atlas (TCGA) of pancreatic adenocarcinoma (https://gdc.cancer.gov/) was used to determine correlation between T-cell and myeloid genes.
Statistical analysis
Statistical analysis was performed using GraphPad software. The Student t test was used for comparison of 2-group data. For analysis of >2 group data, a one-way ANOVA and Tukey post-test was used for correcting for multiple comparisons. Pearson r was used to determine correlation significance. Data was expressed as mean ± SEM unless otherwise indicated and p<0.05 was considered significant. *, p<0.05; **, p<0.005; ***, p<0.0005.
RESULTS
Location and abundance of effector and regulatory T cells in PDA
The abundance and specificity of intratumoral T cells can have predictive value for solid tumor responses to immune checkpoint blockade (34), and may also provide insights into why such approaches have not shown clinical benefit in PDA. To investigate immune infiltrates in PDA, we obtained a fraction of tumor tissue from patients who had undergone surgery and who had not received neoadjuvant therapy (Supplementary Table 2). Our flow cytometric analyses revealed variable frequencies of endogenous CD8+ T cells, CD4+Foxp3- T cells and CD4+Foxp3+ regulatory T cells (Treg) despite normalization to CD45+ cells (Fig. 1A). Specifically, 54% (7/13) of tumors had high CD8+ T-cell frequencies (15-30% of CD45+ cells), whereas 46% (6/13) had <7% CD8+ T cells (mean ± SEM: 19.9 ± 4.2 and 5.2 ± 0.8, respectively, p<0.0001), consistent with the genetic studies revealing distinct patterns of numerical T-cell infiltration in this malignancy (20). Patients with <10% circulating CD8+ T cells typically also had a low percentage of tumoral CD8+ T cells; whereas those with >15% circulating CD8+ T cells tended to have a higher percentage of tumoral CD8+ T cells (Supplementary Fig. S1A). The number of CD4+ and CD8+ T cells in tumors was similar to that in Nadj pancreas (Fig. 1B), perhaps reflecting fibroinflammation commonly noted from resected specimens (Supplementary Fig. S1B). In contrast, Treg cell number was significantly elevated in tumors (Fig. 1A and 1B), which may be due to elevated Treg-specific chemokines and/or preferential tumoral Treg survival.
Variability in CD8+ T-cell accumulation in PDA was also observed by in situ staining (Fig. 1C), confirming the flow cytometric analyses. Notably, T cells were significantly enriched within CD20+ lymphoid aggregates morphologically consistent with a TLS (Fig. 1C-E and Supplementary Fig. S1). These aggregates contained specialized PNAd+ high endothelial venules (HEVs) (Fig. 1F), which are typically only found in lymph nodes and specialized lymphoid tissue including ectopic TLS, and facilitate lymphocyte migration (28, 35). TLS presence correlated with a greater CD8+ T-cell frequency in both tumors and circulation (Supplementary Fig. S1A). Similar to CD8+ T cells, Tregs were significantly enriched in lymphoid aggregates (Fig. 1C and E). A significantly higher CD8:Treg ratio in the stroma of TLS+ tumors compared to TLS- tumors was observed suggesting that these aggregates may positively influence antitumor immunity (Fig. 1G). Despite the small sample size, we observed a trend toward longer survival in those patients with tumoral TLS (median survival: TLS+, 755 days; TLS-, 478 days; Hazard ratio 0.15, 95% CI, 0.02-1.19, p=0.07). Foxp3 was significantly elevated in Tregs isolated from tumoral tissue compared to Tregs isolated from Nadj tissue as determined by flow cytometry (Fig. 1H), which may reflect antigen recognition by Tregs in tumors, as Foxp3 can be upregulated following TCR signaling (36). Treg numbers correlated with CD8+ T-cell abundance in tumors (Fig. 1I). The overall number of CD8+ T cells in tumor cell nests was ~2 logs lower than the number of pre-existing intratumoral CD8+ T cells found in the subset of melanoma patients likely to respond to PD-1 blockade (34), suggesting that one potential mechanism for resistance to checkpoint blockade may be a quantitatively insufficient response.
A study reported intratumoral TLS only in PDA patients who received a tumor cell vaccine 2 weeks prior to resection (29), whereas a subsequent study identified peritumoral or intratumoral TLS in all PDA samples examined (> 200), independent of vaccination, (30). We identified CD20+ lymphoid aggregates morphologically consistent with TLS in 64% (9/14) of PDAs that were located the tumor stroma, but not Nadj pancreas. Because we had only a fragment of the resected specimen, we could not identify the number of peritumoral TLS. TLS were infrequent in pancreatic neuroendocrine tumors (PNET), a rare and less lethal pancreatic cancer, (Supplementary Figs. 1C and D) and were also rare in PDAs from patients who received neoadjuvant treatment (1/6, Table 1). Dendritic cells (DCs) were restricted to PDA TLS, similar to lymphoid follicles in spleen (Supplementary Fig. S1E). Most B cells, which can be pro-tumorigenic in PDA (37-39), were located in TLS (Supplementary Fig. S1E and F). TLS were located in the tumor stroma, sand occasionally also found adjacent to tumor cell clusters (Supplementary Fig. S1G). Although the overall cellular composition was similar to lymphoid follicles (35), the T-cell and B-cell zones were less well defined in tumor-associated TLS, which may reflect tumor-derived factors that modify lymphoid mesenchymal cells (40).
Low frequency of T cells productively responding to antigens in tumor environment
The phenotype of T cells was next assessed to address potential tumor-reactivity and also the extent that inhibitory receptors are elevated on tumor-infiltrating T cells. Although most circulating T cells were naive (TN, CD45R0-CCR7+), most tumoral CD8+ T cells were antigen-experienced (CD45RO+CCR7- or CD45RO+CCR7+), independent of the presence or absence of TLS (Fig. 2B). Regarding markers of TCR signaling and activation (41, 42), expression of both 41BB and PD-1 was significantly elevated on tumor-infiltrating T cells compared to circulating T cells (Fig. 2C). A small subset of tumors contained a high percentage of CD8+ T cells that co-expressed 41BB and PD-1 (Fig. 2C). Lag-3 was also significantly elevated on tumor-infiltrating T cells compared to circulating T cells (Fig. 2C), and T cells that expressed PD-1 often also expressed Lag-3 (Fig. 2D and E). The inhibitory receptors Tim-3 and CD244 were not significantly different between tumroral and circulating CD8+ T cells (Fig. 2C). CD244 was significantly elevated on circulating CD8+ T cells from PDA patients compared to normal individuals (Fig. 2C and Supplementary Fig. S2). TLS presence did not correlate with either 41BB or PD-1 expression by tumoral T cells (Fig. 2F and G).
Figure 2.
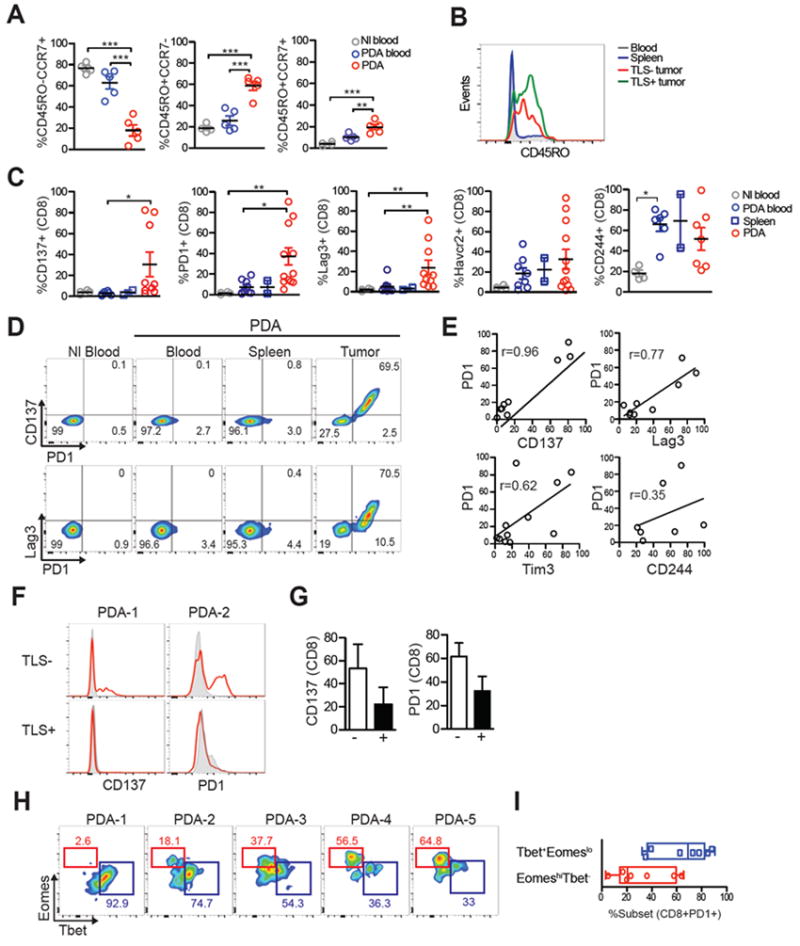
Activation marker and inhibitory receptor expression on tumor-infiltrating T cells. A, Naïve (CD45RO-CCR7+), effector memory (CD45RO+CCR7-) and central memory (CD45RO+CCR7+) CD8+ T-cell frequency in normal blood (Nl), circulation of PDA patients (PDA blood) and in tumors (PDA). Percentages were determined by flow cytometric analysis of CD8+ T cells. Each symbol represents an independent sample. B, Representative histogram of CD45RO on CD8+ T cells in blood, spleen and TLS- or TLS+ tumors. C, Percentage of CD8+ T-cell that express the indicated markers in normal blood (Nl blood), PDA patient blood (PDA blood), PDA patient spleens (PDA spleen) and tumors (PDA) was determined by flow cytometry. Each symbol represents an independent sample. D, Flow plots of CD8+ T cells from patient in which the majority CD8+ T cells expressed PD1 in tumors. E, CD8+PD1+ T cells in PDA co-express 41BB, Lag3 and to a lesser extent Tim3. F, Histogram overlay of 41BB and PD1 by CD8+ T cells isolated from TLS- or TLS+ tumor. G, Percentage of CD8+ T cells that express 41BB or PD1 in TLS- or TLS+ tumors. H, Flow plots demonstrating Eomes and T-bet expression by CD8+PD1+ T cells from 5 different tumors. I, Percentage of CD8+PD1+ T cells in PDA that are T-bethiEomeslo or T-betloEomeshi subset. Each dot represents an independent sample.
Functionally distinct subsets PD-1+ exhausted T cells can be identified by differential expression of the transcription factors Eomes and T-bet (43, 44). In the majority (5/7) of samples analyzed, CD8+PD-1+ T cells were predominantly T-bethiEomeslo (Fig. 2H and 2I), the subset that can proliferate in response to PD-1 blockade. Thus, the phenotype of most CD8+PD-1+ T cells is not consistent with having acquired a terminally exhausted state refractory to PD-1 blockade.
TCRβ CDR3 sequencing shows limited T cell clonal expansion
To address the extent that T cells had undergone clonal expansion, an indicator of antigen recognition, we performed deep sequencing of the complementary determining region 3 (CDR3) of the TCRβ chain in T cells from PDA patients. Because each T-cell expresses a unique rearranged TCRβ variable (V), diversity (D), and joining (J) region that comprise CDR3, deep sequencing of TCRβ CDR3 can molecularly barcode T-cell clonotypes in vivo to determine if T-cell infiltrates are comprised of many unique low frequency clones (polyclonal) and/or contain a few high frequency T-cell clones (oligoclonal) (31). The clonality metric measures T-cell diversity and is derived from the Shannon entropy of the specimen normalized to the log2 number of unique clones. Clonality ranges from 0 to 1, with 0 representing a purely polyclonal population and 1 representing a purely monoclonal population (31). One caveat of comparing clonality in tumor vs. blood is that areas of inflammation such as tumors attract and are preferentially enriched in CD45RO+ effector T cells (Fig. 2A) rather than naïve T cells, which will bias for less T-cell diversity (45) and therefore the appearance of enhanced clonality. However, we found that T-cell clonality was not significantly different between T cells in the highly polyclonal circulating population vs. the tumor (Fig. 3A, mean clonality PDA: 0.112 ± 0.03; mean clonality blood: 0.0721 ± 0.03) despite an increased number of total CDR3 templates in circulation (54,584 ± 25,458) compared to tumor (20,596 ± 8,628) and an 8-fold increase in unique CDR3 templates (clonotypes) in circulation compared to tumor (42,674 ± 21,059 vs. 5,687 ± 1125, Figs. 3B, 3C and Supplementary Table 3). T-cell clonality in PDA was 30% lower than T-cell clonality in colorectal cancer as determined by comparison with the public dataset (46).
Figure 3.
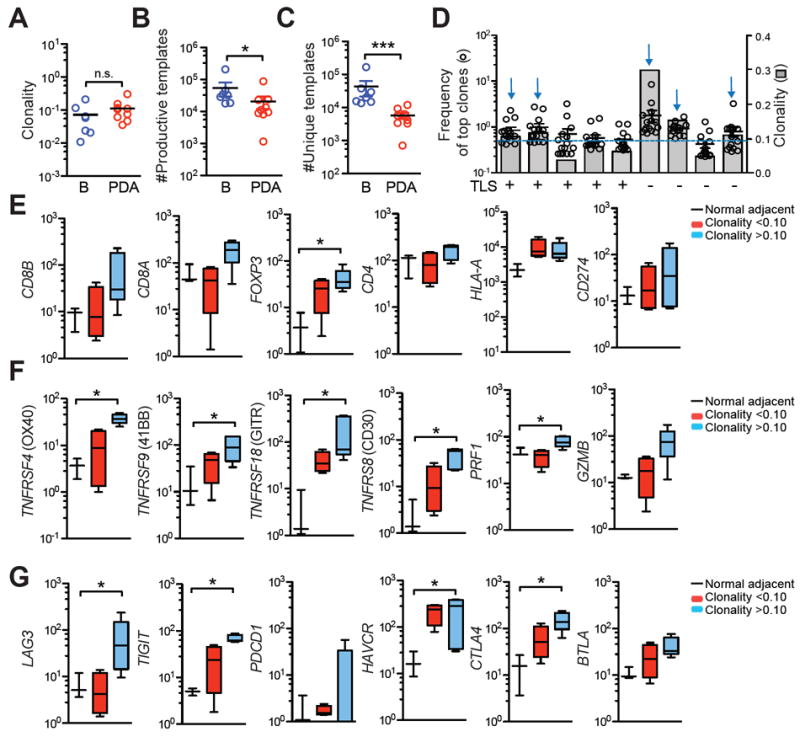
Deep-sequencing of TCRβ CDR3 and expression of T-cell activation and inhibitory genes in PDA. A, Clonality of T cells in blood (B) vs. PDA. B, Number of productive TCRβ CDR3 templates in blood (B) vs PDA. C, Number of productive unique TCRβ CDR3 templates in blood (B) vs. PDA. D, Frequency of the top 15 T-cell clones (○) and clonality scores (
 ) from 9 different tumors. Presence of TLS is shown. Dashed line represents a clonality score of 0.10; blue arrows, tumors with a clonality of >0.10. E-F, Gene expression in Nadj pancreas, tumors with clonality >0.10 (n=5) or <0.10 (n=4) was determined by Nanostring.
Since assessing the whole population might obscure limited expansion of a few T-cell clonotypes, we quantified the frequency of the top 15 T-cell clones across 9 different PDAs. Only 1 out of 9 tumors had a T-cell clone that represented > 5% of the T-cell population (Fig. 3D and Supplementary Table 3). The presence of TLS also did not correlate with increased T-cell clonality (Fig. 3D). To investigate if clonality correlated to T-cell activation gene signature, we segregated tumors based on clonality score of a clonality of 0.10, Fig. 3D, Supplementary Table 3). Tumors with >0.10 clonality showed a trend for increased CD4, CD8A, and CD8B T-cell transcripts and significant enrichment of FOXP3 transcripts (Fig. 3E). HLA-A and PD-L1 transcripts were not significantly different compared to Nadj (Fig. 3E). Tumors with clonality >0.10 contained significantly more transcripts for a variety of TCR signaling and effector genes that are expressed on recently activated but not resting T cells (Fig. 3F). Genes involved in T-cell inhibition, including LAG3, TIGIT, HAVCR3, and CTLA-4, were also significantly increased in tumors with a clonality score of >0.10 (Fig. 3G). These data are consistent with flow cytometric data that showed a subset of tumors contained some T cells that expressed markers indicative of recent antigen encounter (Fig. 2) and suggest that clonality score of >0.10 may provide a metric for identification of tumors that may contain a suppressed yet potentially tumor-reactive T-cell response.
Expression of antigen presentation molecules and inhibitory ligands
We next sought to determine the expression of antigen presentation molecules and inhibitory ligands that bind receptors elevated on tumor-infiltrating T cells in tumors. PDA tumor cells expressed moderate to high amounts of HLA that were significantly higher than normal ducts in Nadj pancreas and also significantly higher than PNET tumor cells (Fig. 4A and 4B). HLA-DR, which binds Lag-3 (47), was low (Figs. 4A and 4B). Galectin-3, another putative ligand for Lag-3 (48), and Galectin-9, which binds Tim-3 (49), were also highly expressed by both Nadj ducts and tumor cells in PDA, but not PNET (Fig. 4A and B). HLA staining intensity in tumor cells showed the greatest inter- and intratumoral heterogeneity (Fig. 4B) and did not correlate with CD8 T-cell abundance (Fig. 4C). Although we observed a trend for Galectin-3 and Galectin-9 expression to negatively correlate with CD8 T cells, these comparisons were not significant (Fig. 4C).
Inflammatory monocytes and granulocytes correlate with tumoral CD8+ T cells
Various suppressive immature myeloid subsets are elevated in genetically engineered mouse models of PDA (9, 11, 12, 50). Inflammatory monocytes have been reported to be elevated in human PDA and correlate with a poor prognosis (50). We found monocytes (CD45+CD11b+CD14+HLA-DRlow) to be significantly elevated in circulation but not the tumor of PDA patients (Fig. 5A and B). CD11b+CD15+CD33+ granulocyte frequency was quite variable in patients (Figs. 5C-5E). Tumors with a high CD8 T-cell infiltrate also contained elevated numbers of granulocytes and inflammatory monocytes (Fig. 5F); conversely, tumors with a low number of granulocytes had few CD8+ T cells (Fig. 5G). The neutrophil chemokines CXCL1 and IL8, and the chemokine receptor CXCR2, were enriched 3.3-fold, 2.7-fold and 7.5-fold, respectively, in tumors that had a clonality score of >0.10 compared to tumors with a clonality score of <0.10 (Fig. 5H). Gene expression analyses from the TCGA dataset of CD33 and CXCR2 myeloid markers also showed a positive correlation with CD8+ T cells (Fig. 5I). The correlation between CD8+ T cells and a neutrophil signature in human PDA was unexpected, because studies in mouse models suggest that granulocytes may play a role in excluding T-cell infiltration from PDA (8, 9, 11, 13), although the inability to map specific myeloid cell subsets from one species to the other may also explain these differences.
Figure 5.
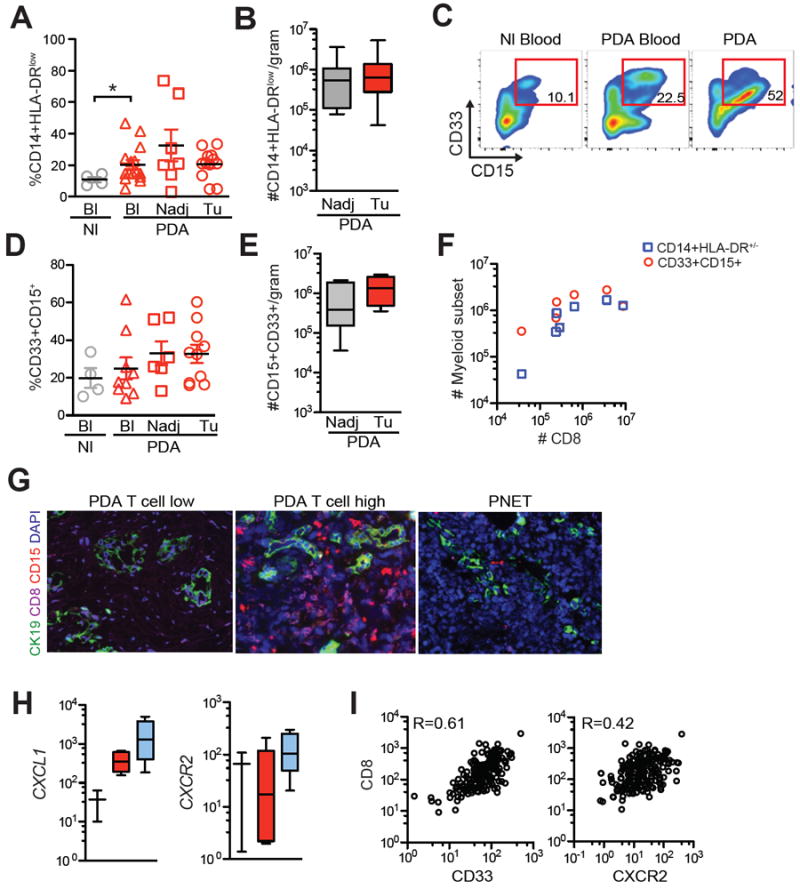
Spectrum of inflammatory monocyte and granulocyte accumulation in PDA and correlation with CD8+ T cells. A, CD14+HLA-DRlow monocyte frequency in circulation (Bl) of normal (Nl) individuals and in circulation (Bl), Nadj pancreas and tumors (Tu) from PDA patients. B, Number of CD14+HLA-DRlow in Nadj pancreas and PDA normalized to gram of tissue. C, Representative FACs plots of CD33+CD15+ granulocytes (gated on CD45+ cells) from a patient. D, CD11b+CD33+CD15+ granulocyte frequency in circulation (Bl) of normal (Nl) individuals and in circulation (Bl), Nadj pancreas and tumors (Tu) from patient samples. E, CD11b+CD33+CD15+ granulocyte number in Nadj pancreas and PDA normalized to gram of tissue. F, CD8+ T-cell number and myeloid subsets were determined by flow cytometric analysis. G, Multicolor immunofluorescence of CD8+ T cells, CD15+ granulocytes and cytokeratin (CK+) tumor cells in two PDAs that differ in the T-cell stromal infiltrate. Representative PNET sample is shown. Scale bar represents 25 μm. H, Expression of granulocyte genes in tumors that had a clonality score of >0.10 or <0.10. I, Analysis of TCGA dataset show a correlation between CD8 T-cell transcripts and genes involved in granulocyte trafficking in PDA.
Location and abundance of immune cells and PD-1/PD-L1 in PDA
Induction of PD-L1 by tumor-infiltrating T cells can, in part, explain tumor cell escape from endogenous immune antitumor responses (51, 52). To investigate PD-L1 expression, tumors from patients were stained by multiplexed IHC for tumor cells (pan-cytokeratin), CD8 T cells, PD-1, PD-L1, macrophages (CD163), and granulocytes (CD66b) and analyzed using HALO (Supplementary Figs. S3 and S4). Few cells expressed PD-L1 overall (3.9% ± 0.8% of total nucleated cells) and only a fraction of tumor cells (5.5% ± 1.1) and CD163+ macrophages (9.3% ± 3.6) expressed PD-L1 (Fig. 6A and B). PD-L1 was found in cell clusters adjacent to tumor epithelial cell nests and in lymphoid aggregates (Fig. 6A and 6C). As only a range (27-75%) of the PD-L1+ cells in the stroma co-expressed the macrophage marker CD163, an additional stromal cell subset(s), perhaps cancer-associated fibroblasts, were PD-L1+ (Fig. 6A and Supplementary Fig. S5). A trend for increased PD-1+ cell frequency in lymphoid aggregates compared to stroma and tumor nests was observed (Fig. 6C to E). PD-1+CD8- cells were also commonly identified in lymphoid structures, and may be CD4+ T cells (Fig. 6C). Consistent with the previous analysis (Fig. 1), CD8+ T cells were significantly enriched in lymphoid structures compared to tumor cell nests and stroma and CD8+ T-cell accumulation in tumor cell nests was not significantly different compared to stroma (Fig. 6E). A comparison among individual tumors revealed distinct subsets with regard to T-cell localization and accumulation: 2/10 tumors had a low overall CD8 T-cell infiltrate (<100 CD8 T cells per mm2); 2/10 tumors had significantly fewer T cells in tumor regions vs. stroma suggesting a mechanism of T-cell exclusion or stromal cell trapping as previously described (22-25); 5/10 tumors had between 100-1000 CD8 T cells per mm2 without a significant difference in tumor vs. stromal regions; and 1/10 tumors had >1000 CD8 T cells per mm2, relatively high for PDA (Figs. 6F and 6G). The tumor:T-cell ratio was also variable and ranged from 5.3 – 76.1 that corresponded to the potentially distinct immunological subtypes (Figs. 6G and H). CD8+ T-cell accumulation in PDA positively correlated with neutrophils, macrophages and PD-L1 expression in the tumor stroma (Fig. 6I), suggesting potential suppressive mechanisms. Thus, although analysis of additional samples will be necessary to formally define the relative frequencies of T-cell infiltration patterns in PDA, potential stratification of patient samples based on in situ staining of immune cells may highlight distinct mechanisms operative among pancreatic tumors that may contribute to immunotherapy resistance.
Figure 6.
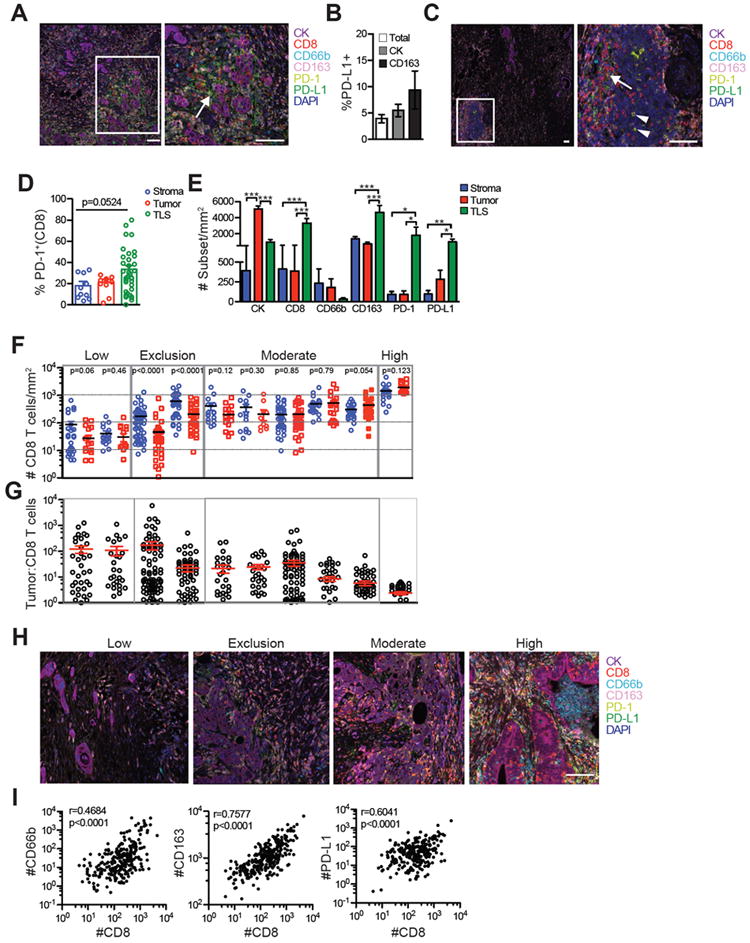
In situ staining of immune cells and PD-1/PD-L1 stratify patient samples based on the abundance and localization of the T-cell infiltrate. A, Representative staining of cells in PDA. Pan-cytokeratin (CK). Scale bars, 100 μm. Arrows, CD163+PD-L1+ cells. *, CK+PD-L1+ cells. B, Percentage of nucleated cells (total), tumor cells (CK) and CD163+ macrophages that express PD-L1. C, Representative TLS in PDA demonstrating CD8+PD-1+ cells (arrow), CD8-PD-1+ cells (arrowheads). Scale bar, 100 μm. D, Frequency of CD8+ cells that are PD-1+ in the indicated region. Each symbol is the average number of cells in each independent tumor sample. Each circle for TLS represents an independent TLS from 6 patient tumors. E, Number of the indicated cell subset in each compartment normalized to area was determined by averaging the means of independent tumor samples (n=10). F, Number of CD8+ T cells in stroma (blue) vs. tumor cell nests (red) in independent tumor samples. P-values are shown for the comparison of T cells in tumor vs. stroma. G, Tumor cell to T-cell ratio in individual tumors corresponding to tumors in 6F. Each circle is an independent region. H, Representative staining of patient tumors stratified from Fig. 6F. Scale bars, 100 μm. I, Correlation between CD8+ T-cell infiltration and neutrophils, macrophages and PD-L1 in PDA. Each dot is the number of cells normalized to area in an independent region.
DISCUSSION
T-cell infiltrates have been interrogated for biomarkers of immunotherapy response in a variety of solid tumors (34, 53-55). The location, abundance, and characteristics of CD8+ T cells in PDA have not been fully elucidated. Some studies indicate T cells are rare in PDA (23) and others indicate T cells are excluded from tumor cell nests (24, 25). Still other studies suggest that T cells are the dominant immune cell in PDA (15, 26) and ~25% of PDAs have been classified as an immunogenic subset, with higher expression of immune related genes based on genomic profiling (20). We demonstrate that T-cell abundance in a large fraction of PDA patients is orders of magnitude lower than in melanoma patients who respond to PD1 blockade (34). We also demonstrate interpatient variability in both the magnitude and location of infiltrating CD8 T cells. In a subset of patients, T cells were highly enriched in stroma compared to tumor epithelium, consistent with reports of endogenous T-cell exclusion from tumor epithelium in mouse models (10-12, 19, 27) and previous studies in human PDA (22-25). In another fraction, T cells are extremely rare in both the stroma and tumor epithelium suggesting an alternative mechanism that is interfering with T-cell recruitment and/or retention. Only a minor fraction of tumors showed relatively high numbers of T cells in stroma and tumor epithelium. Thus, evaluation of genetic datasets for T-cell signature genes may identify patient subsets with an ongoing anti-cancer immune response. However, based on our study, such analyses could also identify tumors that contain TLS, highlighting the limitations of using whole tissue gene expression analyses to characterize T-cell infiltrates in tumors.
We show that T-cell clonality in PDA was not significantly different in tumors compared to the circulation, despite the fact that the TME is highly enriched for effector and memory cells, which have a more limited clonally-expanded repertoire than naïve T cells (45). T-cell clonality was also lower in PDA compared to previous studies in colorectal cancer (46) and melanoma samples that respond to checkpoint blockade (34). The minimal T-cell clonal expansion in PDA was consistent with analysis of T-cell phenotypes, which showed that most tumors contained a high frequency of T cells that did not express markers associated with recent and productive TCR signaling, such as PD-1. Neoantigens can drive endogenous anticancer immunity (3-5) and clonal expansion at tumor sites, and the observed reduced clonality is consistent with the relative paucity of coding mutations in PDA (6). Alternatively, the TME may play an important role as anti-CD40 (56), local irradiation (57), CXCR2 antagonists (13), TCRγδ cell blockade (15), or focal adhesion kinase inhibition (14) in mouse models can render a subset of animals susceptible to checkpoint blockade. Thus, modulating the suppressive TME may enhance T-cell priming and be necessary for activity of immune checkpoint blockade in the subset of patients with preexisting tumoral immunity.
We found a positive correlation between granulocyte infiltration and CD8+ T-cell accumulation in human PDA, as well as high variability in granulocyte number among patient samples. We have shown that both inflammatory monocytes (likely precursors to tumor-associated macrophages and DCs) and granulocytes suppress endogenous T-cell infiltration and priming in autochthonous PDA (11), consistent with another study that showed granulocytes can promote metastasis formation and inhibit the activity of immune checkpoint blockade in a subset of animals (13). Tregs, CD163+ macrophages, and PD-L1+ cells significantly correlated with CD8+ T-cell accumulation and localization, elucidating potential mechanisms of adaptive immune resistance. However, PD-L1+ cells were quite rare in PDA overall, and additional inhibitory receptors were elevated on tumoral CD8+ T cells, both of which could lead to the observed lack of efficacy of PD-1/PD-L1 blockade in PDA patients. Galectin-3 and galectin-9 were expressed in both ductal cells in Nadj pancreatic tissue and tumor cells. Thus, many of these ligands may be expressed naturally in tumor cells as a reflection of cell origin, rather than the inflammatory microenvironment.
Both our cellular and molecular analyses of T cells in PDA suggest the presence of potentially tumor-reactive T cells in a subset of individuals. We detected cells expressing both 41BB, which is expressed on recently activated T cells (41), and PD-1, which is expressed on recently activated T as well as on T cells undergoing chronic antigen stimulation. We also found significantly elevated levels of the early activation marker CD69 on T cells in tumors vs. blood (data not shown). However, CD69 does not necessarily indicate TCR signaling, because it is also expressed on tissue-resident memory T cells (58). Thus, the fact that most tumoral CD8+PD-1+ T cells also expressed 41BB, and T cells in circulation mostly lacked expression of both PD-1 and 41BB, suggests at least a fraction of T cells in PDA have recently encountered antigens at the tumor site. Tumoral PD-1+41BB+ T cells co-expressed additional inhibitory receptors, including Lag-3 and Tim-3, and the ligands to these receptors were expressed in tumors. We previously observed in an autochthonous mouse model of PDA that adoptively transferred mesothelin-specific TCR-engineered T cells also progressively expressed a similar pattern of inhibitory receptors including PD-1, Tim-3, Lag-3, and CD244 (19). These results suggest that a subset of patients should be identifiable from biopsy specimens and should undergo further investigation for the presence of potentially tumor-reactive T cells, as they might benefit from immunotherapeutic strategies that interfere with inhibitory pathways.
Persistent T-cell receptor (TCR) signaling can produce terminal differentiation and exhaustion of T cells that become refractory to the effects of PD-1 inhibition (16). Studies of CD8+PD-1+ T cells during chronic viral infection have identified two subsets of exhausted PD-1+ T cells that can be distinguished by expression of transcription factors Eomes and T-bet (43, 44). T-bethi cells have a low intrinsic turnover rate but do proliferate in response to persisting antigen and can produce Eomeshi terminal progeny, which have cytolytic activity, but limited proliferative capacity and thus do not expand in response to PD-1 blockade (43). Although interpatient variability was observed in our study, most PD-1+ T cells were not driven toward the terminally exhausted subset, raising the possibility that the highly suppressive TME in PDA may prevent chronic TCR signaling and terminal exhaustion. This is a noteworthy distinction from many other solid tumors, and warrants further investigation of the mechanisms that render tumor-reactive T cells unresponsive in PDA. This also further suggests that if the TME were appropriately modulated to induce the activation and expansion of T cells in PDA, chronic TCR signaling may be the next formidable obstacle to overcome to achieve durable responses with immunotherapies, particularly, as we show here, that a lack of MHC I expression by tumor cells is not the primary obstacle to efficacy.
TLS are present in most human solid tumors and are often associated with a positive prognosis (28), presumably by orchestrating adaptive anticancer immunity. The origin of TLS in human PDA has been controversial, however. One study reported intratumoral TLS only in patients who received a tumor cell vaccine (29) whereas a subsequent study identified peritumoral and/or intratumoral TLS independent of vaccination, with only intratumoral TLS correlating with longer survival (30). TLS in our study were localized within the tumor stroma. Because we did not have the entire resected tumor for analyses, quantification of peritumoral TLS was not possible. TLS are more rare in mouse tumor models employing implantable, rapidly progressing tumor cell lines, although they have been reported to be commonly found in the lentiviral-induced KrasG12D mutation-driven, p53 null lung cancer model that expresses ovalbumin (59). In that study, Tregs were also enriched in TLS and Treg abrogation permitted CD8+ T-cell expansion in TLS and tumors (59). B cells also have been suggested to have a tumor-promoting role in PDA (37-39), and we have now shown that TLS are the primary site of B cell as well as Treg accumulation in PDA. As we found that PD-1+ cells and PD-L1+ cells are enriched in TLS, further investigation into the impact of Tregs and B cells on antigen-driven T-cell responses may be warranted.
In summary, our study reveals major obstacles to achieving clinical benefit with immunotherapy in PDA. We show that the naturally occurring T-cell response in resected PDA is limited in quantity and quality, with negligible localization to sites of tumor cells in most patients. Although we demonstrate a spectrum of T-cell infiltration and activation in PDA that is suggestive of suboptimal initiation of a tumor-reactive T-cell response, clonal expansion of T cells is minimal. However, chronic TCR signaling and terminal exhaustion do not appear to be the primary obstacles to efficacy. The lack of markers of TCR signaling on most T cells and marginal clonal expansion could reflect a predominance of nonspecific, bystander effector T cells that infiltrated tumors due to elevated proinflammatory chemokines. Alternatively, the TME may suppress TCR signaling and clonal expansion producing a lack of clonality as well as limited 41BB and PD-1 expression. Taken together, these data suggest a subset of identifiable PDA patients may benefit from immunotherapies designed to enhance a preexisting T-cell response. However, the low magnitude and marginal oligoclonal expansion of naturally occurring T cells, even in those tumors with evidence suggestive of T-cell recognition of tumor antigens, implies this may still be challenging with currently available reagents. Overall, our findings do provide support for pursuit of therapies in which engineered or induced tumor-specificity can be combined with modulation of the tumor microenvironment.
Supplementary Material
Acknowledgments
We thank Ashley Dotson, Markus Carlson, Kathleen DelGiorno, Libing Feng, Yen Ho and Joseph Ryan for technical assistance processing human tissue; Megan Larmore and Brian Johnson for histology and immunohistochemistry services at the University of Washington, Seattle, WA;Kimberly S. Smythe for technical assistance with multiplex development and HALO image analysis software; and Deborah Banker and Shelley Thorsen for manuscript review. This work was supported by an Irvington Institute Fellowship Program of the Cancer Research Institute (to I.M.S), Swim Across America (to I.M.S.), the Jack and Sylvia Paul Estate Fund to Support Collaborative Immunotherapy Research (to I.M.S.), the Giles W. and Elise G. Mead Foundation (to S.R.H.), NIH National Cancer Institute (CA018029 and CA033084 (to P.D.G.), CA161112 (to S.R.H.) and a P30CA015704 Supplement (S.R.H. and P.D.G.)), Pancreatic Cancer Action Network (16-65-GREE to P.D.G.) and a research agreement with Juno Therapeutics (to P.D.G.). The content is solely the responsibility of the authors and does not necessarily represent the official views of the National Institutes of Health.
Footnotes
Author Contributions
I.M.S. conceptualized and designed the study, performed experiments, interpreted the data, and wrote the manuscript. A.H. performed experiments including the deep-sequencing of TCRs from patient tissue. R.H.P. supervised the pathological analysis and developed the multiplex. P.D.G. and S.R.H conceptualized the study, interpreted the data, and wrote the manuscript.
Conflicts of Interest: P.D.G. has ownership interest and patents in and is a scientific consultant/advisory board member for Juno Therapeutics.
The authors declare no potential conflicts of interest.
References
- 1.Royal RE, Levy C, Turner K, Mathur A, Hughes M, Kammula US, et al. Phase 2 trial of single agent Ipilimumab (anti-CTLA-4) for locally advanced or metastatic pancreatic adenocarcinoma. J Immunother. 2010;33:828–33. doi: 10.1097/CJI.0b013e3181eec14c. [DOI] [PMC free article] [PubMed] [Google Scholar]
- 2.Brahmer JR, Tykodi SS, Chow LQ, Hwu WJ, Topalian SL, Hwu P, et al. Safety and activity of anti-PD-L1 antibody in patients with advanced cancer. N Engl J Med. 2012;366:2455–65. doi: 10.1056/NEJMoa1200694. [DOI] [PMC free article] [PubMed] [Google Scholar]
- 3.Snyder A, Makarov V, Merghoub T, Yuan J, Zaretsky JM, Desrichard A, et al. Genetic basis for clinical response to CTLA-4 blockade in melanoma. N Engl J Med. 2014;371:2189–99. doi: 10.1056/NEJMoa1406498. [DOI] [PMC free article] [PubMed] [Google Scholar]
- 4.Le DT, Uram JN, Wang H, Bartlett BR, Kemberling H, Eyring AD, et al. PD-1 Blockade in Tumors with Mismatch-Repair Deficiency. N Engl J Med. 2015;372:2509–20. doi: 10.1056/NEJMoa1500596. [DOI] [PMC free article] [PubMed] [Google Scholar]
- 5.Rizvi NA, Hellmann MD, Snyder A, Kvistborg P, Makarov V, Havel JJ, et al. Cancer immunology. Mutational landscape determines sensitivity to PD-1 blockade in non-small cell lung cancer. Science. 2015;348:124–8. doi: 10.1126/science.aaa1348. [DOI] [PMC free article] [PubMed] [Google Scholar]
- 6.Lawrence MS, Stojanov P, Polak P, Kryukov GV, Cibulskis K, Sivachenko A, et al. Mutational heterogeneity in cancer and the search for new cancer-associated genes. Nature. 2013;499:214–8. doi: 10.1038/nature12213. [DOI] [PMC free article] [PubMed] [Google Scholar]
- 7.Clark CE, Hingorani SR, Mick R, Combs C, Tuveson DA, Vonderheide RH. Dynamics of the immune reaction to pancreatic cancer from inception to invasion. Cancer Res. 2007;67:9518–27. doi: 10.1158/0008-5472.CAN-07-0175. [DOI] [PubMed] [Google Scholar]
- 8.Bayne LJ, Beatty GL, Jhala N, Clark CE, Rhim AD, Stanger BZ, et al. Tumor-derived granulocyte-macrophage colony-stimulating factor regulates myeloid inflammation and T cell immunity in pancreatic cancer. Cancer Cell. 2012;21:822–35. doi: 10.1016/j.ccr.2012.04.025. [DOI] [PMC free article] [PubMed] [Google Scholar]
- 9.Pylayeva-Gupta Y, Lee KE, Hajdu CH, Miller G, Bar-Sagi D. Oncogenic Kras-induced GM-CSF production promotes the development of pancreatic neoplasia. Cancer Cell. 2012;21:836–47. doi: 10.1016/j.ccr.2012.04.024. [DOI] [PMC free article] [PubMed] [Google Scholar]
- 10.Feig C, Jones JO, Kraman M, Wells RJ, Deonarine A, Chan DS, et al. Targeting CXCL12 from FAP-expressing carcinoma-associated fibroblasts synergizes with anti-PD-L1 immunotherapy in pancreatic cancer. Proc Natl Acad Sci U S A. 2013;110:20212–7. doi: 10.1073/pnas.1320318110. [DOI] [PMC free article] [PubMed] [Google Scholar]
- 11.Stromnes IM, Brockenbrough JS, Izeradjene K, Carlson MA, Cuevas C, Simmons RM, et al. Targeted depletion of an MDSC subset unmasks pancreatic ductal adenocarcinoma to adaptive immunity. Gut. 2014;63:1769–81. doi: 10.1136/gutjnl-2013-306271. [DOI] [PMC free article] [PubMed] [Google Scholar]
- 12.Beatty GL, Winograd R, Evans RA, Long KB, Luque SL, Lee JW, et al. Exclusion of T Cells From Pancreatic Carcinomas in Mice Is Regulated by Ly6C(low) F4/80(+) Extratumoral Macrophages. Gastroenterology. 2015;149:201–10. doi: 10.1053/j.gastro.2015.04.010. [DOI] [PMC free article] [PubMed] [Google Scholar]
- 13.Steele CW, Karim SA, Leach JD, Bailey P, Upstill-Goddard R, Rishi L, et al. CXCR2 Inhibition Profoundly Suppresses Metastases and Augments Immunotherapy in Pancreatic Ductal Adenocarcinoma. Cancer Cell. 2016;29:832–45. doi: 10.1016/j.ccell.2016.04.014. [DOI] [PMC free article] [PubMed] [Google Scholar]
- 14.Jiang H, Hegde S, Knolhoff BL, Zhu Y, Herndon JM, Meyer MA, et al. Targeting focal adhesion kinase renders pancreatic cancers responsive to checkpoint immunotherapy. Nat Med. 2016 doi: 10.1038/nm.4123. [DOI] [PMC free article] [PubMed] [Google Scholar]
- 15.Daley D, Zambirinis CP, Seifert L, Akkad N, Mohan N, Werba G, et al. gammadelta T Cells Support Pancreatic Oncogenesis by Restraining alphabeta T Cell Activation. Cell. 2016;166:1485–99 e15. doi: 10.1016/j.cell.2016.07.046. [DOI] [PMC free article] [PubMed] [Google Scholar]
- 16.Wherry EJ, Blattman JN, Murali-Krishna K, van der Most R, Ahmed R. Viral persistence alters CD8 T-cell immunodominance and tissue distribution and results in distinct stages of functional impairment. J Virol. 2003;77:4911–27. doi: 10.1128/JVI.77.8.4911-4927.2003. [DOI] [PMC free article] [PubMed] [Google Scholar]
- 17.Blackburn SD, Shin H, Haining WN, Zou T, Workman CJ, Polley A, et al. Coregulation of CD8+ T cell exhaustion by multiple inhibitory receptors during chronic viral infection. Nat Immunol. 2009;10:29–37. doi: 10.1038/ni.1679. [DOI] [PMC free article] [PubMed] [Google Scholar]
- 18.Schietinger A, Philip M, Krisnawan VE, Chiu EY, Delrow JJ, Basom RS, et al. Tumor-Specific T Cell Dysfunction Is a Dynamic Antigen-Driven Differentiation Program Initiated Early during Tumorigenesis. Immunity. 2016;45:389–401. doi: 10.1016/j.immuni.2016.07.011. [DOI] [PMC free article] [PubMed] [Google Scholar]
- 19.Stromnes IM, Schmitt TM, Hulbert A, Brockenbrough JS, Nguyen HN, Cuevas C, et al. T Cells Engineered against a Native Antigen Can Surmount Immunologic and Physical Barriers to Treat Pancreatic Ductal Adenocarcinoma. Cancer Cell. 2015;28:638–52. doi: 10.1016/j.ccell.2015.09.022. [DOI] [PMC free article] [PubMed] [Google Scholar]
- 20.Bailey P, Chang DK, Nones K, Johns AL, Patch AM, Gingras MC, et al. Genomic analyses identify molecular subtypes of pancreatic cancer. Nature. 2016;531:47–52. doi: 10.1038/nature16965. [DOI] [PubMed] [Google Scholar]
- 21.Balli D, Rech AJ, Stanger BZ, Vonderheide RH. Immune Cytolytic Activity Stratifies Molecular Subsets of Human Pancreatic Cancer. Clin Cancer Res. 2017;23:3129–38. doi: 10.1158/1078-0432.CCR-16-2128. [DOI] [PubMed] [Google Scholar]
- 22.Emmrich J, Weber I, Nausch M, Sparmann G, Koch K, Seyfarth M, et al. Immunohistochemical characterization of the pancreatic cellular infiltrate in normal pancreas, chronic pancreatitis and pancreatic carcinoma. Digestion. 1998;59:192–8. doi: 10.1159/000007488. [DOI] [PubMed] [Google Scholar]
- 23.von Bernstorff W, Voss M, Freichel S, Schmid A, Vogel I, Johnk C, et al. Systemic and local immunosuppression in pancreatic cancer patients. Clin Cancer Res. 2001;7:925s–32s. [PubMed] [Google Scholar]
- 24.Ene-Obong A, Clear AJ, Watt J, Wang J, Fatah R, Riches JC, et al. Activated pancreatic stellate cells sequester CD8+ T cells to reduce their infiltration of the juxtatumoral compartment of pancreatic ductal adenocarcinoma. Gastroenterology. 2013;145:1121–32. doi: 10.1053/j.gastro.2013.07.025. [DOI] [PMC free article] [PubMed] [Google Scholar]
- 25.Hartmann N, Giese NA, Giese T, Poschke I, Offringa R, Werner J, et al. Prevailing role of contact guidance in intrastromal T-cell trapping in human pancreatic cancer. Clin Cancer Res. 2014;20:3422–33. doi: 10.1158/1078-0432.CCR-13-2972. [DOI] [PubMed] [Google Scholar]
- 26.Shibuya KC, Goel VK, Xiong W, Sham JG, Pollack SM, Leahy AM, et al. Pancreatic ductal adenocarcinoma contains an effector and regulatory immune cell infiltrate that is altered by multimodal neoadjuvant treatment. PLoS One. 2014;9:e96565. doi: 10.1371/journal.pone.0096565. [DOI] [PMC free article] [PubMed] [Google Scholar]
- 27.Beatty GL, Chiorean EG, Fishman MP, Saboury B, Teitelbaum UR, Sun W, et al. CD40 agonists alter tumor stroma and show efficacy against pancreatic carcinoma in mice and humans. Science. 2011;331:1612–6. doi: 10.1126/science.1198443. [DOI] [PMC free article] [PubMed] [Google Scholar]
- 28.Sautes-Fridman C, Lawand M, Giraldo NA, Kaplon H, Germain C, Fridman WH, et al. Tertiary Lymphoid Structures in Cancers: Prognostic Value, Regulation, and Manipulation for Therapeutic Intervention. Front Immunol. 2016;7:407. doi: 10.3389/fimmu.2016.00407. [DOI] [PMC free article] [PubMed] [Google Scholar]
- 29.Lutz ER, Wu AA, Bigelow E, Sharma R, Mo G, Soares K, et al. Immunotherapy converts nonimmunogenic pancreatic tumors into immunogenic foci of immune regulation. Cancer immunology research. 2014;2:616–31. doi: 10.1158/2326-6066.CIR-14-0027. [DOI] [PMC free article] [PubMed] [Google Scholar]
- 30.Hiraoka N, Ino Y, Yamazaki-Itoh R, Kanai Y, Kosuge T, Shimada K. Intratumoral tertiary lymphoid organ is a favourable prognosticator in patients with pancreatic cancer. Br J Cancer. 2015;112:1782–90. doi: 10.1038/bjc.2015.145. [DOI] [PMC free article] [PubMed] [Google Scholar]
- 31.Robins HS, Campregher PV, Srivastava SK, Wacher A, Turtle CJ, Kahsai O, et al. Comprehensive assessment of T-cell receptor beta-chain diversity in alphabeta T cells. Blood. 2009;114:4099–107. doi: 10.1182/blood-2009-04-217604. [DOI] [PMC free article] [PubMed] [Google Scholar]
- 32.Kanakry CG, Coffey DG, Towlerton AM, Vulic A, Storer BE, Chou J, et al. Origin and evolution of the T cell repertoire after posttransplantation cyclophosphamide. JCI insight. 2016;1 doi: 10.1172/jci.insight.86252. [DOI] [PMC free article] [PubMed] [Google Scholar]
- 33.Cesano A. nCounter((R)) PanCancer Immune Profiling Panel (NanoString Technologies, Inc., Seattle, WA) Journal for immunotherapy of cancer. 2015;3:42. doi: 10.1186/s40425-015-0088-7. [DOI] [PMC free article] [PubMed] [Google Scholar]
- 34.Tumeh PC, Harview CL, Yearley JH, Shintaku IP, Taylor EJ, Robert L, et al. PD-1 blockade induces responses by inhibiting adaptive immune resistance. Nature. 2014;515:568–71. doi: 10.1038/nature13954. [DOI] [PMC free article] [PubMed] [Google Scholar]
- 35.Randall TD, Carragher DM, Rangel-Moreno J. Development of secondary lymphoid organs. Annu Rev Immunol. 2008;26:627–50. doi: 10.1146/annurev.immunol.26.021607.090257. [DOI] [PMC free article] [PubMed] [Google Scholar]
- 36.Preston CC, Maurer MJ, Oberg AL, Visscher DW, Kalli KR, Hartmann LC, et al. The ratios of CD8+ T cells to CD4+CD25+ FOXP3+ and FOXP3- T cells correlate with poor clinical outcome in human serous ovarian cancer. PLoS One. 2013;8:e80063. doi: 10.1371/journal.pone.0080063. [DOI] [PMC free article] [PubMed] [Google Scholar]
- 37.Gunderson AJ, Kaneda MM, Tsujikawa T, Nguyen AV, Affara NI, Ruffell B, et al. Bruton’s Tyrosine Kinase (BTK)-dependent immune cell crosstalk drives pancreas cancer. Cancer discovery. 2015 doi: 10.1158/2159-8290.CD-15-0827. [DOI] [PMC free article] [PubMed] [Google Scholar]
- 38.Lee KE, Spata M, Bayne LJ, Buza EL, Durham AC, Allman D, et al. Hif1a Deletion Reveals Pro-Neoplastic Function of B Cells in Pancreatic Neoplasia. Cancer discovery. 2016;6:256–69. doi: 10.1158/2159-8290.CD-15-0822. [DOI] [PMC free article] [PubMed] [Google Scholar]
- 39.Pylayeva-Gupta Y, Das S, Handler JS, Hajdu CH, Coffre M, Koralov SB, et al. IL35-Producing B Cells Promote the Development of Pancreatic Neoplasia. Cancer discovery. 2016;6:247–55. doi: 10.1158/2159-8290.CD-15-0843. [DOI] [PMC free article] [PubMed] [Google Scholar]
- 40.Riedel A, Shorthouse D, Haas L, Hall BA, Shields J. Tumor-induced stromal reprogramming drives lymph node transformation. Nat Immunol. 2016 doi: 10.1038/ni.3492. [DOI] [PMC free article] [PubMed] [Google Scholar]
- 41.Wolfl M, Kuball J, Ho WY, Nguyen H, Manley TJ, Bleakley M, et al. Activation-induced expression of CD137 permits detection, isolation, and expansion of the full repertoire of CD8+ T cells responding to antigen without requiring knowledge of epitope specificities. Blood. 2007;110:201–10. doi: 10.1182/blood-2006-11-056168. [DOI] [PMC free article] [PubMed] [Google Scholar]
- 42.Gros A, Robbins PF, Yao X, Li YF, Turcotte S, Tran E, et al. PD-1 identifies the patient-specific CD8(+) tumor-reactive repertoire infiltrating human tumors. J Clin Invest. 2014;124:2246–59. doi: 10.1172/JCI73639. [DOI] [PMC free article] [PubMed] [Google Scholar]
- 43.Paley MA, Kroy DC, Odorizzi PM, Johnnidis JB, Dolfi DV, Barnett BE, et al. Progenitor and terminal subsets of CD8+ T cells cooperate to contain chronic viral infection. Science. 2012;338:1220–5. doi: 10.1126/science.1229620. [DOI] [PMC free article] [PubMed] [Google Scholar]
- 44.Odorizzi PM, Pauken KE, Paley MA, Sharpe A, Wherry EJ. Genetic absence of PD-1 promotes accumulation of terminally differentiated exhausted CD8+ T cells. J Exp Med. 2015;212:1125–37. doi: 10.1084/jem.20142237. [DOI] [PMC free article] [PubMed] [Google Scholar]
- 45.Robins HS, Srivastava SK, Campregher PV, Turtle CJ, Andriesen J, Riddell SR, et al. Overlap and effective size of the human CD8+ T cell receptor repertoire. Sci Transl Med. 2010;2:47ra64. doi: 10.1126/scitranslmed.3001442. [DOI] [PMC free article] [PubMed] [Google Scholar]
- 46.Sherwood AM, Emerson RO, Scherer D, Habermann N, Buck K, Staffa J, et al. Tumor-infiltrating lymphocytes in colorectal tumors display a diversity of T cell receptor sequences that differ from the T cells in adjacent mucosal tissue. Cancer Immunol Immunother. 2013;62:1453–61. doi: 10.1007/s00262-013-1446-2. [DOI] [PMC free article] [PubMed] [Google Scholar]
- 47.Huard B, Tournier M, Hercend T, Triebel F, Faure F. Lymphocyte-activation gene 3/major histocompatibility complex class II interaction modulates the antigenic response of CD4+ T lymphocytes. Eur J Immunol. 1994;24:3216–21. doi: 10.1002/eji.1830241246. [DOI] [PubMed] [Google Scholar]
- 48.Kouo T, Huang L, Pucsek AB, Cao M, Solt S, Armstrong T, et al. Galectin-3 Shapes Antitumor Immune Responses by Suppressing CD8+ T Cells via LAG-3 and Inhibiting Expansion of Plasmacytoid Dendritic Cells. Cancer immunology research. 2015;3:412–23. doi: 10.1158/2326-6066.CIR-14-0150. [DOI] [PMC free article] [PubMed] [Google Scholar]
- 49.Zhu C, Anderson AC, Schubart A, Xiong H, Imitola J, Khoury SJ, et al. The Tim-3 ligand galectin-9 negatively regulates T helper type 1 immunity. Nat Immunol. 2005;6:1245–52. doi: 10.1038/ni1271. [DOI] [PubMed] [Google Scholar]
- 50.Sanford DE, Belt BA, Panni RZ, Mayer A, Deshpande AD, Carpenter D, et al. Inflammatory monocyte mobilization decreases patient survival in pancreatic cancer: a role for targeting the CCL2/CCR2 axis. Clin Cancer Res. 2013;19:3404–15. doi: 10.1158/1078-0432.CCR-13-0525. [DOI] [PMC free article] [PubMed] [Google Scholar]
- 51.Taube JM, Anders RA, Young GD, Xu H, Sharma R, McMiller TL, et al. Colocalization of inflammatory response with B7-h1 expression in human melanocytic lesions supports an adaptive resistance mechanism of immune escape. Sci Transl Med. 2012;4:127ra37. doi: 10.1126/scitranslmed.3003689. [DOI] [PMC free article] [PubMed] [Google Scholar]
- 52.Spranger S, Spaapen RM, Zha Y, Williams J, Meng Y, Ha TT, et al. Up-regulation of PD-L1, IDO, and T(regs) in the melanoma tumor microenvironment is driven by CD8(+) T cells. Sci Transl Med. 2013;5:200ra116. doi: 10.1126/scitranslmed.3006504. [DOI] [PMC free article] [PubMed] [Google Scholar]
- 53.Robert L, Tsoi J, Wang X, Emerson R, Homet B, Chodon T, et al. CTLA4 blockade broadens the peripheral T-cell receptor repertoire. Clin Cancer Res. 2014;20:2424–32. doi: 10.1158/1078-0432.CCR-13-2648. [DOI] [PMC free article] [PubMed] [Google Scholar]
- 54.Page DB, Yuan J, Redmond D, Wen YH, Durack JC, Emerson R, et al. Deep Sequencing of T-cell Receptor DNA as a Biomarker of Clonally Expanded TILs in Breast Cancer after Immunotherapy. Cancer immunology research. 2016;4:835–44. doi: 10.1158/2326-6066.CIR-16-0013. [DOI] [PMC free article] [PubMed] [Google Scholar]
- 55.Wallin JJ, Bendell JC, Funke R, Sznol M, Korski K, Jones S, et al. Atezolizumab in combination with bevacizumab enhances antigen-specific T-cell migration in metastatic renal cell carcinoma. Nat Commun. 2016;7:12624. doi: 10.1038/ncomms12624. [DOI] [PMC free article] [PubMed] [Google Scholar]
- 56.Winograd R, Byrne KT, Evans RA, Odorizzi PM, Meyer AR, Bajor DL, et al. Induction of T cell immunity overcomes complete resistance to PD-1 and CTLA-4 blockade and improves survival in pancreatic carcinoma. Cancer immunology research. 2015 doi: 10.1158/2326-6066.CIR-14-0215. [DOI] [PMC free article] [PubMed] [Google Scholar]
- 57.Twyman-Saint Victor C, Rech AJ, Maity A, Rengan R, Pauken KE, Stelekati E, et al. Radiation and dual checkpoint blockade activate non-redundant immune mechanisms in cancer. Nature. 2015;520:373–7. doi: 10.1038/nature14292. [DOI] [PMC free article] [PubMed] [Google Scholar]
- 58.Park CO, Kupper TS. The emerging role of resident memory T cells in protective immunity and inflammatory disease. Nat Med. 2015;21:688–97. doi: 10.1038/nm.3883. [DOI] [PMC free article] [PubMed] [Google Scholar]
- 59.Joshi NS, Akama-Garren EH, Lu Y, Lee DY, Chang GP, Li A, et al. Regulatory T Cells in Tumor-Associated Tertiary Lymphoid Structures Suppress Anti-tumor T Cell Responses. Immunity. 2015;43:579–90. doi: 10.1016/j.immuni.2015.08.006. [DOI] [PMC free article] [PubMed] [Google Scholar]
Associated Data
This section collects any data citations, data availability statements, or supplementary materials included in this article.