

Summary
The checkpoint kinase Rad53 is activated during replication stress to prevent fork collapse, an essential but poorly understood process. Here we show that Rad53 couples leading and lagging strand synthesis under replication stress. In rad53-1 cells stressed by dNTP depletion, the replicative DNA helicase, MCM, and the leading strand DNA polymerase, Pol ε, move beyond the site of DNA synthesis, likely unwinding template DNA. Remarkably, DNA synthesis progresses further along the lagging strand than the leading strand, resulting in the exposure of long stretches of single-stranded leading strand template. The asymmetric DNA synthesis in rad53-1 cells is suppressed by elevated levels of dNTPs in vivo, and the activity of Pol ε is compromised more than lagging-strand polymerase Pol δ at low dNTP concentrations in vitro. Therefore, we propose that Rad53 prevents the generation of excessive ssDNA under replication stress by coordinating DNA unwinding with synthesis of both strands.
eTOC Blurb
Gan et al. find that Rad53 prevents fork collapse via coordinating the unwinding of double-stranded DNA by the replicative helicase with synthesis of both leading and lagging strand. They observed that long-stretches of single-stranded leading strand template coated with RPA are produced in rad53-1 mutant cells under replication stress.
Introduction
A variety of means including UV irradiation, dNTP depletion, and oncogene activation at precancerous lesions induce replication stress, which causes replication errors if left undealt with (Hills and Diffley, 2014; Zeman and Cimprich, 2014). Eukaryotic cells have developed the DNA replication checkpoint pathway to detect, signal and repair DNA lesions caused by replication stress. Mutations in factors involved in DNA replication checkpoints lead to increased genome instability in both yeast and human cells (Ciccia and Elledge, 2010; Cimprich and Cortez, 2008; Huen and Chen, 2008; Marechal and Zou, 2013; Yeeles et al., 2013). Moreover, replication errors likely play a prominent role in tumorigenesis in humans (Tomasetti and Vogelstein, 2015). Therefore, it is important to understand how the DNA replication checkpoint pathway deals with replicative stress.
In budding yeast, the DNA replication checkpoint kinase Rad53, which is equivalent to Chk1 in human cells, is activated via the upstream kinase Mec1 (ATR in human cells) to perform multiple functions including the following three functions in response to DNA replication stress (Yeeles et al., 2013). First, Rad53 inhibits firing of late replication origins through phosphorylation of Sld3 and Dbf4 (Lopez-Mosqueda et al., 2010; Santocanale and Diffley, 1998; Zegerman and Diffley, 2010), proteins critical for the initiation of DNA replication. Second, Rad53 up-regulates the levels of dNTPs through phosphorylation of the Dun1 kinase, which controls the degradation of Sml1, an inhibitor of ribonucleotide reductase (RNR) involved in the rate-limiting step of dNTP synthesis (Zhao and Rothstein, 2002). Activated Dun1 kinase also represses RNR genes transcription. Third, Rad53 prevents collapse of DNA replication forks under replication stress (Lopes et al., 2001; Sogo et al., 2002; Tercero and Diffley, 2001). Genetic evidence indicates that the essential function of Rad53 and Mec1 is linked to their role at DNA replication forks (Desany et al., 1998). Moreover, the essential function of Rad53 and Mec1 (as well as its counterpart ATR) can be suppressed by elevated levels of dNTPs including deletion of SML1 in yeast cells (Lopez-Contreras et al., 2015; Zhao et al., 1998). All these functions of DNA replication checkpoint kinases in the regulation of firing of late-replication origins, up-regulation of dNTP synthesis and maintenance of replisome functions are conserved in human cells. However, it remains largely unknown how DNA replication checkpoint kinases prevent fork collapse and how elevated dNTP levels help these kinases to perform their essential function. Early studies indicate that replisome components are reduced in checkpoint mutant cells under replication stress (Cobb et al., 2003), which leads to the model that DNA replication checkpoint kinases are required for the stable association of proteins with DNA replication forks. In contrast, recent studies indicate that replisome components remain associated with DNA replication forks in checkpoint mutant yeast cells (De Piccoli et al., 2012) and upon inhibition of checkpoint kinases in human cells (Dungrawala et al., 2015). Despite this, it is known that long stretches of single-stranded (ss) DNA are generated in yeast and human cells deficient in DNA replication checkpoint (Buisson et al., 2015; Sogo et al., 2002; Toledo et al., 2013). However, it is largely unknown how excessive ssDNA, which is detrimental to cells, is generated (Berens and Toczyski, 2012). Here, we employed strand-specific sequencing methods to analyze DNA synthesis at leading and lagging strands and the association of ssDNA binding protein, replication factor A (RPA), with DNA replication forks in rad53-1 mutant cells. We observed that DNA synthesis proceeds much further along the lagging strand than the corresponding leading strand, resulting in the exposure of long-stretches of ssDNA at the leading strand template coated with RPA. Mechanistically, we show that replicative helicase MCM and leading strand DNA polymerase Polε move further than the actual site of DNA synthesis, and elevation of dNTP levels suppresses the uncoupled DNA synthesis in rad53-1 mutant cells. Therefore, we propose that DNA replication checkpoint kinases function to couple leading and lagging strand DNA synthesis under replication stress, thereby preventing the generation of long stretches of ssDNA.
Results
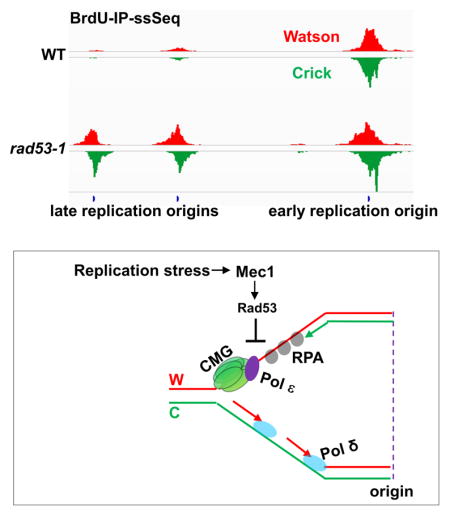
To understand how Rad53 functions to maintain replisome integrity, we first analyzed newly synthesized leading and lagging strand DNA in wild type and rad53-1 mutant cells using BrdU-IP-ssSeq, a method that detects synthesis of both leading and lagging strands (Yu et al., 2014). Briefly, yeast cells were synchronized in G1 phase using alpha-factor and released into fresh medium containing the nucleotide analog BrdU and 0.2 M hydroxyurea (HU) (Figure 1A). HU depletes dNTP pools through inhibition of ribonucleotide reductase and activates the DNA replication checkpoint. However, HU has no apparent effect on the initiation of DNA replication from early replication origins. Newly synthesized DNA marked by BrdU was immuno-precipitated using anti-BrdU antibodies, and subjected to strand-specific sequencing (BrdU-IP-ssSeq). Sequence reads were mapped to both Watson and Crick strands of the yeast reference genome (Figure 1B). Inspection of BrdU-IP-ssSeq peaks at early replication origins in wild type cells revealed that these peaks were largely symmetrical around replication origins (Figure 1B). These results suggest that DNA synthesis progressed bi-directionally from the origin for similar distances on both the leading and lagging strand, consistent with the idea that synthesis of leading and lagging strand is coupled.
Figure 1. Newly synthesized lagging strand DNA surpasses the leading strand in rad53-1 cells under replication stress. See also Figure S1.

(A) Schematic of the experimental strategy for BrdU-IP-ssSeq. WT and rad53-1 cells synchronized in G1 phase using alpha-factor were released into fresh medium containing both 400 μg/ml BrdU and 0.2 M HU. Equal amounts of cells were collected 45min after releasing for immunoprecipitation of newly synthesized DNA using anti-BrdU antibodies and strand-specific sequencing of new DNA. (B) A snapshot of BrdU-IP-ssSeq at two early and late replication origins for WT and rad53-1 mutation cells. The signals represent normalized sequence read density. The red and green represents sequence reads of Watson and Crick strands, respectively. (C) BrdU-IP-ssSeq peaks of HU-stalled forks in wild-type cells shows a small leading strand bias. The average log2 ratios of sequence reads from Watson strand/Crick strands surrounding all early replication origins were calculated using a 200 bp sliding window. (D) Cartoon to explain the leading strand bias of BrdU-IP-ssSeq peaks in wild-type cells. W: Watson strand. C: Crick strand. Red and Green represent newly synthesized W and C strand, respectively. (E–F) Analysis of the average bias of BrdU-IP-ssSeq at early (E) and late (F) replication origins for WT and rad53-1 mutant cells. The average bias of early and late replication origins was calculated as described in C. (G) Cartoon to explain the strand bias pattern in rad53-1 cells.
To analyze BrdU-IP-ssSeq quantitatively, we used a sliding window of 200 bp and calculated the average log2 ratio of sequence reads of Watson over Crick strands surrounding 134 early replication origins fired in the presence of HU. We observed that BrdU-IP-ssSeq peaks exhibited a small but consistent bias towards the leading strand (Figure 1C and Figure S1). The leading strand bias indicates that lagging strand synthesis is slower relative to leading strand synthesis in wild type cells. Based on the analysis of seven independent BrdU-IP ssSeq datasets in wild type cells (Figure S1A–B), nascent lagging strand DNA length was 359nt shorter than nascent leading strand with the average 5.32Kb BrdU peak length of 134 origins. This estimation may be slightly under estimated because there are slightly more Ts, where BrdU is incorporated, at the lagging-strand (226,146 Ts) than the leading-strand (220,433 Ts) in the replicated regions. This result suggests that a short stretch of single-stranded lagging template is likely exposed in wild type cells (see Figure 2). Together, these results are consistent with the idea that synthesis of leading and lagging strands is coupled in wild type cells, with a short ssDNA gap on the lagging strand template (Figure 1D).
Figure 2. Long-stretches of ssDNA on the leading strand template coated with RPA are detected in rad53-1 mutation cells during replication stress.

See also Figure S1. (A) Schematic outline of the experimental strategy for Rfa1 ChIP-ssSeq and Rfa1 eSPAN. Briefly, G1 phase-arrested WT and rad53-1 cells were released into fresh medium containing both 400 μg/ml BrdU and 0.2 M HU. Equal amounts of cells were collected 45min after release for Rfa1 ChIP using antibodies against Rfa1. ChIP DNA was split into two parts: One was processed directly for strand-specific sequencing (Raf1 ChIP-ssSeq); the other was used to enrich newly synthesized DNA using BrdU IP followed by strand-specific sequencing (Rfa1 eSPAN). (B) Snap shot of Rfa1 ChIP-ssSeq and eSPAN in wild-type and rad53-1 mutation cells treated with HU. (C–D) Average bias at early replication origins for Rfa1 ChIP-ssSeq (C) and eSPAN (D) peaks in wild-type and rad53-1 cells. The average log2 ratios of Watson strand over Crick strand surrounding all early replication origins were calculated using a 200 bp sliding window. (E–F) Models describing the preferential association of RPA with ssDNA on the lagging strand templates in WT (E) and on leading strand templates in rad53-1 mutation cells (F) under replication stress.
BrdU-IP-ssSeq revealed that late replication origins fired in the presence of HU in rad53-1 mutant cells (Figure 1B), consistent with published studies (Santocanale and Diffley, 1998). Remarkably, BrdU-IP-ssSeq peaks in rad53-1 cells were asymmetrically distributed, and showed a strong bias towards lagging strands at both early and late replication origins, with a stronger bias at late replication origins (Figure 1B, 1E and 1F). This strong lagging strand bias contrasts the small leading-strand bias of BrdU-IP-ssSeq peaks in wild type cells. Importantly, the strong lagging-strand bias was not detected in rad53-1 mutant cells without HU treatment (Figure S1C), suggesting that compromised Rad53 checkpoint function under replication stress is responsible for the observed strong lagging strand bias.
The dramatic lagging strand bias suggests that lagging strand synthesis progresses further than leading strand synthesis at forks in rad53-1 mutant cells under replication stress (Figure 1G). We calculated that lagging strand synthesis exceeds leading strand synthesis 1.52 Kb with an average of 5.44Kb replicated DNA at the 134 early replication origins and 1Kb with an average of 2.35Kb replicated DNA at 176 late replication origins in rad53-1 mutant cells under our experimental conditions. These observations predict the presence of long-stretches of single-stranded leading strand template at HU-stalled forks in rad53-1 mutant cells (Figure 1G). To test this idea, we analyzed the distribution of RPA, the major ssDNA binding protein in eukaryotic cells, at replication forks using RPA ChIP-ssSeq (Figure 2A). In this method, both template and newly synthesized DNA cross-linked to RPA are being sequenced. We have shown that Rfa1, a subunit of RPA complex, ChIP-ssSeq peaks exhibited a (+) strand bias based on calculation of the average Log2 ratio of Watson over Crick sequence reads surrounding Rfa1 ChIP-ssSeq peaks (Yu et al., 2017) (Figure 2B–C), indicating that more RPA binds to the lagging strand template than to the leading strand template at early origins in wild-type cells under replication stress. These results are consistent with the observation that there is excess single-stranded lagging strand template based on BrdU-IP-ssSeq analysis (Figure 1). In striking contrast, Rfa1 ChIP-ssSeq peaks in rad53-1 mutant cells show a strong (−) strand-biased distribution at all replication origins in rad53-1 cells (Figure 2B–2C, and 2E). The (−) strand bias indicates that more RPA molecules bind to the leading strand template than to the lagging strand template under these conditions. Supporting this interpretation, Rfa1 eSPAN (enrichment and Sequencing Protein Associated Nascent DNA)(Yu et al., 2014), which detects how RPA is cross-linked to nascent DNA at DNA replication forks, revealed that more RPA bound to newly synthesized lagging strand DNA than leading strand DNA under the same conditions in rad53-1 mutant cells (Figure 2D, see Figure 2 of (Yu et al., 2017) for detailed explanation of the apparent opposite bias pattern of Rfa1 eSPAN and ChIP-ssSeq peaks that supports the same conclusion on the association of RPA with DNA). Furthermore, RPA also bound long stretches of single-stranded leading strand template in rad53-1 mutant cells without BrdU incorporation into replicating DNA (Figure S1D), ruling out any potential artifacts due to BrdU incorporation on the detection of long-stretches of ssDNA in rad53-1 mutant cells using either BrdU-IP-ssSeq or Rfa1 ChIP-ssSeq. Taken together, these results indicate that long-stretches of single-stranded DNA coated with RPA on the leading strand template are generated in rad53-1 cells under replication stress (Figure 2F).
Long stretches of ssDNA have also been observed in rad53-1 mutant cells under replication stress using EM images (Sogo et al., 2002). Deletion of EXO1, a 5’ to 3’ exonuclease, can suppress the generation of ssDNA detected in rad53-1 mutant cells (Cotta-Ramusino et al., 2005). It was thus proposed that ssDNA is generated through the nucleolytic processing of nascent lagging strands. Intriguingly, deletion of EXO1 in rad53-1 mutant cells had no effect on the bias in leading and lagging strand synthesis in rad53-1 mutant cells under replication stress observed here (Figure S2). Therefore, ssDNA detected using BrdU-IP-ssSeq and RPA-ssSeq appears to differ from ssDNA detected previously.
It has been shown that the balance between DNA synthesis mode and exonuclease mode of Polε shifts towards the 3’ to 5’ exonuclease mode when dNTP concentration is lowered in vitro (Ganai et al., 2015). To test if nascent leading strands are processed by a 3’ to 5’ exo-nuclease in rad53-1 mutant cells, we analyzed how inactivation of the 3’ to 5’ exo-nuclease activities of Mre11, Pol2 (catalytic subunit of Pol ε), or Pol3 (catalytic subunit of Pol δ), may affect leading and lagging strand DNA synthesis in rad53-1 mutant cells. Inactivation of the exo-nuclease activity of Mre11, Pol2, or Pol3 did not affect the biased pattern of BrdU-IP-ssSeq peaks in rad53-1 mutant cells dramatically (Figure S3). These results indicate that the generation of ssDNA in rad53-1 mutant cells is not due to nucleolytic processing of newly synthesized leading strand DNA by the exo-nuclease activity of Mre11, Pol2, or Pol3.
Mrc1 is involved in Rad53 activation (Alcasabas et al., 2001), and in mrc1Δ mutant cells, Cdc45 and other proteins at DNA replication forks move ahead of the site of actual DNA synthesis (Katou et al., 2003). Therefore, we tested the hypothesis that the replicative DNA helicase, MCM, may unwind the double-strand template DNA while leading-strand synthesis is uncoupled from lagging strand synthesis in rad53-1 cells under replication stress. To do this, we analyzed the chromatin distribution of the MCM subunit, Mcm6, in wild-type and rad53-1 cells under replication stress. Briefly, wild-type or rad53-1 mutant yeast cells were first arrested in G1 phase, and then released into S phase in the presence of both HU and BrdU. ChIP-Seq was performed to monitor Mcm6 distribution (Figure 3A). To correlate Mcm6 chromatin binding with new DNA synthesis, we simultaneously performed BrdU-IP-Seq to mark replicated regions. As shown in Figure 3B and Figure 3C, and consistent with published observations (Yu et al., 2014), the BrdU track length was similar between wild-type and rad53-1 mutant cells. In contrast, Mcm6 ChIP-Seq peaks in rad53-1 mutant cells were significantly wider than the ones in wild-type cells (Figure 3B and 3D). To exclude the possibility that this is due to differences in aberrant DNA synthesis in rad53-1 mutant cells, we normalized Mcm6 ChIP-Seq peak width to the corresponding BrdU-IP-Seq peak width at each replication origin. The box-dot plots indicated that the ratios of Mcm6 ChIP-Seq over BrdU-IP-Seq at early replication origins in rad53-1 mutant cells were significantly larger than in wild-type cells (Figure 3E). If we assume that the MCM helicase and DNA synthesis progress over similar distances in wild-type cells, these results indicate that MCM, which translocate on the leading strand template (Fu et al., 2011), moves ahead of the site of actual DNA synthesis in rad53-1 mutant cells, suggesting that the DNA template is unwound in the absence of leading strand synthesis in rad53-1 mutant cells under replication stress.
Figure 3. Replicative helicase MCM and leading strand DNA polymerase Pol 3 move beyond the actual site of DNA synthesis in rad53-1 cells during replication stress. See also Figure S2 and S3.

(A) A schematic presentation of the experimental strategy to analyze the association of Pol 3 and MCM6 with DNA replication forks by ChIP-Seq. Briefly, WT and rad53-1 cells were synchronized in G1 phase and then released as described in Figure 1A. Cells were collected 45min after release into HU for BrdU-IP-Seq to monitor newly synthesized DNA, or for Mcm6 and Pol 3 ChIP-Seq. (B) Genome browser track examples for the occupancy profiles of Pol 3 and Mcm6 ChIP-Seq at three replication origins: ARS1531, ARS1507, and ARS1508, in WT and rad53-1 cells. (C) Normalized reads plots of BrdU-IP-Seq signals within a 20Kb window centered on early replication origins in WT and rad53-1 cells. The reads were calculated using a 200 bp sliding window and normalized to Reads Per Kilobase per Million mapped reads (RPKM). (D) Normalized read density of Mcm6 ChIP-Seq peaks at early replication origins. (E) Boxplot showing the distribution of relative peak width for Mcm6 ChIP-Seq peaks in WT and rad53-1 cells at individual origins. The read density of surrounding each MCM6 ChIP-Seq peak was normalized to corresponding BrdU-IP-Seq read density. p-value was calculated using two-tailed Student's t-test. (F) Normalized read density plots of Pol 3 ChIP-Seq in wild-type and rad53-1 cells. (G) Box plots showing the relative peak width of Pol 3 ChIP-Seq normalized to corresponding BrdU-IP-Seq in WT and rad53-1 cells.
We also analyzed how the leading strand DNA polymerase, Pol ε (Pursell et al., 2007), is distributed around HU-stalled forks in wild-type and rad53-1 mutant cells using ChIP-Seq. In wild-type cells, Pol ε ChIP-Seq peaks exhibited bifurcated peaks surrounding replication origins, indicating that Pol ε moves away from DNA replication origins bi-directionally. This pattern was compromised in rad53-1 mutant cells (Figure 3B and 3F). Importantly, we observed that the Pol ε ChIP-Seq peak track length in rad53-1 mutant cells was much longer than that in wild-type cells (Figure 3F and 3G). These results suggest that in rad53-1 mutant cells Pol ε associate with HU-stalled DNA replication forks, and travel with the MCM helicase under replication stress.
Why then is leading strand DNA synthesis reduced relative to lagging strand synthesis in rad53-1 mutant cells under replication stress? To gain insight into this question, we first determined whether the firing of late origins in rad53-1 mutant cells contributes to compromised leading strand synthesis. Rad53 phosphorylates multiple residues on Sld3 and Dbf4 in response to replication stress, which inhibits the firing of late replication origins (Lopez-Mosqueda et al., 2010; Zegerman and Diffley, 2010). Thus, late replication origins fire in cells expressing the Rad53 phosphorylation-site mutants, sld3-A dbf4-A, in the presence of HU (Sheu et al., 2016; Zegerman and Diffley, 2010) (Figure S4A). However, sld3-A dbf4-A mutant cells exhibited no significant bias in the distribution of BrdU-IP-ssSeq peaks at either early or late replication origins (Figure 4A–C), suggesting that late replication origin firing is not the reason for the compromised leading strand synthesis in rad53-1 mutant cells.
Figure 4. Increased dNTP levels suppress uncoupled leading and lagging strand synthesis in rad53-1 cells.

See also Figure S2–4. (A) Example of BrdU-IP-ssSeq in WT, sml1 Δ, dbf4-A sld3-A, rad53-1, and rad53-1 sml1 Δ cells treated with HU. Note that late replication origins fire in cells expressing sld3-A dbf4-A mutant under HU treatment. (B–C) Analysis of the average bias of BrdU-IP-ssSeq in early (B) and late (C) replication origins for WT and mutant cells as indicated in the figure using the same procedures as described in Figure 1E–F. (D) Impaired leading strand synthesis by Pol ε at low dNTP concentrations. Reconstituted DNA replication reactions were carried out on chromatinized pARS1 (4.8 kb) in the presence of Pol ε and absence of Pol δ (lanes 1–6), in the presence of Pol δ and the DNA polymerase-deficient Pol ε mutant Pol εpol− (lanes 7–12), or in the presence of both Pol δ and Pol ε. dNTPs were included at 39 μM dCTP, 66 μM dTTP, 22 μM dATP, and 11 μM dGTP (lanes 6, 12, 18), or at two-fold (lanes 5, 11, 17), four-fold (lanes 4, 10, 16), eight-fold (lanes 3, 9, 15), sixteen-fold (lanes 2, 8, 14), or thirty-two-fold (lanes 1, 7, 13) reduced concentrations. DNA products were analyzed by alkaline agarose gel-electrophoresis and autoradiography in the panel on the left; the gel positions of full-length single-stranded DNA (ssL; resulting from nick-labeling), as well as leading (lead) and lagging (lag) strand products are indicated. Traces of signal intensities for lanes 1, 7, and 13 (top panel), lanes 2, 8, and 14 (middle panel), or lanes 3, 9, and 15 (bottom panel) are shown on the right.
Sml1 is an inhibitor of ribonucleotide reductase, which regulates dNTP synthesis. In wild-type cells, Sml1 is degraded in response to replication stress in a Rad53-dependent manner. Deletion of SML1 results in increased dNTP pools and suppresses the lethality of RAD53 deletion mutant cells (Zhao et al., 1998). Therefore, we next tested whether deletion of SML1 had any impacts on uncoupled DNA synthesis in rad53-1 mutant cells. Synthesis of leading and lagging strands was similar in sml1Δ cells (Figure 4A–B). Remarkably, deletion of SML1 in rad53-1 mutant cells completely suppressed the lagging strand bias of BrdU-IP-ssSeq peaks at early replication origins (Figure 4A–C and Figure S4B), and this suppression is unlikely due to cell synchrony (Figure S4C–D). We noticed that a small lagging strand bias exists at late replication origins in rad53-1 sml1Δ cells, suggesting that synthesis at leading and lagging strands remains partially uncoupled at late replication origins in the rad53-1 sml1Δ cells. Taken together, these results indicate that the uncoupled DNA synthesis is due in part to reduced dNTP levels in rad53-1 mutant cells.
While Pol δ likely has a role in leading strand DNA synthesis (Johnson et al., 2015; Yeeles et al., 2017), Pol ε performs the bulk of leading strand synthesis in vivo (Kunkel and Burgers, 2008) . Therefore, we analyzed the DNA synthesis activity of Pol ε and Pol δ at different dNTP concentrations using a recently reconstituted origin-dependent budding yeast in vitro DNA replication system (Devbhandari et al., 2017). In this system, primer extension by Pol α is restricted by DNA polymerase clamp loader and clamp (RFC/PCNA), while both Pol ε and Pol δ can contribute to the synthesis of leading and lagging strands. Specific DNA synthesis by Pol ε can be monitored by omission of Pol δ from the system, while specific DNA synthesis by Pol δ can be monitored in the presence of the catalytic polymerase mutant, Pol εpol−, which maintains the DNA polymerase-independent origin activation function of Pol ε. Using constant dNTP ratios that mimic those measured in vivo (Sabouri et al., 2008), we observed that the Pol ε requires ~ 2–4-fold higher dNTP levels for maximum extension of nascent leading strands compared to Pol δ (Figure 4D and Figure S4E). Synthesis of the short lagging strand products by either Pol δ or Pol ε, on the other hand, was not differentially affected at any of the dNTP concentrations tested. These results support the notion that leading strand DNA synthesis by Pol ε is more susceptible to reduced dNTP levels than lagging strand synthesis by Pol δ.
Discussion
We show that in rad53-1 mutant cells, synthesis of leading and lagging strands is uncoupled, which leads to the exposure of long stretches of single-stranded leading strand template coated with RPA under replication stress. We observed that the replicative DNA helicase, MCM, and associated Pol ε move ahead of the site of actual DNA synthesis in rad53-1 mutant cells under replication stress. Moreover, the uncoupled synthesis in rad53-1 mutant cells is suppressed by increased dNTP levels, and Pol ε DNA synthesis is specifically compromised at low dNTP concentrations in vitro. These results support a model whereby Rad53 couples leading and lagging strand synthesis under replication stress at least in part through the inhibition of excessive template DNA unwinding by the MCM helicase at stalled replication forks as well as the up-regulation of dNTP levels needed for DNA synthesis by Pol ε.
DNA replication checkpoint kinases in both yeast and human cells up-regulate dNTP levels under replication stress to mediate their essential function at replication forks (Yeeles et al., 2013). It is possible that upregulation of dNTP levels under replication stress helps fork restart once replication stress is terminated. We suggest that elevated levels of dNTPs also help prevent the generation of long stretches of ssDNA at origins that have already fired. ssDNA is a known inducer of replication catastrophe and genome instability in both yeast and human cells.
Unwinding of dsDNA by the MCM helicase through uncoupling of MCM and DNA polymerase activity is essential for the activation of the replication checkpoint during S phase (Byun et al., 2005; Tercero et al., 2003). Our observations of the excessive ssDNA and MCM localization in rad53-1 mutant cells suggest that activated Rad53 is required to prevent excessive DNA unwinding by the MCM helicase under replication stress. Therefore, we propose that a feedback mechanism exists between dsDNA unwinding by the MCM helicase and DNA replication checkpoint pathway. Under replication stress, Pol 3, while having a greater contact with the nascent leading strand DNA at active forks, backtracks to bind dsDNA at HU stalled forks (Yu et al., 2017). The change in association mode of Pol 3 binding to dsDNA at HU stalled forks was also detected in rad53-1 mutant cells (data not shown). Therefore, we suggest that Polε disengages from the active DNA synthesis mode and moves passively with active CMG helicase in rad53-1 mutant cells under replication stress.
The MCM helicase also moves ahead of the site of actual DNA synthesis in cells lacking Mrc1 (Katou et al., 2003). While Mrc1 functions upstream of Rad53 under replication stress, Rad53 and Mec1 also phosphorylate Mrc1(Alcasabas et al., 2001). Moreover, Mrc1 promotes leading strand DNA synthesis in vitro (Yeeles et al., 2017). Therefore, it is tempting to speculate that Rad53 mediates its essential function at DNA replication forks through Mrc1. However, unlike Rad53, Mrc1 is not essential. Therefore, Rad53 likely also regulates other replisome components to perform its essential function. Polε stimulates the CMG helicase activity (Kang et al., 2012), so we speculate that Rad53 likely regulates the Polε-CMG interaction under replication stress, in turn couples leading and lagging strand DNA synthesis.
STAR Methods
CONTACT FOR REAGENT AND RESOURCE SHARING
Further information and requests for resources and reagents should be directed to and will be fulfilled by the Lead Contact, Zhiguo Zhang (zz2401@cumc.columbia.edu).
EXPERIMENTAL MODEL AND SUBJECT DETAILS
All yeast strains (Table S1) used in this study were derived from W303 (leu2-3, 112 ura3-1 his3-11, trp1-1, ade2-1 can1-100).
METHOD DETAILS
Yeast cells culture and synchronization
Synthetic alpha factor was used to synchronize cells at cell density OD600=0.4–0.5 (concentration, 5 μg/mL and 50 ng/mL for wild-type BAR and bar1 mutant strains, respectively) for three-hour arrest at 25°C. To analyze forks without HU, G1-arrested cells were released into YPD medium at 25°C containing 400 μg/ml bromodeoxyuridine (BrdU), and samples were collected at indicated time points. For HU-stalled replication fork analysis, G1-arrested cells were released into pre-warmed fresh medium containing 400 μg/ml BrdU and 0.2M HU at 30 °C for 45 minutes. Then the samples were fixed with 1% paraformaldehyde at 25°C for 20 minutes and then quenched with 0.125M glycine for 5 minutes. These samples were used to BrdU-IP-ssSeq and protein ChIP-ssSeq.
ChIP-ssSeq Procedure
ChIP and BrdU immunoprecipitation experiments were performed as described previously (Yu et al., 2014). Briefly, after cells were fixed as described above, cell walls were broken by glass beads beating method, and the chromatin pellet was collected, washed and sonicated to shear DNA to an average fragment size of 200–400bp. Sheared chromatin was cleared by centrifugation and immunoprecipitated with anti-FLAG antibody F1804, or anti-Rfa1 antibody (gift of Dr Steven Brill), or antibodies against Mcm6-Flag. After extensive washing, DNA was recovered from both input and ChIP samples with the fast Chelex-100 protocol (Nelson et al., 2006). The ChIP libraries were performed using the ssDNA library protocol (Meyer et al., 2012).
BrdU immunoprecipitation
The input DNA obtained from Chelex-100 extraction was used for BrdU immunoprecipitation. Briefly, DNA was firstly denatured at 95 °C for 5 minutes and then transferred to an ice bath for 5 minutes. The DNA samples were then diluted 10 times with BrdU IP solution (1XPBS, 0.0625% Triton X-100(v/v), 6.7μg/mL Escherichia. coli tRNA, 0.40μl/mL BrdU antibody (BD Bioscience)). After two-hour incubation at 4°C, 20 μL protein G beads (GE Healthcare) (washed twice with BrdU IP solution) were added followed by incubation for additional hour at 4°C. The protein G beads were washed extensively. DNA were eluted using 100 μL Tris-EDTA buffer with 1% SDS buffer at 65 °C for 15 min and the eluted DNA was purified using a Qiagen Minielute PCR kit. The ssDNA libraries were prepared using the same procedures previously published (Meyer et al., 2012).
Data analysis
The ssDNA libraries were sequenced on Illumina Hi-Seq 2000 or Hi-Seq2500 using the paired-end sequencing strategy. The sequencing reads were mapped to the yeast genome (sacCer3) using Bowtie2 software (Langmead and Salzberg, 2012). Only the consistent pair-end reads were chosen for further analysis. BEDTools (Quinlan and Hall, 2010) and in-house Perl programs were used to calculated the genome-wide read coverage of Watson and Crick strands. To identify peaks, the sequence reads of both Watson and Crick strands were merged and used to call peaks using MACS software (Zhang et al., 2008) with the cut-off p value of 1×10⁻⁵. The DNA replication origins dataset used in this study are from our previously paper (Yu et al., 2014). To calculate the average bias pattern, the log2 ratios of sequencing reads of the Watson strand over Crick strand across around 134 early replication origins or 176 late replication origins were calculated using a 200-bp sliding window. The ratios were then normalized against the corresponding input to obtain the average bias pattern of BrdU-IP-ssSeq and protein ChIP-ssSeq. To analyze the bias pattern at individual origins, we separated each BrdU-IP-ssSeq peak region into 4 quadrants base on the origin position: Watson strand at the left (WL) and right (WR) of an origin and Crick strand at the left (CL) and right (CR) of an origin. The number of sequence reads in each quadrant was counted. In order to determine whether sequence reads of leading strand (WL+CR) were different from those of the lagging strand (WR+CL), the binomial distribution was used to calculate the p value. The cut-off p value is set to 1×10⁻⁵. Then the log2 ratios (log2 [(WL+CR)/(WR+CL)]) were calculated and used to determine whether a BrdU-IP-ssSeq peak or protein eSPAN peak had a leading (greater than zero) or lagging strand bias pattern (less than zero).
The gap length calculation
For each individual origin, we first calculated the ratio of sequencing reads from leading over lagging strands based on the BrdU-IP-ssSeq peak region at individual origins. If the ratio > 1 (means: leading strain reads more than lagging strain reads), we assign the leading strand length equal to the peaks length (PL), and the lagging strand length is PL / ratio. The gap length (leading - lagging) is [PL-(PL/ratio)]. If the ratio < 1, we assign the lagging strand length equal to peaks length, and the leading strand length is PL*ratio, the gap length (leading - lagging) is determined by [(PL*ratio)-PL]. The results described in the manuscript is the average peak length of early (134) or late replication origins (176). The gap also represents the average gap length between leading and lagging strand at either early replication or late replication origins.
In vitro DNA replication assay
Reconstituted DNA replication assays were performed on chromatinized plasmid pARS1 essentially as described (Devbhandari et al., 2017) in the absence of Fen1 and Cdc9. In brief, chromatin assembly was carried out for 1 hour at 30°C in a 10μl reaction volume including 3.1 μM Nap1, 350 nM histone octamer, 50 nM Isw1a, 20 nM pARS1 (4.8 kb), and 100 nM ORC; to induce Mcm2-7 loading the chromatin assembly mix was subsequently supplemented with 50 nM Cdc6 and 100 nM Cdt1•Mcm2-7, followed by further incubation for 30 minutes at 30°C. Next, origin activation was induced by the sequential addition of 60 nM DDK, 20 nM Sld3·7, 40 nM Cdc45, 80 nM Clb5·Cdk1, 80 nM GINS, 24 nM Pol ε, 40 nM Dpb11, 50 nM Sld2, 210 nM RPA, 45 nM Pol α, 20 nM RFC, 70 nM PCNA, 24 nM Pol δ, 20 nM Top2, 20 nM Mcm10, 192 μM each CTP, UTP, GTP; dNTPs were included at 39 μM dCTP, 66 μM dTTP, 22 μM dATP, 11 μM dGTP and 66 nM α32P-dCTP (3,000 Ci / mmol, 10 mCi / ml). For dNTP titrations, the dNTP mix was serially diluted in two-fold steps as indicated while maintaining a constant ratio of dCTP / α32P-dCTP. The final reaction volume was 50 μl, and reactions were incubated for 1 hour at 30°C. Where indicated, Pol δ was left out of the reaction mix, or the DNA polymerase-deficient Pol ε mutant Pol εpol− (Devbhandari et al., 2017) was used in place of wild-type Pol ε. Reactions were terminated by incubation for 30 min at 37°C with 40 mM EDTA, 1.6 U Proteinase K, and 0.8% SDS. DNA was isolated by phenol / chloroform extraction, followed by centrifugation through G-25 spin columns (GE Healthcare). DNA products were analyzed by alkaline agarose gel-electrophoresis (0.8 % agarose, 30 mM NaOH, 2 mM EDTA) and phosphorimaging of the dried gels. Signal intensities across individual lanes were determined using ImageJ (NIH).
QUANTIFICATION AND STATISTICAL ANALYSIS
For the peaks calling, the p value was calculated by MACS (Zhang et al., 2008), and the cut-off value is set to 1×10⁻⁵ (in Figures 3 and Figure S1). For the bias quantification, the binomial distribution was used to calculate the p value, and the cut-off value is set to 1×10⁻⁵ (in Figure S1). For the boxplot in Figure 3, p-value was calculated using two-tailed Student's t-test.
DATA AND SOFTWARE AVAILABILITY
All raw and analyzed sequencing data have been deposited in the NCBI GEO: GSE89721.
Supplementary Material
Related to STAR method. Yeast strains used in this study.
Highlights.
Asymmetric DNA synthesis occurs in rad53-1 cells under replication stress
, Excessive single-stranded leading strand template is detected in rad53-1 cells
MCM and Polε move beyond the site of actual DNA synthesis in rad53-1 cells
Elevated dNTP levels suppress the asymmetric DNA synthesis in rad53-1 cells
Acknowledgments
We thank Drs. Bruce Stillman, Xiaolan Zhao, Rodney Rothstein, Alberto Ciccia, Lorraine Symington, Jean Gautier, Erik Johansson for discussions and comments on this manuscript. We thank Drs. Symington, Diffley, Wittenberg, Kunkel and Kolodner for yeast strains and plasmids and Dr. Brill for antibodies against yeast RPA. This study is supported by NIH grant GM118015 (Z.Z.), R01GM107239 (D.R.), and by the Swedish Cancer Society and the Swedish Research Council (A.C.).
Footnotes
Author contribution
Z.Z., H.G. and C.Y. conceived the project. C.Y. performed almost all experiments. H.G. performed all bioinformatics and statistical analysis, and. H.G. and J.H. performed some of the experiments. S.D. performed the in vitro DNA replication experiments under guidance of D.R., S.S. and A.C. measured dNTP levels. H.G., C.Y., and Z.Z wrote the original draft. D.R. edited the manuscript extensively and all authors read the paper.
Publisher's Disclaimer: This is a PDF file of an unedited manuscript that has been accepted for publication. As a service to our customers we are providing this early version of the manuscript. The manuscript will undergo copyediting, typesetting, and review of the resulting proof before it is published in its final citable form. Please note that during the production process errors may be discovered which could affect the content, and all legal disclaimers that apply to the journal pertain.
References
- Alcasabas AA, Osborn AJ, Bachant J, Hu F, Werler PJ, Bousset K, Furuya K, Diffley JF, Carr AM, Elledge SJ. Mrc1 transduces signals of DNA replication stress to activate Rad53. Nat Cell Biol. 2001;3:958–965. doi: 10.1038/ncb1101-958. [DOI] [PubMed] [Google Scholar]
- Berens TJ, Toczyski DP. Keeping it together in times of stress: checkpoint function at stalled replication forks. Mol Cell. 2012;45:585–586. doi: 10.1016/j.molcel.2012.02.011. [DOI] [PMC free article] [PubMed] [Google Scholar]
- Buisson R, Boisvert JL, Benes CH, Zou L. Distinct but Concerted Roles of ATR, DNA-PK, and Chk1 in Countering Replication Stress during S Phase. Mol Cell. 2015;59:1011–1024. doi: 10.1016/j.molcel.2015.07.029. [DOI] [PMC free article] [PubMed] [Google Scholar]
- Byun TS, Pacek M, Yee MC, Walter JC, Cimprich KA. Functional uncoupling of MCM helicase and DNA polymerase activities activates the ATR-dependent checkpoint. Genes Dev. 2005;19:1040–1052. doi: 10.1101/gad.1301205. [DOI] [PMC free article] [PubMed] [Google Scholar]
- Ciccia A, Elledge SJ. The DNA damage response: making it safe to play with knives. Mol Cell. 2010;40:179–204. doi: 10.1016/j.molcel.2010.09.019. [DOI] [PMC free article] [PubMed] [Google Scholar]
- Cimprich KA, Cortez D. ATR: an essential regulator of genome integrity. Nat Rev Mol Cell Biol. 2008;9:616–627. doi: 10.1038/nrm2450. [DOI] [PMC free article] [PubMed] [Google Scholar]
- Cobb JA, Bjergbaek L, Shimada K, Frei C, Gasser SM. DNA polymerase stabilization at stalled replication forks requires Mec1 and the RecQ helicase Sgs1. EMBO J. 2003;22:4325–4336. doi: 10.1093/emboj/cdg391. [DOI] [PMC free article] [PubMed] [Google Scholar]
- Cotta-Ramusino C, Fachinetti D, Lucca C, Doksani Y, Lopes M, Sogo J, Foiani M. Exo1 processes stalled replication forks and counteracts fork reversal in checkpoint-defective cells. Mol Cell. 2005;17:153–159. doi: 10.1016/j.molcel.2004.11.032. [DOI] [PubMed] [Google Scholar]
- De Piccoli G, Katou Y, Itoh T, Nakato R, Shirahige K, Labib K. Replisome stability at defective DNA replication forks is independent of S phase checkpoint kinases. Mol Cell. 2012;45:696–704. doi: 10.1016/j.molcel.2012.01.007. [DOI] [PubMed] [Google Scholar]
- Desany BA, Alcasabas AA, Bachant JB, Elledge SJ. Recovery from DNA replicational stress is the essential function of the S-phase checkpoint pathway. Genes Dev. 1998;12:2956–2970. doi: 10.1101/gad.12.18.2956. [DOI] [PMC free article] [PubMed] [Google Scholar]
- Devbhandari S, Jiang J, Kumar C, Whitehouse I, Remus D. Chromatin Constrains the Initiation and Elongation of DNA Replication. Mol Cell. 2017;65:131–141. doi: 10.1016/j.molcel.2016.10.035. [DOI] [PMC free article] [PubMed] [Google Scholar]
- Dungrawala H, Rose KL, Bhat KP, Mohni KN, Glick GG, Couch FB, Cortez D. The Replication Checkpoint Prevents Two Types of Fork Collapse without Regulating Replisome Stability. Mol Cell. 2015;59:998–1010. doi: 10.1016/j.molcel.2015.07.030. [DOI] [PMC free article] [PubMed] [Google Scholar]
- Fu YV, Yardimci H, Long DT, Ho TV, Guainazzi A, Bermudez VP, Hurwitz J, van Oijen A, Scharer OD, Walter JC. Selective bypass of a lagging strand roadblock by the eukaryotic replicative DNA helicase. Cell. 2011;146:931–941. doi: 10.1016/j.cell.2011.07.045. [DOI] [PMC free article] [PubMed] [Google Scholar]
- Ganai RA, Bylund GO, Johansson E. Switching between polymerase and exonuclease sites in DNA polymerase epsilon. Nucleic Acids Res. 2015;43:932–942. doi: 10.1093/nar/gku1353. [DOI] [PMC free article] [PubMed] [Google Scholar]
- Hills SA, Diffley JF. DNA replication and oncogene-induced replicative stress. Curr Biol. 2014;24:R435–444. doi: 10.1016/j.cub.2014.04.012. [DOI] [PubMed] [Google Scholar]
- Huen MS, Chen J. The DNA damage response pathways: at the crossroad of protein modifications. Cell Res. 2008;18:8–16. doi: 10.1038/cr.2007.109. [DOI] [PubMed] [Google Scholar]
- Johnson RE, Klassen R, Prakash L, Prakash S. A Major Role of DNA Polymerase delta in Replication of Both the Leading and Lagging DNA Strands. Mol Cell. 2015;59:163–175. doi: 10.1016/j.molcel.2015.05.038. [DOI] [PMC free article] [PubMed] [Google Scholar]
- Kang YH, Galal WC, Farina A, Tappin I, Hurwitz J. Properties of the human Cdc45/Mcm2-7/GINS helicase complex and its action with DNA polymerase epsilon in rolling circle DNA synthesis. Proc Natl Acad Sci U S A. 2012;109:6042–6047. doi: 10.1073/pnas.1203734109. [DOI] [PMC free article] [PubMed] [Google Scholar]
- Katou Y, Kanoh Y, Bando M, Noguchi H, Tanaka H, Ashikari T, Sugimoto K, Shirahige K. S-phase checkpoint proteins Tof1 and Mrc1 form a stable replication-pausing complex. Nature. 2003;424:1078–1083. doi: 10.1038/nature01900. [DOI] [PubMed] [Google Scholar]
- Knott SR, Viggiani CJ, Tavare S, Aparicio OM. Genome-wide replication profiles indicate an expansive role for Rpd3L in regulating replication initiation timing or efficiency, and reveal genomic loci of Rpd3 function in Saccharomyces cerevisiae. Genes Dev. 2009;23:1077–1090. doi: 10.1101/gad.1784309. [DOI] [PMC free article] [PubMed] [Google Scholar]
- Kunkel TA, Burgers PM. Dividing the workload at a eukaryotic replication fork. Trends Cell Biol. 2008;18:521–527. doi: 10.1016/j.tcb.2008.08.005. [DOI] [PMC free article] [PubMed] [Google Scholar]
- Langmead B, Salzberg SL. Fast gapped-read alignment with Bowtie 2. Nat Methods. 2012;9:357–359. doi: 10.1038/nmeth.1923. [DOI] [PMC free article] [PubMed] [Google Scholar]
- Lopes M, Cotta-Ramusino C, Pellicioli A, Liberi G, Plevani P, Muzi-Falconi M, Newlon CS, Foiani M. The DNA replication checkpoint response stabilizes stalled replication forks. Nature. 2001;412:557–561. doi: 10.1038/35087613. [DOI] [PubMed] [Google Scholar]
- Lopez-Contreras AJ, Specks J, Barlow JH, Ambrogio C, Desler C, Vikingsson S, Rodrigo-Perez S, Green H, Rasmussen LJ, Murga M, et al. Increased Rrm2 gene dosage reduces fragile site breakage and prolongs survival of ATR mutant mice. Genes Dev. 2015;29:690–695. doi: 10.1101/gad.256958.114. [DOI] [PMC free article] [PubMed] [Google Scholar]
- Lopez-Mosqueda J, Maas NL, Jonsson ZO, Defazio-Eli LG, Wohlschlegel J, Toczyski DP. Damage-induced phosphorylation of Sld3 is important to block late origin firing. Nature. 2010;467:479–483. doi: 10.1038/nature09377. [DOI] [PMC free article] [PubMed] [Google Scholar]
- Marechal A, Zou L. DNA damage sensing by the ATM and ATR kinases. Cold Spring Harb Perspect Biol. 2013;5 doi: 10.1101/cshperspect.a012716. [DOI] [PMC free article] [PubMed] [Google Scholar]
- Meyer M, Kircher M, Gansauge MT, Li H, Racimo F, Mallick S, Schraiber JG, Jay F, Prufer K, de Filippo C, et al. A high-coverage genome sequence from an archaic Denisovan individual. Science. 2012;338:222–226. doi: 10.1126/science.1224344. [DOI] [PMC free article] [PubMed] [Google Scholar]
- Moreau S, Morgan EA, Symington LS. Overlapping functions of the Saccharomyces cerevisiae Mre11, Exo1 and Rad27 nucleases in DNA metabolism. Genetics. 2001;159:1423–1433. doi: 10.1093/genetics/159.4.1423. [DOI] [PMC free article] [PubMed] [Google Scholar]
- Morrison A, Bell JB, Kunkel TA, Sugino A. Eukaryotic DNA polymerase amino acid sequence required for 3'----5' exonuclease activity. Proc Natl Acad Sci U S A. 1991;88:9473–9477. doi: 10.1073/pnas.88.21.9473. [DOI] [PMC free article] [PubMed] [Google Scholar]
- Nelson JD, Denisenko O, Bomsztyk K. Protocol for the fast chromatin immunoprecipitation (ChIP) method. Nat Protoc. 2006;1:179–185. doi: 10.1038/nprot.2006.27. [DOI] [PubMed] [Google Scholar]
- Pursell ZF, Isoz I, Lundstrom EB, Johansson E, Kunkel TA. Yeast DNA polymerase epsilon participates in leading-strand DNA replication. Science. 2007;317:127–130. doi: 10.1126/science.1144067. [DOI] [PMC free article] [PubMed] [Google Scholar]
- Quinlan AR, Hall IM. BEDTools: a flexible suite of utilities for comparing genomic features. Bioinformatics. 2010;26:841–842. doi: 10.1093/bioinformatics/btq033. [DOI] [PMC free article] [PubMed] [Google Scholar]
- Sabouri N, Viberg J, Goyal DK, Johansson E, Chabes A. Evidence for lesion bypass by yeast replicative DNA polymerases during DNA damage. Nucleic Acids Res. 2008;36:5660–5667. doi: 10.1093/nar/gkn555. [DOI] [PMC free article] [PubMed] [Google Scholar]
- Santocanale C, Diffley JF. A Mec1- and Rad53-dependent checkpoint controls late-firing origins of DNA replication. Nature. 1998;395:615–618. doi: 10.1038/27001. [DOI] [PubMed] [Google Scholar]
- Sheu YJ, Kinney JB, Stillman B. Concerted activities of Mcm4, Sld3, and Dbf4 in control of origin activation and DNA replication fork progression. Genome Res. 2016;26:315–330. doi: 10.1101/gr.195248.115. [DOI] [PMC free article] [PubMed] [Google Scholar]
- Simon M, Giot L, Faye G. The 3' to 5' exonuclease activity located in the DNA polymerase delta subunit of Saccharomyces cerevisiae is required for accurate replication. EMBO J. 1991;10:2165–2170. doi: 10.1002/j.1460-2075.1991.tb07751.x. [DOI] [PMC free article] [PubMed] [Google Scholar]
- Sogo JM, Lopes M, Foiani M. Fork reversal and ssDNA accumulation at stalled replication forks owing to checkpoint defects. Science. 2002;297:599–602. doi: 10.1126/science.1074023. [DOI] [PubMed] [Google Scholar]
- Tercero JA, Diffley JF. Regulation of DNA replication fork progression through damaged DNA by the Mec1/Rad53 checkpoint. Nature. 2001;412:553–557. doi: 10.1038/35087607. [DOI] [PubMed] [Google Scholar]
- Tercero JA, Longhese MP, Diffley JF. A central role for DNA replication forks in checkpoint activation and response. Mol Cell. 2003;11:1323–1336. doi: 10.1016/s1097-2765(03)00169-2. [DOI] [PubMed] [Google Scholar]
- Toledo LI, Altmeyer M, Rask MB, Lukas C, Larsen DH, Povlsen LK, Bekker-Jensen S, Mailand N, Bartek J, Lukas J. ATR prohibits replication catastrophe by preventing global exhaustion of RPA. Cell. 2013;155:1088–1103. doi: 10.1016/j.cell.2013.10.043. [DOI] [PubMed] [Google Scholar]
- Tomasetti C, Vogelstein B. Cancer etiology. Variation in cancer risk among tissues can be explained by the number of stem cell divisions. Science. 2015;347:78–81. doi: 10.1126/science.1260825. [DOI] [PMC free article] [PubMed] [Google Scholar]
- Viggiani CJ, Aparicio OM. New vectors for simplified construction of BrdU-Incorporating strains of Saccharomyces cerevisiae. Yeast. 2006;23:1045–1051. doi: 10.1002/yea.1406. [DOI] [PubMed] [Google Scholar]
- Yeeles JT, Janska A, Early A, Diffley JF. How the Eukaryotic Replisome Achieves Rapid and Efficient DNA Replication. Mol Cell. 2017;65:105–116. doi: 10.1016/j.molcel.2016.11.017. [DOI] [PMC free article] [PubMed] [Google Scholar]
- Yeeles JT, Poli J, Marians KJ, Pasero P. Rescuing stalled or damaged replication forks. Cold Spring Harb Perspect Biol. 2013;5:a012815. doi: 10.1101/cshperspect.a012815. [DOI] [PMC free article] [PubMed] [Google Scholar]
- Yu C, Gan H, Han J, Zhou ZX, Jia S, Chabes A, Farrugia G, Ordog T, Zhang Z. Strand-specific analysis shows protein binding at replication forks and PCNA unloading from lagging strands when forks stall. Mol Cell. 2014;56:551–563. doi: 10.1016/j.molcel.2014.09.017. [DOI] [PMC free article] [PubMed] [Google Scholar]
- Yu C, Gan H, Zhang Z. Both DNA Polymerases epsilon and delta Contact Active and Stalled Replication Forks differently. Mol Cell Biol. 2017 doi: 10.1128/MCB.00190-17. [DOI] [PMC free article] [PubMed] [Google Scholar]
- Zegerman P, Diffley JF. Checkpoint-dependent inhibition of DNA replication initiation by Sld3 and Dbf4 phosphorylation. Nature. 2010;467:474–478. doi: 10.1038/nature09373. [DOI] [PMC free article] [PubMed] [Google Scholar]
- Zeman MK, Cimprich KA. Causes and consequences of replication stress. Nat Cell Biol. 2014;16:2–9. doi: 10.1038/ncb2897. [DOI] [PMC free article] [PubMed] [Google Scholar]
- Zhang Y, Liu T, Meyer CA, Eeckhoute J, Johnson DS, Bernstein BE, Nusbaum C, Myers RM, Brown M, Li W, et al. Model-based analysis of ChIP-Seq (MACS) Genome Biol. 2008;9:R137. doi: 10.1186/gb-2008-9-9-r137. [DOI] [PMC free article] [PubMed] [Google Scholar]
- Zhao X, Muller EG, Rothstein R. A suppressor of two essential checkpoint genes identifies a novel protein that negatively affects dNTP pools. Mol Cell. 1998;2:329–340. doi: 10.1016/s1097-2765(00)80277-4. [DOI] [PubMed] [Google Scholar]
- Zhao X, Rothstein R. The Dun1 checkpoint kinase phosphorylates and regulates the ribonucleotide reductase inhibitor Sml1. Proc Natl Acad Sci U S A. 2002;99:3746–3751. doi: 10.1073/pnas.062502299. [DOI] [PMC free article] [PubMed] [Google Scholar]
Associated Data
This section collects any data citations, data availability statements, or supplementary materials included in this article.
Supplementary Materials
Related to STAR method. Yeast strains used in this study.