Abstract
Strigolactones (SLs) are a group of newly identified plant hormones that control plant shoot branching. SL signalling requires the hormone-dependent interaction of DWARF 14 (D14), a probable candidate SL receptor, with DWARF 3 (D3), an F-box component of the Skp–Cullin–F-box (SCF) E3 ubiquitin ligase complex. Here we report the characterization of a dominant SL-insensitive rice (Oryza sativa) mutant dwarf 53 (d53) and the cloning of D53, which encodes a substrate of the SCFD3 ubiquitination complex and functions as a repressor of SL signalling. Treatments with GR24, a synthetic SL analogue, cause D53 degradation via the proteasome in a manner that requires D14 and the SCFD3 ubiquitin ligase, whereas the dominant form of D53 is resistant to SL-mediated degradation. Moreover, D53 can interact with transcriptional co-repressors known as TOPLESS-RELATED PROTEINS. Our results suggest a model of SL signalling that involves SL-dependent degradation of the D53 repressor mediated by the D14–D3 complex.
SLs are a group of terpenoid lactones that were first known for their function in rhizosphere parasitic and symbiotic interactions1,2. Recently, SLs have been identified as plant hormones that inhibit axillary bud outgrowth in diverse plant species3,4. Deficiencies in SL production and perception lead to excessive outgrowth of axillary buds5,6. Studies with branching mutants—more axillary growth (max) in Arabidopsis7–13, tillering dwarf mutants (d mutants) in rice14–20, ramosus (rms) in pea8,21 and decreased apical dominance (dad) in petunia22–24—have identified key players in SL biosynthesis and signalling, indicating the largely conserved mechanisms underlying the role of SL in regulating axillary bud outgrowth5,6. In addition, SLs are also involved in regulating stem secondary growth, leaf senescence, seed germination and root development6. The diverse roles of SLs enable plants to coordinate their internal developmental program and the surrounding environment5,6.
Rice tillers are specialized branches that determine grain yields and tillering is a model system for elucidating molecular mechanisms that regulate axillary buds25. In rice, three DWARF proteins (D27, D17 and D10) are enzymes required for converting all-trans-β-carotene to carlac-tone, a precursor of SLs15–17,26, whereas the other two DWARF proteins (D14 and D3) have central roles in SL perception and signalling14,18–20. D14 encodes a member of α/β-hydrolase fold family protein and is proposed to be a candidate SL receptor18–20,27,28, and D3 encodes a Leu-rich repeat F-box protein and participates in SL perception14. D14 has a canonical α/β-hydrolase fold structure and disruption of the hydrolase activity of D14 homologue DAD2 in petunia abolishes SL-induced interaction between DAD2 and PhMAX2A, one of the D3 homologues in petunia, indicating that SL-mediated interaction of DAD2 with PhMAX2A may trigger the SCF E3 ligase to target an unknown substrate for ubiquitination and degradation24,27–29. Previous study identified a dominant tillering dwarf mutant dwarf 53 (d53)30, and the D53 locus was primarily mapped to the short arm of chromosome 11 (ref.31). In this study, we show that rice DWARF 53 (D53) is an important component involved in SL signalling, in which D53 acts as a substrate of the SCFD3 ubiquitination complex and functions as a repressor of SL signalling.
Characterization of a SL signalling mutant
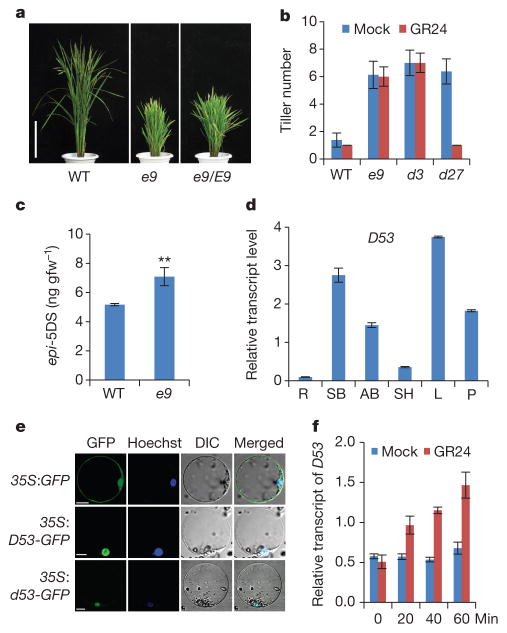
To elucidate the SL biosynthetic and signalling pathways, we have identified various tillering dwarf mutants. Among them, a dominant mutant, e9, which exhibited dwarf and high tillering phenotypes, was of particular interest (Fig. 1a and Extended Data Fig. 1a, b). Previous studies have shown that SLs can inhibit the tillering phenotype of the SL-deficient mutant d27, whereas SL signalling mutants including d3 are resistant to SL treatment4,17. Like the d3 mutant, e9 is resistant to exogenous application of GR24, a synthetic SL analogue (Fig. 1b and Extended Data Fig. 1c). The expression of D10, which is subject to a feedback regulation in the mutants defective in SL biosynthesis and signalling16, is markedly increased in e9 (Extended Data Fig. 1d). Moreover, quantitative analysis of the SLs produced in root exudates showed that 2′-epi-5-deoxystrigol (epi-5DS) in e9 was ~30% higher than that in the wild type (Fig. 1c and Extended Data Fig. 1e). These results suggested that e9 is probably involved in SL signalling rather than in SL biosynthesis.
Figure 1. D53 acts as a negative regulator in SL signalling.
a, Phenotypes of e9 mutants. Scale bars, 20 cm. b, Tiller numbers of 4-week-old seedlings of wild-type, e9, d3 and d27 treated with or without 1 μM GR24. Values are means ±s.d. (n =10). c, Comparison of epi-5DS contents in wild-type and e9 root exudates. Values are means ±s.d. (n = 3), **P <0.01 (Student’s t-test). gfw−1, per gram fresh weight. d, D53 transcript levels in various organs, including roots (R), shoot bases of seedlings (SB), axillary buds (AB), sheaths (SH), young leaves (L) and young panicles (P). Values are means with ±s.d. of three independent experiments. e, Subcellular localization of 35S:GFP (top), 35S:D53-GFP (middle) and 35S:d53-GFP (bottom) in rice protoplasts. Scale bars, 10 μm. f, D53 transcripts upon 20 μM GR24 treatment in wild-type seedlings revealed by quantitative (q)PCR. Values are means with ± s.d. of three independent experiments.
Map-based cloning of the D53 gene
To isolate the E9 gene, we took a map-based cloning approach (Extended Data Fig. 2a). E9 was pin-pointed within a 273-kilobase region between markers Ds3 and K81114 on chromosome 11, which is consistent with the reported region of the dominant dwarf and high tillering locus d53 (refs 30, 31). Sequencing of the genomic DNA from both e9 and d53 within this region revealed an identical mutation that has a 15-base-pair deletion at the third exon of LOC_Os11g01330, which results in an in-frame deletion of amino acids 813–817 (Gly-Lys-Thr-Gly-Ile) and an amino acid substitution at 812 (R to T) (Extended Data Fig. 2b). Therefore, e9 was referred to as d53 thereafter. To verify whether the mutation of LOC_Os11g01330 is responsible for the phenotype of d53, the plasmid harbouring a 7,452-base-pair genomic fragment of LOC_Os11g01330 from d53 was introduced into Nipponbare (Extended Data Fig. 2c). All the nine independent transgenic lines exhibited the same phenotype as d53 (Extended Data Fig. 2d, e). Thus the mutation of LOC_Os11g01330 is responsible for the phenotype of d53.
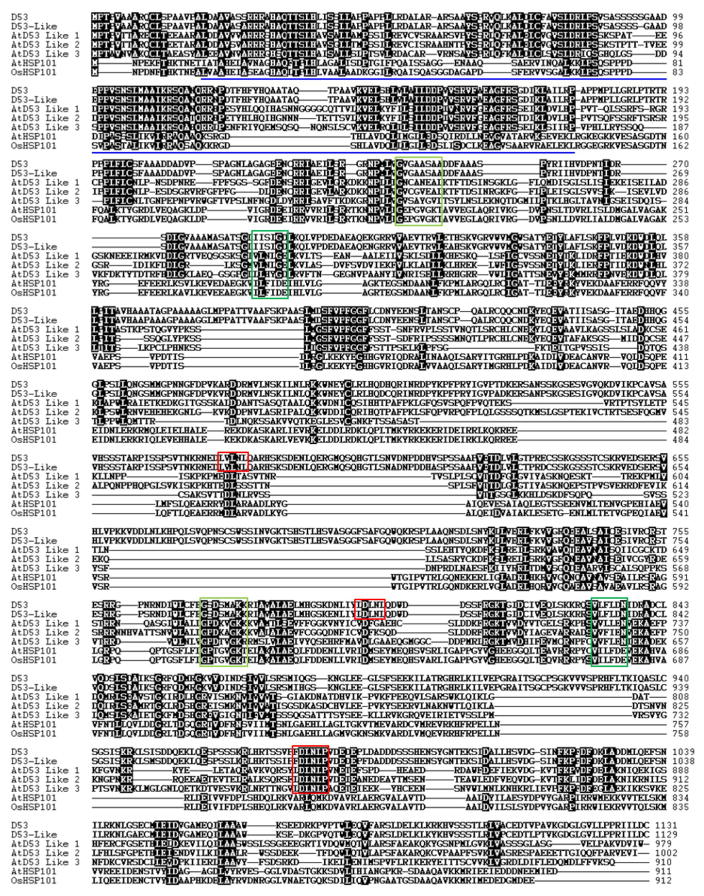
The D53 gene encodes a protein that belongs to the double Clp-N motif-containing P-loop nucleoside triphosphate hydrolase superfamily and shares 96.5% identity with LOC_Os12g01360 (D53-like) in rice and 36–41% to a subfamily of D53-like (or SUPPRESSOR OF MORE AXILLARY GROWTH2 1-LIKE (SMXL)) proteins recently identified in Arabidopsis32, which also show extended homology to HEAT SHOCK PROTEIN 101 (HSP101) (Extended Data Figs 3 and 4). In addition to the Clp homologous region, D53 also contains three putative ethylene-responsive element binding factor-associated amphiphilic repression (EAR) motifs (Extended Data Fig. 4), which have been proposed to be essential for proteins that interact with the TOPLESS class of transcriptional co-repressors in a number of plant hormone-signalling pathways33,34. D53 is mainly expressed in the shoot bases of seedlings, young leaves, axillary buds and young panicles (Fig. 1d). Subcellular localization observation revealed that both D53–green fluorescent protein (GFP) and d53–GFP were localized to nuclei, indicating that localization of the mutant protein is unaffected (Fig. 1e).
SL-mediated degradation of D53
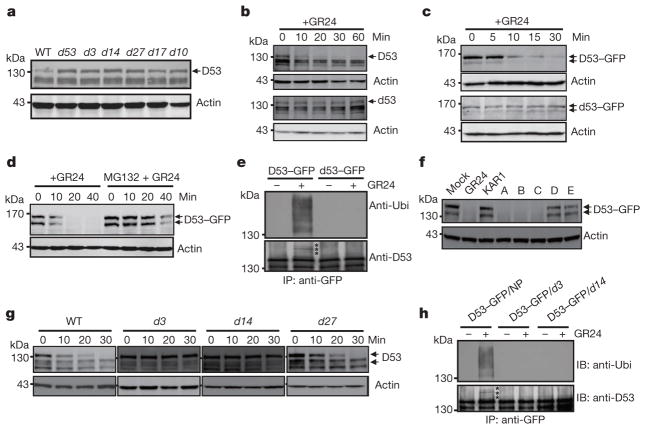
To understand the role of D53 in the SL signalling pathway, we first examined the expression of D53 in relation to SL signalling. As shown in Fig. 1f, activation of SL signalling by the treatments of GR24 in wild-type plants upregulated D53 transcription. By contrast, deficiency in SL biosynthesis and signalling as shown in d mutants resulted in down-regulation of D53 transcription (Extended Data Fig. 5), suggesting that D53 expression may be subjected to a negative feedback control of SL signalling. In parallel, we examined the D53 protein levels in d53 and other d mutants that are defective in SL biosynthesis or signalling. In contrast to the transcript levels, the protein levels were increased not only in d53, but also in all d mutants tested (Fig. 2a). Moreover, the D53 protein levels decreased rapidly upon GR24 treatment in wild-type seedlings (Fig. 2b, top panel), even though its transcription is increased (Fig. 1f). The disappearance of the corresponding D53 protein in d53 is much attenuated (Fig. 2b, bottom panel). Consistent with this, the d53–GFP protein level was not reduced in the transgenic calli by the treatments of GR24 whereas the D53–GFP protein was rapidly degraded upon GR24 treatment (Fig. 2c). However, unlike D53, the protein levels of D14–GFP and D3–GFP remained stable upon GR24 treatment (Extended Data Fig. 6). Furthermore, the GR24-induced degradation of D53 was strongly attenuated by the treatment of the proteasome inhibitor MG132 (Fig. 2d), indicating that ubiquitination might be involved in the degradation of D53. Polyubiquitination of D53–GFP, but not d53–GFP, was indeed induced by GR24 (Fig. 2e), demonstrating that D53 was polyubiquitinated and degraded via the ubiquitin proteasome system in response to GR24. Furthermore, we found that the degradation of D53 was induced by GR24 and several other SL mimics that are active in SL signalling and inhibition of shoot branching35,36, but not by the KAR1 and ABC- or D-ring of GR24, which are inactive in SL signalling35–37 (Fig. 2f and Extended Data Fig. 7). Together, these results indicate that the protein stability of D53 is negatively correlated with the signalling status of the SL pathway, leading us to propose that D53 could function as a repressor of SL signalling. This hypothesis is consistent with the dominant phenotype of d53, in which the mutated protein is insensitive to SL-mediated degradation.
Figure 2. SL-induced D53 degradation by the ubiquitin proteasome system.
a, Protein levels of D53 in seedlings of wild-type and d mutants detected by immunoblotting with anti-D53 antibodies. b, D53 protein levels in 3-week-old seedlings of the wild type (top) and d53 mutant (bottom) upon 10 μM GR24 treatment detected by immunoblotting with anti-D53 antibodies. c, Protein levels of D53–GFP in calli of Act:D53-GFP and Act:d53-GFP transgenic lines at different time points of GR24 (5 μM) treatment, as detected by immunoblotting with anti-GFP antibody. d, D53–GFP protein levels at different time points of GR24 treatment (10 μM) in the presence or absence of MG132 (50 μM), as detected by immunoblotting with anti-GFP antibody. e, Analysis of D53–GFP and d53–GFP ubiquitination in response to GR24 (10 μM) treatment. Top, immunoblot with anti-ubiquitin (Ubi) antibody. Bottom, immunoblot with anti-D53 antibodies. Asterisks indicate ubiquitinated D53–GFP proteins. f, D53–GFP protein levels in Act:D53-GFP transgenic calli treated with 10 μM GR24, KAR1 or SL mimics, as detected by immunoblotting with anti-GFP antibody. A, 4-[(2,5-dihydro-4-methyl-5-oxo-2-furanyl)oxy]benzonitrile; B, 5-(4-bromophenoxy)-3-methyl-2(5H)-furanone; C, 5-(4-iodophenoxy)-3-methyl-2(5H)-furanone; D, 3,3a,4,8b-tetrahydro-3-(hydroxymethylene)-2H-Indeno[1,2-b]furan-2-one (ABC rings of GR24); E, 5-hydroxy-3-methyl-2(5H)-furanone (D ring of GR24). g, D53 protein levels in calli of wild-type, d3, d14 and d27 upon 5 μM GR24 treatment at different time points, detected by immunoblotting with anti-D53 antibodies. h, Analysis of D53–GFP ubiquitination in d14 and d3 under GR24 (10 μM) treatment. Top, immunoblotting with a monoclonal anti-ubiquitin antibody. Bottom, immunoblotting with anti-D53 antibodies. Asterisks indicate ubiquitinated D53–GFP. Actin contents were used as loading controls in all the immunoblotting analyses. NP, Nipponbare.
Formation of a D14–D3–D53 complex
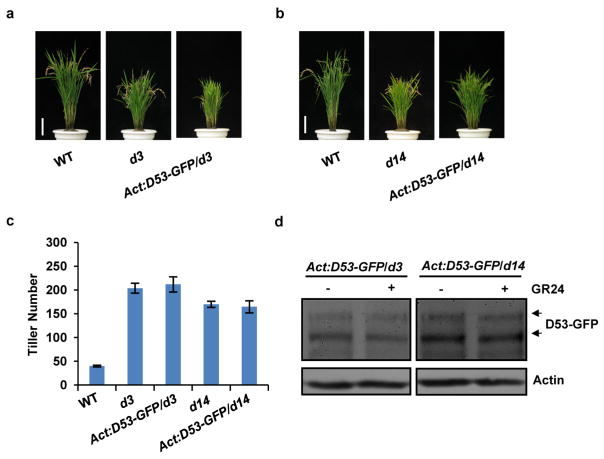
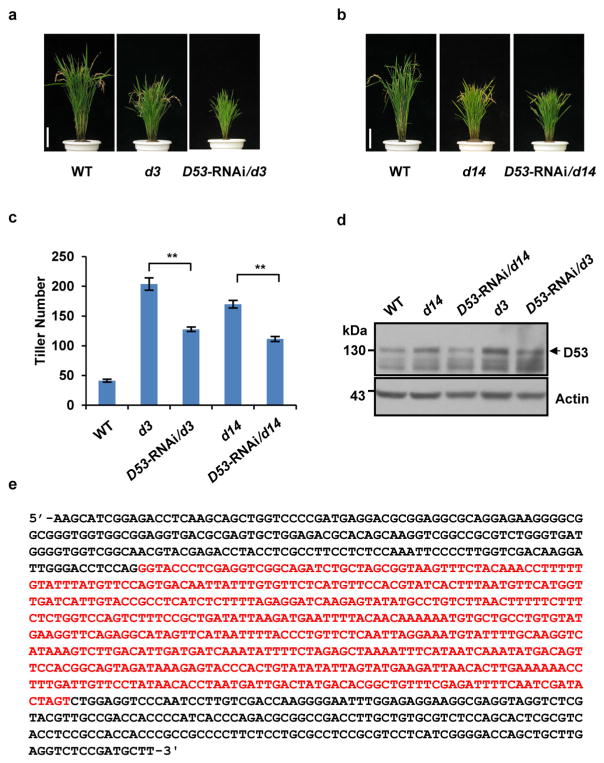
To understand the relationship between D53 and other two SL signalling components, D3 and D14, we constitutively expressed D53-GFP or knocked down the D53 expression level in d3 and d14 mutants, respectively. The results showed that overexpression of D53-GFP had little effect on the phenotypes of d3 and d14 (Extended Data Fig. 8a–c), whereas the decreased expression of D53 obviously reduced the tiller number of d3 and d14, respectively (Extended Data Fig. 9), indicating that the reduction of D53 expression could partially rescue the signalling defects of d3 and d14 and that the result is consistent with its negative role in SL signalling. In addition, D53–GFP could not be degraded in d3 and d14 plants even in the presence of GR24 (Extended Data Fig. 8d). These results suggest that D53 may act downstream of D3 and D14. Moreover, when GR24 was applied, degradation of D53 was detected in the wild-type and SL-biosynthesis mutant d27, but not in d3 and d14 (Fig. 2g). Importantly, the ubiquitination of D53 could also be detected in the D53–GFP transgenic plants in the wild type but not in the background of d3 and d14 (Fig. 2h). Taken together, these results demonstrate that SL-induced degradation of D53 is dependent on intact functions of D3 and D14.
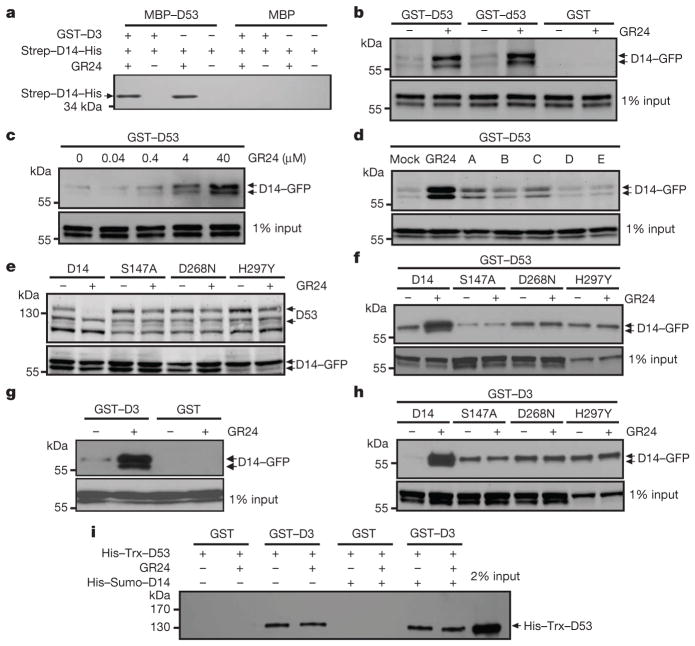
To unravel the underlying mechanism of D53 as a repressor in SL signalling, we first examined whether D53 can interact with D14. As shown in Fig. 3a, b, D53 was shown to interact with D14 by pull-down assay. Notably, the d53 protein was still able to interact with D14, indicating that the mutation sites in d53 may be essential for ubiquitination and stability of D53, but not for its interaction with D14 (Fig. 3b). Importantly, the interaction between D53 and D14 was enhanced by GR24 in a dose-dependent manner (Fig. 3c). In addition, active SL mimics could also enhance the interaction between D53 and D14 (Fig. 3d), which is consistent with their biological functions. To address whether the hydrolase activity of D14 is required for the degradation of D53 and its interaction with D53, we mutated the sites of the Ser-His-Asp catalytic triad and found that mutation at any site of the triad could attenuate the SL-induced degradation of D53 (Fig. 3e) and weaken the interaction between D53 and D14 (Fig. 3f). These results indicate that the perception of SL by D14 is essential for the SL-induced degradation of D53.
Figure 3. Interactions among D3, D14 and D53.
a, In vitro pull-down assay using maltose-binding protein (MBP)–D53, GST–D3 and Strep–D14–His recombinant proteins in the presence or absence of 10 μM GR24. b, Pull-down assays using recombinant GST–D53 or GST–d53 and lysates prepared from Act:D14-GFP/d14 calli in the absence or presence of 20 μM GR24. c, Pull-down assay using recombinant GST–D53 and lysates prepared fromAct:D14-GFP/d14 calli in the presence of GR24 at indicated concentrations. d, Pull-down assay using recombinant GST–D53 and lysates of Act:D14-GFP/d14 calli treated with 20 μM GR24 or SL mimics. e, D53 levels in the 10 μM-GR24-treated calli transformed with D14 mutated at the Ser-His-Asp catalytic triad sites, revealed by immunoblotting with anti-D53 antibodies. D14, Act:D14-GFP/d14; S147A, Act:D14(S147A)-GFP/d14; D268N, Act:D14(D268N)-GFP/d14; H297Y, Act:D14(H297Y)-GFP/d14. f, Pull-down assay using recombinant GST–D53 and lysates of the calli transformed with D14 mutated at its catalytic triad sites in the absence or presence of 20 μM GR24. g, Pull-down assay using recombinant GST–D3 and lysates of Act:D14-GFP/d14 calli in the absence or presence of 20 μM GR24. h, Pull-down assay using recombinant GST–D3 and lysates of transgenic calli transformed with D14 mutated at its catalytic triad sites in the absence or presence of 20 μM GR24. i, Pull-down assay using recombinant GST–D3 and His–Trx–D53 in the absence or presence of 5 μM GR24 or His–Sumo–D14 recombinant proteins. The D14 recombinant proteins in a were detected with anti-His antibody, GFP-fusion proteins in (b–d and f–h) were revealed with anti-GFP antibody, and His–Trx–D53 was detected with anti-D53 antibodies.
We then tested whether the perception of SL requires the interaction between D3 and D14 by performing a pull-down assay. As shown in Fig. 3g, D14–GFP was co-purified with the GST–D3 fusion protein and GR24 could enhance the interaction. Similar to the interaction between D14 and D53, any mutation in the Ser-His-Asp catalytic triad of D14 could also weaken the GR24-induced interaction between D3 and D14 (Fig. 3h), consistent with previous study in petunia24.
The findings indicating that D14 can interact with both D53 and D3 suggest that D53 may also interact with D3. As shown in Fig. 3i, the histidine (His)–thioredoxin (Trx)–D53 protein could interact with GST–D3 in the in vitro pull-down assay with or without the presence of His–small ubiquitin-like modifier (Sumo)–D14 and GR24, suggesting that D53 could be directly targeted by D3 and that hormone-dependent association of D14 with D3 and D53 could trigger D53 ubiquitination and degradation.
Interaction of D53 with TPR proteins
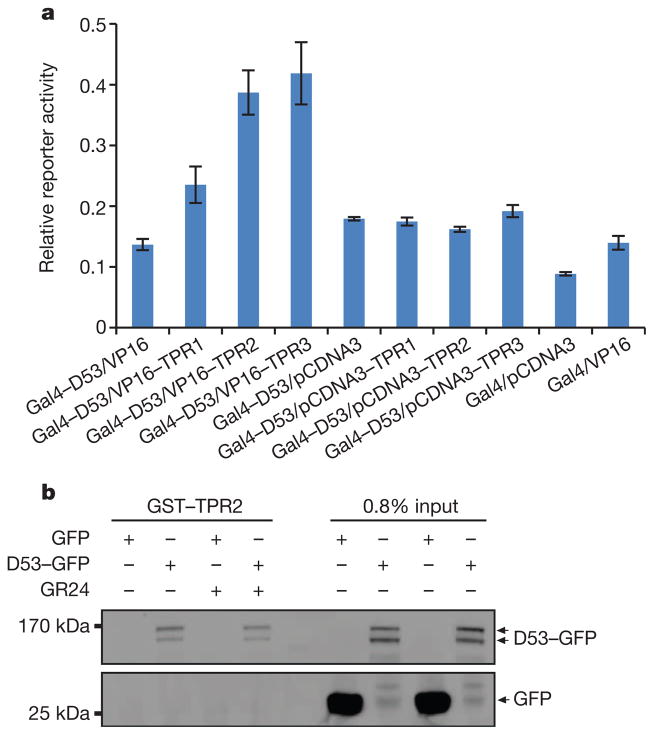
TOPLESS (TPL) and TPL-related proteins (TPRs) have been reported to function as co-repressors in various plant hormone signalling and developmental pathways33,34,38,39. The EAR motif is a hallmark of the TPL and TPR interaction proteins33,34,38,39. Scanning of the D53 amino acid sequence revealed that D53 harbours three possible EAR motifs: 578Leu-Val-Leu-Asn-Leu582 (EAR1), 799Leu-Asp-Leu-Asn-Leu803 (EAR2) and 976Phe-Asp-Leu-Asn-Leu-Pro981 (EAR3) (Extended Data Fig. 4). There are three TPL/TPR proteins in rice, namely TPR1(LOC_Os01g15020), TPR2 (LOC_Os08g06480) and TPR3 (LOC_Os03g14980). Among them, TPR2 (also known as ASP1, OsREL2 or OsLIS-L1) has been reported to function in tiller and spikelet development40–42. As shown in Fig. 4a, the interactions between D53 and rice TPR proteins were detected by two-hybrid assays in mammalian cells, and the interaction between D53 and TPR2 was further verified by a pull-down assay (Fig. 4b). These results suggest that TPR proteins may be the downstream regulators of SL signalling.
Figure 4. Interaction of D53 with TPR proteins.
a, Mammalian two-hybrid assays showing interaction of D53 with TPR proteins. Values are means ±s.d. of three independent experiments. VP16, herpes simplex virus virion protein 16. b, Pull-down assay for GST–TPR2 and lysates of Act:D53-GFP calli in the absence or presence of 10 μM GR24. D53–GFP and GFP were detected with the monoclonal anti-GFP antibody.
Discussion
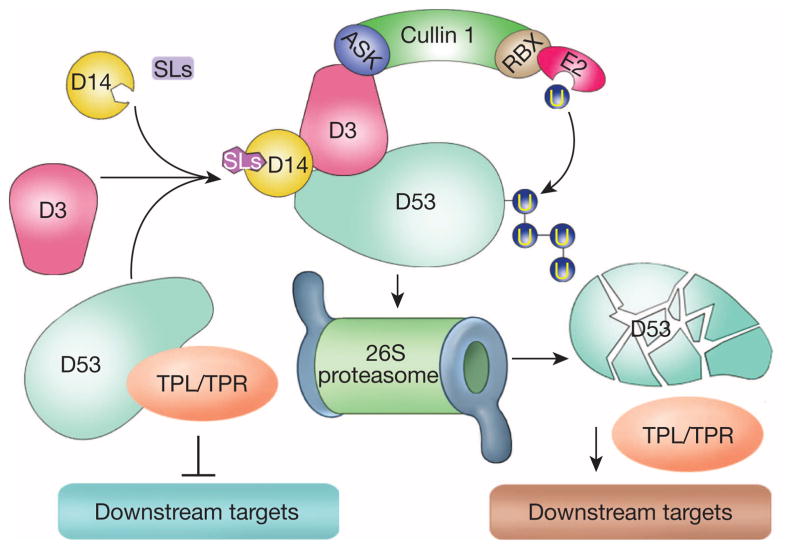
In this study, we have identified the D53 gene that encodes a substrate of the SCFD3 ubiquitination complex, and revealed that D53 functions as a repressor of SL signalling. These results allow us to establish a model of SL signalling that is centred around a D14–D3–D53 signalling axis (Fig. 5). In the presence of SLs, perception of SL by D14 and the SCFD3 complex leads to ubiquitination of D53 and its subsequent degradation by the ubiquitin proteasome system, which in turn releases the repression of downstream target genes (Fig. 5). In the d53 plant, the mutated D53 protein is resistant to ubiquitination and degradation, leading to the accumulation of d53, which blocks SL signalling and results in dwarf and high tillering phenotypes. The signalling paradigm of SLs is still emerging as SLs are a relatively new class of plant hormone for which many knowledge gaps still exist. Identification of D53 as a repressor of SL signalling adds a critical piece of information that helps to paint the whole picture of the SL signalling pathways.
Figure 5. A proposed model of D53 action.
In the absence of SLs, D53 is stable and may recruit TPL/TPR proteins and repress downstream responses. In the presence of SLs, perception of SL leads to SCFD3-mediated ubiquitination of D53 and its subsequent degradation by the proteasome system, which in turn releases the repression of downstream responses.
Moreover, our work has also provided an important paradigm for understanding signalling pathways of other plant hormones, for example, karrikins, a class of plant growth regulators found in the smoke of burning plants37. Karrikin signalling involves MAX2 and KAI2, a D14-like α/β-hydrolase13,37. It is probable that a similar protein to D53 could serve as the repressor of karrikin signalling. Indeed, multiple D53-like proteins are found in rice and in Arabidopsis32. We propose that these proteins could serve as repressors of signalling by karrikin and other plant hormones, in a similar way to D53 in SL signalling.
METHODS
Plant materials
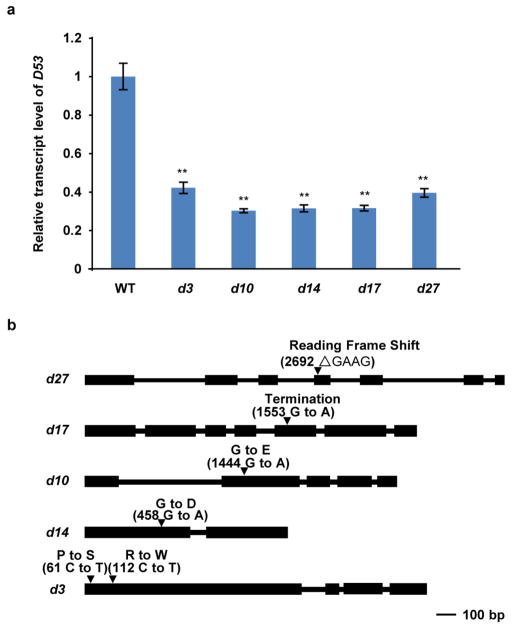
A naturally occurring rice mutant e9 was isolated from a Nipponbare (Oryza sativa L. ssp. japonica) population in Hangzhou, China in 2005. The e9 mutant was then backcrossed to Nipponbare four times. Cloning and sequencing of e9 indicated that it has an identical mutation to d53, suggesting that e9 might originally have resulted from a natural pollination by d53-carrying plants30,43 in the field. All other d mutants/alleles in the Nipponbare background (d27, d17, d10, d14 and d3) used in this study were isolated by our laboratory and the mutation sites of the mutants are shown in Extended Data Fig. 5b.
Map-based cloning
To map the e9 locus, e9 mutant plants were crossed to NJ06 (indica) and 142 recessive individual plants showing normal tillering phenotype from F2 populations were used for primary mapping. E9 was pin-pointed to the region between makers Ds3 and K81114 (Extended Data Fig. 2a and Supplementary Table 1), which is consistent with the mapping result of the previously reported D53 locus31. To find out the mutation site, we amplified the corresponding fragments from e9 and d53, respectively. The average length of the PCR products was 1.5 kb. By comparison of the sequence between e9 and d53, only one mutation in the exon was identified in both e9 and d53.
Rice hydroponic culture
Rice seeds were de-hulled and sterilized with 2.5% (v/v) sodium hypochlorite for 30 min, rinsed five times with sterile water, and then germinated for 30 h in sterile water at 37 °C in darkness. Germinated seeds were transferred into a hydroponic culture medium (pH 5.5) and cultured at 28 °C, 70% relative humidity under fluorescence white light (150–200 μM m−2 s−1) with a 16 h light/8 h dark photoperiod for 5 days, and grown under the same condition in hydroponic culture medium without Pi for an additional 14 days (total 3 weeks). The hydroponic solution was renewed every 3 days.
SL analysis
SL analyses in rice root exudates were performed according to the previously described method with minor modifications4,17. For each sample, 50 ml hydroponic culture medium from total 500 ml was loaded to a pre-equilibrated Oasis HLB 3cc cartridge (Waters) after adding 1 ng d6-5DS as an internal standard and the column was washed with de-ionized water. The SLs-containing fraction was eluted with acetone, collected and dried up under nitrogen gas, then reconstituted in acetonitrile and subjected to UPLC–MS/MS analysis, which consists of a triple quadruple tandem mass spectrometer (Quattro Premier XE; Waters) and an Acquity Ultra Performance Liquid Chromatograph (Acquity UPLC; Waters) equipped with a reverse phase column (BEH-C18, 2.1 ×100 mm, 1.7 μm; Waters). The gradient started with 50% mobile phase A (99.5% H2O plus 0.5% acetic acid) and increased mobile phase B (99.5% ACN plus 0.5% acetic acid) from 50% to 70% in 5 min at 25 °C with a flow rate of 0.4 ml min−1. MS parameters were set to the following values: desolvation gas flow, 800 l h−1; capillary voltage, 3.8 kV; cone voltage, 24 V; desolvation temperature, 350 °C; source temperature, 110 °C; collision energy, 14 V, using multiple reaction monitoring (MRM) 331 >216 transition for the epi-5DS detection and MRM 337 >222 transition for the d6-5DS detection. Data were analysed with MassLynx software (V.4.1). The epi-5DS concentrations of rice exudates were calculated by comparing the MRM relative response of epi-5DS with the d6-5DS ones then divided by the fresh rice roots weight. The peak area values of epi-5DS versus the internal standard in the wild type were 55.9 versus 231.1, 51.7 versus 204.63 and 40.8 versus 162.8. The peak area values of epi-5DS versus the internal standard in e9 were 68.5 versus 246.9, 57.3 versus 169.3 and 74.3 versus 241.4. The fresh root weights of the wild type and e9 mutant were 0.48 g and 0.43 g, respectively. The epi-5DS concentrations of rice exudates were calibrated by comparing the MRM relative response of epi-5DS with that of d6-5DS and multiplying by the dilution ratio (500:50) and then dividing by the fresh rice root weight.
Plasmid construction and transformation
To construct the D53:d53 plasmid, a 7,452-base pair (bp) genomic fragment from the 1,769-bp 5′-upstream sequence to the 1,002-bp 3′-downstream was amplified using primers d53GenF and d53GenR (Supplementary Table 2), digested with BamHI and HindIII, and cloned into the binary vector pCAMBIA1300. No additional mutation was found by sequencing. To construct the Act:D53-GFP and Act:d53 -GFP plasmids, the full-length coding sequences of D53 and d53 were amplified using primers ActD53GFPF and ActD53GFPR (Supplementary Table 2), digested by ApaI and SpeI, and then ligated into the binary vector AHLG. To generate the plasmids of Act:D3-GFP and Act:D14-GFP, the full-length coding sequences of D3 and D14 were amplified with primers ActD3GFPF and ActD3GFPR, ActD14GFPF and ActD14GFPR, respectively (Supplementary Table 2). Two insertions were digested by AapI and XbaI, and ligated into the binary vector AHLG. TheAct:D14(S147A)-GFP, Act:D14(D268N)-GFP and Act:D14(H297Y)-GFP plasmids were derived from pAct:D14-GFP by site-directed mutagenesis (Supplementary Table 2). To generate the D53-RNAi plasmid, two inverted fragments of D53 were amplified by two pairs of primers (D53RNAi1F and D53RNAi1R; D53RNAi2F and D53RNAi2R), digested by BamHI/ KpnI and SacI/SpeI, and cloned into pTCK303 (ref. 44). All plasmids were introduced into Agrobacterium tumefaciens strain EHA105 and transformed into indicated rice recipients as reported previously45.
qPCR
Total RNAs from various organs were extracted using a TRIzol kit according to the user’s manual (Invitrogen). Total RNAs (2.5 μg) were treated with DNase I and used for complementary DNA synthesis with Superscript III RT kit (Invitrogen). qPCR experiments were performed with gene-specific primers D53RT and D10RT (Supplementary Table 1) in the reaction system of SsoFast EvaGreen supermix (Bio-Rad) on the CFX96 Real-time system (Bio-Rad) following the manufacturer’s instructions. The rice actin gene was used as an internal control.
Protoplast transient expression assay
To generate 35S:D53-GFP and 35S:d53-GFP plasmids, full-length coding sequences of D53 and d53 were amplified using primers 35SD53GFPF and 35SD53GFPR (Supplementary Table 2), digested by BamHI and HindIII, and inserted into the vector pBI221. The plasmids of 35S:GFP, 35S:D53-GFP and 35S:d53-GFP were introduced into rice leaf protoplasts as described46. After overnight incubation in the dark at 28 °C, nuclei were stained with Hoechst 33342 as described47. The signals of GFP and Hoechst 33342 were observed under a confocal microscope at excitation wavelengths of 488 and 405 nm, respectively (FluoView 1000; Olympus).
Antibody preparation
A DNA fragment encoding D53 amino acid residues 251–700 amplified by primers D53 antigen F and D53 antigen R (Supplementary Table 2) was cloned into pDONR222 by integrative reaction (Invitrogen) and then to the destination vector pET-55-DEST (Invitrogen) by excisive reaction. The recombinant protein was expressed in E. coli BL21 cells and purified by Ni-sepharose (GE Healthcare). The purified proteins were used to raise polyclonal antibodies in rabbit and the anti-D53 serum was affinity purified before use. 1:1,000 ~1:2,000 dilution of the antibody was used for protein blotting. The specificity of D53 antibodies was confirmed by western blot analysis with Act:D53–GFP transgenic seedlings (Extended Fig. 10).
Chemical treatment of rice seedlings and calli
To detect D53 degradation, seedlings were grown on hydroponic solution (pH 5.5)48 in a greenhouse for 3 weeks. After the treatment with 10 μM GR24 (Chiralix), shoot bases were collected and frozen at −80 °C until protein gel blot analysis. For detecting D53 abundance, calli of wild-type and transgenic lines were cultured on solid medium49 for 6 days at 28 °C and then transferred into a liquid medium50. After treatment with the indicated concentrations of GR24 or other SL-like chemicals, calli were collected at the times indicated and frozen at −80 °C until immunoblotting.
In vivo ubiquitination assay
Transgenic calli of Act:D53-GFP, Act:d53-GFP, Act:D53-GFP/d3 and Act:D53-GFP/d14 were cultured on solid medium49 for 6 days at 28 °C and then transferred into a liquid medium50. The calli were pre-treated with 50 μM MG132 (Calbiochem) for 1 h and then supplemented with or without 10 μM GR24 for 3 min. Total proteins were extracted in the extraction buffer (50 mM sodium phosphate buffer, pH 7.0, 150 mM NaCl, 10% glycerol, 0.1% NP-40, 50 μM MG132, 1 × complete protease inhibitor cocktail). The lysates were centrifuged at 18,000g for 20 min at 4 °C. The supernatant was taken for immunoprecipitation experiments. In brief, 30 μl of anti-GFP monoclonal antibody-conjugated agarose (MBL) was added into 1.5 ml total extracted proteins and incubated at 4 °C for 3 h with gentle rotation. The beads were washed three times with the extraction buffer without NP-40 and then eluted with 30 μl of the SDS–PAGE sample buffer for protein blotting. Mouse anti-ubiquitin monoclonal antibody (Cell signaling) was used at a 1:3,000 dilution and rabbit anti-D53 polyclonal antibodies were used at a 1:2,000 dilution.
Preparation of recombinant proteins
To prepare different tag-fused D53 recombinant proteins, various expression vectors were constructed. To construct the GST–D53 plasmid, a synthesized codon-optimized D53 coding sequence was inserted into the vector pGEX-6p-1 (GE healthcare). To construct the MBP–D53 plasmid, the full-length coding sequence (CDS) of D53 was amplified from rice cDNAs by primers MBPD53F and MBPD53R (Supplementary Table 2), digested with BamHI and HindIII, and inserted into the vector pMAL-c2x. To construct the His–Trx–D53 plasmid, the full-length codon-optimized CDS of D53 coding sequence was digested with BamHI and NotI and inserted into the vector His–Trx. To construct the GST–D3 plasmid, the full-length CDS of D3 was amplified by primers GST–D3F and GST–D3R (Supplementary Table 2), digested by EcoR I and SalI, and inserted into the vector pGEX-6p-1. To construct the Strep–D14–His plasmid, the full-length CDS of D14 was amplified by primers StrepD14-HISF and StrepD14-HISR (Supplementary Table 2), cloned into pDONR222 by BP reaction (Invitrogen), and then recombined to pET-55-DEST by LR reaction (Invitrogen). To construct the plasmid that expresses GST–TPR2 (LOC_Os08g06480), the coding sequence of TPR2 was synthesized, sub-cloned into pDONR222 by BP reaction (Invitrogen), and recombined to pET-60-DEST by LR reaction (Invitrogen). To produce recombinant proteins, each expression plasmid constructed above was introduced into E. coli BL21 (DE3) cells. In brief, bacterial cells were cultured in the 2YT broth at 37 °C to reach 0.8 (OD600) and then continuously cultured at 16 °C for 15 h after adding 1 mM isopropyl-β-D-thiogalactopyranoside (IPTG). Cells were collected and lysed by JNBIO high pressure homogenizer (Beijing, Shunxinwangchang Co) at 4 °C. Lysates of the above recombinant proteins were centrifuged at 16,000g for 30 min and the supernatants were loaded onto a 5-ml GSTrap HP column (GE healthcare), MBPTrap HP column (GE healthcare) or HisTrap HP column (GE healthcare) according to their fused-tags. The purified recombinant proteins finally desalted by a PD-10 column (GE healthcare).
Pull-down assays
Total proteins were extracted from calli treated with or without GR24 before collection by extraction buffer (50 mM sodium phosphate buffer, pH 7.0, 150 mM NaCl, 10% glycerol, 0.1% NP-40, 50 μM MG132, 1 ×complete protease inhibitor cocktail) and cell debris was removed by centrifugation at 17,000g for 20 min at 4 °C. For the GST–D53, GST–D3 or GST–TPR2 pull-down assay, 0.5–1 μg glutathione agarose-bound GST fusion proteins were added to the crude extract and incubated at 4 °C for 2 h with gentle rotation. Glutathione beads (GE healthcare) were collected by brief centrifugation, washed three times in the above buffer without NP-40, then re-suspended in SDS–PAGE sample buffer and subjected to SDS–PAGE electrophoresis and immunoblotting. For an in vitro MBP–D53 pull-down assay, ~0.3 μg recombinant MBP–D53 proteins bound to MBP beads were incubated with ~0.2 μg Strep–D14–His or Strep–D14–His plus GST–D3 (~0.2 μg each) at 4 °C for 2 h, and washed three times with PBS. GFP fusion proteins were detected by a monoclonal anti-GFP antibody (Roche) and Strep–D14–His by a monoclonal anti-His antibody (Abmart). For an in vitro GST–D3 pull-down assay, 12 μg recombinant GST–D3 protein bound to glutathione beads and incubated with ~1 μg His–Trx–D53 with or without 5 μM GR24 and His–Sumo–D14 (~10 μg each) at 4 °C for 15 min, and washed four times with PBS. His–Trx–D53 was detected by anti-D53 antibodies.
Mammalian two-hybrid assay
To construct the Gal4–D53 plasmid, the D53 full-length CDS was generated from pUC57-D53 (synthesized codon-optimized D53 cDNA in the pUC plasmid) digested with EcoRI and XhoI, and ligated into the EcoRI/SalI double-digested Gal4 plasmid pM (Clontech). To construct VP16–TPR1, VP16–TPR2 and VP16–TPR3, full-length coding sequences of TPR1, TPR2 and TPR3 were yielded from pLexA-N-fusion plasmids (synthesized codon-optimized TPR cDNAs in the pLexA-N plasmid), and inserted into EcoRI/SalI double-digested pVP16 (Clontech). The pcDNA3-derived plasmids were constructed by inserting EcoRI/SalI-digested TPR1, TPR2 and TPR3 into EcoRI/XhoI-digested pcDNA3. Gal4-fusion constructs (25 ng) were co-transfected with VP16-fusion constructs (25 ng), together with 100 ng pG5-Luc, 5 ng phRG-TK/Renilla (Promega) into AD293 cells in the 24-well-plate via Fugen6 (Promega) according to the manufacturer’s manual. Cells were collected 24 h after transfection with 1 ×passive lysis buffer (Promega). Luciferase/Renilla activities were measured with the Dual Luciferase Kit (Promega) and data were plotted as relative activities (Luciferase activity:Renilla activity).
Extended Data
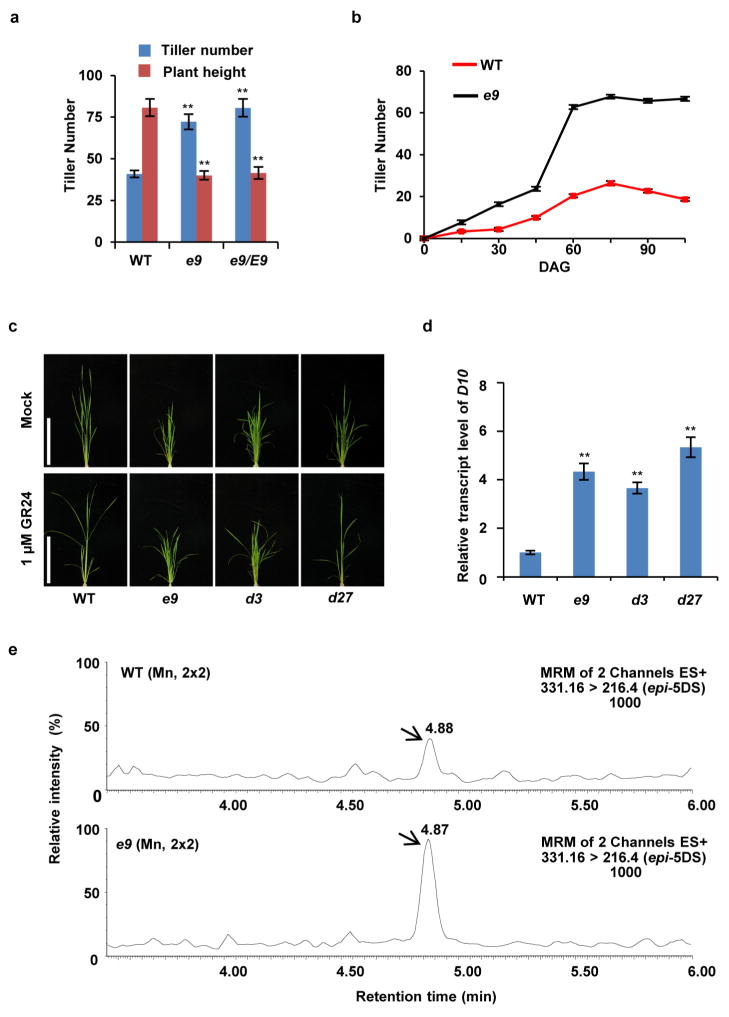
Extended Data Figure 1. Characterization of the e9 mutant.
a, Tiller number and plant height of wild-type, homozygous and heterozygous e9 plants at the heading stage. Values are means ±s.d. (n = 8). The double asterisks represent significant difference determined by the Student’s t-test at P <0.01. b, Kinetic comparison of tiller numbers between wild-type and e9 plants at different developmental stages. Values are means ±s.d. (n = 8). DAG, days after germination. Rice plants (a and b) were cultivated in the field in Beijing in the natural growing season. c, Four-week-old seedlings of wild-type, e9, d3 and d27 upon 1 μM GR24 treatment. Scale bars, 10 cm. Ten individual plants for each material were treated with GR24. d, The expression levels of the D10 gene revealed by qPCR in wild-type, e9, d3 and d27 mutant seedlings. Values are means ±s.d. (n = 3). The double asterisks represent significant difference determined by the Student’s t-test at P <0.01. e, The representative LC/MS–MS chromatograms for epi-5DS in root exudates of wild type and e9 before calibration against an internal standard.
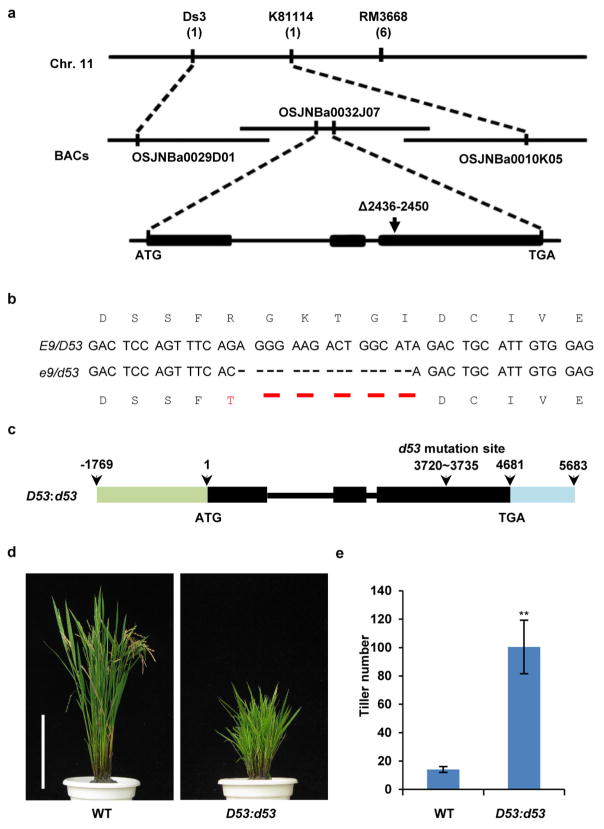
Extended Data Figure 2. Cloning and confirmation of E9/D53.
a, E9 was mapped in the interval between molecular markers Ds3 and K81114 on chromosome 11 using 142 recessive individual plants showing normal tillering phenotype from an F2 population. Numbers under the markers indicate recombinants. b, E9/D53 mutation sites in e9/d53 in the coding region and its amino acid changes. c, Schematic diagram of D53:d53 constructs. d, Phenotypes of wild-type and D53:d53 transgenic plants at the mature stage. Scale bar, 20 cm. Nine independent transgenic lines showed the similar tillering and dwarf phenotypes. e, Comparison of tiller numbers between wild-type and D53:d53 transgenic plants at the mature stage. Values are means ±s.d. (n = 15). The double asterisks represent significant difference determined by the Student’s t-test at P <0.01. The plants were grown in the field in Beijing in the natural growing season.
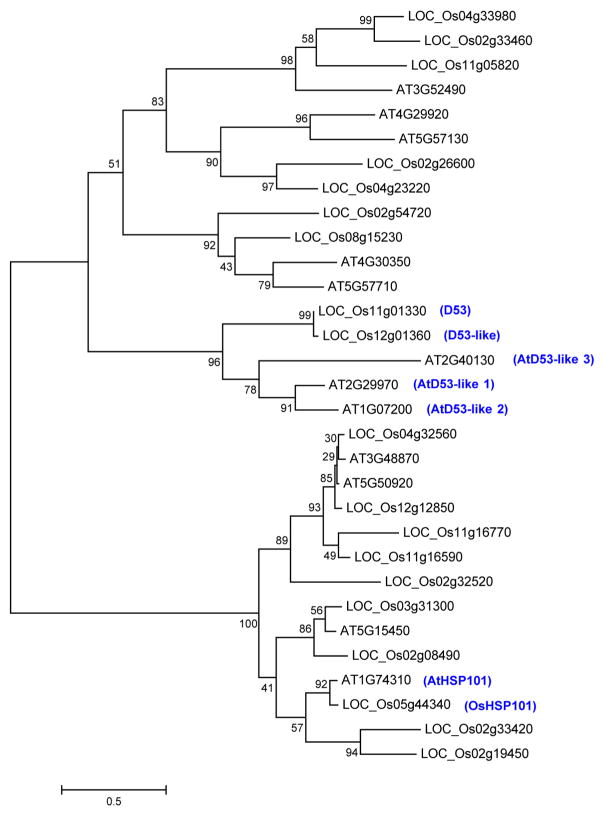
Extended Data Figure 3. Phylogenetic tree of D53-like family proteins in rice and Arabidopsis.
BlastP was done using the D53 protein sequence against all rice and Arabidopsis proteins at the MSU Rice Genome Annotation Project. In the BlastP result, rice proteins were filtered using cut-off E value <0.1 plus top query coverage >10% and Arabidopsis proteins were filtered using cut-off E value <0.0005. Multiple sequence alignment of the protein sequences was done using Clustalw2. Maximum-likelihood phylogenetic tree was drawn by MEGA 5.05 using default parameters with 100 times bootstrapping. Numbers above the branches represent bootstrap support based on 100 bootstrap replicates. Branch length represents substitutions per site.
Extended Data Figure 4. Alignment of D53 and D53-like proteins in rice and Arabidopsis.
The graphic view of alignment was generated by BioEdit using Clustalw for multiple sequence alignment of protein sequences. Blue underline refers to the Double Clp-N domain, light green to atypical walker A motifs, dark green box to walker B motifs and red boxes to putative EAR motifs. D53, Os11g01330; D53-like, Os12g01360; AtD53-like 1, At1g07200; AtD53-like 2, At2g29970; AtD53-like 3, At2g40130; AtHSP101, At1g74310; OsHSP101, Os05g44340.
Extended Data Figure 5. D53 expression levels in d mutants and the mutation sites in other d mutants used in this study.
a, Expression levels of D53 revealed by qPCR in wild-type, d3, d10, d14, d17 and d27 seedlings. Values are means with s.d. of three independent experiments. The double asterisks represent significant difference determined by the Student’s t-test at P <0.01. b, The mutation sites in other d mutants identified in this study.
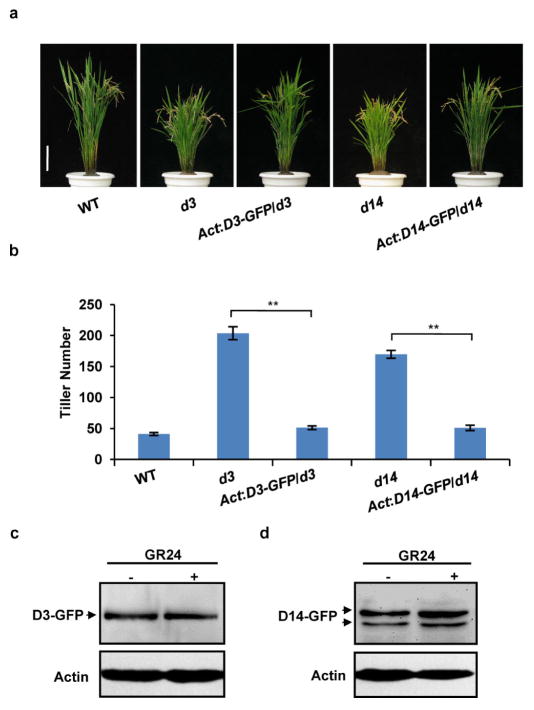
Extended Data Figure 6. D3 and D14 protein levels are unaffected by GR24 treatment.
a, Phenotypes of mature transgenic plants of D3-GFP and D14-GFP in the d3 or d14 background, respectively, showing that D3–GFP and D14–GFP can rescue the corresponding phenotypes of d3 and d14. Scale bar, 10 cm. Five independent transgenic lines were shown to have similar phenotypes. b, Comparison of the tiller number of transgenic plants of D3-GFP/d3 and D14-GFP/d14. Values are means ±s.d. (n = 5). The double asterisks represent significant difference determined by the Student’s t-test at P <0.01. c, D3–GFP abundance in d3 treated with 10 μM GR24 for 60 min. Protein level was analysed by immunoblotting using GFP antibody. d, The D14–GFP protein level in the d14 background as analysed by immunoblotting using GFP antibody. Transgenic plants of D14-GFP in the d14 background were treated with 10 μM GR24 for 60 min. Rice plants (T2 generation) were grown in the field in Hainan province.
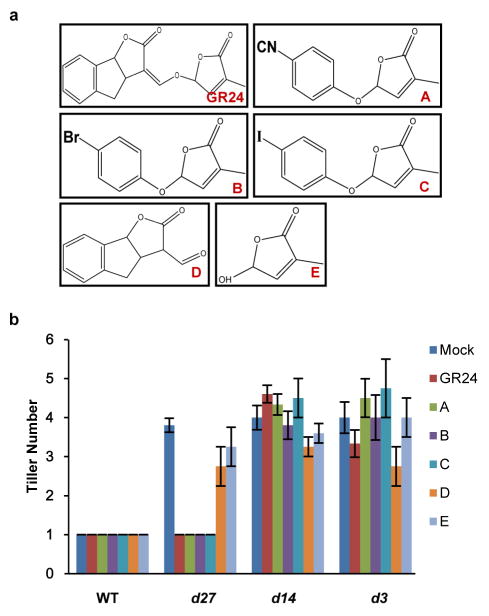
Extended Data Figure 7. Effects of GR24 and SL mimics on rice tillering.
a, Chemical structures of GR24 and SL mimics. A, 4-[(2,5-dihydro-4-methyl-5-oxo-2-furanyl)oxy]benzonitrile; B, 5-(4-bromophenoxy)-3-methyl-2(5H)-furanone; C, 5-(4-iodophenoxy)-3-methyl-2(5H)-furanone. D, 3,3a,4,8b-tetrahydro-3-(hydroxymethylene)-2H-Indeno[1,2-b]furan-2-one (ABC rings of GR24); E, 5-hydroxy-3-methyl-2(5H)-furanone (D ring of GR24). b, Effects of 1 μM GR24 and SL mimics on tillering of 4-week-old seedlings. Values are means ±s.d. (n = 5).
Extended Data Figure 8. Phenotypes of transgenic plants of constitutively expressed D53–GFP in d3 and d14.
a, Phenotypes of wild-type, d3 and Act:D53-GFP/d3 transgenic plants at the mature stage. Scale bar, 10 cm. Six independent transgenic lines showed similar phenotypes. b, Phenotypes of wild-type, d14 and Act:D53-GFP/d14 transgenic plants at the mature stage. Scale bar, 10 cm. Six independent transgenic plants showed similar phenotypes. c, Tiller numbers of Act: D53-GFP/d14 and Act:D53-GFP/d3 transgenic plants at the mature stage. Values are means ±s.d. (n =8). d, The D53–GFP abundance in d3 or d14 plants treated with 10 μM GR24 for 60 min. Protein levels were analysed by immunoblotting using GFP antibody. Rice plants (T1 generation) were grown in the field in Hainan province.
Extended Data Figure 9. Phenotypes and confirmation of transgenic plants of D53-RNAi in d3 and d14.
a, Phenotypes of wild-type, d3 and D53-RNAi/d3 transgenic plants. Scale bar, 10 cm. Four independent transgenic plants showed similar phenotypes. b, Phenotypes of wild-type, d14 and D53-RNAi/d14 transgenic plants at the mature stage. Scale bar, 10 cm. Five independent transgenic plants showed similar phenotypes. c, Tiller numbers of transgenic plants of D53-RNAi in d3 and d14 backgrounds at the mature stage. Values are means ±s.d. (n = 5). The double asterisks represent significant difference determined by the Student’s t-test at P <0.01. d, The D53 abundance of D53-RNAi in d3 or d14 transgenic plants. Protein levels were analysed by immunoblotting using D53 polyclonal antibodies. Rice plants (T1 generation) were cultivated in the field in Hainan province. e, Sequence information of D53-RNAi constructs. Two complementary inverted D53 fragments are shown in black and the intron sequence between inverted DNA fragments is in red.
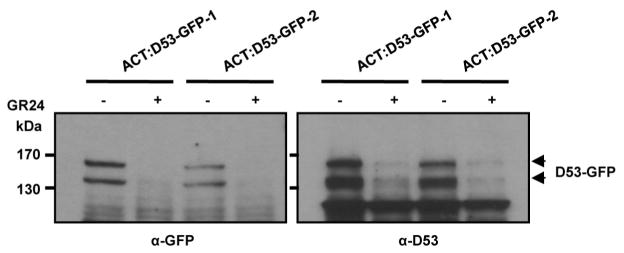
Extended Data Figure 10. Determination of D53 antibody specificity.
Determination of D53 antibody specificity by D53–GFP transgenic calli. Left, anti-GFP (Roche), 1:10,000 dilution; right, anti-D53 (1:10,000). Horseradish-peroxidase-conjugated anti-rabbit IgG and anti-mouse IgG antibodies were used as secondary antibodies to detect anti-D53 and anti-GFP.
Supplementary Material
Acknowledgments
We thank K. Yoneyama for assistance in SL analysis and C. Yan for SL measurement. This work was supported by grants from Ministry of Science and Technology of the People’s Republic of China (2012AA10A301) and National Natural Science Foundation of China (31025004, 90817108 and 91217311).
Footnotes
Supplementary Information is available in the online version of the paper.
Author Contributions L.J., X.L., G.X. and H.L. designed research, performed experiments, analysed data and wrote the paper; F.C., L.W., X.M., H.Y., Y.Y., G.L., W.Y., L.Z., H.M., Y.H., Z.W. and K.M. performed some of the experiments. Q.Q. provided and planted the rice materials. J.L., Y.W. and H.E.X. designed research, analysed data and wrote the paper. J.L. conceived and supervised the project.
The sequence of DWARF53 coding region has been deposited in the GenBank database under accession number KF23088.
The authors declare no competing financial interests.
Readers are welcome to comment on the online version of the paper.
Online Content Any additional Methods, Extended Data display items and Source Data are available in the online version of the paper; references unique to these sections appear only in the online paper.
References
- 1.Cook CE, Whichard LP, Turner B, Wall ME, Egley GH. Germination of witchweed (Striga lutea Lour.): isolation and properties of a potent stimulant. Science. 1966;154:1189–1190. doi: 10.1126/science.154.3753.1189. [DOI] [PubMed] [Google Scholar]
- 2.Akiyama K, Matsuzaki K, Hayashi H. Plant sesquiterpenes induce hyphal branching in arbuscular mycorrhizal fungi. Nature. 2005;435:824–827. doi: 10.1038/nature03608. [DOI] [PubMed] [Google Scholar]
- 3.Gomez-Roldan V, et al. Strigolactone inhibition of shoot branching. Nature. 2008;455:189–194. doi: 10.1038/nature07271. [DOI] [PubMed] [Google Scholar]
- 4.Umehara M, et al. Inhibition of shoot branching by new terpenoid plant hormones. Nature. 2008;455:195–200. doi: 10.1038/nature07272. [DOI] [PubMed] [Google Scholar]
- 5.Domagalska MA, Leyser O. Signal integration in the control of shoot branching. Nature Rev Mol Cell Biol. 2011;12:211–221. doi: 10.1038/nrm3088. [DOI] [PubMed] [Google Scholar]
- 6.Ruyter-Spira C, Al-Babili S, van der Krol S, Bouwmeester H. The biology of strigolactones. Trends Plant Sci. 2013;18:72–83. doi: 10.1016/j.tplants.2012.10.003. [DOI] [PubMed] [Google Scholar]
- 7.Stirnberg P, van De Sande K, Leyser O. MAX1 and MAX2 control shoot lateral branching in Arabidopsis. Development. 2002;129:1131–1141. doi: 10.1242/dev.129.5.1131. [DOI] [PubMed] [Google Scholar]
- 8.Sorefan K, et al. MAX4 and RMS1 are orthologous dioxygenase-like genes that regulates hoot branching in Arabidopsis and pea. Genes Dev. 2003;17:1469–1474. doi: 10.1101/gad.256603. [DOI] [PMC free article] [PubMed] [Google Scholar]
- 9.Booker J, et al. MAX3/CCD7 is a carotenoid cleavage dioxygenase required for the synthesis of a novel plant signaling molecule. Curr Biol. 2004;14:1232–1238. doi: 10.1016/j.cub.2004.06.061. [DOI] [PubMed] [Google Scholar]
- 10.Booker J, et al. MAX1 encodes a cytochrome P450 family member that acts downstream of MAX3/4 to produce a carotenoid-derived branch-inhibiting hormone. Dev Cell. 2005;8:443–449. doi: 10.1016/j.devcel.2005.01.009. [DOI] [PubMed] [Google Scholar]
- 11.Stirnberg P, Furner IJ, Leyser O. MAX2 participates in an SCF complex which acts locally at the node to suppress shoot branching. Plant J. 2007;50:80–94. doi: 10.1111/j.1365-313X.2007.03032.x. [DOI] [PubMed] [Google Scholar]
- 12.Waters MT, Brewer PB, Bussell JD, Smith SM, Beveridge CA. The Arabidopsis ortholog of rice DWARF27 acts upstream of MAX1 in the control of plant development by strigolactones. Plant Physiol. 2012;159:1073–1085. doi: 10.1104/pp.112.196253. [DOI] [PMC free article] [PubMed] [Google Scholar]
- 13.Waters MT, et al. Specialisation within the DWARF14 protein family confers distinct responses to karrikins and strigolactones in Arabidopsis. Development. 2012;139:1285–1295. doi: 10.1242/dev.074567. [DOI] [PubMed] [Google Scholar]
- 14.Ishikawa S, et al. Suppression of tiller bud activity in tillering dwarf mutants of rice. Plant Cell Physiol. 2005;46:79–86. doi: 10.1093/pcp/pci022. [DOI] [PubMed] [Google Scholar]
- 15.Zou J, et al. The rice HIGH-TILLERING DWARF1 encoding an ortholog of Arabidopsis MAX3 is required for negative regulation of the outgrowth of axillary buds. Plant J. 2006;48:687–698. doi: 10.1111/j.1365-313X.2006.02916.x. [DOI] [PubMed] [Google Scholar]
- 16.Arite T, et al. DWARF10, an RMS1/MAX4/DAD1 ortholog, controls lateral bud outgrowth in rice. Plant J. 2007;51:1019–1029. doi: 10.1111/j.1365-313X.2007.03210.x. [DOI] [PubMed] [Google Scholar]
- 17.Lin H, et al. DWARF27, an iron-containing protein required for the biosynthesis of strigolactones, regulates rice tiller bud outgrowth. Plant Cell. 2009;21:1512–1525. doi: 10.1105/tpc.109.065987. [DOI] [PMC free article] [PubMed] [Google Scholar]
- 18.Arite T, et al. d14, a strigolactone-insensitive mutant of rice, shows an accelerated outgrowth of tillers. Plant Cell Physiol. 2009;50:1416–1424. doi: 10.1093/pcp/pcp091. [DOI] [PubMed] [Google Scholar]
- 19.Gao Z, et al. Dwarf 88, a novel putative esterase gene affecting architecture of rice plant. Plant Mol Biol. 2009;71:265–276. doi: 10.1007/s11103-009-9522-x. [DOI] [PubMed] [Google Scholar]
- 20.Liu W, et al. Identification and characterization of HTD2: a novel gene negatively regulating tiller bud outgrowth in rice. Planta. 2009;230:649–658. doi: 10.1007/s00425-009-0975-6. [DOI] [PubMed] [Google Scholar]
- 21.Johnson X, et al. Branching genes are conserved across species. Genes controlling a novel signal in pea are coregulated by other long-distance signals. Plant Physiol. 2006;142:1014–1026. doi: 10.1104/pp.106.087676. [DOI] [PMC free article] [PubMed] [Google Scholar]
- 22.Snowden KC, et al. The Decreased apical dominance1/Petunia hybrida CAROTENOID CLEAVAGE DIOXYGENASE8 gene affects branch production and plays a role in leaf senescence, root growth, and flower development. Plant Cell. 2005;17:746–759. doi: 10.1105/tpc.104.027714. [DOI] [PMC free article] [PubMed] [Google Scholar]
- 23.Simons JL, Napoli CA, Janssen BJ, Plummer KM, Snowden KC. Analysis of the DECREASED APICAL DOMINANCE genes of petunia in the control of axillary branching. Plant Physiol. 2007;143:697–706. doi: 10.1104/pp.106.087957. [DOI] [PMC free article] [PubMed] [Google Scholar]
- 24.Hamiaux C, et al. DAD2 is an α/β hydrolase likely to be involved in the perception of the plant branching hormone, strigolactone. Curr Biol. 2012;22:2032–2036. doi: 10.1016/j.cub.2012.08.007. [DOI] [PubMed] [Google Scholar]
- 25.Wang Y, Li J. Molecular basis of plant architecture. Annu Rev Plant Biol. 2008;59:253–279. doi: 10.1146/annurev.arplant.59.032607.092902. [DOI] [PubMed] [Google Scholar]
- 26.Alder A, et al. The path from β-carotene to carlactone, a strigolactone-like plant hormone. Science. 2012;335:1348–1351. doi: 10.1126/science.1218094. [DOI] [PubMed] [Google Scholar]
- 27.Zhao LH, et al. Crystal structures of two phytohormone signal-transducing α/β hydrolases: karrikin-signaling KAI2 and strigolactone-signaling DWARF14. Cell Res. 2013;23:436–439. doi: 10.1038/cr.2013.19. [DOI] [PMC free article] [PubMed] [Google Scholar]
- 28.Kagiyama M, et al. Structures of D14 and D14L in the strigolactone and karrikin signaling pathways. Genes Cells. 2013;18:147–160. doi: 10.1111/gtc.12025. [DOI] [PubMed] [Google Scholar]
- 29.Smith SM, Waters MT. Strigolactones: destruction-dependent perception? Curr Biol. 2012;22:R924–R927. doi: 10.1016/j.cub.2012.09.016. [DOI] [PubMed] [Google Scholar]
- 30.Iwata N, Omura T. Studies on the trisomics in rice plants (Oryza sativa L.). VI. An accomplishment of a trisomic series in japonica rice plants. Jpn J Genet. 1984;59:199–204. [Google Scholar]
- 31.Wei LR, Xu JC, Li XB, Qian Q, Zhu LH. Genetic analysis and mapping of the dominant dwarfing dene D-53 in rice. J Integr Plant Biol. 2006;48:447–452. [Google Scholar]
- 32.Stanga JP, Smith SM, Briggs WR, Nelson DC. SUPPRESSOR OF MORE AXILLARY GROWTH2 1 controls seed germination and seedling development in Arabidopsis. Plant Physiol. 2013;163:318–330. doi: 10.1104/pp.113.221259. [DOI] [PMC free article] [PubMed] [Google Scholar]
- 33.Szemenyei H, Hannon M, Long JA. TOPLESS mediates auxin-dependent transcriptional repression during Arabidopsis embryogenesis. Science. 2008;319:1384–1386. doi: 10.1126/science.1151461. [DOI] [PubMed] [Google Scholar]
- 34.Pauwels L, et al. NINJA connects the co-repressor TOPLESS to jasmonate signalling. Nature. 2010;464:788–791. doi: 10.1038/nature08854. [DOI] [PMC free article] [PubMed] [Google Scholar]
- 35.Fukui K, et al. New branching inhibitors and their potential as strigolactone mimics in rice. Bioorg Med Chem Lett. 2011;21:4905–4908. doi: 10.1016/j.bmcl.2011.06.019. [DOI] [PubMed] [Google Scholar]
- 36.Fukui K, Ito S, Asami T. Selective mimics of strigolactone actions and their potential use for controlling damage caused by root parasitic weeds. Mol Plant. 2013;6:88–99. doi: 10.1093/mp/sss138. [DOI] [PubMed] [Google Scholar]
- 37.Nelson DC, et al. F-box protein MAX2 has dual roles in karrikin and strigolactone signaling in Arabidopsis thaliana. Proc Natl Acad Sci USA. 2011;108:8897–8902. doi: 10.1073/pnas.1100987108. [DOI] [PMC free article] [PubMed] [Google Scholar]
- 38.Causier B, Ashworth M, Guo W, Davies B. The TOPLESS interactome: a framework for gene repression in Arabidopsis. Plant Physiol. 2012;158:423–438. doi: 10.1104/pp.111.186999. [DOI] [PMC free article] [PubMed] [Google Scholar]
- 39.Long JA, Ohno C, Smith ZR, Meyerowitz EM. TOPLESS regulates apical embryonic fate in Arabidopsis. Science. 2006;312:1520–1523. doi: 10.1126/science.1123841. [DOI] [PubMed] [Google Scholar]
- 40.Yoshida A, Ohmori Y, Kitano H, Taguchi-Shiobara F, Hirano HY. Aberrant spikelet and panicle1, encoding a TOPLESS-related transcriptional co-repressor, is involved in the regulation of meristem fate in rice. Plant J. 2012;70:327–339. doi: 10.1111/j.1365-313X.2011.04872.x. [DOI] [PubMed] [Google Scholar]
- 41.Kwon Y, et al. OsREL2, a rice TOPLESS homolog functions in axillary meristem development in rice inflorescence. Plant Biotechnol Rep. 2012;6:213–224. [Google Scholar]
- 42.Gao X, et al. OsLIS-L1 encoding a lissencephaly type-1-like protein with WD40 repeats is required for plant height and male gametophyte formation in rice. Planta. 2012;235:713–727. doi: 10.1007/s00425-011-1532-7. [DOI] [PubMed] [Google Scholar]
- 43.Iwata N, Satoh N, Omura T. Linkage studies in rice. Linkage groups for 6 genes newly described. Jpn J Breed. 1977;27(suppl):250–251. [Google Scholar]
- 44.Wang Z, et al. A practical vector for efficient knockdown of gene expression in rice (Oryza sativa L.) Plant Mol Biol Rep. 2004;22:409–417. [Google Scholar]
- 45.Hiei Y, Ohta S, Komari T, Kumashiro T. Efficient transformation of rice (Oryza sativa L.) mediated by Agrobacterium and sequence analysis of the boundaries of the T-DNA. Plant J. 1994;6:271–282. doi: 10.1046/j.1365-313x.1994.6020271.x. [DOI] [PubMed] [Google Scholar]
- 46.Bart R, Chern M, Park CJ, Bartley L, Ronald PC. A novel system for gene silencing using siRNAs in rice leaf and stem-derived protoplasts. Plant Methods. 2006;2:13. doi: 10.1186/1746-4811-2-13. [DOI] [PMC free article] [PubMed] [Google Scholar]
- 47.Kierzkowski D, et al. The Arabidopsis CBP20 targets the cap-binding complex to the nucleus, and is stabilized by CBP80. Plant J. 2009;59:814–825. doi: 10.1111/j.1365-313X.2009.03915.x. [DOI] [PubMed] [Google Scholar]
- 48.Kamachi K, Yamaya T, Mae T, Ojima K. A role for glutamine synthetase in the remobilization of leaf nitrogen during natural senescence in rice leaves. Plant Physiol. 1991;96:411–417. doi: 10.1104/pp.96.2.411. [DOI] [PMC free article] [PubMed] [Google Scholar]
- 49.Chu CC, et al. Establishment of an efficient medium for anther culture of rice through comparative experiments on nitrogen-source. Sci China. 1975;18:659–668. [Google Scholar]
- 50.Gamborg OL, Miller RA, Ojima K. Nutrient requirements of suspension cultures of soybean root cells. Exp Cell Res. 1968;50:151–158. doi: 10.1016/0014-4827(68)90403-5. [DOI] [PubMed] [Google Scholar]
Associated Data
This section collects any data citations, data availability statements, or supplementary materials included in this article.


