Abstract
Fluorescent nanomaterials require high colloidal stability for effective use in imaging and sensing applications. We herein report the synthesis of carbazole-based organic fluorescent nanoaggregates, and demonstrate the superior colloidal stability of alkyl-substituted dye aggregates over their non-alkylated analogs. The role of alkyl chains in self-assembly and stability of such nanoaggregates is discussed based on both experimental and molecular dynamics simulation data, and spectral characteristics of the precursor dyes and their aggregates are described. The obtained results provide new insights on development of colloidally stable organic fluorescent nanomaterials with low polydispersity.
Keywords: polydispersity, alkyl chain, dynamic light scattering, fluorescent imaging, MD simulation
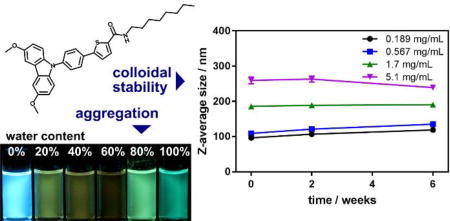
TOC graphic
1. Introduction
In analytical applications, fluorescence provides a number of critical advantages over absorption: higher sensitivity, better contrast, and superior resolution. This is particularly true for imaging applications, as well as closely related techniques, such as flow cytometry. Various fluorescent materials are used for these applications: inorganic nanocrystals, largely known as quantum dots [1–3], composite materials such as carbon [4–6] or doped silica [7,8] nanoparticles, and a wide spectrum of organic materials, for example, small molecules [9,10] and their nanoaggregates [11,12], fluorescent proteins [13–15], polymers and dendrimers [16], polymeric nanoparticles [17,18] and their combinations [19,20]. Each type of these materials possesses a unique combination of properties – brightness, photostability, size, colloidal stability, toxicity, etc. Their particular advantages and pitfalls discussed elsewhere [21,22].
Variety of fluorescent nanostructures based on organic small molecules are reported to date. Many of them are described as irregular nanoaggregates (or nanocrystals) with little control over their shape and morphology due to relatively few approaches to predict the size and polydispersity during their synthesis. While some organic fluorescent materials represent nanoparticles of defined shape with controllable size and polydispersity, their synthesis is usually more complicated [23], and often involve surface modification and/or encapsulation into polymers [24]. Thus, it is important to identify approaches to improve control over physico-chemical properties of the resulting fluorescent organic nanoaggregates.
Studies of complex biological systems present many challenges. When a fluorescent probe is used for this purpose, it is very important to understand how stable and reproducible its characteristics are. Since most of the supramolecular systems discussed above are assembled from small molecules which are not covalently bound to each other, spontaneous disassembly can potentially occur upon interaction with other components of the studied complex systems, or further aggregation can lead to sedimentation over time. Thus, it is important to address the question of stability of fluorescent organic aggregates, both in colloidal suspensions and upon their interaction with biological targets [25].
Most of fluorescent molecules show dramatic decrease in their emission efficiency in concentrated solutions or in solid state. This effect, known as aggregation-induced quenching, is due to reabsorption and energy transfer processes when molecules are close to each other. The most common and efficient approach to tackle this problem is to employ the effect of aggregation-induced emission (AIE) and approaches to convert conventional organic fluorophores into AIEgenic molecules [12]. Several classes of organic dyes are known that exhibit fairly bright emission both in solutions and in solid state. The can also be suitable as material for fluorescent nanoaggregates. Particularly, carbazole has been successfully used as a core for fluorescent materials for a variety of applications. Its derivatives were used to obtain bright fluorescent aggregates and nanostructures [26,27] that were subsequently used for sensing and imaging both in vitro and in vivo [28–30].
In the present report, we explore the influence of the alkyl moieties in the structure of organic fluorescent dyes on their self-assembly, including the effect on polydispersity and colloidal stability of the resulting nanoaggregates. We show that the introduction of the octyl chains into the structure of two organic dyes leads to formation of more monodisperse and colloidally stable nanoaggregates when compared to their counterparts with no alkyl chains. We also discuss the spectral characteristics of the most stable nanoaggregates and their precursor dyes.
2. Materials and Methods
2.1. Materials
Sodium methoxide (anhydrous), copper (I) iodide (98%), potassium carbonate (anhydrous, 99+%), N,N'-Dicyclohexylcarbodiimide (99%) and silica gel for chromatography (0.030–0.200 mm, 60A) were purchased from Acros Organics (New Jersey, USA). 3,6-Dibromocarbazole (99%), 1,4-dibromobenzene (98%), N,N-dimethylacetamide (anhydrous, 99.8%) and PdCl2(dppf) complex with acetone (13–15% Pd) were purchased from Alfa Aesar (Ward Hill, USA). Magnesium sulfate (anhydrous) was purchased from Fisher Chemical (New Jersey, USA). 1-Bromo-4-octylbenzene was purchased from Maybridge (Loughborough, UK). 5-Carboxythiophene-2-boronic was purchased from Frontier Scientific (Newark, USA). Hydrochloric acid (certified ACS plus) was purchased from Fisher Scientific (New Jersey, USA). Sodium sulfate (anhydrous) was purchased from Fisher BioReagents (New Jersey, USA). N-Hydroxysuccinimide (98+%) and octylamine (99%) were purchased from Sigma-Aldrich (St. Louis, USA). Chloroform-d (99.96%) was purchased from Cambridge Isotope Laboratories, Inc. (Andover, USA). Dimethyl sulfoxide-d6 (99.8%) was purchased from EMD Millipore (Billerica, USA). Solvents (methanol, DMF, chloroform, petroleum ether, toluene, DMSO) were all ACS certified or spectroscopic grade, were purchased from Fisher Chemical (New Jersey, USA) and used without further purification.
2.2. Synthesis
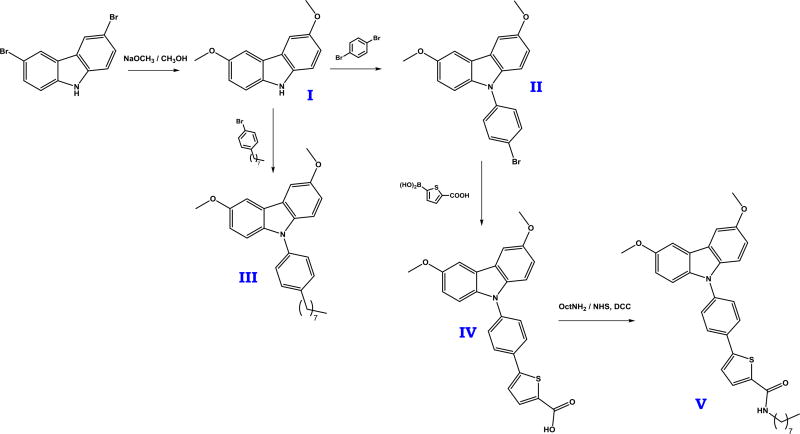
Target compounds III, 3,6-dimethoxy-9-(4-octylphenyl)carbazole, and V, 5-[4-(3,6-dimethoxycarbazol-9-yl)phenyl]-N-octyl-thiophene-2-carboxamide, were synthesized following the procedures described elsewhere. Briefly, 3,6-dimethoxycarbazole was obtained from 3,6-dibromocarbazole [31], which then was reacted with 1-bromo-4-octyl-benzene to obtain III [32]. The same precursor was also reacted with 1,4-dibromobenzene [32], and subsequently with 5-boronthiophene-2-carboxylic acid [33] and octylamine to obtain V (see Figure 1). A more detailed description of the synthetic procedures is provided in the Supplementary Information.
Figure 1.
Synthetic scheme leading to target compounds III and V.
2.3. Sample preparation
Fluorescent nanoaggregates were obtained using the solvent exchange method. Solutions of organic dyes in THF were prepared of 4 different concentrations through 3-fold serial dilutions. A volume containing equal amounts of the dye (50–1350 µL of THF solution) was the injected into 10 mL of ultrapure water, and the samples were left open overnight in the desiccator to allow THF evaporate.
2.4. Characterization
Structures of all obtained compounds were confirmed by 1H and 13C NMR spectroscopy (Bruker Avance-III HD, 500 and 125 MHz respectively). Mass-spectra were acquired on 4800 MALDI TOF (Sciex, Inc.) in SPA/60% acetonitrile/0.1% TFA in reflector positive mode with Nd:YAG laser (355 nm @ 200 Hz) for a total of 1000 acquisitions for each sample. Absorption and fluorescence spectra were recorded on a ThermoFisher Evolution 220 UV-vis spectrophotometer and Horiba Jobin Yvon FluoroMax 4 spectrofluorometer, respectively, in 10 mm quartz cells. Colloidal properties were studied using a Malvern Zetasizer Nano ZS90 dynamic light scattering instrument. Transmission electron microscopy imaging was performed using the FEI Tecnai G2 Spirit microscope (2% aqueous methylamine vanadate, pH 8, was used for negative staining).
2.5. MD simulations
Molecular dynamics simulations were performed using GROMACS 4.6 in combination with the GROMOS 53a6 force field [34]. The bond length and angle parameters for compounds II–V were optimized by density functional theory calculations at the B3LYP/cc-pVDZ level and adopted for the GROMACS force field format. Partial charges needed for Coulomb interactions were derived from the B3LYP/cc-pVDZ electron densities by fitting the electrostatic potential to point (ESP) charges. The Simple Point Charge (SPC) model was used for water [35]. A set of 729 dye molecules was placed in a rectangular cell of 18.7 nm × 18.7 nm × 18.7 nm, filled with approximately 200000 water molecules. Each system was simulated for 200 ns.
All the MD simulations were carried out at a constant number of particles, constant pressure of P = 1 atm, and constant temperature T = 298 K (the NPT ensemble). The reference temperature of 298 K was kept constant using the velocity rescaling weak coupling scheme [36] with a coupling constant τ = 0.1 ps. The initial atomic velocities were generated with a Maxwellian distribution at the given absolute temperature. Periodic boundary conditions were applied to all three directions of the simulated box. Electrostatic interactions were simulated with the particle mesh Ewald (PME) approach [37] using the long-range cutoff of 0.8 nm. The cutoff distance of Lennard-Jones interactions was also equal to 0.8 nm. The MD simulation time step was 2 fs with the neighbor list updates every 10 fs. All bond lengths were kept constant using the LINCS routine [38,39]. The MD simulations were carried out using the GROMACS set of programs, version 4.6 [40]. Molecular graphics and visualization were performed using VMD 1.8.6 [41]. The analysis was performed using GROMACS tools.
3. Results and Discussion
Target fluorescent dyes were synthesized by substitution of the carbazole in 9 position with a corresponding aryl bromide via Buchwald-Hartwig reaction [42,43], and subsequent Suzuki-Miyaura coupling [44] with 5-boronthiopene-2-carboxylic acid followed by the condensation with octylamine (Figure 1).
In order to study colloidal properties of the aggregates of III and V, their solutions in THF were injected into water as described in the experimental section. Aggregates of compounds II and IV were also prepared and were used as reference to assess the effect of the alkyl chain on the colloidal properties and stability of the resulting nanoaggregates. Data on average particles sizes and size distributions was acquired using DLS with freshly prepared samples, as well as with the same samples after 2 and 6 weeks of preparation, to assess their colloidal stability.
Several approaches exist to interpret the primary DLS measurements data. One of them, known as the method of cumulants [45], uses an expanded expression to fit the original autocorrelation function that accounts for polydispersity. This method results in two parameters: the intensity-weighted mean size, often referred to as Z-average size, and the polydispersity index (PDI). The other approach evaluates the autocorrelation function to provide the nanoparticle size distribution, which was shown to be much less reliable than the former [46]. Although discussions still have place in scientific literature regarding the optimal method to be used to report the DLS data [47,48], we hereby illustrate our results using both approaches, suggesting that the observed effects are independent on the method used and that the resulting analyses are in good agreement with each other.
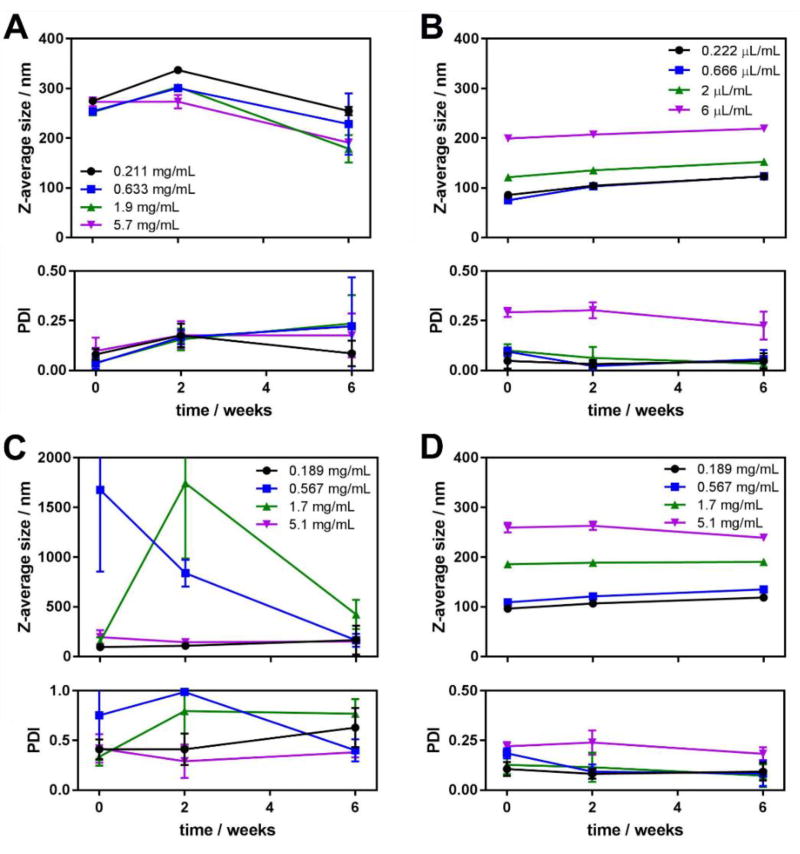
The aggregates of II are larger in size than those of III, where the bromine atom is replaced by the octyl hydrocarbon chain (Figure 2A,B). One can also notice that the average size of the aggregates of II experienced changes with time. First, an increase in size is observed for almost all the series (except one that was obtained by injecting the most concentrated organic solution) over the period of 2 weeks, which can be explained by Ostwald ripening [49] – an effect when smaller aggregates dissolve and redeposit material onto larger aggregates, making the latter further grow. The same behavior has been reported for aggregates of the dyes with similar structure [50]. Some precipitation was observed in the vial with the sample made by injection of the most concentrated organic solution. Ultimately, precipitation was observed in all 4 samples, explaining the decrease in size for all samples at the 6 weeks time point. Larger particles sedimented, and only the smaller ones remained in the suspension and were sampled by DLS. These observations also explain larger deviations for both the mean sizes and the polydispersity indices for this time point. At the same time, aggregates of III showed little change in their mean size with time (the slight increase in size could be also ascribed to Ostwald ripening). No precipitation was observed for these samples, except for the one obtained from the most concentrated organic solution after 6 weeks of preparation (note the increase of polydispersity index deviations for this point on Figure 2B).
Figure 2.
Average aggregate size (top) and polydispersity index (bottom) obtained from cumulants analysis of the DLS experiment data for the aggregates of compounds II (A), III (B), IV (C) and V (D) in 0, 2 and 6 weeks after preparation. Each experimental point is an average of 5 independent measurements, and the error bars represent the standard deviation.
In case of the compound IV, bearing a carboxyl group, it is much harder to notice any trend for the aggregates size in comparison with its analog V, where the carboxyl group is converted into the octylcarboxamide (Figure 2C,D). The primary reason for this lack of trend is that the compound IV has noticeably higher polydispersity. This could be explained by the ability of the molecules of IV to form hydrogen bonds through several H-bonding centers. Intermolecular hydrogen bonding in such molecules not only allows formation of dimers, but also chain- and network-like structures [51,52], which may contribute to the formation of larger aggregates, as well as lead to further association of smaller ones into larger complex structures. This assumption is supported by exceptionally high polydispersity indices obtained for aggregates of IV in the experiment. At the 6-week time point, similar to the aggregates of II, one can notice a decrease in size due to continuous precipitation. Such size change is much less pronounced for the samples obtained from the most concentrated organic solution (where precipitation started almost right after the sample was prepared) and the one obtained from the least concentrated organic solution (where precipitation was much less active). In contrast, aggregates of V do not show noticeable change of their average size with time, and exhibit significantly lower polydispersity indicating higher colloidal stability compared to IV. No precipitation was observed in either sample of V even several months after preparation.
In all cases, aggregates obtained upon injection of the most dilute organic solution of the dyes show higher monodispersity. To keep the overall amount of the dyes the same across the samples, the more diluted the THF stock solution was, the larger volume of it had to be injected into water. For the most diluted solutions it led to over 10% (v/v) of organic phase after injection, which made the dye slightly more soluble. Slow evaporation of THF allowed for slower nucleation and growth of nanoaggregates, thus leading to higher monodispersity.
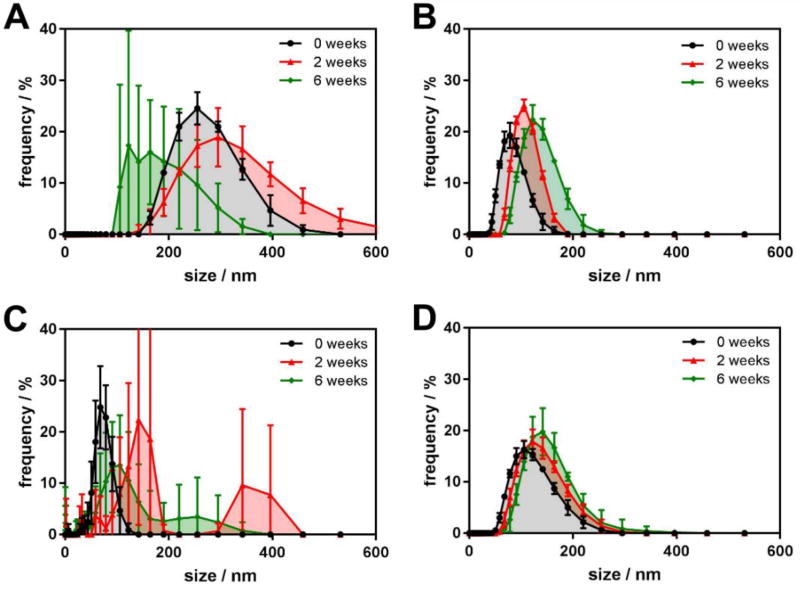
Results obtained from an alternative analysis of the primary DLS data using the size distribution fitting (see Figure 3, where one of the dilutions for all four compounds was taken as an example) are in excellent agreement with those of cumulants analysis and support the above discussion. Considerably wider size distributions of the aggregates of II and IV demonstrate their higher polydispersity compared to their alkyl-bearing counterparts III and V. The size distributions change dramatically for the non-alkylated compounds aggregates as well. As the same time, almost no change is observed for the aggregates of alkylated derivatives, confirming their superior colloidal stability.
Figure 3.
Aggregate size distributions obtained from DLS experiment for the fluorescent aggregates: A – II, 0.633 mg/mL; B – III, 0.666 µL/mL; C – IV, 0.567 mg/mL; and D – V, 0.567 mg/mL at 0, 2 and 6 weeks after preparation. Each experimental point is an average of 5 independent measurements, and the error bars represent the standard deviation.
Hydrophobic interaction between the alkyl fragments of different molecules can contribute to their more ordered packing inside the aggregate. This may be one of the reasons for the observed size and polydispersity difference between alkylated and non-alkylated analogs. Another potential explanation is that long hydrophobic chains can act as analogs to capping agents, which are largely used to stabilize the desired size and produce monodisperse inorganic nanocrystals [53]. For example, oleic acid has been shown to limit the particle-particle interaction during both nucleation and growth stages in CdSe quantum dots synthesis, thus leading to slower diffusion-controlled growth of monodisperse aggregates [54]. Surface passivation by polyvinyl pyrollidone was shown to be a plausible reason of growth rate decrease, thus leading to formation of more uniform nanocrystals of ZnO [55,56]. Similarly, thiols have been extensively used as capping agents in synthesis of various types of nanostructures, such as ZnO nanocrystals [57], silver [58,59] and gold [60–62] nanoparticles. Improved stability and lower polydispersity of the aggregates of II and IV obtained by injection of less concentrated organic dye solutions is an additional indirect evidence supporting this hypothesis. Although the capping agents are used to reduce the size and size distribution of the nanoaggregates, their effect on the growth kinetics is very complex, thus not providing for a general theory at this time [53].
Amphiphilic fluorescent molecules were shown to provide nearly monodisperse and even size-controlled micelle-like nanoparticles [23]. However, our target compounds are not quite amphiphilic, particularly due to insufficient hydrophilicity of the methoxy groups that readily partition into both polar and non-polar phases [63]. Size-concentration dependence observed for all aggregates also suggests that no micelles are formed by the described compounds.
The sizes of obtained nanoaggregates depend on the concentration of the organic solution used to inject into water: using the organic phase with higher dye concentration resulted in larger aggregate size (Figure 2). At the same time, the final concentration of the organic dye in water suspension within the series remains the same. Thus, injection of a more concentrated THF solution into water leads to formation of larger aggregates, which are also characterized by higher polydispersity. A similar effect was previously reported in literature [28,64], where the authors showed the dependence of nanoaggregates’ morphology on the concentration of the organic dye in THF that was injected into deionized water. This effect can be rationally explained by differences in local concentration of the aggregating dye upon solvent exchange at the early stages of nucleation and growth [53].
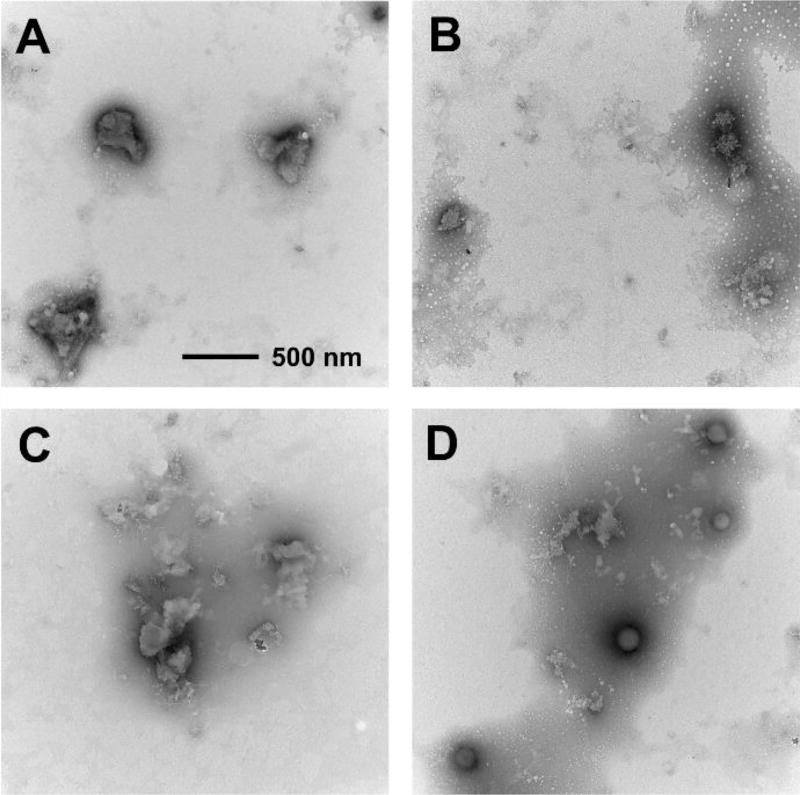
To shed more light on the morphology of our aggregates, TEM imaging was performed and representative micrographs were examined (see Figure 4). The sizes of aggregates observed on the micrographs are generally in good accordance with the sizes determined from the DLS experiments. One can see that the aggregates of II and IV tend to form larger and more irregular agglomerates (Figure 4A and 4C), showing much more affinity for further intermolecular interaction and growth of aggregates. On the other hand, aggregates of the alkyl-substituted analogs III and V appear to be smaller in size and more regular in shape, supporting the above hypothesis of alkyl groups’ role in intermolecular interactions on the stage of nanoaggregates growth.
Figure 4.
Transmission electron micrographs of the aggregates of compounds II (A), III (B), IV (C) and V (D). All images are taken at the same magnification (note the scale bar in section A).
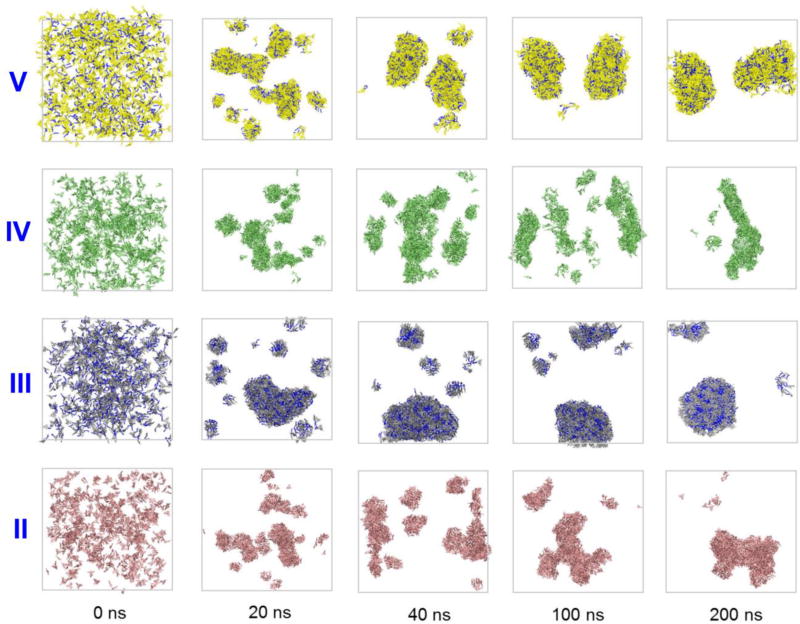
To shed more light onto the dynamics of the aggregation of the studied compounds, theoretical modeling of this process was performed for all four molecules. Molecular dynamics simulations snapshots (Figure 5) show the systems before aggregation, during its early stages (with the time step of 20 ns) and at the late stages (at 100 and 200 ns). Even at the early times the alkylated derivatives III and V are forming larger well-defined aggregates. The aggregation behavior appears more evident after 100 ns, when the aggregation process for them becomes essentially complete (as evidenced by the dye-water hydrogen bonds dynamics, see Figure S13). In the opposite, non-alkylated analogs II and IV struggle to form large aggregates even after 100 ns. It is worth to note the appearance of the formed aggregates: compounds III and V for more uniform and shape-defined structures, whereas their non-alkylated counterparts self-assemble into more irregularly shaped particles. These results are in excellent agreement with the TEM data shown on Figure 4.
Figure 5.
Dye aggregation dynamics illustrated by MD simulations snapshots of the systems consisting of 729 dye molecules solvated by ~2·105 water molecules (water molecules are omitted for clarity of representation).
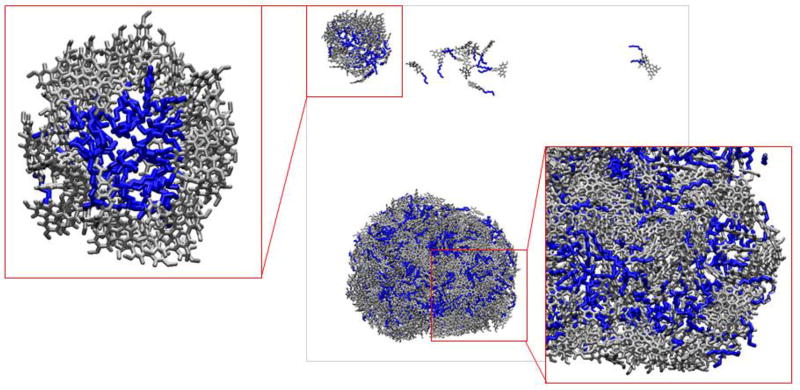
A more detailed analysis of the aggregation driving forces in all cases unveils some differences in the interactions of alkylated and non-alkylated dyes. Thus, the latters are predominantly brought together by their general hydrophobicity and the need to minimize the overall water-accessible surface area. In case of the alkylated dyes, the alkyl chains play additional role in the aggregate self-assembly. As can be seen from the snapshot of the aggregate of III at 100 ns (insert in Figure 6), the aggregation starts from formation of relatively small particles with micelle-like morphology, that further associate to grow into larger particles. Even in these, however, hydrophobic domains formed by alkyl moieties can be observed. This effect is less evident for the molecules of V (Figure S14), which can be explained by less pronounced hydrophobicity of the respective molecular fragment due to the presence of more polar and hydrogen bonds forming thiophene cycle and carboxamide group. Similar structural influence on hydrophobicity was demonstrated earlier for octyl chains adjacent to pyridinium moiety [63].
Figure 6.
Snapshot of the system of 729 molecules of III in approximately 2·105 water molecules (water molecules are omitted for clarity of representation) at 100 ns of simulation.
One of the most common uses of the fluorescent nanoaggregates is imaging of biological samples, particularly cells. Thus, a detailed spectroscopic characterization of the target compounds III and V and their aggregates in water has been performed to assess their potential as perspective imaging agents. Absorption and fluorescence spectra of both dyes were recorded in a series of solvents with different polarity represented by Onsager polarity function [65], with subsequent modifications: Δf = f(ε) − f(n).
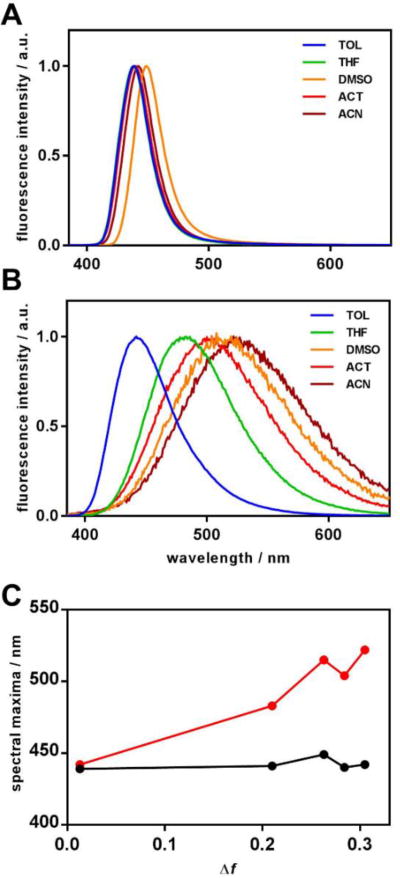
Absorption spectra for both III and V (see Fig. S1 in the Supplementary Information) show no significant change upon increase of the solvent polarity. The same is observed for the fluorescence of III (Figure 7A), i.e., it does not exhibit any noticeable solvatofluorochromism. In contrast, fluorescence of V (Figure 7B) shows high sensitivity to the solvent polarity – one can notice a significant bathochromic shift of the emission maximum upon increase of the solvent polarity (Figure 7C). Additionally, the emission spectrum of V noticeably broadens in more polar solvents.
Figure 7.
Intensity-normalized fluorescence spectra of target compounds III (A) and V (B) in various solvents. Spectral maxima for fluorescence are plotted against solvent polarity function Δf (C).
Table 1 represents the main spectral characteristics of the title compounds III and V in various solvents. It can be seen that with increasing polarity of the molecule’s microenvironment, there is almost no change in the Stokes shift of fluorescence for III, whereas for V it is quite noticeable. The quantum yields of fluorescence of V are lower in polar solvents. Hydrogen bonding is another factor that contributed to the emission efficiency [66]. However, in the aggregated state in water it also exhibits bright fluorescence.
Table 1.
Spectral characteristics of the title compounds in various solvents.
| Solvent |
ν̃abs, cm−1/ λabs, nm |
ν̃fluo, cm−1/ λfluo, nm |
Δν̃St, cm−1/ ΔλSt, nm |
Φ[a] |
|---|---|---|---|---|
| Compound III | ||||
|
| ||||
| Toluene | 26955 / 371 | 22780 / 439 | 4175 / 68 | 0.25 |
| THF | 27322 / 366 | 22675 / 441 | 4647 / 75 | 0.22 |
| DMSO | 27025 / 370 | 22270 / 449 | 4755 / 79 | 0.24 |
| Acetone | 27175 / 368 | 22725 / 440 | 4450 / 72 | 0.34 |
| Acetonitrile | 27250 / 367 | 22625 / 442 | 4625 / 75 | 0.28 |
| Water | 26650 / 375 | 20575 / 486 | 6075 / 111 | 0.12 |
|
| ||||
| Compound V | ||||
|
| ||||
| Toluene | 26040 / 384 | 22625 / 442 | 3415 / 58 | 0.32 |
| THF | 26110 / 383 | 20705 / 483 | 5405 / 100 | 0.36 |
| DMSO | 26180 / 382 | 19415 / 515 | 6765 / 133 | 0.25 |
| Acetone | 26315 / 380 | 19840 / 504 | 6475 / 124 | 0.11 |
| Acetonitrile | 26455 / 378 | 19155 / 522 | 7300 / 144 | 0.13 |
| Water | 26740 / 374 | 20490 / 488 | 6250 / 114 | 0.54 |
perylene solution in ethanol (φ=0.92 [67]) was used as a reference for the quantum yield of fluorescence.
Carbazole moiety is a well known electron donor [27,68,69]. In the structures of target compounds, this feature is further enhanced by methoxy substituents in the positions 3 and 6. However, in III a second pole – an electron accepting moiety – is not present, as the 4-bromophenyl-2 fragment only contributes to electronic delocalization, providing no means of significant charge transfer within the molecule. In case of V, a thiophene heterocycle, complemented with the carboxylic group, plays the role of an efficient electron withdrawing fragment, thus creating necessary conditions for the intramolecular charge transfer upon excitation. As a result of this process, a high dipole moment of the excited molecule explains the noticeable solvatofluorochromism observed for V. Solvent relaxation around the excited molecules leads to broadening of the emission spectrum bands [70]. Such effects have been described for similar molecules containing methoxy-substituted diphenylamine as a donor and thiophene [33,50,71] or other heterocycles [72] as acceptors. These analogs exhibit fairly bright fluorescence in organic solvents, and somewhat lower emission efficiency for their aggregates in water. However, very few data about the colloidal properties of these aggregates or their stability has been published.
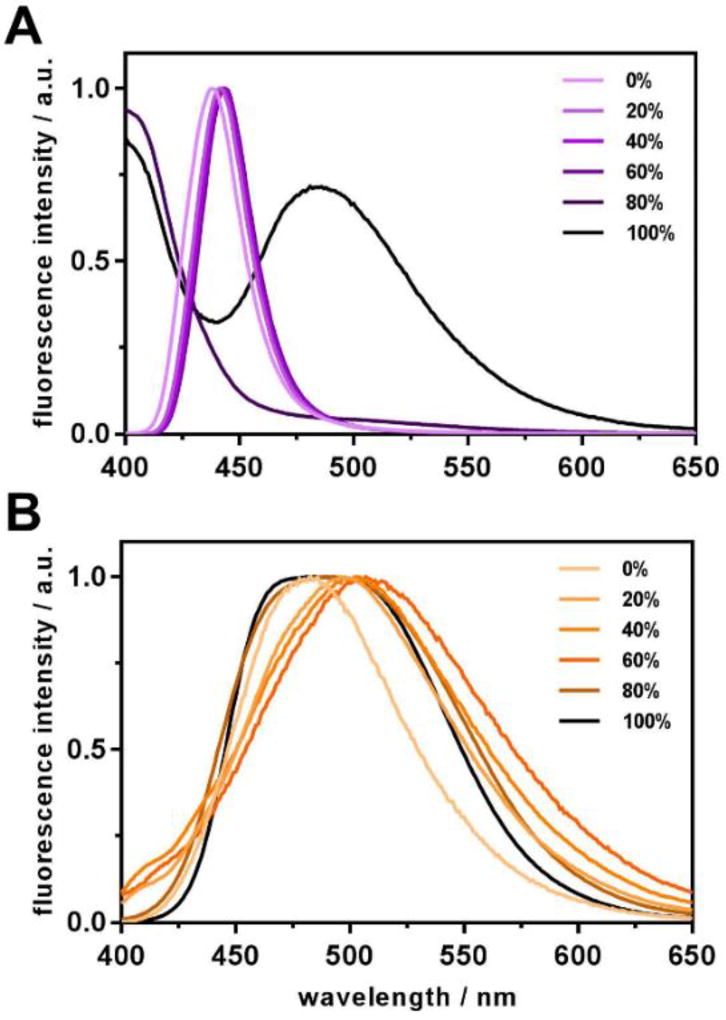
Behavior of both target compounds in water-THF solvent mixtures with varying water content is in good accordance with the spectral properties they show in individual organic solvents. Thus, for III almost no change in emission maximum position is observed upon increase of water content up to 60% (Figure 8A). In the system where only 20% of THF is left, an aggregate starts to form which scatters the excitation and exhibits its own emission at approximately 475 nm (a small shoulder emerges in that region). In 100% water (in fact, 1% THF was still present in order to inject the dye into water), a distinct band of the aggregate emission is observed.
Figure 8.
Intensity-normalized fluorescence spectra of target compounds III (A) and V (B) in water-THF binary solvent systems. Water content is indicated in the legends.
In case of V (Figure 8B), a slight bathochromic shift of the emission maximum is observed following the increase of water content in the system (and subsequent increase of the polarity of the dye’s environment). In addition to that, quenching of fluorescence with increased water content evidences for the hydrogen-bond induced nonradiative deactivation discussed above (see Figure S16 for original fluorescence spectra). Similarly to III, the aggregate fluorescence becomes observed when the water content reaches 80% and remains almost the same in pure water. Unlike III, however, the aggregate of V exhibits fluorescence at shorter wavelengths than the compound in polar solvents. Additionally, the emission band noticeably broadens, which may be a consequence of the compound’s sensitivity to its microenvironment. Similar behavior was observed for a few other carbazole-based dye aggregates possessing intramolecular charge transfer [26].
Conclusions
We describe the synthesis of two alkyl-substituted fluorescent dyes based on a carbazole core. Both dyes exhibit bright emission in organic solutions, and are fluorescent in the condensed state as well as in aggregate form in aqueous solutions. Colloidal properties of the aggregates are studied using dynamic light scattering and electron microscopy, and the aggregation process was simulated by means of molecular dynamics. Analogs of the target compounds having no alkyl substituents are used as comparison systems to demonstrate the role of the hydrophobic chains in self-assembly and colloidal stability of obtained aggregates.
The sizes of the fluorescent nanoaggregates are dependent upon the concentration of the organic solution initially injected into the water phase. Using more concentrated stock solutions lead to formation of larger aggregates in most cases, with usual sizes of 200–300 nm and exceeding 1 µm for some samples of IV. For less concentrated THF solutions injected, aggregates sizes fluctuate around 100 nm for III and V, and are larger for their respective non-alkylated analogs II and IV.
Introduction of alkyl chains not only leads to formation of more uniform aggregates, but also significantly enhances their colloidal stability. While precipitation was observed for the non-alkylated dyes aggregates within days to weeks after formation of the suspensions, only the sample made with the most concentrated THF solution of III showed signs of sedimentation 6 weeks after formation. No precipitate was observed in either sample of V even after 5 months after being prepared.
Molecular dynamics simulations demonstrate the alkylated dyes III and V better ability to form well-defined aggregates, while those of II and IV tend to be more irregular in shape and less monodisperse. These results are in excellent accordance with the DLS data and TEM microscopy images.
Spectral properties of the target dyes III and V reflect their structural features well. Compound III shows no sensitivity to its microenvironment polarity, whereas the emission of V undergoes noticeable bathochromic shift upon increase of the solvent polarity. This shift is due to an intramolecular charge transfer process making V significantly more polar in its excited state. In binary water-THF solvent systems, III does not show significant sensitivity to the water content of up to 80%. After this point, it exhibits a behavior typical for a J-aggregate, where the aggregate’s emission is bathochromically shifted with respect to the fluorescence of the precursor dye in bulk solvent. At the same time, the emission of V shifts bathochromically in response to rising medium polarity due to increasing water content. The aggregate of V exhibits emission at slightly shorter wavelengths compared to the precursor dye. Such hypsochromic shift and band broadening have been reported for other carbazole-based fluorescent aggregates exhibiting intramolecular charge transfer.
The results obtained in this study show that alkyl moieties can play significant role in formation of more uniform and colloidally stable aggregates of organic fluorescent dyes, without negatively affecting their fluorescent properties. These results will be useful for further development of fluorescent nanomaterials for imaging and sensing applications.
Supplementary Material
Highlights.
Fluorescent nanoaggregates with improved colloidal stability were obtained
Alkyl chains contribute to colloidal stability and monodispersity of the aggregates
DLS and TEM data and MD simulations were used to illustrate aggregation dynamics
Acknowledgments
This work was supported by the National Institutes of Health [grant numbers R21 CA212500 and P30 CA036727] and the Nebraska Research Initiative. Computational part of this work was completed using Holland Computing Center of the University of Nebraska, which receives support from the Nebraska Research Initiative.
Footnotes
Publisher's Disclaimer: This is a PDF file of an unedited manuscript that has been accepted for publication. As a service to our customers we are providing this early version of the manuscript. The manuscript will undergo copyediting, typesetting, and review of the resulting proof before it is published in its final citable form. Please note that during the production process errors may be discovered which could affect the content, and all legal disclaimers that apply to the journal pertain.
Conflict of Interests
The authors declare no conflicting financial interests.
References
- 1.Walling MA, Novak JA, Shepard JRE. Quantum Dots for Live Cell and In Vivo Imaging. Int. J. Mol. Sci. 2009;10:441–491. doi: 10.3390/ijms10020441. [DOI] [PMC free article] [PubMed] [Google Scholar]
- 2.Jin S, Hu Y, Gu Z, Liu L, Wu H-C. Application of Quantum Dots in Biological Imaging. J. Nanomater. 2011;2011:1–13. doi: 10.1155/2011/834139. [DOI] [Google Scholar]
- 3.Li J, Zhu J-J. Quantum dots for fluorescent biosensing and bio-imaging applications. Analyst. 2013;138:2506. doi: 10.1039/c3an36705c. [DOI] [PubMed] [Google Scholar]
- 4.Kumar P, Bohidar HB, Kumar R. Non-Functionalized Fluorescent Carbon Nanoparticles: In Vitro Imaging and Organic Solvent Sensing Applications. Sci. Adv. Mater. 2015;7:706–713. doi: 10.1166/sam.2015.1892. [DOI] [Google Scholar]
- 5.Ali H, Bhunia SK, Dalal C, Jana NR. Red Fluorescent Carbon Nanoparticle-Based Cell Imaging Probe. ACS Appl. Mater. Interfaces. 2016;8:9305–9313. doi: 10.1021/acsami.5b11318. [DOI] [PubMed] [Google Scholar]
- 6.Sharma V, Saini AK, Mobin SM. Multicolour fluorescent carbon nanoparticle probes for live cell imaging and dual palladium and mercury sensors. J. Mater. Chem. B. 2016;4:2466–2476. doi: 10.1039/C6TB00238B. [DOI] [PubMed] [Google Scholar]
- 7.Ribeiro T, Raja S, Rodrigues AS, Fernandes F, Farinha JPS, Baleizão C. High performance NIR fluorescent silica nanoparticles for bioimaging. RSC Adv. 2013;3:9171. doi: 10.1039/c3ra41199k. [DOI] [Google Scholar]
- 8.Zhang W-H, Hu X-X, Zhang X-B. Dye-Doped Fluorescent Silica Nanoparticles for Live Cell and In Vivo Bioimaging. Nanomaterials. 2016;6:81. doi: 10.3390/nano6050081. [DOI] [PMC free article] [PubMed] [Google Scholar]
- 9.Deligeorgiev T, Vasilev A, Kaloyanova S, Vaquero J-J. Fluorescent Dyes for Bio-Applications in the Patent Literature. Recent Patents Mater. Sci. 2013;6:81–119. doi: 10.2174/1874464811306020001. [DOI] [Google Scholar]
- 10.Terai T, Nagano T. Small-molecule fluorophores and fluorescent probes for bioimaging. Pflügers Arch. - Eur. J. Physiol. 2013;465:347–359. doi: 10.1007/s00424-013-1234-z. [DOI] [PubMed] [Google Scholar]
- 11.Klymchenko AS. Emerging field of self-assembled fluorescent organic dye nanoparticles. J. Nanosci. Lett. 2013;3(21):1–8. [Google Scholar]
- 12.Mei J, Leung NLC, Kwok RTK, Lam JWY, Tang BZ. Aggregation-Induced Emission: Together We Shine, United We Soar! Chem. Rev. 2015;115:11718–11940. doi: 10.1021/acs.chemrev.5b00263. [DOI] [PubMed] [Google Scholar]
- 13.Chudakov DM, Matz MV, Lukyanov S, Lukyanov KA. Fluorescent Proteins and Their Applications in Imaging Living Cells and Tissues. Physiol. Rev. 2010;90:1103–1163. doi: 10.1152/physrev.00038.2009. [DOI] [PubMed] [Google Scholar]
- 14.Chen T-W, Wardill TJ, Sun Y, Pulver SR, Renninger SL, Baohan A, Schreiter ER, Kerr RA, Orger MB, Jayaraman V, Looger LL, Svoboda K, Kim DS. Ultrasensitive fluorescent proteins for imaging neuronal activity. Nature. 2013;499:295–300. doi: 10.1038/nature12354. [DOI] [PMC free article] [PubMed] [Google Scholar]
- 15.Heppert JK, Dickinson DJ, Pani AM, Higgins CD, Steward A, Ahringer J, Kuhn JR, Goldstein B. Comparative assessment of fluorescent proteins for in vivo imaging in an animal model system. Mol. Biol. Cell. 2016;27:3385–3394. doi: 10.1091/mbc.E16-01-0063. [DOI] [PMC free article] [PubMed] [Google Scholar]
- 16.Liu J, Li K, Geng J, Zhou L, Chandrasekharan P, Yang C-T, Liu B. Single molecular hyperbranched nanoprobes for fluorescence and magnetic resonance dual modal imaging. Polym. Chem. 2013;4:1517–1524. doi: 10.1039/C2PY20837G. [DOI] [Google Scholar]
- 17.Elsabahy M, Heo GS, Lim S-M, Sun G, Wooley KL. Polymeric Nanostructures for Imaging and Therapy. Chem. Rev. 2015;115:10967–11011. doi: 10.1021/acs.chemrev.5b00135. [DOI] [PMC free article] [PubMed] [Google Scholar]
- 18.Wang K, Zhang X, Zhang X, Yang B, Li Z, Zhang Q, Huang Z, Wei Y. Fabrication of cross-linked fluorescent polymer nanoparticles and their cell imaging applications. J. Mater. Chem. C. 2015;3:1854–1860. doi: 10.1039/C4TC02672A. [DOI] [Google Scholar]
- 19.Ng KK, Zheng G. Molecular Interactions in Organic Nanoparticles for Phototheranostic Applications. Chem. Rev. 2015;115:11012–11042. doi: 10.1021/acs.chemrev.5b00140. [DOI] [PubMed] [Google Scholar]
- 20.Miksa B. Fluorescent Dyes Used in Polymer Carriers as Imaging Agents in Anticancer Therapy. Med. Chem. (Los. Angeles) 2016;6 doi: 10.4172/2161-0444.1000406. [DOI] [Google Scholar]
- 21.Resch-Genger U, Grabolle M, Cavaliere-Jaricot S, Nitschke R, Nann T. Quantum dots versus organic dyes as fluorescent labels. Nat. Methods. 2008;5:763–775. doi: 10.1038/nmeth.1248. [DOI] [PubMed] [Google Scholar]
- 22.Wolfbeis OS. An overview of nanoparticles commonly used in fluorescent bioimaging. Chem. Soc. Rev. 2015;44:4743–4768. doi: 10.1039/C4CS00392F. [DOI] [PubMed] [Google Scholar]
- 23.Zhang X, Chen Z, Würthner F. Morphology Control of Fluorescent Nanoaggregates by Co-Self-Assembly of Wedge- and Dumbbell-Shaped Amphiphilic Perylene Bisimides. J. Am. Chem. Soc. 2007;129:4886–4887. doi: 10.1021/ja070994u. [DOI] [PubMed] [Google Scholar]
- 24.Reisch A, Klymchenko AS. Fluorescent Polymer Nanoparticles Based on Dyes: Seeking Brighter Tools for Bioimaging. Small. 2016;12:1968–1992. doi: 10.1002/smll.201503396. [DOI] [PMC free article] [PubMed] [Google Scholar]
- 25.Demchenko AP. Nanoparticles and nanocomposites for fluorescence sensing and imaging. Methods Appl. Fluoresc. 2013;1:022001. doi: 10.1088/2050-6120/1/2/022001. [DOI] [PubMed] [Google Scholar]
- 26.Palayangoda SS, Cai X, Adhikari RM, Neckers DC. Carbazole-Based Donor–Acceptor Compounds: Highly Fluorescent Organic Nanoparticles. Org. Lett. 2008;10:281–284. doi: 10.1021/ol702666g. [DOI] [PubMed] [Google Scholar]
- 27.Panthi K, Adhikari RM, Kinstle TH. Carbazole Donor–Carbazole Linker-Based Compounds: Preparation, Photophysical Properties, and Formation of Fluorescent Nanoparticles. J. Phys. Chem. A. 2010;114:4550–4557. doi: 10.1021/jp912286u. [DOI] [PubMed] [Google Scholar]
- 28.Zhu W, Yang L, Fang M, Wu Z, Zhang Q, Yin F, Huang Q, Li C. New carbazole-based Schiff base: Colorimetric chemosensor for Fe3+ and fluorescent turn-on chemosensor for Fe3+ and Cr3+ J. Lumin. 2015;158:38–43. doi: 10.1016/j.jlumin.2014.09.020. [DOI] [Google Scholar]
- 29.Wang S, Fei X, Guo J, Yang Q, Li Y, Song Y. A novel reaction-based colorimetric and ratiometric fluorescent sensor for cyanide anion with a large emission shift and high selectivity. Talanta. 2016;148:229–236. doi: 10.1016/j.talanta.2015.10.058. [DOI] [PubMed] [Google Scholar]
- 30.Feng Y, Li D, Wang Q, Wang S, Meng X, Shao Z, Zhu M, Wang X. A carbazole-based mitochondria-targeted two-photon fluorescent probe for gold ions and its application in living cell imaging. Sensors Actuators B Chem. 2016;225:572–578. doi: 10.1016/j.snb.2015.11.081. [DOI] [Google Scholar]
- 31.Holzapfel M, Lambert C. Photoinduced Charge Separation and Recombination in Acridine2013;Triarylamine-Based Redox Cascades. J. Phys. Chem. C. 2008;112:1227–1243. doi: 10.1021/jp073777o. [DOI] [Google Scholar]
- 32.Mao M, Ren MG, Song QH. Thermodynamics and conformations in the formation of excited states and their interconversions for twisted donor-substituted tridurylboranes. Chem. - A Eur. J. 2012;18:15512–15522. doi: 10.1002/chem.201201719. [DOI] [PubMed] [Google Scholar]
- 33.Sissa C, Parthasarathy V, Drouin-Kucma D, Werts MHV, Blanchard-Desce M, Terenziani F. The effectiveness of essential-state models in the description of optical properties of branched push-pull chromophores. Phys. Chem. Chem. Phys. 2010;12:11715–11727. doi: 10.1039/c003563g. [DOI] [PubMed] [Google Scholar]
- 34.Oostenbrink C, Villa A, Mark AE, Van Gunsteren WF. A biomolecular force field based on the free enthalpy of hydration and solvation: The GROMOS force-field parameter sets 53A5 and 53A6. J. Comput. Chem. 2004;25:1656–1676. doi: 10.1002/jcc.20090. [DOI] [PubMed] [Google Scholar]
- 35.Jorgensen WL, Chandrasekhar J, Madura JD, Impey RW, Klein ML. Comparison of simple potential functions for simulating liquid water. J. Chem. Phys. 1983;79:926. doi: 10.1063/1.445869. [DOI] [Google Scholar]
- 36.Bussi G, Donadio D, Parrinello M. Canonical sampling through velocity rescaling. J. Chem. Phys. 2007;126:014101. doi: 10.1063/1.2408420. [DOI] [PubMed] [Google Scholar]
- 37.Darden T, York D, Pedersen L. Particle mesh Ewald: An N·log(N) method for Ewald sums in large systems. J. Chem. Phys. 1993;98:10089. doi: 10.1063/1.464397. [DOI] [Google Scholar]
- 38.Hess B, Bekker H, Berendsen HJC, Fraaije JGEM. LINCS: A linear constraint solver for molecular simulations. J. Comput. Chem. 1997;18:1463–1472. doi: 10.1002/(SICI)1096-987X(199709)18:12<1463::AID-JCC4>3.0.CO;2-H. [DOI] [Google Scholar]
- 39.Hess B. P-LINCS: A Parallel Linear Constraint Solver for Molecular Simulation. J. Chem. Theory Comput. 2008;4:116–122. doi: 10.1021/ct700200b. [DOI] [PubMed] [Google Scholar]
- 40.Van Der Spoel D, Lindahl E, Hess B, Groenhof G, Mark AE, Berendsen HJC. GROMACS: fast, flexible, and free. J. Comput. Chem. 2005;26:1701–18. doi: 10.1002/jcc.20291. [DOI] [PubMed] [Google Scholar]
- 41.Humphrey W, Dalke A, Schulten K. VMD: Visual molecular dynamics. J. Mol. Graph. 1996;14:33–38. doi: 10.1016/0263-7855(96)00018-5. [DOI] [PubMed] [Google Scholar]
- 42.Wolfe JP, Wagaw S, Marcoux J-F, Buchwald SL. Rational Development of Practical Catalysts for Aromatic Carbon–Nitrogen Bond Formation. Acc. Chem. Res. 1998;31:805–818. doi: 10.1021/ar9600650. [DOI] [Google Scholar]
- 43.Hartwig J. Palladium-Catalyzed Amination of Aryl Halides: Mechanism and Rational Catalyst Design. Synlett. 1997;1997:329–340. doi: 10.1055/s-1997-789. [DOI] [Google Scholar]
- 44.Miyaura N, Suzuki A. Palladium-Catalyzed Cross-Coupling Reactions of Organoboron Compounds. Chem. Rev. 1995;95:2457–2483. doi: 10.1021/cr00039a007. [DOI] [Google Scholar]
- 45.Koppel DE. Analysis of Macromolecular Polydispersity in Intensity Correlation Spectroscopy: The Method of Cumulants. J. Chem. Phys. 1972;57:4814–4820. doi: 10.1063/1.1678153. [DOI] [Google Scholar]
- 46.Kato H, Suzuki M, Fujita K, Horie M, Endoh S, Yoshida Y, Iwahashi H, Takahashi K, Nakamura A, Kinugasa S. Reliable size determination of nanoparticles using dynamic light scattering method for in vitro toxicology assessment. Toxicol. Vitr. 2009;23:927–934. doi: 10.1016/j.tiv.2009.04.006. [DOI] [PubMed] [Google Scholar]
- 47.Nobbmann U, Morfesis A. Light scattering and nanoparticles. Mater. Today. 2009;12:52–54. doi: 10.1016/S1369-7021(09)70164-6. [DOI] [Google Scholar]
- 48.Kato H, Nakamura A, Takahashi K, Kinugasa S. Accurate Size and Size-Distribution Determination of Polystyrene Latex Nanoparticles in Aqueous Medium Using Dynamic Light Scattering and Asymmetrical Flow Field Flow Fractionation with Multi-Angle Light Scattering. Nanomaterials. 2012;2:15–30. doi: 10.3390/nano2010015. [DOI] [PMC free article] [PubMed] [Google Scholar]
- 49.Baldan A. Review Progress in Ostwald ripening theories and their applications to nickel-base superalloys Part I: Ostwald ripening theories. J. Mater. Sci. 2002;37:2171–2202. doi: 10.1023/A:1015388912729. [DOI] [Google Scholar]
- 50.Parthasarathy V, Fery-Forgues S, Campioli E, Recher G, Terenziani F, Blanchard-Desce M. Dipolar versus Octupolar Triphenylamine-Based Fluorescent Organic Nanoparticles as Brilliant One- and Two-Photon Emitters for (Bio)imaging. Small. 2011;7:3219–3229. doi: 10.1002/smll.201100726. [DOI] [PubMed] [Google Scholar]
- 51.Svechkarev DA, Baumer VN, Syzova ZA, Doroshenko AO. New benzimidazolic 3-hydroxychromone derivative with two alternative mechanisms of the excited state intramolecular proton transfer reaction. J. Mol. Struct. 2008;882:63–69. doi: 10.1016/j.molstruc.2007.09.009. [DOI] [Google Scholar]
- 52.Svechkarev D, Doroshenko A, Baumer V, Dereka B. Nature of dual fluorescence in 2-(quinolin-2-yl)-3-hydroxychromone: Tuning between concurrent H-bond directions and ESIPT pathways. J. Lumin. 2011;131:253–261. doi: 10.1016/j.jlumin.2010.10.007. [DOI] [Google Scholar]
- 53.Viswanatha R, Sarma DD. Growth of Nanocrystals in Solution. In: Rao CNR, Mueller A, Cheetham AK, editors. Nanomater. Chem. WILEY-VCH Verlag GmbH & Co. KGaA; Weinheim: 2007. pp. 139–170. [Google Scholar]
- 54.Bullen CR, Mulvaney P. Nucleation and Growth Kinetics of CdSe Nanocrystals in Octadecene. Nano Lett. 2004;4:2303–2307. doi: 10.1021/nl0496724. [DOI] [Google Scholar]
- 55.Viswanatha R, Sarma DD. Study of the Growth of Capped ZnO Nanocrystals: A Route to Rational Synthesis. Chem. - A Eur. J. 2006;12:180–186. doi: 10.1002/chem.200500632. [DOI] [PubMed] [Google Scholar]
- 56.Guo L, Yang S, Yang C, Yu P, Wang J, Ge W, Wong GKL. Synthesis and Characterization of Poly(vinylpyrrolidone)-Modified Zinc Oxide Nanoparticles. Chem. Mater. 2000;12:2268–2274. doi: 10.1021/cm9907817. [DOI] [Google Scholar]
- 57.Pesika NS, Hu Z, Stebe KJ, Searson PC. Quenching of Growth of ZnO Nanoparticles by Adsorption of Octanethiol. J. Phys. Chem. B. 2002;106:6985–6990. doi: 10.1021/jp0144606. [DOI] [Google Scholar]
- 58.Dong T-Y, Chen W-T, Wang C-W, Chen C-P, Chen C-N, Lin M-C, Song J-M, Chen I-G, Kao T-H. One-step synthesis of uniform silver nanoparticles capped by saturated decanoate: direct spray printing ink to form metallic silver films. Phys. Chem. Chem. Phys. 2009;11:6269. doi: 10.1039/b900691e. [DOI] [PubMed] [Google Scholar]
- 59.Battocchio C, Meneghini C, Fratoddi I, Venditti I, Russo MV, Aquilanti G, Maurizio C, Bondino F, Matassa R, Rossi M, Mobilio S, Polzonetti G. Silver Nanoparticles Stabilized with Thiols: A Close Look at the Local Chemistry and Chemical Structure. J. Phys. Chem. C. 2012;116:19571–19578. doi: 10.1021/jp305748a. [DOI] [Google Scholar]
- 60.Corbierre MK, Lennox RB. Preparation of Thiol-Capped Gold Nanoparticles by Chemical Reduction of Soluble Au(I)–Thiolates. Chem. Mater. 2005;17:5691–5696. doi: 10.1021/cm051115a. [DOI] [Google Scholar]
- 61.Moon SY, Tanaka S, Sekino T. Crystal Growth of Thiol-Stabilized Gold Nanoparticles by Heat-Induced Coalescence. Nanoscale Res. Lett. 2010;5:813–817. doi: 10.1007/s11671-010-9565-6. [DOI] [PMC free article] [PubMed] [Google Scholar]
- 62.Kyrychenko A, Karpushina GV, Svechkarev D, Kolodezny D, Bogatyrenko SI, Kryshtal AP, Doroshenko AO. Fluorescence Probing of Thiol-Functionalized Gold Nanoparticles: Is Alkylthiol Coating of a Nanoparticle as Hydrophobic as Expected? J. Phys. Chem. C. 2012;116:21059–21068. doi: 10.1021/jp3060813. [DOI] [Google Scholar]
- 63.Svechkarev D, Kolodezny D, Mosquera-Vázquez S, Vauthey E. Complementary Surface Second Harmonic Generation and Molecular Dynamics Investigation of the Orientation of Organic Dyes at a Liquid/Liquid Interface. Langmuir. 2014;30:13869–13876. doi: 10.1021/la503121g. [DOI] [PubMed] [Google Scholar]
- 64.Zhang J, Chen R, Zhu Z, Adachi C, Zhang X, Lee C-S. Highly Stable Near-Infrared Fluorescent Organic Nanoparticles with a Large Stokes Shift for Noninvasive Long-Term Cellular Imaging. ACS Appl. Mater. Interfaces. 2015;7:26266–26274. doi: 10.1021/acsami.5b08539. [DOI] [PubMed] [Google Scholar]
- 65.Onsager L. Electric Moments of Molecules in Liquids. J. Am. Chem. Soc. 1936;58:1486–1493. doi: 10.1021/ja01299a050. [DOI] [Google Scholar]
- 66.Dereka B, Vauthey E. Direct local solvent probing by transient infrared spectroscopy reveals the mechanism of hydrogen-bond induced nonradiative deactivation. Chem. Sci. 2017;8:5057–5066. doi: 10.1039/C7SC00437K. [DOI] [PMC free article] [PubMed] [Google Scholar]
- 67.Crosby GA, Demas JN. Measurement of photoluminescence quantum yields. Review. J. Phys. Chem. 1971;75:991–1024. doi: 10.1021/j100678a001. [DOI] [Google Scholar]
- 68.Venkateswararao A, Thomas KRJ, Lee C-P, Li C-T, Ho K-C. Organic Dyes Containing Carbazole as Donor and π-Linker: Optical, Electrochemical, and Photovoltaic Properties. ACS Appl. Mater. Interfaces. 2014;6:2528–2539. doi: 10.1021/am404948w. [DOI] [PubMed] [Google Scholar]
- 69.Zhang J, Chen W, Kalytchuk S, Li KF, Chen R, Adachi C, Chen Z, Rogach AL, Zhu G, Yu PKN, Zhang W, Cheah KW, Zhang X, Lee C-S. Self-Assembly of Electron Donor–Acceptor-Based Carbazole Derivatives: Novel Fluorescent Organic Nanoprobes for Both One- and Two-Photon Cellular Imaging. ACS Appl. Mater. Interfaces. 2016;8:11355–11365. doi: 10.1021/acsami.6b03259. [DOI] [PubMed] [Google Scholar]
- 70.Nemkovich NA, Rubinov AN, Tomin VI. Inhomogeneous Broadening of Electronic Spectra of Dye Molecules in Solutions. In: Lakowicz JR, editor. Top. Fluoresc. Spectrosc. Plenum Press; New York: 1991. pp. 367–428. [DOI] [Google Scholar]
- 71.Amro K, Daniel J, Clermont G, Bsaibess T, Pucheault M, Genin E, Vaultier M, Blanchard-Desce M. A new route towards fluorescent organic nanoparticles with red-shifted emission and increased colloidal stability. Tetrahedron. 2014;70:1903–1909. doi: 10.1016/j.tet.2014.01.032. [DOI] [Google Scholar]
- 72.Ishi-i T, Kitahara I, Yamada S, Sanada Y, Sakurai K, Tanaka A, Hasebe N, Yoshihara T, Tobita S. Amphiphilic benzothiadiazole–triphenylamine-based aggregates that emit red light in water. Org. Biomol. Chem. 2015;13:1818–1828. doi: 10.1039/C4OB02181A. [DOI] [PubMed] [Google Scholar]
Associated Data
This section collects any data citations, data availability statements, or supplementary materials included in this article.


