Abstract
The cannabinoid type 1 and 2 G-protein-coupled receptors are currently important pharmacological targets with significant drug discovery potential. These receptors have been shown to display functional selectivity or biased agonism, a property currently thought to have substantial therapeutic potential. Although recent advances in crystallization techniques have provided a wealth of structural information about this important class of membrane-embedded proteins, these structures lack dynamical information. In order to fully understand the interplay of structure and function for this important class of proteins, complementary techniques that address the dynamical aspects of their function are required such as NMR as well as a variety of other spectroscopies. Complimentary to these experimental approaches is molecular dynamics, which has been effectively used to help unravel, at the atomic level, the dynamics of ligand binding and activation of these membrane-bound receptors. Here, we discuss and present several representative examples of the application of molecular dynamics simulations to the understanding of the signatures of ligand-binding and -biased signaling at the cannabinoid type 1 and 2 receptors.
1. INTRODUCTION
The cannabinoid type 1 (CB1) and 2 (CB2) receptors belong to the class A family of G-protein-coupled receptors (GPCRs). They are expressed primarily in the CNS/immune system, respectively, and have been implicated in a variety of disease states (Kendall & Yudowski, 2016; Lu & Mackie, 2016). Modulating the behavior of the cannabinoid receptors has been the target of substantial research and the focus of significant drug discovery efforts (Vemuri & Makriyannis, 2015). GPCRs are integral membrane proteins which share a common architecture of seven transmembrane helices (TMHs) connected by intra- (IC) and extracellular (EC) loops and are among the major class of proteins involved in signal transduction (Venkatakrishnan et al., 2013). In general, ligand binding activates these receptors and thereby triggers a physiological response via initiating signaling cascades. This binding induces a conformational change in the GPCR such that the opening of a distinct cleft on the IC face of the receptor is produced. The receptor is thereby able to recruit, bind, and activate the relevant IC signaling partners, such as G-proteins and β-arrestins (Kobilka, 2013; Lefkowitz, 2013) with the result that the machinery of cellular response is put into action. In fact, it is now recognized that the specific signaling pathway activated can be tuned with particular ligands whose binding generates a ligand-specific GPCR conformation. This then selects or is biased toward a single or subset of signaling pathways. This property is often called biased agonism (Violin, Crombie, Soergel, & Lark, 2014; Violin & Lefkowitz, 2007) or functional selectivity (Urban et al., 2007) and is commonly thought to hold promise for drug discovery (Luttrell, Maudsley, & Bohn, 2015). CB1 and CB2 are primarily Gi/o coupled leading to inhibition of cyclic AMP production and modulation of pertussis toxin-sensitive signaling via MAPK, voltage-gated Ca2+ channels, and inwardly rectifying K+ channels (Howlett, Blume, & Dalton, 2010). Recently a CB1-mediated, G-protein-independent, β-arrestin-1-mediated ERK signal has been reported (Ahn, Mahmoud, Shim, & Kendall, 2013; Delgado-Peraza et al., 2016).
The property of GPCRs that lend themselves to such multidimensional behavior is their inherent flexibility. For example, in the case of rhodopsin, it has been shown that light activation is accompanied by an outward movement of the IC portion of TMH6 (Choe et al., 2011; Farrens, Altenbach, Yang, Hubbell, & Khorana, 1996; Park, Scheerer, Hofmann, Choe, & Ernst, 2008; Scheerer et al., 2008). Similarly, upon activation via binding the agonist BI167107, the β2-adrenergic receptor also undergoes a rearrangement of the TM helices with the IC portion of TMH6 moving outward by about 14 Å (Kobilka, 2013; Rasmussen et al., 2007, 2011). This is in contrast to the β-arrestin-biased ligands, carvedilol and isoetharine, that appear to lead to an alteration of the IC location of TMH7 in the β2-adrenergic receptor (Liu, Horst, Katritch, Stevens, & Wuthrich, 2012). Given the plasticity of these membrane proteins, it is not surprising that different ligands select specific conformations and thus can signal via specific pathways. In order to fully exploit the drug target potential of these receptors, a detailed understanding of the structure and dynamics of these membrane-bound systems is required (Latorraca, Venkatakrishnan, & Dror, 2017; Luttrell et al., 2015; Manglik & Kobilka, 2014). It is therefore critical that such flexibility is taken into account in the analysis of these conformations as well as the kinetics governing their interconversion. Moreover, this conformational heterogeneity also makes the structure and function of these signal transducers sensitive to the lipid environment in which they reside (Dawaliby et al., 2016; Mondal, Khelashvili, Johner, & Weinstein, 2014; Mondal, Khelashvili, & Weinstein, 2014; Oates & Watts, 2011; Soubias & Gawrisch, 2012). In fact, this work has demonstrated that the composition of the lipid milieu can have profound effects on the functioning of these proteins.
The last 16 years has seen a breakthrough in our knowledge of GPCR structure, with the publication of over 80 GPCR crystals (Lomize, Lomize, Pogozheva, & Mosberg, 2006). This work is impressive, given the inherent flexibility of these membrane-bound proteins. Advances in crystallization techniques, such as the use of lipidic cubic phase, which provides a more membrane-like environment than used in earlier crystallization efforts (Cherezov, 2011), have also had an impact. In order to obtain crystals, these proteins are often modified by introducing stabilizing mutations, replacing flexible loops with proteins that enhance crystallization contacts, and/or truncating disordered N-terminal/C-terminal regions (Tate & Schertler, 2009). Although the production of these crystal structures has rapidly advanced the field, it is important to recall that these are modified, static structures obtained in a nonnative, crystalline environment. Moreover, the secondary structure of the helical ends leading into the loops can depend on the lipid composition employed (Soubias, Niu, Mitchell, & Gawrisch, 2008). Therefore, in addition to a lack of dynamical information, the crystal structures themselves may be perturbed by the stabilizing modifications utilized as well as by the crystalline environment itself. This lack of dynamical information and structural perturbation makes an interpretation of functional data directly from these structures a challenge and often alternate/complementary methods are employed. For example, along with traditionally employed biophysical methods such as site-directed spin labeling and disulfide cross-linking (Farrens et al., 1996), NMR (Soubias & Gawrisch, 2012; Struts, Chawla, Perera, & Brown, 2015), BRET/FRET (Lohse, Nuber, & Hoffmann, 2012), double electron–electron resonance (Altenbach, Kusnetzow, Ernst, Hofmann, & Hubbell, 2008), and fluorescence (Fay & Farrens, 2015) spectroscopies, as well as molecular dynamics (MD) simulations have become pivotal in characterizing these systems (Grossfield, 2011; Latorraca et al., 2017; Marino, Shang, & Filizola, 2017).
All-atom MD tracks the positions and velocities of the atoms in the simulation. Since the system is followed at the atomic level, these simulation methods provide a level of detail for describing the structure and dynamics that is unprecedented and often inaccessible to the experimental methods discussed thus far. In fact, the ability of MD to help unravel the activation mechanisms of rhodopsin (Grossfield, 2011; Leioatts et al., 2014; Leioatts, Romo, Danial, & Grossfield, 2015), the β2 adrenergic (Dror, Arlow, et al., 2011; Dror, Pan, et al., 2011; Kohlhoff et al., 2014), the opioids (Marino et al., 2017), allosteric modulation of the muscarinic (Dror et al., 2013; Kruse et al., 2012; Miao, Caliman, & McCammon, 2015), the S1P1 receptor (Stanley, Pardo, & Fabritiis, 2016), and the cannabinoids (Hurst et al., 2010; Hurst, Schmeisser, & Reggio, 2013; Kimura et al., 2013; Laprairie et al., 2016; Schneider et al., 2015; Vallee et al., 2014) has been demonstrated. As such, MD has become an almost indispensable tool, along with biophysical and structural studies, to elucidate the underlying physics of these biologically/medically important proteins. Here, it is not our intent to review the vast literature of MD simulations of GPCRs, but to provide a detailed description of the work in our group for the setup/analysis of MD simulations of cannabinoid receptors and their ligands.
The cannabinoid receptors are distinct from many other GPCRs in that their endogenous ligands; N-arachidonoylethanolamide and 2-arachidonoylglycerol (2-AG) are highly lipophilic. These molecules are synthesized on demand from the lipid bilayer itself. Moreover, post-activation, they are degraded by the membrane-bound enzymes fatty acid amide hydrolase and monoacylglycerol lipase, respectively (Kendall & Yudowski, 2016; Lu & Mackie, 2016; Vemuri & Makriyannis, 2015). Cannabinoid ligands are known to readily partition into the phospholipid bilayer and their orientation in the membrane has been established by a variety of methods including small-angle X-ray diffraction/differential calorimetry (Mavromoustakos, Yang, Broderick, Fournier, & Makriyannis, 1991), NMR(Kimura, Cheng, Rice, & Gawrisch, 2009; Tian, Guo, Yao, Yang, & Makriyannis, 2005), as well as simulation (Kotsikorou, Lynch, Abood, & Reggio, 2011). In general, the polar headgroups reside near the water/phospholipid headgroup region with the hydrophobic acyl tails extending into the hydrophobic core of the membrane. As such, one would expect their binding mechanism to be distinct from that of a GPCR activated by a water-soluble ligand. S1P1 (Hanson et al., 2012) and LPA1 (Chrencik et al., 2015) are two other GPCRs that have lipid-like ligands that most likely bind via the membrane milieu. In addition, although rhodopsin is activated via light, the binding/unbinding of retinal has been described to occur via the membrane (Hildebrand et al., 2009; Park et al., 2008).
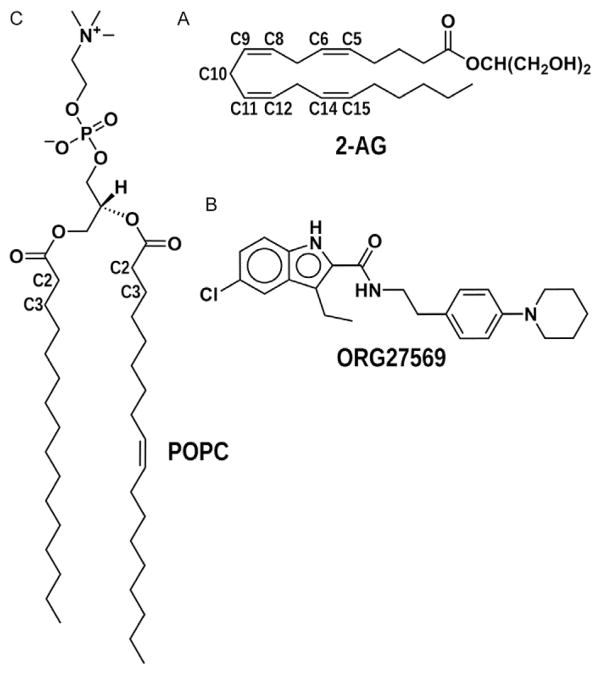
Here, we present the protocol for: (i) construction of the simulation cell as well as (ii) details for the equilibration and production runs used in our MD simulations. In addition, we highlight these procedures with two recent applications of MD in the study of cannabinoid receptor activation and signaling properties. In the first, we describe the location, orientation, and binding characteristics of the endogenous ligand 2-AG in the CB2 system. 2-AG (Fig. 1A) is a canonical GPCR agonist in that it produces both G-protein and G-protein-independent signaling (Delgado-Peraza et al., 2016; Flores-Otero et al., 2014). The second application is a study of ORG27569 (Fig. 1B), a novel CB1-negative allosteric modulator of signaling, that inhibits G-protein-dependent signaling of CB agonists, yet produces its own G-protein-independent ERK1/2 signal via β-arrestin-1 (Ahn, Mahmoud, & Kendall, 2012; Ahn et al., 2013). Given the unique location of these hydrophobic ligands in the lipid bilayer, the activation of the cannabinoid receptors is likely to proceed via binding via the lipid membrane. Moreover, the location and orientation of these ligands in the membrane will dictate the pathway for binding. Therefore, a detailed understanding of their location/orientation in the membrane is essential in mapping the binding characteristics of these cannabinoid ligands.
Fig. 1.
Chemical structures of 2-AG, ORG27569, and POPC. This figure illustrates the chemical structures and group definitions for 2-AG, ORG27569, and POPC. For (A) 2-AG, the 2-AG glycerol headgroup (HG) is –CH(CH2OH)2. (B) The structure of ORG27569 and for (C) POPC the glycerol is the (CH2)2CH connector between the phosphate and ester groups.
Section 2 provides typical procedures used as well as simulation packages employed throughout these studies. It should be noted that individual applications may have slightly different details and those are delineated in Section 3, where each application setup is discussed in detail. In Section 4, we highlight recent results and discussion of these MD simulations. Section 5 summarizes our work to date and comments on future studies in our efforts to unravel the activation mechanisms/signaling properties of the cannabinoid receptors.
2. GENERAL METHODS
In this section, we provide a detailed description of the construction, equilibration, and production runs for the present representative cannabinoid systems. This procedure was first employed by Woolf and Roux in an early study of the membrane-bound gramicidin A channel in an all-atom lipid bilayer (Woolf & Roux, 1996), and the current implementation is described in detail by Hurst et al. (2010) and Grossfield, Feller, and Pitman (2006).
2.1 Construction of the Simulation Cell
In all the simulations, the z-direction is taken as the normal to the plane of the membrane. The all-atom model of the cannabinoid CB1 or CB2 receptor was aligned with the membrane such that the TM helices/amphipathic Hx8 are approximately perpendicular/parallel with this plane. Positioning was such that Hx8 is at a depth where the hydrophobic residues reach toward the hydrophobic core of the membrane and hydrophilic residues are water/lipid headgroup accessible. Thus oriented, the system was built in the following four sections.
2.1.1 Determine the Simulation Cell Size
Typically the area of the box size for these simulations is obtained by estimating the transverse area of the protein at the approximate depth of the phospholipid headgroups, and then allowing a buffer on each side of the receptor to the box edge. A buffer of at least 12 Å to each edge has been used. The number of lipids to occupy the simulation cell is then determined by the free area divided by the appropriate area per lipid. In the z-direction (membrane normal), the box is extended to at least 12 Å past the maximum and minimum position of the protein atoms. Since the receptors have EC/IC loops and termini, this provides sufficient space for the protein in the aqueous environment. The area per lipid used is either taken from experiment or can be obtained by a pure bilayer simulation.
2.1.2 Generate the Unsolvated Membrane Cell
To generate optimal lipid packing about the receptor in the simulation cell, the following procedure is employed. First, the area of the box is expanded by a factor of 5 in the plane of the membrane. Subsequently, Lennard–Jones spheres, which effectively mimic the size of the phospholipid headgroup, are placed randomly in this expanded box at the location of the phospholipid interface, taken as ±(19±0.5 Å) for 1-palmitoyl-2-oleoyl-phosphatidylcholine (POPC). Note that the purpose of box expansion is to reduce the likelihood that a sphere is placed inside the receptor bundle. These spheres will act as pseudoheadgroups for the phospholipids and determine the location for the initial placement of the all-atom structure of each lipid. Since cannabinoid ligands are typically highly lipophilic and are embedded in the phospholipid membrane, if present in the simulation, Lennard–Jones spheres are included for the ligands as well. This is in analogy to the placement of cholesterol in earlier rhodopsin simulations (Grossfield et al., 2006; Pitman, Grossfield, Suits, & Feller, 2005).
With the protein, and any internal waters or ligands present fixed and the pseudoheadgroups restrained to lie in the plane of the membrane (using a force constant of 50.0 kcal/mol/Å2), 500 steps of steepest descent minimization are performed. This is followed by progressively reducing the lateral area of the simulation cell. The box is reduced in the x, y dimensions by 5.0 Å and the pseudoheadgroup x, y coordinates are appropriately scaled. Again, with the receptor fixed and the z coordinate of the pseudoheadgroups restrained, 500 steps of steepest descent minimization are performed followed by 1000 steps of Langevin dynamics at 500K with a collision frequency of 5ps−1. This is repeated until the lateral area is the size of the box determined in Section 2.1.1. This section simply generates a relaxed random placement of the initial headgroup location while ensuring that the Lennard–Jones spheres are at an appropriate distance from the receptor.
2.1.3 Placement of All-Atom Phospholipids
In this step, the Van der Waals (VDW) spheres are replaced with the actual, all-atom lipid molecules. The conformations of these lipid species are typically generated in a prior pure lipid simulation and stored as a library of individual conformations. This library therefore contains preequilibrated lipid conformations that can be reused. A random lipid conformation is chosen out of the library, and the P atom of this molecule is placed at the location of one of the VDW spheres. As these lipids are generated in an ensemble of conformations, steric clashes with the embedded protein can ensue. A clash is defined when more than five pairs of heavy atoms of the placed lipid and protein are within 2 Å. If the clash condition is met, that particular lipid conformation is discarded and placement of another randomly chosen conformation from the library is attempted. The lipid conformation is accepted when the clash condition is not met and the next all-atom lipid is attempted. Failure occurs if there is not a successful placement in 1000 attempts. The run is then aborted and another round of pseudoheadgroup placement is initiated (Section 2.1.2). Placement of all-atom lipids continues until all the pseudospheres are replaced with all-atom conformations. For simulations where cannabinoid ligands are included, a particular atom in the ligand is chosen for placement near the phospholipid headgroup. Placement of the ligand proceeds similar to that described for the lipids with the exception that it is often the case that a library of conformations may not be available. Therefore, a low-energy conformer is used, and upon placement at the VDW sphere, the ligand is given a random rotation and/or displacement in the membrane normal direction.
2.1.4 Relaxation of the Phospholipid Acyl Tails
At this stage, the receptor and lipid bilayer have been constructed. Although care has been taken that no serious clashes occur between the lipids and the protein, there may still be some close contacts. Moreover, the acyl tails of the lipids, drawn individually from the lipid library, can have overlaps. To relieve these overlaps and produce a relaxed initial membrane conformation, a series of controlled minimizations are performed. The protein is once again fixed and the headgroups are harmonically restrained (force constant = 1kcal/mol/Å2) to their initial position in the z-direction, and invoking periodic boundary conditions, 2000 steps of steepest descent minimization are performed. Very short cutoffs are used at this point, since the goal is to simply relieve close contacts. Prior to solvation of the lipid bilayer with water and ions, the acyl tails are further relaxed by a series of minimizations with varying degrees of freedom fixed. The adjustable atoms are subdivided into two groups, one with full nonbonded interactions and the second group with a scaled set of interactions using the block functionality of CHARMM (Brooks et al., 2009). Only VDW interactions are invoked between the scaled atoms. A scaling factor of 0.01 has been found to be effective (Grossfield et al., 2006; Hurst et al., 2010) and is employed here.
The protein and lipid headgroups are placed in the fixed group. The lipid acyl tails are in the second group of flexible atoms with either full or scaled interactions. In the first round of minimizations, only scaled VDW interactions are allowed for all the atoms in the acyl tails and 2000 steps of steepest descent are performed. In the next step, the first carbon atom of the acyl tail and hydrogens bonded to it are placed in the full interaction group and the minimization is repeated. This progresses down the acyl chain, sequentially promoting the next carbon atom of the chain into the full interaction group until the entire chain has been minimized with full interactions. The purpose of this section is to relieve acyl tail conformations by allowing the lower portion of the chain maximal flexibility, while clashes are progressively relieved. Note that restraints on cis-double bonds are applied to retain proper conformation about these unsaturated carbons. These restraints are subsequently released with 5000 steps of steepest descent. In general, this produces a membrane bilayer with relaxed lipid conformations and a fixed receptor.
A special consideration is needed if ligands with ring moieties are placed in the lipid membrane, for example, cholesterol (Grossfield et al., 2006). In this case, it is possible that during the chain optimizations just described, a lipid tail may penetrate the ring. Similar to the procedure employed for cholesterol, a dummy atom is placed at the center of all ring systems prior to the acyl chain optimization just described. This effectively blocks, via repulsive VDW interactions, any acyl tail from ring penetration. This dummy atom is subsequently removed.
2.2 Ion Addition and Solvation With Water
At this stage, the receptor and bilayer have been constructed and the species left to be added are the neutralizing ions and those added to bring the system to a specified physiological ionic strength, usually taken as 0.15 M. The number of ions is determined by the charge of the protein and the box size. As periodic boundary conditions using particle mesh electrostatics (PME) (Essmann et al., 1995; Salomon-Ferrer, Gotz, Poole, Le Grand, & Walker, 2013) will be applied, overall neutralization of the simulation cell is enforced. The ions are then placed randomly in the simulation box, at least 28 Å from the membrane center. This ensures that ions are placed in the aqueous phase; moreover, they are placed such that they are at least 8 Å from any protein atom that protrudes into the aqueous space. Once the ions are placed, the entire box is solvated with water. The water used is taken from a preequilibrated box of TIP3 water molecules. These waters are added such that they do not extend past the phospholipid carbonyl oxygens into the hydrophobic core of the membrane. Waters overlapping with previously placed heavy atoms are removed. Once all the atoms have been placed, periodic boundary conditions are invoked, and with the protein and membrane fixed, 200 steps of steepest descent minimization are performed. This relieves any potential steric overlap that has occurred during the placement of the ions and solvating waters. Given that each independent construction of the system produces a slightly different total number of water molecules, for convenience, a few randomly chosen water molecules are removed from bulk in order to produce independent systems of the same total size.
2.3 Full Minimization and Warming
As described in Grossfield et al. (2006) to further relieve poor initial contacts, 2000 steps of steepest descent minimization are performed using CHARMM (Brooks et al., 2009), with all heavy atoms of the protein, and if present ligands and internal waters, fixed. This is followed by a series of warming/minimization steps using NAMD (Phillips et al., 2005). Each step includes 500 steps of conjugate gradient minimization followed by 500 steps of MD at a 5 K higher temperature. Throughout this phase, restraints are applied to the protein/ligand and internal water molecules (force constant = 5 kcal/mol/Å2). This is performed until the target temperature of 310 K is reached. These restraints are released in a series of minimizations where the force constant is gradually reduced from 5.0 to 2.5, 1.0, 0.5, 0.25, 0.1, and lastly 0.05 kcal/mol/Å2, with 500 steps of minimization at each step. Finally, 2000 steps of restraint-free minimization are executed. MD simulations are then performed on the fully minimized systems.
2.4 Details of MD Simulations
Prior to unrestrained MD on these systems, we often perform 2 ns of position restrained MD using the AMBER package (Case et al., 2016, 2005; Salomon-Ferrer, 2013). Here, the heavy atoms of the protein and ligands are restrained using a force constant equal to 5.0 kcal/mol/Å2. For all production runs, unless otherwise noted, the GPU accelerated PME pmemd. cuda is utilized. Long-range electrostatics are included using PME with the recommended 8 Å cutoff (Case et al., 2016) and default values for the charge grid spacing (chosen to be approximately 1 Å and B-spline(cubic)). The NPT ensemble is used to maintain temperature (T = 310K, Langevin dynamics with a collision frequency of 5 ps−1) and pressure (P = 1.0 bar, using the weak coupling Berendsen pressure control (Berendsen, Postma, van Gunstersen, Dinola, & Haak, 1984) with pressure relaxation time of 8 ps). High-frequency bonds to hydrogen are restrained using the Shake method allowing the use of a 2-fs integration time step. The 2 ns of restrained MD allows the simulation cell to adjust and produce a reasonable density, without perturbing the receptor structure. This is followed by production MD, using the same settings as above but without restraints.
3. METHODS FOR EACH SYSTEM
In the following section, we provide details that are specific to the particular system under study. Section 3.1 includes the simulations for 2-AG embedded in a POPC bilayer and is followed in Section 3.2 by the set of calculations where 2-AG in a POPC bilayer spontaneously binds/activates the CB2 receptor. In Section 3.3, we perform an analogous set of simulations for ORG27569 in which (a) ORG27569 spontaneously partitions into a POPC bilayer; (b) its location in the phospholipid bilayer is monitored with an equilibrium run where several ORG27569 molecules are embedded in a POPC bilayer; and finally (c) ORG27569 binds and activates the CB1 receptor. In the latter case, the activation is not referring to traditional G-protein signaling, but to G-protein-independent signaling via β-arrestin-1.
3.1 2-AG Embedded in a POPC Model Membrane
3.1.1 Details of the Construction of the 2-AG/POPC Simulation Cell
The model membrane was built with 38 2-arachidonoylglycerol (2-AG) molecules, 124 POPC molecules, and hydrating waters for a total of 44,736 atoms in a simulation cell of dimensions 74.35 Å × 74.35 Å × 85.0 Å. The simulation cell was constructed using the method described in Sections 2.1–2.2. Each 2-AG molecule was oriented with its long axis parallel to the membrane normal (z) and randomly rotated about the z-axis. The center glycerol carbon atom (Fig. 1A) was placed at one of the VDW spheres and randomly shifted by up to ±2.5 Å in the z-direction. The clash condition, e.g., overlap with previously placed 2-AG molecules, was determined; e.g., if five or more pairs of heavy atoms were within 2 Å, this configuration was discarded and a different random rotation/translation applied. This procedure ensured that the 2-AG molecules were placed in the approximate lipid headgroup region, with the acyl tails in the hydrophobic core of the membrane. Relaxation of the lipids and hydration was performed as described in Section 2.1.4. The CHARMM 36 lipid force field (Klauda et al., 2010) was used in this study and parameters for 2-AG were taken as in our earlier MD studies of 2-AG/CB2 simulations (Hurst et al., 2010). We constructed five independent systems, based on the random placement of the 2-AG/POPC molecules in the simulation cell.
3.1.2 Initial Minimization
To relieve poor initial contacts, 2500 steps of steepest descent minimization were performed using CHARMM (Brooks et al., 2009), with all heavy atoms of the ligands fixed. This was followed by a series of restrained minimizations using NAMD(Phillips et al., 2005). In this slow release phase, the 2-AG heavy atoms were restrained to their initial positions and starting with a force constant of k = 5.0 kcal/mol/Å2, 500 steps of conjugate gradient minimization were performed. The force constant was subsequently reduced to 2.5, 1.0, 0.5, 0.25, 0.1, and finally 0.05 kcal/mol/Å2, with 500 steps of minimization at each step. Finally, 2000 steps of restraint-free minimization were executed. MD was then performed on the fully minimized system.
3.1.3 Details of MD Simulations
For all production runs, the GPU accelerated PME AMBER package (Case et al., 2016, 2005; Salomon-Ferrer, 2013) was utilized. Unless otherwise noted, these runs were performed in the NPT ensemble using the settings described in Section 2.4. The temperature in these calculations was set to 300 K. As the cell dimensions were fluctuating during the first 30 ns, these data were removed for the ensuing analysis. Each trajectory was run for at least 105 ns, with the last 75 ns used for analysis and configurations written at 10 ps intervals. Mass density distributions were performed with LOOS-2.3.2 (Romo & Grossfield, 2009). Dihedral time series, image, and movie construction were generated with VMD (Humphrey, Dalke, & Schulten, 1996).
3.1.4 Calculation of the Mass/Number Density Distributions
After centering the resulting trajectory such that the average position of the phosphorus atoms is located at the center of the membrane (z = 0), the simulation cell was sliced into z = 1 Å slabs. In each subvolume, the mass density of the particular components was accumulated and averaged over the trajectory.
3.2 2-AG Binds to CB2
The model of the inactive CB2 receptor was generated as described in Hurst et al. (2010). Using this model a preliminary equilibration run was performed by placing the CB2 receptor in a bilayer with 99 stearoyl-docohexaenoyl-phosphatidylcholine molecules in a box of dimensions 54 Å × 76.2 Å × 95.5 Å using the method of Section 2. In this case, the minimization/warming was performed in the CHARMM software package (Brooks et al., 2009) using the CHARMM27 protein and lipid force fields (Feller & MacKerell, 2000; MacKerell et al., 1998; Pitman, Suits, Mackerell, & Feller, 2004). The system was warmed to 310 K over 1 ns using velocity resampling every 5 ps and an equilibration period of 20 ns ensued. Production MD for 286 ns was subsequently performed. Upon equilibration, the conformation of CB2 was placed in a mixed 2-AG/POPC bilayer consisting of 38 molecules of 2-AG and 123 molecules of POPC. The method of Section 2 was employed to randomly distribute the 2-AG and POPC molecules in a box of 74.1 Å × 74.1 Å × 96.7 Å along with 9965 molecules of water and NaCl (14Na+/31Cl−) such that the system was neutralized and the ionic strength was brought to 0.1 M. At this point, production MD was performed with Blue Matter (Fitch et al., 2003) on IBM’s Blue Gene/W supercomputer. The simulations discussed here were done at constant volume with velocity resampling (at 1 ns) to maintain a temperature of 310K.
Two independent trajectories were simulated by altering the random number seed in the 2-AG/POPC lipid placement step of Section 2 and were run for 887 ns or 874 ns. In one of these trajectories, at 40 ns into the 887 ns run, a specific 2-AG partitioned out of the bulk lipid milieu and into the TMH6/TMH7 interface. This partitioning was observed to be long lasting; however, no binding event occurred subsequent to this partitioning. Therefore, at 286 ns into this run, two new trajectories were initiated by reassigning the velocities using the Maxwell–Boltzmann distribution at 310K. These were run for 142 ns/1420 ns each. At approximately 53 ns into the 1420 ns run, the headgroup of the partitioned 2-AG entered the CB2 receptor between TMH6/TMH7.
3.3 MD of ORG27569 in Water and a POPC Model Bilayer
3.3.1 ORG27569 Initiated in the Aqueous Phase
The first set of simulations focused on the spontaneous partitioning of ORG27569 from the water phase into the lipid bilayer. In this case, a pure POPC bilayer, composed of 180 lipid molecules and hydrating waters, was constructed as described in Sections 2.1–2.3, with production runs performed with the CUDA implementation in AMBER (Case et al., 2016, 2005) in the NPT ensemble. The CHARMM 36 lipid force field (Klauda et al., 2010) was used in this study. The parameters for ORG27569 used in the MD simulations described here were initially obtained via the ParamChem server (Vanommeslaeghe & MacKerell, 2012; Vanommeslaeghe, Raman, & MacKerell, 2012). High penalty parameters were optimized as described in Vanommeslaeghe et al. (2010). The simulation cell is initially 78.4 Å × 78.4 Å × 100.0 Å. Two ORG27569 molecules were placed in the aqueous phase and overlapping waters were removed. The settings for the MD are described in Section 2.4, with these simulations run at 300K for a total of 120.6 ns.
3.3.2 ORG27569 Initiated at the Phospholipid Bilayer Interface
In this set of simulations, the ORG27569 molecules were initially placed at the interface of the POPC bilayer. The simulation cell build was similar to that of 2-AG in a POPC bilayer, using 62 molecules of POPC per leaflet, 7 ORG27569 per leaflet, and hydrating waters for an initial box size of 62.8 Å × 62.8 Å × 85.0 Å. Here, the center of mass (COM) of the ORG27569 was used as the anchor point to place the Lennard–Jones spheres as described in Section 2.1.3. The conformation of ORG27569 used in the placement was taken as the global energy minimum, and after placement, the molecule was randomly rotated to generate independent starting positions. Seven ORG27569 molecules were placed in each leaflet, and three independent 300 ns simulations were performed. The first 40 ns was removed from the analysis as equilibration. The settings for the MD were identical to those used for the ORG27569 in water described in Section 3.3.1.
There is one additional feature of the simulation cell building process for the ORG27569 simulation started at/near the phospholipid interface. Section 2.1.4 describes the relaxation of the acyl tails. For ring systems such as in ORG27569, it is possible that during the acyl chain relaxation, tails of the lipid will pierce rings. This situation is avoided by placing a dummy atom at the center of each ring in these molecules. So for ORG27569, this corresponds to adding four dummy atoms. These are removed after the lipid tail relaxation and effectively block any lipid/ring penetration.
3.4 ORG27569 Binds to and Activates CB1
3.4.1 Equilibration of the CB1 Receptor and Construction of the ORG27569/CB1 Simulation Cell
The CB1 receptor, built as described in Shore et al. (2014)), truncated at SER88/GLY417 for the N-terminus/C-terminus, respectively, was aligned with the S1P1 structure from the OPM database (Lomize et al., 2006) resulting in the transmembrane region being centered at the middle of the POPC (Fig. 1C) lipid bilayer and the amphipathic helix 8 orientated parallel to the plane of the membrane at approximately the lipid/water interface. Prior to the addition of ligands, CB1 was simulated for 335 ns in a POPC lipid bilayer. The model membrane simulation cell was constructed using the method described in Section 2. The CHARMM 22 protein force field (MacKerell et al., 1998) and theCHARMM36 lipid force field (Klauda et al., 2010) were used in this study. Charge neutrality was enforced with addition of chloride counterions and an overall ionic strength of 0.1 M was obtained by adding NaCl.
3.4.2 Initial Minimization and Details of MD
To relieve poor initial contacts, 2500 steps of steepest descent minimization were performed using CHARMM (Brooks et al., 2009), with all heavy atoms of the protein fixed. This was followed by a series of restrained minimizations using NAMD (Phillips et al., 2005). In this slow release phase, the CB1 heavy atoms were restrained to their initial positions, and starting with a force constant of k = 5.0 kcal/mol/Å2, 500 steps of conjugate gradient minimization were performed. The force constant was subsequently reduced to 2.5, 1.0, 0.5, 0.25, 0.1, and finally 0.05 kcal/mol/Å2, with 500 steps of minimization at each step. Finally, 20,000 steps of restraint-free minimization were executed. MD was then performed on the fully minimized system. For all production runs, the GPU accelerated PME AMBER (Case et al., 2016, 2005) was utilized and the detailed settings for the MD are described in Section 2.4 for a T = 300K.
3.4.3 Addition of ORG27569 to the Simulation
Upon equilibration of the receptor, a frame, at 70 ns, was extracted and the simulation cell was rebuilt with the inclusion of 14 ORG27569 molecules. The ligands were placed as follows: seven extracellular (defined by the last four turns of the transmembrane helices) locations were defined in a circle relative to the center of the TMH at a radial distance such that at least one phospholipid could be placed between the receptor and a given ORG27569 molecule. The seven locations were randomized on this circle, and the COM of an ORG27569 was placed at this site. Based on our simulations of ORG27569 spontaneously partitioning into the phospholipid bilayer described in Section 3.3, the orientation and location of the ORG27569 molecules were such that the indole moiety of ORG27569 was approximately at the lipid/water interface. Each molecule was rotated by a random amount. If contacts between the ORG27569 and CB1 ensued, the ligand was moved radially away from the receptor until the contacts were removed. Similar placement was performed for the seven IC ORG27569 molecules. The final system contained 90,921 atoms including 177 POPC molecules, 14 ORG27569 molecules, the protein, ions, and 20,300 solvating water molecules. Three independent systems were constructed and minimized, and MD for 1.4, 1.24, and 1.175 μs were performed as described earlier for the CB1/POPC system at a T = 300K.
4. RESULTS AND DISCUSSION
4.1 2-AG in a POPC Bilayer
2-AG, the endogenous ligand for the CB2 receptor, is a highly lipophilic lipid-derived molecule (Fig. 1A), containing a polar glycerol headgroup attached via an ester linker to a 20-carbon atom arachidonoyl chain. This ligand is made on demand in the bilayer itself in a two-stop process in which phospholipase C-β hydrolyzes phosphatidylinositol 4,5-phosphate to generate diacylglycerol, which is then hydrolyzed by diacylglycerol lipase to yield 2-AG (Di Marzo, 2008; Piomelli, 2003). 2-AG is thus ultimately embedded in the phospholipid bilayer upon approach to the membrane-bound CB2, the details of its location as well as its orientation with respect to CB2 is a central issue in understanding the mechanism of such lipid-based signaling events at the atomic level. In this first application of MD simulations, we have computed the mass density distributions for the chemical components for 2-AG in a POPC bilayer. In addition, the flexibility about the methylene carbons in the unsaturated chain of 2-AG is described.
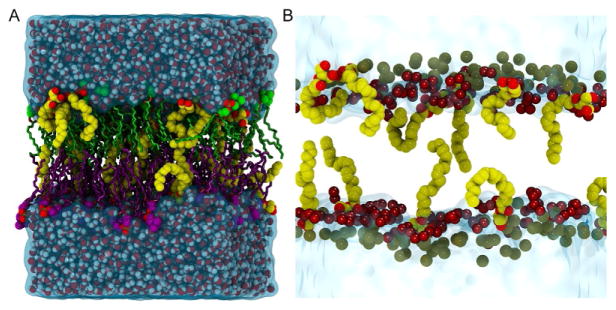
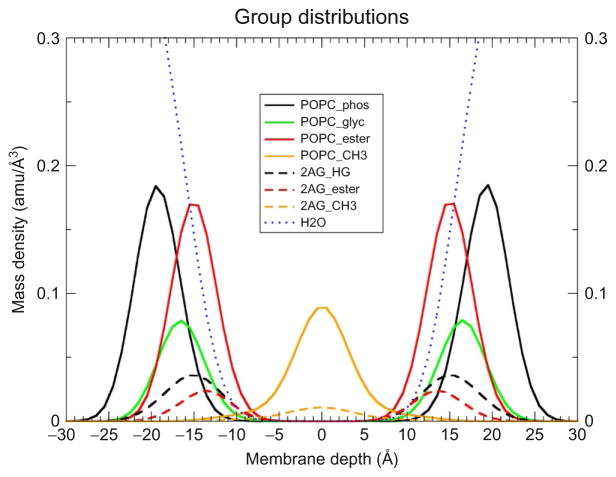
The accumulated 375 ns of 23.5 mol% 2-AG/POPC simulations reveals the salient features of this highly flexible, lipophilic ligand. In Fig. 2A, we present an illustration of the entire simulation cell, while in Fig. 2B a close-up of the interfacial region between the hydrated phospholipid headgroups and the hydrophobic core and several 2-AG molecules are displayed. The 2-AG headgroups are distributed from just below the P atoms to near the depth where the water density goes to zero. The acyl tail often extends deeply into the hydrophobic core of the POPC. In Fig. 3, we present the mass density distributions computed using the equilibrated portion of the five independent trajectories. The chemical structures of the 2-AG/POPC groups are defined in Fig. 1A/C, respectively. Water penetration into lipid bilayers is known (Wiener & White, 1992) to go as deep as the lipid carbonyls, and from Fig. 3, it is clear that the water density in these simulations drops to essentially zero through the region characterized by the POPC ester group distribution. In fact, water penetration into POPC bilayers has been discussed in our earlier study of lipid-bound GPR55 agonists (Kotsikorou et al., 2011). The ligand’s polar headgroup is approximately located at the same depth as the POPC glycerol moiety. Note that in this region, which is just underneath the charged phosphate groups, there is still significant water penetration. In fact, the water density at the location of the maximum in the broad 2-AG headgroup distribution (±15 Å) is ~25% of the bulk water. As such, these polar headgroups of 2-AG remain sufficiently hydrated. The terminal methyl of the 2-AG molecules has a broad distribution with the maxima located at the center of the bilayer. These density distributions reflect the average locations of the 2-AG chemical groups specified in Fig. 1A. The broad distribution for the terminal methyl group is a signature of the highly flexible character of the arachidonoyl chain of 2-AG. The molecular origin of this behavior arises due to the particular flexibility of each methylene carbon between two double bonds in the arachidonoyl chain. These phenomena have been discussed in detail in our previous work (Barnett-Norris, Guarnieri, Hurst, & Reggio, 1998; Kotsikorou et al., 2011). Briefly, methylene carbons that are between carbon–carbon double bonds, such as those in the polyunsaturated chains of 2-AG, as well as polyunsaturated lipids such as DHA, have been shown to be particularly flexible as a result of the broad minima and low-energy barrier (~1 kcal/mol; Feller, Gawrisch, & MacKerell, 2002) to interconversion between their rotameric states. Such flexibility has been shown to produce some of the unusual properties observed for these polyunsaturated lipids, such as low deuterium order parameters and rapid NMR relaxation rates relative to their saturated partners (Eldho, Feller, Tristram-Nagle, Polozov, & Gawrisch, 2003; Feller et al., 2002). Moreover, similar flexibility has been reported for the polyunsaturated chains of endogenous cannabinoid ligands such as 2-AG using Monte Carlo simulation methods (Barnett-Norris et al., 1998).
Fig. 2.
Illustration of a typical 2-AG/POPC (23.5 mol%) simulation cell. (A) The simulation cell is rendered as follows: individual water molecules are rendered in VDW with red (oxygen)/white (hydrogen); the water surface is rendered in a transparent blue. The upper/lower leaflet POPC acyl chains are shown in licorice and colored green/purple, respectively. The POPC headgroups are rendered in VDW with oxygen (red) and phosphorus (gold), while the upper/lower leaflet choline carbons are green/purple. (B) Close-up of several 2-AG molecules in the simulation cell. Water is rendered in the transparent blue surface and phosphorus atoms are the gold VDW spheres. The 2-AG molecules are rendered in VDW with the carbon/oxygen atoms colored yellow/red, respectively. The darker red spheres are representative ester group oxygens of the POPC molecules. This illustrates that the 2-AG headgroups are distributed from just below the P atoms to the depth where the water density goes to zero. The 2-AG acyl tail extends deeply into the hydrophobic core of the POPC bilayer.
Fig. 3.
Mass distributions of 2-AG in POPC averaged over five independent trajectories each of 75 ns. This figure illustrates the average group mass distribution for POPC, 2-AG, and water. The chemical compositions are defined in Fig. 1. The membrane is centered such that the average phosphorus location is set to zero and the membrane depth is measured relative to z = 0.
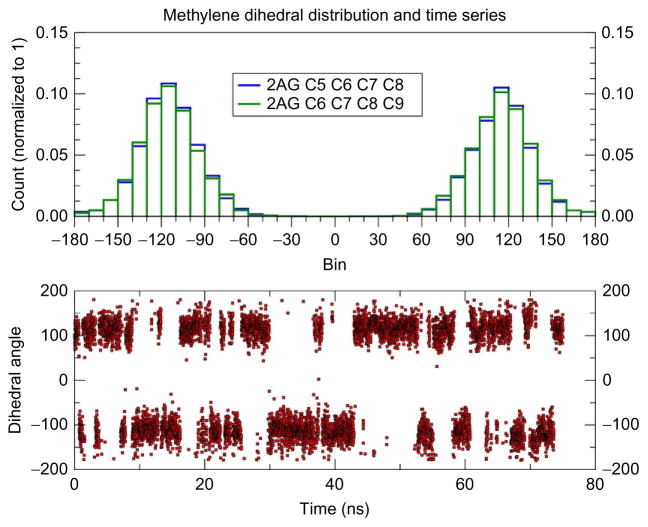
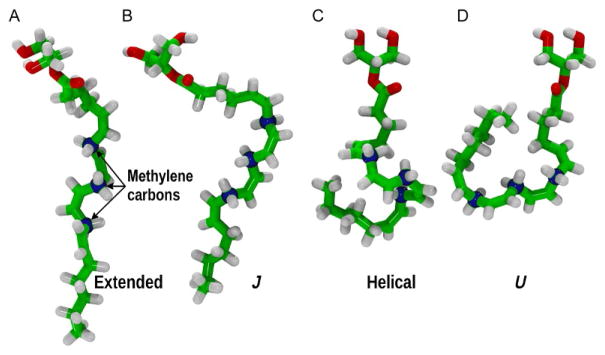
Here, we see much the same behavior in the dynamics of the acyl chain of 2-AG. In addition to the broad methyl distribution, the time series for a typical methylene carbon is displayed in Fig. 4, along with a histogram of these data. The dihedral reported in Fig. 4 (lower panel) is from one of the five trajectories and clearly illustrates the multiple transitions between the two rotamers occurring during this 75 ns run. In Fig. 4 (upper panel), the histograms of the C7 methylene dihedrals are plotted and indicate that these rotamers are equally populated. 2-AG undergoes a multitude of dihedral transitions and the high flexibility about these methylene carbons produces a rich conformational space of the acyl tails in a lipid bilayer. An illustration of this conformational complexity is provided in Fig. 5, where representative conformations of 2-AG from the simulations are reported. As is clear from Fig. 5 2-AG samples a large diversity of conformations.
Fig. 4.
2-AG methylene dihedral distribution and time series. The histogram of the methylene dihedral about the C7 methylene carbon in 2-AG is reported in the upper panel for a typical trajectory at T = 300K calculated with a bin width of 10 degrees. The specific carbon atoms are labeled as in Fig. 1. The lower panel displays the time series for the C5–C6–C7–C8 dihedral angle, and this is typical for the other trajectories and methylene carbons.
Fig. 5.
Sample conformations of 2-AG. This figure illustrates the conformational flexibility of the 2-AG polyunsaturated acyl chain. The atoms are colored as follows: oxygen is red and carbon green except the methylene carbons, which are rendered as blue spheres. As discussed by Barnett-Norris et al. (1998), these conformations can be characterized by the signs of the series of six methylene dihedrals: (A) extended conformation, the ω5/ω6, ω8/ω9, and ω11/ω12 pairs all have the same sign; (B) J conformation where only the ω5/ω6 pair has opposite sign; (C) helical conformation where all three pairs have opposite signs; and (D) U conformation where only the ω8/ω9 pair has the same sign. The dihedrals are defined as: ω5 = C5–C6–C7–C8, ω6 = C6–C7–C8–C9, ω8 = C8–C9–C10–C11, ω9 = C9–C10–C11–C12, ω11= C11–C12–C13–C14, and ω12 = C12–C13–C14–C15.
In summary, the 2-AG molecules in the phospholipid bilayer are located such that their headgroups are just within the POPC phosphate groups overlapping the lipid’s glycerol moieties, while the acyl tails exhibit extensive conformational freedom, with the terminal methyl group on average at the center of the bilayer. These features of 2-AG are critical for its binding and activation of CB2 as discussed in the next section.
4.2 2-AG Spontaneously Binds to CB2 via a Lipid Pathway
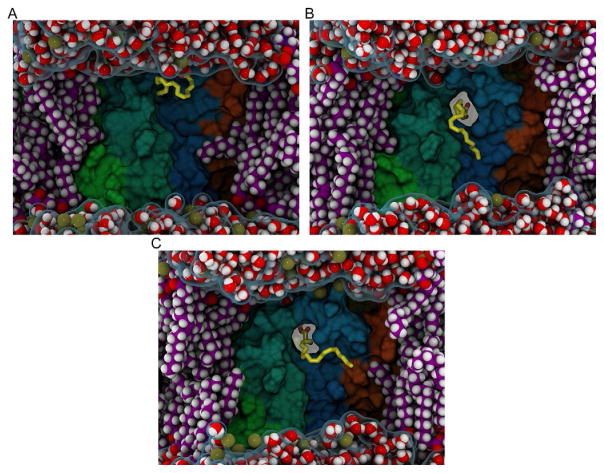
In the MD performed with 2-AG randomly placed about an inactive CB2 receptor in a fully hydrated POPC bilayer, a spontaneous binding event was observed (Hurst et al., 2010). Several independent trajectories were run at specific stages in these simulations. At 40ns into one of the initial production trajectories, a 2-AG molecule partitions out of bulk lipid into the interface of TMH6/TMH7 of CB2. This partitioning is associated with the formation of an opening between these TMHs that is produced by spontaneous rotameric changes in many residues that line the portal. This portal occurs above/on the EC side of W6.48 and in the 310-helical region of TMH7 (C7.42–M7.47) and exhibits a long-lasting interaction with this CB2 interface. In Fig. 6, we illustrate this opening as well as the location of the partitioned 2-AG. This configuration is taken at 275ns from the trajectory where the 2-AG had partitioned out of lipid. The portal residues include P6.50, V6.51, L6.54, F7.35, C7.38, S7.39, C7.42, and I7.44.
Fig. 6.
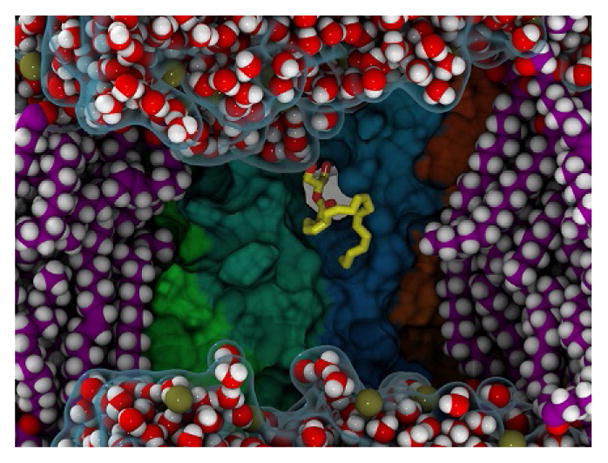
A 2-AG molecule partitions out of bulk lipid to the TMH6/TMH7 interface. This figure illustrates the 2-AG which partitions out of lipid into the TMH6/TMH7 interface and the portal which forms between those transmembrane helices. The water phase is shown as a transparent blue surface with individual water molecules rendered in VDW spheres with oxygen red and hydrogen white. POPC molecules are rendered in VDW spheres with carbon/hydrogen/phosphorus colored purple/white/gold, respectively. The surface of CB2 is rendered with individual helix surfaces colored as: TMH5 (green), TMH6 (teal), TMH7 (dark blue), and TMH1 (orange). The 2-AG that has partitioned out of bulk lipid is rendered in licorice with carbon (yellow) and oxygen (red). The portal, or opening between TMH6/TMH7, is observed as a gray gap between TMH6 and TMH7 near the 2-AG headgroup.
In the course of this 887ns trajectory, no 2-AG entry into the CB2-binding pocket was observed. However, using the configuration at 275ns and performing a velocity resampling as discussed in Section 3.2 produces a run where after another 53ns this 2-AG enters the receptor via the portal by insertion of its polar headgroup. This entry sequence is illustrated in Fig. 7. In Fig. 7A a representative snapshot of 2-AG that has partitioned out of bulk lipid into the TMH6/TMH7 interface is reported. Fig. 7B is 55ns into the resampled trajectory and clearly illustrates that the headgroup has inserted between TMH6/TMH7. Finally, Fig. 7C shows the time point at 127ns into this trajectory where the headgroup has inserted further. It is generally accepted that upon binding a G-protein agonist, a GPCR undergoes an IC conformational change such that the iconic ionic lock, typically formed between TMH3 (R3.50) and TMH6 (E/D6.30), ruptures (Farrens et al., 1996; Jensen et al., 2001; Rasmussen et al., 2011; Scheerer et al., 2008; Venkatakrishnan et al., 2013). Subsequently, the IC ends of TMH3/TMH6 separate with the TMH6 IC end moving away from the core of the helix bundle. This provides an opening cleft on the IC side of the GPCR such that a G-protein can bind by insertion of the C-terminal α-helix region of the Gα subunit into this opening. Ultimately the G-protein itself is activated. Depending on the nature of the Gα subunit, this activation leads to the stimulation (Gs) or inhibition (Gi/o) of secondary messengers such as cAMP, which act to initiate specific signaling pathways. Therefore, G-protein activation is characterized by a conformational change in the GPCR that includes the rupture of this salt bridge and the movement of the IC ends of the receptor, in particular TMH6. In addition, activation is accompanied by a change in the conformation of W6.48 in the ligand-binding pocket and an influx of water (Grossfield, Pitman, Feller, Soubias, & Gawrisch, 2008; Romo, Grossfield, & Pitman, 2010).
Fig. 7.
Time sequence of 2-AG entry into the binding pocket of CB2. The rendering is described in the caption of Fig. 6. Each frame illustrates a different time point in the binding of 2-AG to CB2. (A) Sample point where 2-AG has partitioned out of bulk lipid into the TMH6/TMH7 interface. (B) Configuration at 55ns of the resampled trajectory where the 2-AG headgroup has inserted via the portal. (C) Configuration at 127ns of the resampled trajectory where the 2-AG headgroup is fully inserted.
After approximately 59ns into the trajectory in which the 2-AG binds (Figs. 6 and 7) and 5ns after ligand entry, the CB2 IC D6.30–R3.55 salt bridge breaks. The IC ends of TMH6, as well as TMH5, move away from the bundle and project closer to the lipid bilayer. This rupture of the salt bridge is illustrated in Fig. 8. Moreover, 131.14ns after 2-AG entered CB2, the distance between the IC ends of TMH3/TMH6 increases to 13.86 Å, which approaches the opening on the IC side observed in (1) the bovine opsin*-Gα C-terminal peptide complex (14.5 Å) (Scheerer et al., 2008) as well as (2) the ~14 Å distance observed in the β2-adrenergic—Gs structure (Rasmussen et al., 2011). In this report, we have focused on the spontaneous ligand binding via lipid with the demonstration of the initial steps of GPCR activation. However, as discussed more thoroughly in Hurst et al. (2010), subsequent to this binding of 2-AG and IC opening of CB2, full activation is attained with the observation of a W6.48 rotamer change and a large influx of water.
Fig. 8.
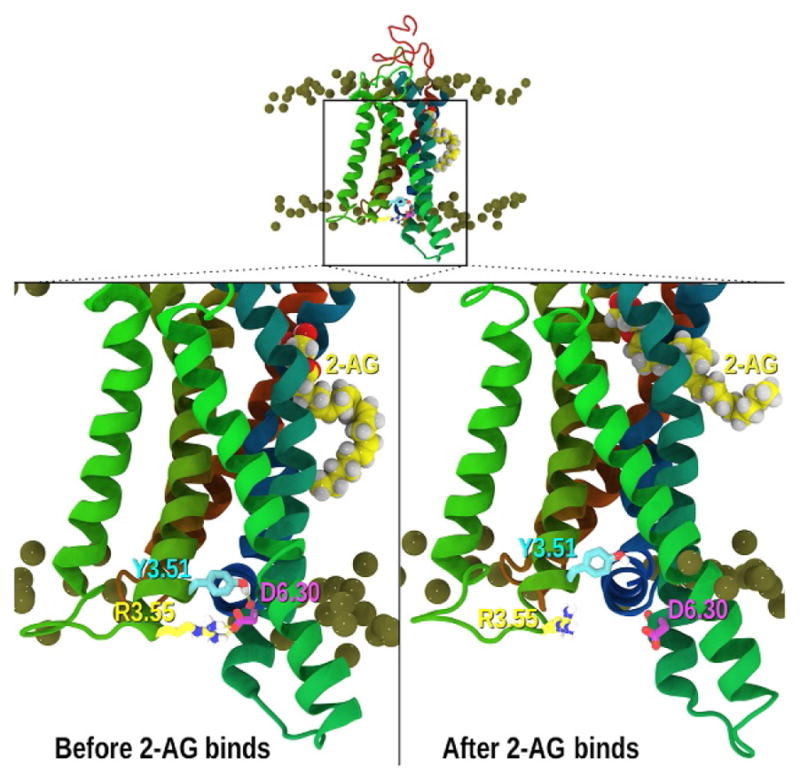
Ionic lock ruptures after 2-AG binds. The relationship between the intracellular ends of TMH3 and TMH6 at points along the simulation is illustrated here. The CB2 TMH bundle is shown in ribbon format with phosphorus atoms of the POPC bilayer colored gold. TMHs are colored by helix with TMH4 (green on left), TMH5 (green in foreground), TMH6 (teal), TMH7 and Hx8 (dark blue). Top and lower left: although we began with a salt bridge between R3.50(131) and D6.30(240) at the IC ends of TMH3/6, the receptor rearranged to form a salt bridge between R3.55(136) and D6.30(240), with Y3.51(132) hydrogen bonding to the exposed backbone carbonyl of L6.29(239). In addition, the IC-3 loop assumed two additional helical turns. Lower right: this figure shows the broken R3.55(136)/D6.30(240) salt bridge and the broken Y3.51 (132)/L6.29(239) carbonyl interactions at 184ns into the resampled trajectory.
In the first two applications discussed here, we have seen that MD provides detailed atomic level information about the location of an endogenous lipophilic cannabinoid ligand in a lipid bilayer as well as mechanistic details of ligand binding to/and activation of CB2. After this binding, several hallmarks of G-protein activation are observed. As summarized here, this includes the breaking of the iconic GPCR ionic lock and the separation of IC ends of the TMHs. The MD studies presented here offer an unprecedented look at the binding/activation events leading to G-protein activation and provide a critical complementary component to experimental studies of these systems.
4.3 ORG27569 in POPC Bilayer
The structure of ORG27569 is given in Fig. 1B. It is a hydrophobic molecule that has very low water solubility. In fact, it is typically necessary to utilize DMSO in order to overcome its solubility issues (Shore et al., 2014). The precise location of ORG27569 in a lipid bilayer is unclear, although indole rings are typically associated with the interfacial regions of phospholipid bilayers (Gaede, Yau, & Gawrisch, 2005). For example, in an NMR study of indole/phospholipid bilayers (Gaede et al., 2005), a bimodal distribution for the indole was observed. One maximum was near the choline group, while the second was deeper in the membrane at the approximate location of the C2/C3 carbons of the lipid (these carbons are indicated in Fig. 1C for POPC). Moreover, simulations of the potential of mean force for a tryptophan side-chain analogue, 3-methylindole, place this species at approximately 10 Å from the bilayer center of a DPPC membrane (de Jesus & Allen, 2013). This depth is just underneath the glycerol region of the lipids at the interface with the hydrophobic core (Kucerka et al., 2008).
Therefore, as a result of ORG27569’s low solubility in water and indole moiety, one would expect that ORG27569 would partition into the phospholipid bilayer and reside primarily near the boundary of the phospholipid headgroup and hydrophobic core regions. Given the nature of the binding mechanism just described for the endogenous/lipophilic 2-AG to CB2, the 2-AG-binding pathway proceeds via the lipid matrix with its headgroup at the interface region, we expect that the location of ORG27569 in a lipid bilayer may have important implications for its binding pathway to CB1. Therefore, we have performed a series of MD simulations to help reveal the location of ORG27569 in a typical model membrane.
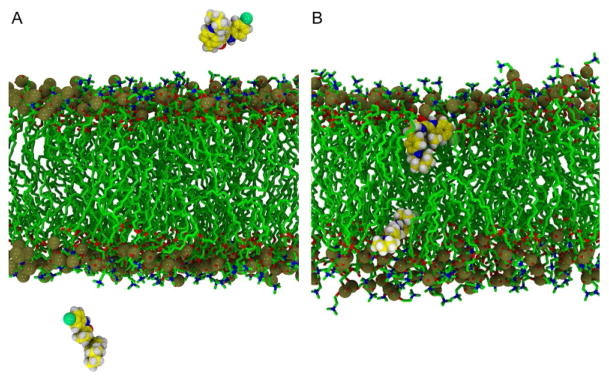
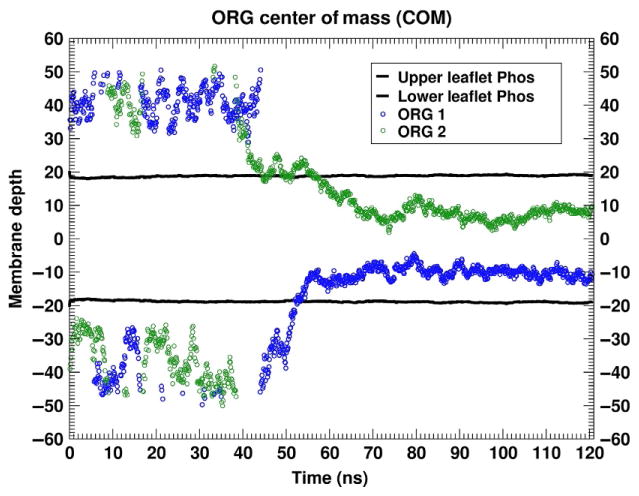
In the first set of simulations, we placed two molecules of ORG27569 in the aqueous phase of a pure, fully hydrated POPC bilayer. In Fig. 9, we present several snapshots illustrating the spontaneous partitioning of the ORG27569 into lipid. Although started in the water phase (Fig. 9A), with at least one layer of water between it and the POPC headgroups, both ORG27569 molecules rapidly partition into the POPC bilayer. The first partitioning occurs at approximately 43ns and the second at 56ns. Fig. 9B illustrates the system at 82.7ns where both are embedded in the lipid bilayer. In Fig. 10, we report the time series for the COM of the ORG27569 over this trajectory. Once the ORG27569 partitions into lipid it remains there, at least on the 100ns timescale reported here.
Fig. 9.
Representative snapshots of ORG27569 in a fully hydrated POPC bilayer. (A) Configuration at t= 0.2 ns where both molecules of ORG27569 are in the aqueous phase. ORG27569 is rendered: nitrogen (blue), carbon (yellow), hydrogen (white), and chlorine (light green) VDW spheres. The POPC is colored: phosphorus (gold), carbon (green), nitrogen (blue), and oxygen (red). (B) Typical location of the ORG27569 after partitioning into the lipid matrix. A close-up taken at 82.7ns where both ORG27569 molecules are located in the phospholipid bilayer. The coloring is described in (A).
Fig. 10.
Time series of the partitioning of ORG27569 from water into POPC. This figure illustrates the time series of the center of mass of the two ORG27569 molecules relative to the average location of the POPC phosphorus atoms. The black lines are the locations of the upper (positive membrane depth) and lower (negative membrane depth) leaflet P atoms, while the green and blue symbols are the COM of the individual ORG27569 molecules.
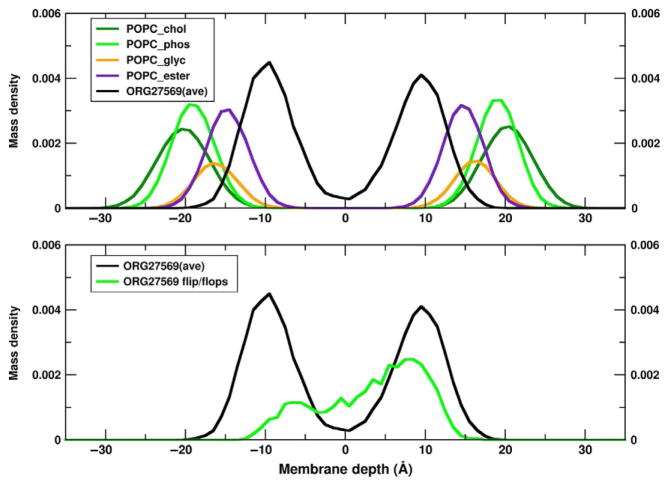
As a result of these simulations, we initiated a second series of simulations where the amount of ORG27569 is increased to 14 total molecules that are initially placed at the depth of the phospholipid headgroups of the inner and outer leaflets of the POPC bilayer. In 2 of the simulations, all 14 ORG27569 molecules remain in the phospholipid bilayer. In the third trajectory, one ORG27569 exits the membrane into the aqueous phase, but repartitions into the POPC after 169ns. The mass distributions are reported for one of the trajectories in Fig. 11 (upper panel). These distributions indicate that the indole ring of ORG27569 lies just underneath the POPC ester groups. Moreover, it is of interest to note that on the timescale of these simulations, individual molecules occasionally flip leaflets. This can be seen in Fig. 11 (lower panel), where the average ORG27569 mass distributions are reported (black curve) along with the density for an individual ORG27569 molecule (green curve) that has density in both leaflets indicating flip-flop. This is not specific to this simulation, as flip-flop is also observed for individual ORG27569s in each of the three independent simulations.
Fig. 11.
Mass density distribution for ORG27569 in a POPC bilayer. In the upper panel, the per molecule mass distribution is plotted for the POPC groups as defined in Fig. 1 and computed from one of the independent trajectories. In addition the average mass distribution of the chloroindole ring of ORG27569 is reported. On average the substituted indole ring lies just inside (toward the bilayer center) of the POPC ester moiety. In the lower panel, we report the averaged substituted indole ring distribution as well as the distribution of one of the ORG27569 molecules, where density is observed in both leaflets. This ORG27569 is observed to change leaflet in the course of this trajectory. Results for the other two independent trajectories are similar.
4.4 ORG27569 Binds and Activates the CB1 β-Arrestin-1 Signaling Path
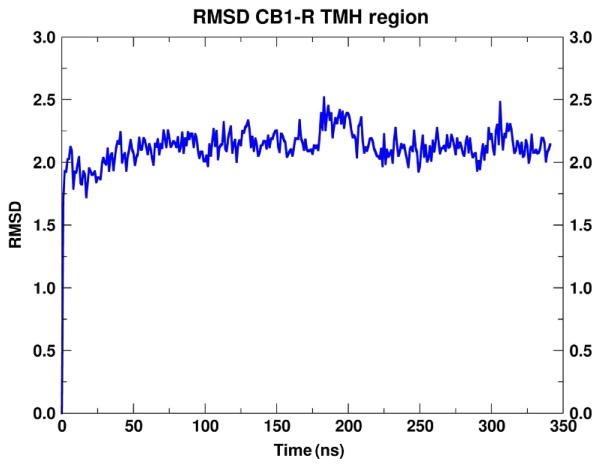
In Fig. 12, we report the RMSD of the TM helices of CB1 in the POPC model membrane. This run was used to relax the CB1 model in a realistic lipid bilayer. During the course of this trajectory, the ionic lock (R3.50–D6.30) was maintained and at 70ns a snapshot was taken. The CB1 conformation was extracted and the simulation cell was rebuilt with seven ORG27569 molecules included in each leaflet as described in Section 3.4. In this set of simulations, three independent simulations were performed, each run for over 1μs each.
Fig. 12.
RMSD of the transmembrane helices of CB1. RMSD of the transmembrane helices of CB1 in the CB1/POPC equilibration run. The CB1 residues used for the superimposition include: TMH1(P1.28–S1.60), TMH2(P2.38–F2.67), TMH3(R3.22–R3.56), TMH4 (R4.39–L4.62), TMH5(D5.36–H5.66), TMH6(D6.30–F6.60), and TMH7(T7.33–S7.57).
In the course of one of the CB1/ORG27569 MD trajectories, an ORG27569 from the EC leaflet interacts with residues along TMH6/TMH7 and the indole moiety inserts between the EC ends of TMH6/TMH7 (Fig. 13). This trajectory was run for 1.42μs. No binding event was observed in the other two trajectories of 1.24 and 1.175μs, respectively; therefore, we have used these two trajectories as controls.
Fig. 13.
Time series of ORG27569—CB1 contacts. This figure illustrates the time sequence of contacts, followed by insertion of the substituted indole ring of ORG27569 between TMH6/TMH7 of CB1. Left panel: ORG27569 makes contact with F7.35 at 33 ns, center panel: at 250 ns the indole ring is inserted between TMH6/TMH7 at the level of Y6.57/F7.35, and right panel: at 328 ns the EC3 has closed over ORG27569.
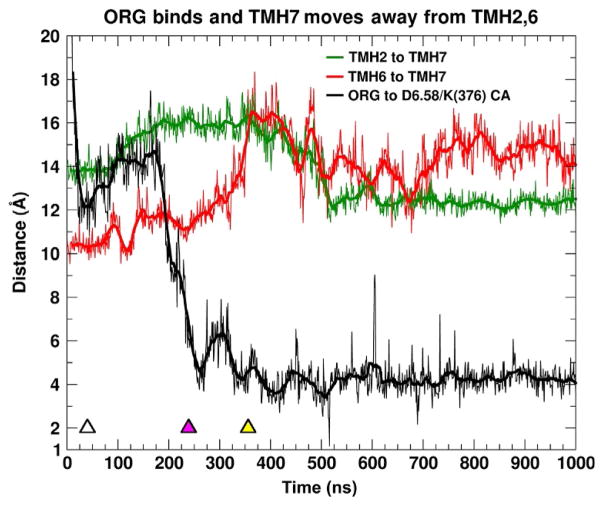
The initial contact at ~10ns of this ORG27569 with any CB1 residue occurs between the chlorine atom on the indole ring and I6.45, a residue that is fairly deep in the bilayer. This is followed by contact with P6.50 at (13ns) and I6.54 (18ns). It is interesting to note that there is intermittent contact with P6.50, although the ionic lock (R3.50–D6.30 salt bridge) is maintained throughout this trajectory. At 33ns, one ORG27569 (in an elongated conformation) reapproaches the receptor and interacts with residues along the lipid faces of TMH6/THM7. Y6.57 (which faces lipid) and F7.35 (which becomes lipid exposed) begin to interact with ORG27569, acting like guides. By 250ns, the ligand has assumed a bent conformation and the indole ring is inserting between TMH6/TMH7 at their most EC turn. This is shown in Fig. 14 as a decrease in the distance between the ORG27569 indole ring COM and the COM of a pair of residues in the TMH bundle interior (D6.58/K376). Y6.57 acts like a “side wall” from the TMH6 side and F7.35 rotates underneath the ORG27569, acting like a “floor.” By 328ns, the CB1 EC-3 loop bends backward and begins to interact with ORG27569. Here, the amide oxygen of ORG27569 forms a hydrogen bond with the backbone N—H of N372 in the EC-3 loop. This docking of ORG27569 is coincident with a dramatic rearrangement of the IC region of the receptor. In particular, the distance between TMH2 and TMH7 increases, beginning with the initial contact of ORG27569 with the receptor and levels off after 500ns. The distance between TMH6 and TMH7 on the IC side of the bundle shows an increase of nearly 4 Å as ORG27569 docks at the TMH6/TMH7 interface and the CB1 EC-3 loop begins interacting with the ligand. This distance increase occurs because the TMH7/Hx8 region moves away from TMH6. Such IC changes are consistent with results reported for other β-arrestin-biased ligands in the β2-adrenergic (carvedilol) and vasopressin V2R (SR121463) receptor fields (Liu et al., 2012; Rahmeh et al., 2012). The IC opening that is produced by ORG27569’s entry into the TMH6/TMH7 EC region is large enough to permit the insertion of the fingerloop of β-arrestin-1.
Fig. 14.
Time series of the CB1 interhelical distances as ORG27569 inserts. Time series of the interhelical distances of TMH2, TMH6, and TMH7. The distances are measured from the center of mass of the backbone atoms of TMH2 (P2.38–I2.43), TMH6 (D6.30–K6.35), and TMH7 (Y7.53–K7.58). These locations were determined to be approximately at the same level in the POPC phospholipid bilayer. The distance of the COM of the ORG27569-substituted indole ring to the center of the Cα atoms of D6.58/K376 is also reported. The initial contact with CB1 is indicated with a white triangle, the purple triangle indicates when ORG27569 has fully inserted between THM6/TMH7, and yellow triangle is the time point where the IC opening is largest.
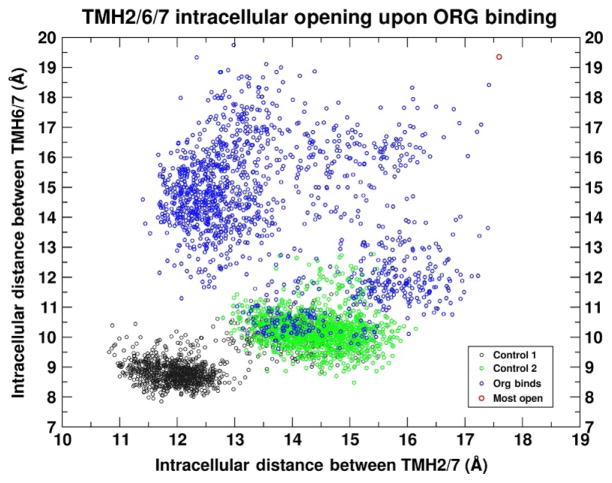
In both control runs, which are characterized by the absence of ORG27569 insertion between TMH6/TMH7, the opening between the IC ends of TMH2/TMH7 and TMH6/TMH7 is collectively much smaller than in the case where the ORG27569 bound. This is illustrated in Fig. 15, where the interhelical distances of the THM2/TMH7 pair are plotted against the distances of TMH6/TMH7. Each data point corresponds to a time point in the trajectory, taken at 1ns intervals, and thus this image displays the ensemble of intrahelical distances observed in the course of the individual trajectories. Clearly, the control ensembles do not sample the large interhelical distances seen in the trajectory where ORG27569 binds.
Fig. 15.
Scatter plot of the intrahelical distances of TMH2/TMH6/TMH7 as ORG27569 binds. The interhelical distances of TMH2(P2.38–I2.43)/TMH7(Y7.53–K7.58) plotted against the interhelical distance of TMH6(D6.30–K6.35)/TMH7(Y7.53–K7.58). The first control run is colored black and the second is green. The trajectory data for the case where ORG27569 inserted between TMH6/TMH7 are colored blue. The extreme point (red) is the case where an intracellular crevice is the most open.
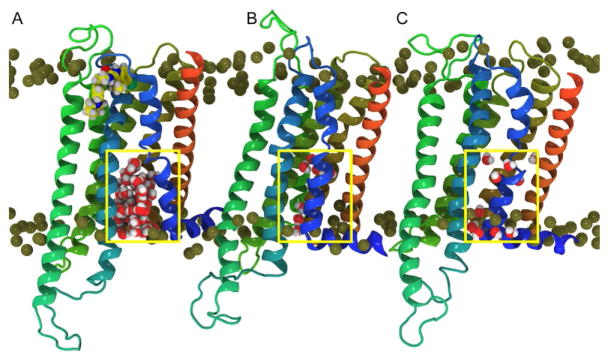
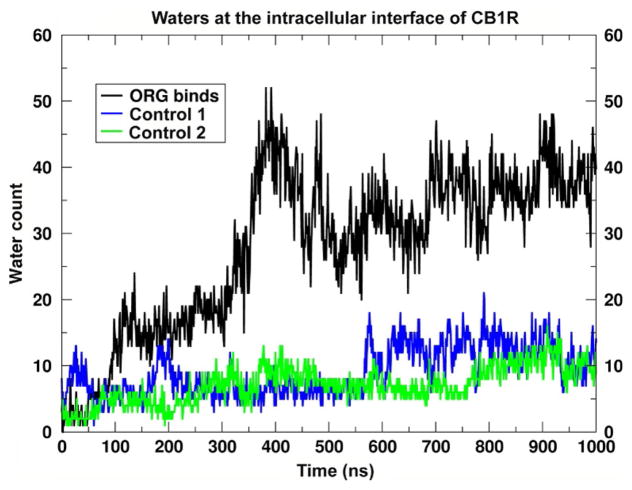
Moreover, the opening in the simulation after the ORG27569 has bound is coincident with a large influx of water into the lower half of the receptor. The increase in water inside the IC-binding cavity is approximated by counting the water molecules inside a rectilinear box, which encompasses the lower leaflet ends of the TM helices. This is illustrated in Fig. 16, where the CB1 receptor is displayed for the ORG27569 insertion trajectory (Fig. 16A) and compared to snapshots from the two control trajectories (Fig. 16B and C). The configuration in this image is taken at 390ns from each of the trajectories and the box used to define the IC cavity is outlined. This box is used to monitor the number of water molecules that enter the receptor bundle as a function of time. In Fig. 17, a time series of this water molecule count is reported. Clearly, there is a jump in the IC water count simultaneous with the time that ORG27569 has inserted between TMH6/TMH7, where the IC opening is near its maximum. This interaction pattern, insertion of ORG2759 with an opening and influx of water, is not observed in either of the two control trajectories where ORG27569 has not inserted (Figs. 16 and 17).
Fig. 16.
Intracellular water influx as ORG27569 binds. Illustration of the water influx in (A) the trajectory where ORG27569 binds vs (B) and (C) similar snapshots from the control trajectories. These configurations are extracted at 390ns into each trajectory. Coloring: TMH5 (green), TMH6 (teal), TMH7 and Hx8 (blue), and TMH1 (orange). The P atoms are shown as gold spheres and the water molecules are rendered in VDW. The box used to define the intracellular region is shown in yellow.
Fig. 17.
Time series of the number of water molecules at the intracellular interface of CB1. This figure illustrates the time series of the number of water molecules at the intra-cellular interface of CB1 in the trajectory where ORG27569 binds (black) and the two control trajectories where a binding event is not observed (blue/green). This is simply a count of the number of waters within the intracellular box defined in Fig. 16.
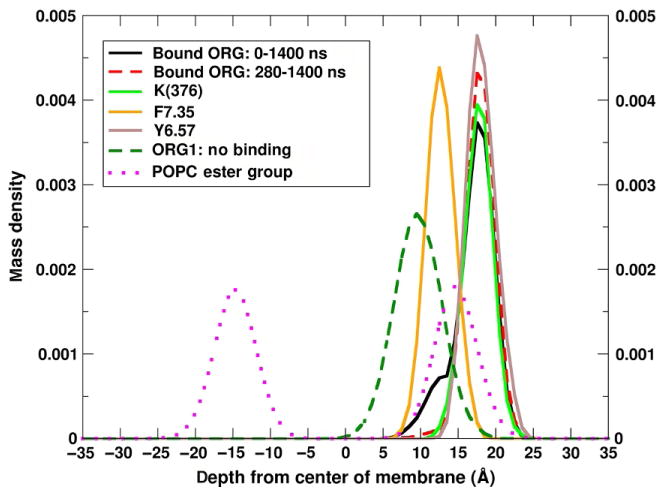
In Fig. 18, we report the mass density as a function of depth in the membrane for (a) the indole moiety of the bound ligand, (b) the ester moiety of the POPC molecules, and (c) several TMH7 residues. Fig. 18 also displays the analogous data for an ORG27569 that does not contact CB1. As seen here, the bound ORG27569 displays an overlapping bimodal distribution with a large maxima that occurs at the approximate depth of K376 (~17 Å) and a shoulder centered at ~13 Å, overlapping the F7.35 distribution. When the early data (before 280ns) are removed from the analysis, the peak that appears as a shoulder and overlaps F7.35 disappears (red curve). Therefore the population that overlaps F7.35 occurs early in the trajectory before the indole inserts deeply into the TMH6/TMH7 crevice. In contrast, the unbound ORG27569 has a single broad distribution centered at 10 Å and also overlaps the F7.35 distribution. Comparison of the location of the unbound ORG27569 in this simulation to that of ORG27569 in the POPC/ORG27569 simulation discussed in application 3 (Fig. 11A) illustrates that the depth of ORG27569 in the two cases is approximately the same; moreover, this depth is nearly coincident with the location of the initial TMH7 contact residues. Thus, for ORG27569 not interacting with CB1, the indole is on average at a depth just under the ester oxygens of POPC and overlapping the early contact residue F7.35.
Fig. 18.
Mass density of components as a function of depth in the bilayer. The simulation cell was centered such that the average phosphorus atom location was at z=0. Mass density was computed as a function the depth in the lipid bilayer. The indole ring of the bound ORG27569(black entire trajectory, red dashed the first 280ns removed), K376 (green), F7.35(orange), Y6.57(brown), the ester group of POPC (magenta dots), and the substituted indole group of an ORG27569 that does not contact CB1 during the simulation (green dash).
5. CONCLUSIONS
In this chapter, we have discussed in detail the methods for construction, equilibration, and production for the MD simulation of both the cannabinoid ligands, 2-AG and ORG27569, and receptors, CB1 and CB2 in a fully hydrated phospholipid membrane. In both cases, the cannabinoid ligands are highly lipophilic and readily partition into the phospholipid membrane. Moreover, their partitioning into the lipid produces a location and orientation that is productive for binding to and activation of their respective receptors.
While crystal structures can show the location of lipid facing portals, they cannot show dynamic behavior, including the consequences of entry through such portals. Employing all-atom MD simulations of the interaction of 2-AG with CB2, we have seen that the endocannabinoid, 2-AG, attains access to the CB2 receptor via the lipid bilayer by passing between TMH6/TMH7. The response of the CB2 receptor to this entry includes many of the features of activation classically attributed to the G-protein pathway. This includes a rupture of the ionic lock between the IC ends of TMH3/TMH6, as well as motion of TMH6 outward from the CB2 bundle core, such that a previously occluded docking site for Gi/o is exposed (Hurst et al., 2010).
Moreover, in an analogous set of simulations for ORG27569, a CB1 inverse agonist for G-protein signaling, we have observed partitioning of this ligand into the POPC bilayer. Similar to the 2-AG/CB2 system, when MD is performed with the CB1 receptor present, ORG27569 binds via the lipid bilayer. However, unlike the CB2 response to 2-AG binding, CB1 undergoes a dramatic rearrangement of the IC end of TMH7 from TMH2 and TMH6, leaving the ionic lock intact. Such a response is consistent with the observed G-protein inverse agonist/β-arrestin-1 agonist behavior of ORG27569 at the CB1 receptor (Ahn et al., 2012, 2013) as well as the β-arrestin-biased signaling observed in the β2-adrenergic and V2R receptors (Liu et al., 2012; Rahmeh et al., 2012). Upon binding ORG27569, CB1 does not produce the necessary docking site for the G-protein, while opening a position for the binding of β-arrestin-1 in the TMH7/TMH1/TMH2 IC region.
The results presented here suggest that the natural depth in the lipid bilayer governs the initial point of contact between these lipophilic ligands and the cannabinoid receptors, with final binding and insertion close to that point of contact. This is a powerful design paradigm where ligand entry may be partly governed by the location the ligand occupies in the phospholipid bilayer. By tuning the functionality of the ligand, one might be able to tune the initial point of contact with subsequent insertion/binding occurring near that contact. What we have seen is that higher binding seems to open up a β-arrestin-biased IC cleft, while lower binding (2-AG in CB2) opens up a G-protein IC cleft.
In both of these systems, the level of detail afforded by all-atom MD has provided an insight into the binding, activation, and dynamical behavior of these receptors that is lacking in many of the complementary experimental studies. As such, MD has been shown to be a valuable tool in our attempts to understand the underlying mechanisms of activation of these pharmacologically important proteins, in particular in unraveling the distinct conformational states of the receptor associated with distinct signaling pathways.
ABBREVIATIONS
- 2-AG
2-arachidonoylglycerol
- amu
atomic mass unit
- BRET
bioluminescence resonance energy transfer
- cAMP
cyclic adenosine monophosphate
- CB1/CB2
cannabinoid type 1 and 2 receptors
- COM
center of mass
- DHA
docosahexaenoic acid
- DMSO
dimethyl sulfoxide
- DPPC
dipalmitoylphosphatidylcholine
- EC
extracellular
- ERK1/2
extracellular signal-regulated kinase
- FRET
Förster resonance energy transfer
- GPCR
G-protein-coupled receptor
- GPU
graphics processing unit
- IC
intracellular
- MAPK
mitogen-activated protein kinase
- MD
molecular dynamics
- NPT
isothermal–isobaric
- ORG27569
5-chloro-3-ethyl-1H-indole-2-carboxylic acid [2-(4-piperidin-1-yl-phenyl) ethyl]amide
- PME
particle mesh Ewald
- POPC
1-palmitoyl-2-oleoyl-phosphatidylcholine
- RMSD
root mean square deviation
- TMH
transmembrane helix
- VDW
Van der Waals
References
- Ahn KH, Mahmoud MM, Kendall DA. Allosteric modulator ORG27569 induces CB1 cannabinoid receptor high affinity agonist binding state, receptor internalization, and Gi protein-independent ERK1/2 kinase activation. The Journal of Biological Chemistry. 2012;287(15):12070–12082. doi: 10.1074/jbc.M111.316463. http://dx.doi.org/10.1074/jbc.M111.316463. [DOI] [PMC free article] [PubMed] [Google Scholar]
- Ahn KH, Mahmoud MM, Shim JY, Kendall DA. Distinct roles of beta-arrestin 1 and beta-arrestin 2 in ORG27569-induced biased signaling and internalization of the cannabinoid receptor 1 (CB1) The Journal of Biological Chemistry. 2013;288(14):9790–9800. doi: 10.1074/jbc.M112.438804. http://dx.doi.org/10.1074/jbc.M112.438804. [DOI] [PMC free article] [PubMed] [Google Scholar]
- Altenbach C, Kusnetzow AK, Ernst OP, Hofmann KP, Hubbell WL. High-resolution distance mapping in rhodopsin reveals the pattern of helix movement due to activation. Proceedings of the National Academy of Sciences of the United States of America. 2008;105(21):7439–7444. doi: 10.1073/pnas.0802515105. http://dx.doi.org/10.1073/pnas.0802515105. [DOI] [PMC free article] [PubMed] [Google Scholar]
- Barnett-Norris J, Guarnieri F, Hurst DP, Reggio PH. Exploration of biologically relevant conformations of anandamide, 2-arachidonylglycerol, and their analogues using conformational memories. Journal of Medicinal Chemistry. 1998;41(24):4861–4872. doi: 10.1021/jm9803471. [DOI] [PubMed] [Google Scholar]
- Berendsen HJC, Postma JPM, van Gunstersen WF, Dinola A, Haak JR. Molecular dynamics with coupling to an external bath. The Journal of Chemical Physics. 1984;81:3684–3690. [Google Scholar]
- Brooks BR, Brooks CL, 3rd, Mackerell AD, Jr, Nilsson L, Petrella RJ, Roux B, et al. CHARMM: The biomolecular simulation program. Journal of Computational Chemistry. 2009;30(10):1545–1614. doi: 10.1002/jcc.21287. http://dx.doi.org/10.1002/jcc.21287. [DOI] [PMC free article] [PubMed] [Google Scholar]
- Case DA, Betz RM, Cerutti DS, Cheatham TE, III, Darden TA, Duke RE, et al. AMBER 2016. San Francisco: University of California; 2016. [Google Scholar]
- Case DA, Cheatham TE, 3rd, Darden T, Gohlke H, Luo R, Merz KM, Jr, et al. The Amber biomolecular simulation programs. Journal of Computational Chemistry. 2005;26(16):1668–1688. doi: 10.1002/jcc.20290. [DOI] [PMC free article] [PubMed] [Google Scholar]
- Cherezov V. Lipidic cubic phase technologies for membrane protein structural studies. Current Opinion in Structural Biology. 2011;21(4):559–566. doi: 10.1016/j.sbi.2011.06.007. http://dx.doi.org/10.1016/j.sbi.2011.06.007. [DOI] [PMC free article] [PubMed] [Google Scholar]
- Choe HW, Kim YJ, Park JH, Morizumi T, Pai EF, Krauss N, et al. Crystal structure of metarhodopsin II. Nature. 2011;471(7340):651–655. doi: 10.1038/nature09789. [DOI] [PubMed] [Google Scholar]
- Chrencik JE, Roth CB, Terakado M, Kurata H, Omi R, Kihara Y, et al. Crystal structure of antagonist bound human lysophosphatidic acid receptor 1. Cell. 2015;161(7):1633–1643. doi: 10.1016/j.cell.2015.06.002. http://dx.doi.org/10.1016/j.cell.2015.06.002. [DOI] [PMC free article] [PubMed] [Google Scholar]
- Dawaliby R, Trubbia C, Delporte C, Masureel M, Van Antwerpen P, Kobilka BK, et al. Allosteric regulation of G protein-coupled receptor activity by phospholipids. Nature Chemical Biology. 2016;12(1):35–39. doi: 10.1038/nchembio.1960. http://dx.doi.org/10.1038/nchembio.1960. [DOI] [PMC free article] [PubMed] [Google Scholar]
- de Jesus AJ, Allen TW. The role of tryptophan side chains in membrane protein anchoring and hydrophobic mismatch. Biochimica et Biophysica Acta. 2013;1828:864–876. doi: 10.1016/j.bbamem.2012.09.009. [DOI] [PubMed] [Google Scholar]
- Delgado-Peraza F, Ahn KH, Nogueras-Ortiz C, Mungrue IN, Mackie K, Kendall DA, et al. Mechanisms of biased beta-arrestin-mediated signaling downstream from the cannabinoid 1 receptor. Molecular Pharmacology. 2016;89(6):618–629. doi: 10.1124/mol.115.103176. http://dx.doi.org/10.1124/mol.115.103176. [DOI] [PMC free article] [PubMed] [Google Scholar]
- Di Marzo V. Targeting the endocannabinoid system: To enhance or reduce? Nature Reviews. Drug Discovery. 2008;7(5):438–455. doi: 10.1038/nrd2553. [DOI] [PubMed] [Google Scholar]
- Dror RO, Arlow DH, Maragakis P, Mildorf TJ, Pan AC, Xu H, et al. Activation mechanism of the beta2-adrenergic receptor. Proceedings of the National Academy of Sciences of the United States of America. 2011;108(46):18684–18689. doi: 10.1073/pnas.1110499108. http://dx.doi.org/10.1073/pnas.1110499108. [DOI] [PMC free article] [PubMed] [Google Scholar]
- Dror RO, Green HF, Valant C, Borhani DW, Valcourt JR, Pan AC, et al. Structural basis for modulation of a G-protein-coupled receptor by allosteric drugs. Nature. 2013;503(7475):295–299. doi: 10.1038/nature12595. http://dx.doi.org/10.1038/nature12595. [DOI] [PubMed] [Google Scholar]
- Dror RO, Pan AC, Arlow DH, Borhani DW, Maragakis P, Shan Y, et al. Pathway and mechanism of drug binding to G-protein-coupled receptors. Proceedings of the National Academy of Sciences of the United States of America. 2011;108(32):13118–13123. doi: 10.1073/pnas.1104614108. http://dx.doi.org/10.1073/pnas.1104614108. [DOI] [PMC free article] [PubMed] [Google Scholar]
- Eldho NV, Feller SE, Tristram-Nagle S, Polozov IV, Gawrisch K. Poly-unsaturated docosahexaenoic vs docosapentaenoic acid-differences in lipid matrix properties from the loss of one double bond. Journal of the American Chemical Society. 2003;125(21):6409–6421. doi: 10.1021/ja029029o. [DOI] [PubMed] [Google Scholar]
- Essmann U, Perera L, Berkowitz ML, Darden TA, Lee J, Pedersen LG. A smooth particle mesh Ewald method. The Journal of Chemical Physics. 1995;103:8577–8593. [Google Scholar]
- Farrens DL, Altenbach C, Yang K, Hubbell WL, Khorana HG. Requirement of rigid-body motion of transmembrane helices for light-activation of rhodopsin. Science. 1996;274:768–770. doi: 10.1126/science.274.5288.768. [DOI] [PubMed] [Google Scholar]
- Fay JF, Farrens DL. Structural dynamics and energetics underlying allosteric inactivation of the cannabinoid receptor CB1. Proceedings of the National Academy of Sciences of the United States of America. 2015;112(27):8469–8474. doi: 10.1073/pnas.1500895112. http://dx.doi.org/10.1073/pnas.1500895112. [DOI] [PMC free article] [PubMed] [Google Scholar]
- Feller SE, Gawrisch K, MacKerell AD., Jr Polyunsaturated fatty acids in lipid bilayers: Intrinsic and environmental contributions to their unique physical properties. Journal of the American Chemical Society. 2002;124(2):318–326. doi: 10.1021/ja0118340. [DOI] [PubMed] [Google Scholar]
- Feller SE, MacKerell AD., Jr An improved empirical potential energy function for molecular simulations of phospholipids. The Journal of Physical Chemistry. B. 2000;104:7510–7515. [Google Scholar]
- Fitch BG, Germain RS, Mendell M, Pitera J, Pitman MC, Rayshubskiy A, et al. Blue matter, an application framework for molecular simulation on blue gene. Journal of Parallel and Distributed Computing. 2003;63:759–773. [Google Scholar]
- Flores-Otero J, Ahn KH, Delgado-Peraza F, Mackie K, Kendall DA, Yudowski GA. Ligand-specific endocytic dwell times control functional selectivity of the cannabinoid receptor 1. Nature Communications. 2014;5:4589. doi: 10.1038/ncomms5589. http://dx.doi.org/10.1038/ncomms5589. [DOI] [PMC free article] [PubMed] [Google Scholar]
- Gaede HC, Yau WM, Gawrisch K. Electrostatic contributions to indole-lipid interactions. The Journal of Physical Chemistry. B. 2005;109(26):13014–13023. doi: 10.1021/jp0511000. http://dx.doi.org/10.1021/jp0511000. [DOI] [PubMed] [Google Scholar]
- Grossfield A. Recent progress in the study of G protein-coupled receptors with molecular dynamics computer simulations. Biochimica et Biophysica Acta. 2011;1808(7):1868–1878. doi: 10.1016/j.bbamem.2011.03.010. http://dx.doi.org/10.1016/j.bbamem.2011.03.010. [DOI] [PubMed] [Google Scholar]
- Grossfield A, Feller SE, Pitman MC. A role for direct interactions in the modulation of rhodopsin by omega-3 polyunsaturated lipids. Proceedings of the National Academy of Sciences of the United States of America. 2006;103(13):4888–4893. doi: 10.1073/pnas.0508352103. [DOI] [PMC free article] [PubMed] [Google Scholar]
- Grossfield A, Pitman MC, Feller SE, Soubias O, Gawrisch K. Internal hydration increases during activation of the G-protein-coupled receptor rhodopsin. Journal of Molecular Biology. 2008;381(2):478–486. doi: 10.1016/j.jmb.2008.05.036. [DOI] [PMC free article] [PubMed] [Google Scholar]
- Hanson MA, Roth CB, Jo E, Griffith MT, Scott FL, Reinhart G, et al. Crystal structure of a lipid G protein-coupled receptor. Science. 2012;335(6070):851–855. doi: 10.1126/science.1215904. http://dx.doi.org/10.1126/science.1215904. [DOI] [PMC free article] [PubMed] [Google Scholar]
- Hildebrand PW, Scheerer P, Park JH, Choe HW, Piechnick R, Ernst OP, et al. A ligand channel through the G protein coupled receptor opsin. PLoS One. 2009;4(2):e4382. doi: 10.1371/journal.pone.0004382. [DOI] [PMC free article] [PubMed] [Google Scholar]
- Howlett AC, Blume LC, Dalton GD. CB(1) cannabinoid receptors and their associated proteins. Current Medicinal Chemistry. 2010;17(14):1382–1393. doi: 10.2174/092986710790980023. [DOI] [PMC free article] [PubMed] [Google Scholar]
- Humphrey W, Dalke A, Schulten K. VMD: Visual molecular dynamics. Journal of Molecular Graphics. 1996;14(1):33–38. doi: 10.1016/0263-7855(96)00018-5. [DOI] [PubMed] [Google Scholar]
- Hurst DP, Grossfield A, Lynch DL, Feller S, Romo TD, Gawrisch K, et al. A lipid pathway for ligand binding is necessary for a cannabinoid G protein-coupled receptor. The Journal of Biological Chemistry. 2010;285(23):17954–17964. doi: 10.1074/jbc.M109.041590. [DOI] [PMC free article] [PubMed] [Google Scholar]
- Hurst DP, Schmeisser M, Reggio PH. Endogenous lipid activated G protein-coupled receptors: Emerging structural features from crystallography and molecular dynamics simulations. Chemistry and Physics of Lipids. 2013;169:46–56. doi: 10.1016/j.chemphyslip.2013.01.009. http://dx.doi.org/10.1016/j.chemphyslip.2013.01.009. [DOI] [PMC free article] [PubMed] [Google Scholar]
- Jensen AD, Guarnieri F, Rasmussen SG, Asmar F, Ballesteros JA, Gether U. Agonist-induced conformational changes at the cytoplasmic side of transmembrane segment 6 in the beta 2 adrenergic receptor mapped by site-selective fluorescent labeling. The Journal of Biological Chemistry. 2001;276(12):9279–9290. doi: 10.1074/jbc.M004871200. [DOI] [PubMed] [Google Scholar]
- Kendall DA, Yudowski GA. Cannabinoid receptors in the central nervous system: Their signaling and roles in disease. Frontiers in Cellular Neuroscience. 2016;10:294. doi: 10.3389/fncel.2016.00294. http://dx.doi.org/10.3389/fncel.2016.00294. [DOI] [PMC free article] [PubMed] [Google Scholar]
- Kimura T, Cheng K, Rice KC, Gawrisch K. Location, structure, and dynamics of the synthetic cannabinoid ligand CP-55,940 in lipid bilayers. Biophysical Journal. 2009;96(12):4916–4924. doi: 10.1016/j.bpj.2009.03.033. [DOI] [PMC free article] [PubMed] [Google Scholar]
- Kimura T, Vukoti K, Lynch DL, Hurst DP, Grossfield A, Pitman MC, et al. Global fold of human cannabinoid type 2 receptor probed by solid-state C-N-MAS NMR and molecular dynamics simulations. Proteins. 2013;82(3):452–465. doi: 10.1002/prot.24411. http://dx.doi.org/10.1002/prot.24411. [DOI] [PMC free article] [PubMed] [Google Scholar]
- Klauda JB, Venable RM, Freites JA, O’Connor JW, Tobias DJ, Mondragon-Ramirez C, et al. Update of the CHARMM all-atom additive force field for lipids: Validation on six lipid types. The Journal of Physical Chemistry. B. 2010;114(23):7830–7843. doi: 10.1021/jp101759q. http://dx.doi.org/10.1021/jp101759q. [DOI] [PMC free article] [PubMed] [Google Scholar]
- Kobilka B. The structural basis of G-protein-coupled receptor signaling (Nobel lecture) Angewandte Chemie (International Ed. in English) 2013;52(25):6380–6388. doi: 10.1002/anie.201302116. [DOI] [PMC free article] [PubMed] [Google Scholar]
- Kohlhoff KJ, Shukla D, Lawrenz M, Bowman GR, Konerding DE, Belov D, et al. Cloud-based simulations on Google Exacycle reveal ligand modulation of GPCR activation pathways. Nature Chemistry. 2014;6(1):15–21. doi: 10.1038/nchem.1821. http://dx.doi.org/10.1038/nchem.1821. [DOI] [PMC free article] [PubMed] [Google Scholar]
- Kotsikorou E, Lynch DL, Abood ME, Reggio PH. Lipid bilayer molecular dynamics study of lipid-derived agonists of the putative cannabinoid receptor, GPR55. Chemistry and Physics of Lipids. 2011;164:131–143. doi: 10.1016/j.chemphyslip.2010.12.003. [DOI] [PMC free article] [PubMed] [Google Scholar]
- Kruse AC, Hu J, Pan AC, Arlow DH, Rosenbaum DM, Rosemond E, et al. Structure and dynamics of the M3 muscarinic acetylcholine receptor. Nature. 2012;482(7386):552–556. doi: 10.1038/nature10867. http://dx.doi.org/10.1038/nature10867. [DOI] [PMC free article] [PubMed] [Google Scholar]
- Kucerka N, Nagle JF, Sachs JN, Feller SE, Pencer J, Jackson A, et al. Lipid bilayer structure determined by the simultaneous analysis of neutron and X-ray scattering data. Biophysical Journal. 2008;95(5):2356–2367. doi: 10.1529/biophysj.108.132662. http://dx.doi.org/10.1529/biophysj.108.132662. [DOI] [PMC free article] [PubMed] [Google Scholar]
- Laprairie RB, Kulkarni AR, Kulkarni PM, Hurst DP, Lynch D, Reggio PH, et al. Mapping cannabinoid 1 receptor allosteric site(s): Critical molecular determinant and signaling profile of GAT100, a novel, potent, and irreversibly binding probe. ACS Chemical Neuroscience. 2016;7(6):776–798. doi: 10.1021/acschemneuro.6b00041. http://dx.doi.org/10.1021/acschemneuro.6b00041. [DOI] [PMC free article] [PubMed] [Google Scholar]
- Latorraca NR, Venkatakrishnan AJ, Dror RO. GPCR dynamics: Structures in motion. Chemical Reviews. 2017;117(1):139–155. doi: 10.1021/acs.chemrev.6b00177. http://dx.doi.org/10.1021/acs.chemrev.6b00177. [DOI] [PubMed] [Google Scholar]
- Lefkowitz RJ. A brief history of G-protein coupled receptors (Nobel Lecture) Angewandte Chemie (International Ed in English) 2013;52(25):6366–6378. doi: 10.1002/anie.201301924. [DOI] [PubMed] [Google Scholar]
- Leioatts N, Mertz B, Martinez-Mayorga K, Romo TD, Pitman MC, Feller SE, et al. Retinal ligand mobility explains internal hydration and reconciles active rhodopsin structures. Biochemistry. 2014;53(2):376–385. doi: 10.1021/bi4013947. http://dx.doi.org/10.1021/bi4013947. [DOI] [PMC free article] [PubMed] [Google Scholar]
- Leioatts N, Romo TD, Danial SA, Grossfield A. Retinal conformation changes rhodopsin’s dynamic ensemble. Biophysical Journal. 2015;109(3):608–617. doi: 10.1016/j.bpj.2015.06.046. http://dx.doi.org/10.1016/j.bpj.2015.06.046. [DOI] [PMC free article] [PubMed] [Google Scholar]
- Liu JJ, Horst R, Katritch V, Stevens RC, Wuthrich K. Biased signaling pathways in beta2-adrenergic receptor characterized by 19F-NMR. Science. 2012;335(6072):1106–1110. doi: 10.1126/science.1215802. http://dx.doi.org/10.1126/science.1215802. [DOI] [PMC free article] [PubMed] [Google Scholar]
- Lohse MJ, Nuber S, Hoffmann C. Fluorescence/bioluminescence resonance energy transfer techniques to study G-protein-coupled receptor activation and signaling. Pharmacological Reviews. 2012;64(2):299–336. doi: 10.1124/pr.110.004309. http://dx.doi.org/10.1124/pr.110.004309. [DOI] [PubMed] [Google Scholar]
- Lomize MA, Lomize AL, Pogozheva ID, Mosberg HI. OPM: Orientations of proteins in membranes database. Bioinformatics. 2006;22(5):623–625. doi: 10.1093/bioinformatics/btk023. http://dx.doi.org/10.1093/bioinformatics/btk023. [DOI] [PubMed] [Google Scholar]
- Lu HC, Mackie K. An introduction to the endogenous cannabinoid system. Biol Psych. 2016;79:516–525. doi: 10.1016/j.biopsych.2015.07.028. [DOI] [PMC free article] [PubMed] [Google Scholar]
- Luttrell LM, Maudsley S, Bohn LM. Fulfilling the promise of “biased” G protein-coupled receptor agonism. Molecular Pharmacology. 2015;88(3):579–588. doi: 10.1124/mol.115.099630. http://dx.doi.org/10.1124/mol.115.099630. [DOI] [PMC free article] [PubMed] [Google Scholar]
- MacKerell AD, Jr, Bashford D, Bellot M, Dunbrack RL, Jr, Evanseck JD, Field MJ, et al. All-hydrogen empirical potential for molecular modeling and dynamics studies of proteins using the CHARMM22 force field. The Journal of Physical Chemistry. B. 1998;102:3586–3616. doi: 10.1021/jp973084f. [DOI] [PubMed] [Google Scholar]
- Manglik A, Kobilka B. The role of protein dynamics in GPCR function: Insights from the beta2AR and rhodopsin. Current Opinion in Cell Biology. 2014;27:136–143. doi: 10.1016/j.ceb.2014.01.008. http://dx.doi.org/10.1016/j.ceb.2014.01.008. [DOI] [PMC free article] [PubMed] [Google Scholar]
- Marino KA, Shang Y, Filizola M. Insights into the function of opioid receptors from molecular dynamics simulations of available crystal structures. British Journal of Pharmacology. 2017 doi: 10.1111/bph.13774. http://dx.doi.org/10.1111/bph.13774. [DOI] [PMC free article] [PubMed]
- Mavromoustakos T, Yang DP, Broderick W, Fournier D, Makriyannis A. Small angle X-ray diffraction studies on the topography of cannabinoids in synaptic plasma membranes. Pharmacology, Biochemistry, and Behavior. 1991;40(3):547–552. doi: 10.1016/0091-3057(91)90361-5. [DOI] [PubMed] [Google Scholar]
- Miao Y, Caliman AD, McCammon JA. Allosteric effects of sodium ion binding on activation of the m3 muscarinic g-protein-coupled receptor. Biophysical Journal. 2015;108(7):1796–1806. doi: 10.1016/j.bpj.2015.03.003. http://dx.doi.org/10.1016/j.bpj.2015.03.003. [DOI] [PMC free article] [PubMed] [Google Scholar]
- Mondal S, Khelashvili G, Johner N, Weinstein H. How the dynamic properties and functional mechanisms of GPCRs are modulated by their coupling to the membrane environment. Advances in Experimental Medicine and Biology. 2014a;796:55–74. doi: 10.1007/978-94-007-7423-0_4. http://dx.doi.org/10.1007/978-94-007-7423-0_4. [DOI] [PubMed] [Google Scholar]
- Mondal S, Khelashvili G, Weinstein H. Not just an oil slick: How the energetics of protein-membrane interactions impacts the function and organization of transmembrane proteins. Biophysical Journal. 2014b;106(11):2305–2316. doi: 10.1016/j.bpj.2014.04.032. http://dx.doi.org/10.1016/j.bpj.2014.04.032. [DOI] [PMC free article] [PubMed] [Google Scholar]
- Oates J, Watts A. Uncovering the intimate relationship between lipids, cholesterol and GPCR activation. Current Opinion in Structural Biology. 2011;21(6):802–807. doi: 10.1016/j.sbi.2011.09.007. http://dx.doi.org/10.1016/j.sbi.2011.09.007. [DOI] [PubMed] [Google Scholar]
- Park JH, Scheerer P, Hofmann KP, Choe HW, Ernst OP. Crystal structure of the ligand-free G-protein-coupled receptor opsin. Nature. 2008;454(7201):183–187. doi: 10.1038/nature07063. [DOI] [PubMed] [Google Scholar]
- Phillips JC, Braun R, Wang W, Gumbart J, Tajkhorshid E, Villa E, et al. Scalable molecular dynamics with NAMD. Journal of Computational Chemistry. 2005;26:1781–1802. doi: 10.1002/jcc.20289. [DOI] [PMC free article] [PubMed] [Google Scholar]
- Piomelli D. The molecular logic of endocannabinoid signalling. Nature Reviews. Neuroscience. 2003;4(11):873–884. doi: 10.1038/nrn1247. [DOI] [PubMed] [Google Scholar]
- Pitman MC, Grossfield A, Suits F, Feller SE. Role of cholesterol and polyunsaturated chains in lipid-protein interactions: Molecular dynamics simulation of rhodopsin in a realistic membrane environment. Journal of the American Chemical Society. 2005;127(13):4576–4577. doi: 10.1021/ja042715y. [DOI] [PubMed] [Google Scholar]
- Pitman MC, Suits F, Mackerell AD, Jr, Feller SE. Molecular-level organization of saturated and polyunsaturated fatty acids in a phosphatidylcholine bilayer containing cholesterol. Biochemistry. 2004;43(49):15318–15328. doi: 10.1021/bi048231w. [DOI] [PubMed] [Google Scholar]
- Rahmeh R, Damian M, Cottet M, Orcel H, Mendre C, Durroux T, et al. Structural insights into biased G protein-coupled receptor signaling revealed by fluorescence spectroscopy. Proceedings of the National Academy of Sciences of the United States of America. 2012;109(17):6733–6738. doi: 10.1073/pnas.1201093109. http://dx.doi.org/10.1073/pnas.1201093109. [DOI] [PMC free article] [PubMed] [Google Scholar]
- Rasmussen SG, Choi HJ, Rosenbaum DM, Kobilka TS, Thian FS, Edwards PC, et al. Crystal structure of the human beta2 adrenergic G-protein-coupled receptor. Nature. 2007;450(7168):383–387. doi: 10.1038/nature06325. [DOI] [PubMed] [Google Scholar]
- Rasmussen SG, DeVree BT, Zou Y, Kruse AC, Chung KY, Kobilka TS, et al. Crystal structure of the beta2 adrenergic receptor-Gs protein complex. Nature. 2011;477(7366):549–555. doi: 10.1038/nature10361. http://dx.doi.org/10.1038/nature10361. [DOI] [PMC free article] [PubMed] [Google Scholar]
- Romo TD, Grossfield A. LOOS: An extensible platform for structural analysis of simulations. Paper presented at the 31st annual international conference of the IEEE EMBS; Minneapolis, MN. 2009. [DOI] [PubMed] [Google Scholar]
- Romo TD, Grossfield A, Pitman MC. Concerted interconversion between ionic lock substates of the beta(2) adrenergic receptor revealed by microsecond timescale molecular dynamics. Biophysical Journal. 2010;98(1):76–84. doi: 10.1016/j.bpj.2009.09.046. [DOI] [PMC free article] [PubMed] [Google Scholar]
- Salomon-Ferrer R, Case DA, Walker RC. An overview of the Amber biomolecular simulation package. WIREs Computational Molecular Science. 2013a;3:198–210. [Google Scholar]
- Salomon-Ferrer R, Gotz AW, Poole D, Le Grand S, Walker RC. Routine microsecond molecular dynamics simulations with AMBER on GPUs. 2. Explicit solvent particle mesh Ewald. Journal of Chemical Theory and Computation. 2013b;9(9):3878–3888. doi: 10.1021/ct400314y. http://dx.doi.org/10.1021/ct400314y. [DOI] [PubMed] [Google Scholar]
- Scheerer P, Park JH, Hildebrand PW, Kim YJ, Krauss N, Choe HW, et al. Crystal structure of opsin in its G-protein-interacting conformation. Nature. 2008;455(7212):497–502. doi: 10.1038/nature07330. [DOI] [PubMed] [Google Scholar]
- Schneider M, Kasanetz F, Lynch DL, Friemel CM, Lassalle O, Hurst DP, et al. Enhanced functional activity of the cannabinoid type-1 receptor mediates adolescent behavior. The Journal of Neuroscience. 2015;35(41):13975–13988. doi: 10.1523/JNEUROSCI.1937-15.2015. http://dx.doi.org/10.1523/JNEUROSCI.1937-15.2015. [DOI] [PMC free article] [PubMed] [Google Scholar]
- Shore DM, Baillie GL, Hurst DH, Navas F, 3rd, Seltzman HH, Marcu JP, et al. Allosteric modulation of a cannabinoid G protein-coupled receptor: Binding site elucidation and relationship to G protein signaling. The Journal of Biological Chemistry. 2014;289(9):5828–5845. doi: 10.1074/jbc.M113.478495. http://dx.doi.org/10.1074/jbc.M113.478495. [DOI] [PMC free article] [PubMed] [Google Scholar]
- Soubias O, Gawrisch K. The role of the lipid matrix for structure and function of the GPCR rhodopsin. Biochimica et Biophysica Acta. 2012;1818(2):234–240. doi: 10.1016/j.bbamem.2011.08.034. http://dx.doi.org/10.1016/j.bbamem.2011.08.034. [DOI] [PMC free article] [PubMed] [Google Scholar]
- Soubias O, Niu SL, Mitchell DC, Gawrisch K. Lipid-rhodopsin hydrophobic mismatch alters rhodopsin helical content. Journal of the American Chemical Society. 2008;130(37):12465–12471. doi: 10.1021/ja803599x. [DOI] [PMC free article] [PubMed] [Google Scholar]
- Stanley N, Pardo L, Fabritiis GD. The pathway of ligand entry from the membrane bilayer to a lipid G protein-coupled receptor. Scientific Reports. 2016;6:22639. doi: 10.1038/srep22639. http://dx.doi.org/10.1038/srep22639. [DOI] [PMC free article] [PubMed] [Google Scholar]
- Struts AV, Chawla U, Perera SM, Brown MF. Investigation of rhodopsin dynamics in its signaling state by solid-state deuterium NMR spectroscopy. Methods in Molecular Biology. 2015;1271:133–158. doi: 10.1007/978-1-4939-2330-4_10. http://dx.doi.org/10.1007/978-1-4939-2330-4_10. [DOI] [PMC free article] [PubMed] [Google Scholar]
- Tate CG, Schertler GF. Engineering G protein-coupled receptors to facilitate their structure determination. Current Opinion in Structural Biology. 2009;19(4):386–395. doi: 10.1016/j.sbi.2009.07.004. http://dx.doi.org/10.1016/j.sbi.2009.07.004. [DOI] [PubMed] [Google Scholar]
- Tian X, Guo J, Yao F, Yang DP, Makriyannis A. The conformation, location, and dynamic properties of the endocannabinoid ligand anandamide in a membrane bilayer. The Journal of Biological Chemistry. 2005;280(33):29788–29795. doi: 10.1074/jbc.M502925200. [DOI] [PubMed] [Google Scholar]
- Urban JD, Clarke WP, von Zastrow M, Nichols DE, Kobilka B, Weinstein H, et al. Functional selectivity and classical concepts of quantitative pharmacology. The Journal of Pharmacology and Experimental Therapeutics. 2007;320(1):1–13. doi: 10.1124/jpet.106.104463. [DOI] [PubMed] [Google Scholar]
- Vallee M, Vitiello S, Bellocchio L, Hebert-Chatelain E, Monlezun S, Martin-Garcia E, et al. Pregnenolone can protect the brain from cannabis intoxication. Science. 2014;343(6166):94–98. doi: 10.1126/science.1243985. http://dx.doi.org/10.1126/science.1243985. [DOI] [PMC free article] [PubMed] [Google Scholar]
- Vanommeslaeghe K, Hatcher E, Acharya C, Kundu S, Zhong S, Shim J, et al. CHARMMgeneral force field: A force field for drug-like molecules compatible with the CHARMM all-atom additive biological force fields. Journal of Computational Chemistry. 2010;31(4):671–690. doi: 10.1002/jcc.21367. [DOI] [PMC free article] [PubMed] [Google Scholar]
- Vanommeslaeghe K, MacKerell AD., Jr Automation of the CHARMM general force field (CGenFF) I: Bond perception and atom typing. Journal of Chemical Information and Modeling. 2012;52(12):3144–3154. doi: 10.1021/ci300363c. http://dx.doi.org/10.1021/ci300363c. [DOI] [PMC free article] [PubMed] [Google Scholar]
- Vanommeslaeghe K, Raman EP, MacKerell AD., Jr Automation of the CHARMM general force field (CGenFF) II: Assignment of bonded parameters and partial atomic charges. Journal of Chemical Information and Modeling. 2012;52(12):3155–3168. doi: 10.1021/ci3003649. http://dx.doi.org/10.1021/ci3003649. [DOI] [PMC free article] [PubMed] [Google Scholar]
- Vemuri VK, Makriyannis A. Medicinal chemistry of cannabinoids. Clinical Pharmacology & Therapeutics. 2015;97(6):7. doi: 10.1002/cpt.115. http://dx.doi.org/10.1002/cpt.115. [DOI] [PMC free article] [PubMed] [Google Scholar]
- Venkatakrishnan AJ, Deupi X, Lebon G, Tate CG, Schertler GF, Babu MM. Molecular signatures of G-protein-coupled receptors. Nature. 2013;494(7436):185–194. doi: 10.1038/nature11896. http://dx.doi.org/10.1038/nature11896. [DOI] [PubMed] [Google Scholar]
- Violin JD, Crombie AL, Soergel DG, Lark MW. Biased ligands at G-protein-coupled receptors: Promise and progress. Trends in Pharmacological Sciences. 2014;35(7):308–316. doi: 10.1016/j.tips.2014.04.007. http://dx.doi.org/10.1016/j.tips.2014.04.007. [DOI] [PubMed] [Google Scholar]
- Violin JD, Lefkowitz RJ. Beta-arrestin-biased ligands at seven-transmembrane receptors. Trends in Pharmacological Sciences. 2007;28(8):416–422. doi: 10.1016/j.tips.2007.06.006. http://dx.doi.org/10.1016/j.tips.2007.06.006. [DOI] [PubMed] [Google Scholar]
- Woolf TB, Roux B. Structure, energetics, and dynamics of lipid-protein interactions: A molecular dynamics study of the gramicidin a channel in a DMPC bilayer. Proteins. 1996;24(1):92–114. doi: 10.1002/(SICI)1097-0134(199601)24:1<92::AID-PROT7>3.0.CO;2-Q. http://dx.doi.org/10.1002/(SICI)1097-0134(199601)24:1<92::AID-PROT7>3.0.CO;2-Q. [DOI] [PubMed] [Google Scholar]
- Wiener MC, White SH. Structure of a fluid dioleoylphosphatidylcholine bilayer determined by joint refinement of x-ray and neutron diffraction data. III. Complete structure. Biophysical Journal. 1992;61(2):434–447. doi: 10.1016/S0006-3495(92)81849-0. [DOI] [PMC free article] [PubMed] [Google Scholar]


