

SUMMARY
Several Class-A G protein-coupled receptor (GPCR) proteins act as constitutive phospholipid scramblases catalyzing the transbilayer translocation of >10,000 phospholipids per second when reconstituted into synthetic vesicles. To address the molecular mechanism by which these proteins facilitate rapid lipid scrambling, we carried out large-scale ensemble atomistic molecular dynamics simulations of the opsin GPCR. We report that in the process of scrambling, lipid headgroups traverse a dynamically revealed hydrophilic pathway in the region between transmembrane helices 6 and 7 of the protein while their hydrophobic tails remain in the bilayer environment. We present quantitative kinetic models of the translocation process based on Markov State Model analysis. As key residues on the lipid translocation pathway are conserved within the Class-A GPCR family, our results illuminate unique aspects of GPCR structure and dynamics while providing a rigorous basis for the design of variants of these proteins with defined scramblase activity.
eTOC BLURB
Morra et al. analyze molecular dynamics simulations of the G protein-coupled receptor (GPCR) opsin to provide insight into the molecular mechanism of lipid scrambling by a GPCR. The study uncovers unique aspects of the structure and dynamics of this important superfamily of receptors.
INTRODUCTION
The visual pigment rhodopsin is both a G protein-coupled receptor (GPCR) and a constitutively active phospholipid scramblase capable of translocating lipids rapidly and bidirectionally across a membrane bilayer (Ernst and Menon, 2015; Goren et al., 2014; Menon et al., 2011). Opsin (the retinal-free form of the protein) also has scramblase activity. The presence of opsin in a phosphatidylcholine bilayer accelerates the rate of lipid scrambling by more than 9 orders of magnitude, from ~10−5 s−1 (spontaneous rate) to greater than 104 s−1 (see, for example, Ref. (Pomorski and Menon, 2016)). Other members of the GPCR family of heptahelical membrane proteins, including the β1- and β2-adrenergic receptor and the adenosine A2A receptor have also been shown to scramble phospholipids when reconstituted into synthetic vesicles (Goren et al., 2014; Menon et al., 2011). The scramblase activity of rhodopsin has been suggested to be important for the homeostasis of photoreceptor disc membranes because it would correct the transbilayer phospholipid imbalance caused by the unidirectional lipid pumping activity of disc-localized ATP-driven transporters, including the ‘Stargardt’s disease transporter’ ABCA4 (Ernst and Menon, 2015; Quazi et al., 2012; Quazi and Molday, 2014). The process of lipid scrambling is vitally important not only in disc membranes but also in various physiological contexts ranging from blood clotting, clearance of apoptotic cells and diurnal phagocytosis of photoreceptor outer segments, to the growth of cell membranes, construction of the bacterial cell wall (peptidoglycan) and protein glycosylation in the endoplasmic reticulum (Bevers and Williamson, 2016; Pomorski and Menon, 2006; Pomorski and Menon, 2016; Sanyal and Menon, 2009). In most cases, the responsible scramblases have not been identified.
The mechanism by which opsin facilitates lipid scrambling is not known but two conceptually distinct models have been proposed (Ernst and Menon, 2015; Goren et al., 2014). One model suggests that the protein-lipid interface provides a hydrophilic pathway to connect the two sides of the membrane. Lipids are envisioned to traverse the bilayer by populating the pathway with their head-groups while keeping their hydrophobic tails in the bilayer environment. This is reminiscent of a credit card (the magnetic strip of the card corresponds to the lipid headgroup, while the body of the card represents lipid acyl chains) swiping through a credit card reader (protein)(Pomorski and Menon, 2006). In contrast, the second model posits that the structural features needed for scrambling lie at the protein-protein interface of rhodopsin dimers (Goren et al., 2014).
We recently demonstrated that protein dimerization is not required for lipid scrambling (Ploier et al., 2016): three rhodopsin mutants, associated with the blinding disease autosomal dominant retinitis pigmentosa, were found to have wild type-like scramblase activity while reconstituting as monomers into vesicles in which their scramblase activity is measured. This result eliminates the requirement for a protein-protein interface to support scramblase activity and strongly suggests that rhodopsin-mediated lipid scrambling occurs via a pathway generated at the protein-lipid interface.
To identify this proposed pathway, we carried out large-scale ensemble atomistic molecular dynamics (MD) simulations (totaling >50 μs simulation time) of opsin embedded in an explicit phospholipid membrane. Analysis of the MD trajectories revealed a pathway for lipid translocation along the interface between transmembrane helices (TMs) 6 and 7 of the protein. Using a Markov State Model constructed from the MD trajectories we show that this pathway is enabled by a dynamically growing opening between the intracellular (IC) ends of TMs 6 and 7 that is enhanced by disruption of the interaction between residues E2496.32 and K3117.58, and conformational switching of residue Y3067.53 (throughout the text superscripts refer to the Ballesteros-Weinstein generic numbering of residues in GPCR proteins(Ballesteros and Weinstein, 1995)). The simulations show that these dynamic changes cause an increase in the solvation of the IC region lined by TMs 6 and 7, thus creating a local hydrophilic environment into which a lipid headgroup partitions and proceeds to translocate towards the bilayer center, where it is coordinated by several residues from TM6, including C2646.47 and Y2686.51. The time-dependent analysis of replica simulations in the ensemble shows that the constriction between the middle parts of TMs 6 and 7 widens further under these circumstances, thereby generating a suitable translocation pathway in which the lipid transitions towards the extracellular (EC) leaflet.
The computational analyses presented here identify a specific lipid translocation pathway through the opsin GPCR generated by structural and dynamic features of the protein. The dynamic characteristics brought to light by the Markov State Model constructed from the MD trajectories constitute key determinants of the mechanism of lipid translocation. The results support the ‘card-reader’ model (Pomorski and Menon, 2006; Pomorski and Menon, 2016) as a paradigm for the mechanism of lipid scrambling.
RESULTS
The rate of opsin-mediated lipid scrambling, measured after reconstitution of the protein into phospholipid vesicles, is estimated to be >104 lipid transfers per second per protein (Goren et al., 2014). Although significantly faster than the kinetics of unassisted lipid flipping (~10−5 s−1) (Kornberg and McConnell, 1971), opsin-mediated lipid translocation events are still relatively rare, occurring once every ~100 μs on average. To sample such rare events in MD simulations we adopted an iterative protocol in which unbiased MD simulations were run in four stages, each informed by the output from the previous stage and carried out in multiple replicates (Table 1, Figure S1) resulting in a sampling of mechanistic steps. Taken together, these data describe the evolution of a continuous hydrophilic opsin-mediated lipid pathway across the membrane. By monitoring the time-evolution of lipid head-group positions at various stages of the simulations we identified four locations, termed “Sites”, along the pathway which were found to have the highest population of lipid head-groups (see time-traces in Figure 1A and the 4 peaks in the histograms in Figure 1B). Below we detail structural and dynamic changes in opsin that mechanistically enable lipid transfer between these sites.
Table 1. Summary of performed atomistic MD simulations.
Using an iterative approach (see Methods), the simulations were carried out in four stages (see Figure S1). At the beginning of each stage, velocities of all the atoms in the system were reset using random number seed to ensure statistical independence among replicates. The total simulation times provided exclude equilibration phase.
| Stage | Number of replicates | Total simulation time (μs) |
|---|---|---|
|
| ||
| 1 | 4 | 6.1 |
| 2 | 20 | 14.5 |
| 3 | 20 | 26.0 |
| 4 | 20 | 4.8 |
Figure 1. Multiple lipids populate a translocation pathway in opsin.

(A) Time-evolution of the z-coordinate of the phosphate atom of three lipid molecules (Lipid 1, Lipid 2 and Lipid 3 represented by red, green, and blue traces, respectively) shown for all the MD simulations performed. The four stages of the simulations (see Figure SI) are denoted by shaded rectangles, and the simulations within each stage are demarcated by the vertical dashed lines. For each lipid, trajectory frames in which the lipid was outside the translocation pathway were omitted from the analysis. The average positions of the phosphate atoms of the lipids in the two leaflets of the membrane are depicted by horizontal dashed lines. Lipid translocation from the IC leaflet towards the EC leaflet can be traced by the increase in the z coordinate from ~−20Å to >15Å. (B) Data in panel A plotted as a histogram highlighting the z position of the phosphate atom of Lipid 1 at Sites 1–4.
Initiation of lipid translocation at the intracellular ends of TMs 6 and 7
The Stage 1 simulations consisted of four independent microsecond-scale MD runs (Table 1, Figure S1). While the overall structure of the protein in these trajectories remained relatively unchanged (as assessed by low, ~2Å, root-mean square deviation (RMSD) of the backbone atoms of all the TM helices), a transient opening between the IC ends of TMs 6 and 7 was observed in one of the trajectories. To explore the conformational space, we pursued a biased MD simulation protocol: in the second replicate from the Stage 1 simulations (denoted by the black rectangle in Figure 2A) the IC segment of TM7 was repositioned so that the side chain of residue Y3067.53 turned away from TM6 and towards TM2 (for detailed quantification see Figure 2C), corresponding to the conformational state observed. This conformational switch, together with destabilization of the E2496.32 – K3117.58 interaction (Figure 2B) created an opening between the IC ends of TM6 and TM7 into which a lipid molecule (Lipid 1) partitioned around the 0.6 μs time point in the trajectory (Figure 2E–F). Concomitantly, the level of hydration of the IC region between TMs 6 and 7 increased (Figure 2D). We designated this location of Lipid 1 as “Site 1” and found that in this site the penetrating lipid was coordinated mainly by charged residues from TM6 (E2496.32, E2526.35) and TM7/Helix 8 (K3117.58, R3167.61), but also by residue R1353.50 from TM3 (Figure 3A and 3E, Site 1).
Figure 2. Opening of the lipid pathway is triggered by conformational rearrangements on the intracellular side of the protein.

(A) Distance as a function of time between residues Y306 and L76 (Y306–TM2, blue) and Y306 and A260 (Y306-TM6, red) shown for all the MD simulations performed. (B) Distance as a function of time between E2496.32-K3117.58 pair of residues throughout all the MD simulations. In panels A and B, the four stages of the simulations are denoted by shaded rectangles, and the simulations within each stage are demarcated by the vertical dashed lines. (C) Zoomed view of the distance plots from panel A (marked by a black rectangle) reflecting the dynamics in the second replicate from Stage 1. (D) Changes in the hydration of the IC vestibule between TMs 6 and 7 in the second replicate from Stage 1 (see Methods for details). (E–F) Snapshots of the system at 0 μs and 0.6 μs time-points in the second replicate from Stage 1 illustrating structural changes enabling initial lipid penetration. The E2496.32-K3117.58 residue pair is shown in space-fill representation, Y3067.53 is yellow, the penetrating lipid is drawn in licorice, and water molecules in the IC vestibule between TMs 6 and 7 are depicted as transparent pink spheres. The L76 and A260 residues are shown in transparent blue space-fill. Relevant protein segments are labeled.
Figure 3. Characterization of the protein sites along the lipid translocation pathway.

(A–D) Frequency of contacts between Lipid 1 and the opsin residues when the lipid resides in Site 1, Site 2, Site 3, and Site 4, respectively. A residue was considered in contact with the lipid if minimum distance between any atom on the residue and the lipid head group phosphate was ≤ 6Å. (E–H) Opsin structure showing the residues (in space fill) in the different sites that coordinate the lipid the most strongly (with frequency > 0.05 from panels A–D). The 7 TM helices are numbered. The residues in space fill in panels E–H are as follows: (E) R1353.50, R2526.35, E2496.32, K3117.58, and R3147.61; (F) G1213.36, A1243.39, L1253.40, C2646.47, Y2686.51, A2957.42, K2967.43, S2987.45, and A2997.46; (G) G1213.36, E1223.37, Y2686.51, A2927.39, A2957.42, and K2967.43; (H) Y2686.51, P2917.38, A2927.39, and K2967.43.
The observed lipid penetration was short lived in the simulation trajectory, as the Y3067.53 side chain rotated back to its initial orientation towards TM6 at the ~0.8 μs time point in the trajectory (Figure 2C). This expelled the Lipid 1 back into the surrounding bilayer and resulted in decreased hydration in the region (Figure 2D). From these observations we reasoned that the sustained presence of a lipid in Site 1 could lead to further opening of a hydrophilic pathway between TMs 6 and 7 for lipid translocation, and proceeded to test this hypothesis by initiating a new set of 20 independent MD simulations (Stage 2) from the conformation of the system in which Lipid 1 occupied Site 1 (Figure 2F, see also Figure S1).
Increased hydration of the IC region lined by TMs 6 and 7 creates a polar groove that enables opsin-assisted lipid translocation towards the middle of the bilayer
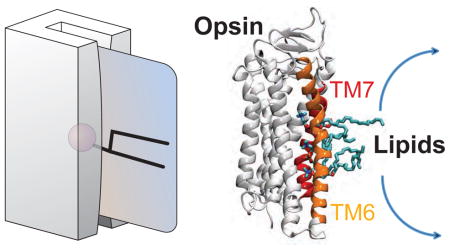
In three out of 20 MD trajectories in Stage 2 (labeled a–c in Fig. 1A) we observed movement of Lipid 1 from Site 1 towards the EC side. Movement occurred along a path populated by water molecules (Figure 4D) and in each case, the lipid reached the middle of the bilayer (z ~0 Å) where its headgroup was coordinated by several polar residues, notably C2646.47 and Y2686.51 from TM6, and S2987.45 from TM7 (Fig. 3B and 3F, Site 2, see also Fig. 4E). We named this location “Site 2”. The overall orientation of the lipid during translocation from Site 1 to Site 2 was such that its headgroup remained associated with the water pathway (Figure 4D) whereas its acyl chains remained in the hydrophobic core of the membrane. This movement is reminiscent of a credit card swiping through a credit card reader as depicted in Figure 4A.
Figure 4. Lipids traverse the hydrophilic pathway according to the “credit-card” mechanism.

(A) Opsin-mediated transbilayer lipid movement envisaged as a credit card (lipid) swiping through a card reader (opsin). The cartoon was created by Adam Steinberg and taken from Ref. (Pomorski and Menon, 2006). (B) View of the final state after trajectory “c” from the Stage 2 simulations (see Figure 3A) with three lipids (Lipids 1, 2, and 3 from Figure 3) simultaneously inserted between TM6 and TM7 (orange and red helices, respectively). In this state Lipid 1 (the lipid furthest in the translocation pathway towards the EC side) is in Site 2. (C) A representative trajectory frame from the Stage 3 simulations showing Lipids 1, 2, and 3 on the translocation pathway with Lipid 1 occupying Site 3. (D) Polar groove formed between transmembrane helices (TMs) 6 and 7 of opsin. The figure shows a snapshot from the Stage 2 simulations (see Table 1, Figure SI) with water molecules (blue spheres denote water oxygen molecules) populating the region between TMs 6 and 7 (orange and red cartoons, respectively) delineating a path that connects the intracellular (IC) and extracellular (EC) compartments. (E) Location of the phosphate atom on the Lipid 1 head group in all the trajectories from the Stage 3 simulations highlighting a continuous lipid translocation pathway lined by TMs 6 and 7. (F–G) Detailed view of Lipid 1 in Site 2 (E) and Site 3 (F) showing some key residues in the protein that coordinate the lipid head group. Color code in panels C–F is the same as in panel B.
Interestingly, we found that when Lipid 1 occupied Site 2, two other lipid molecules (Lipid 2 and Lipid 3) partitioned into the IC groove between TMs 6 and 7 (blue and green traces in Figure 1A, during trajectory “c”, see also Figure 4B). Thus, the headgroups of three lipid molecules simultaneously populated the hydrophilic pathway lined by the IC ends of TM6 and TM7 (Figure 4D). However, in this set of trajectories we did not observe further progress of any of these lipids towards the EC leaflet. We reasoned that this could be because the region between the middle parts of TMs 6 and 7 that defines the Site 2 is relatively narrow (see below) and that more sampling would be required to observe a relatively rare event of further translocation of the lipids. We therefore initiated a new set of 20 independent MD simulations (Stage 3) using as a starting configuration a frame from trajectory “c” (Stage 2 in Figure 1A, see also Figure S1) in which the hydrophilic pathway connecting Sites 1 and 2 was simultaneously occupied by the three lipid headgroups (Figure 4B).
Widening of the constriction between TMs 6 and 7 lined by residues C2646.47 and S2987.45 provides a continuous pathway for lipid translocation
As shown in Figure 1A, Lipid 1 progressed from Site 2 towards the EC side (z position > 0 Å) in multiple trajectories of the Stage 3 simulations. This was accompanied by the opening of a continuous pathway connecting the IC and EC leaflets of the bilayer (Figure 4E). In the process, the lipid was seen to transition through two additional sites (see lipid count distribution peaks in Figure 1B): Site 3 in which the lipid head-group was mostly coordinated by residues Y2686.51, K2967.43, and E1213.37 (see Figures 3B, 3G, and 4F), and Site 4 (located ~3Å from Site 3 towards the EC side - see Figure 1A–B) where it engaged with Y2686.51, A2927.39, and K2967.43.
We initiated Stage 4 simulations from the trajectory frame in Stage 3 in which Lipid 1 was positioned at Site 4 (simulation marked “d” in Fig. 1A). However, on the timescale of the simulation (~5 μs) we did not observe any further movement of Lipid 1 that would have resulted in its merging with the EC leaflet, and instead found that residue Y3067.53 switched back to its original position facing TM6 (Fig. 2A, Stage 4). Notably, the position nearest to the EC side that had been reached by Lipid 1 during Stage 4 simulations was already such that its headgroup was close to the average location of the phosphate atoms of the EC leaflet (Fig. 1A). This suggests that during Stage 4 the lipid had arrived to a position from which it could enter the EC leaflet, completing the transition from one side of the bilayer to the other.
Overall, the simulations revealed an opsin-mediated lipid translocation pathway that is confined to the region between TMs 6 and 7, and identified several intermediate sites along the pathway at which the lipid headgroups are stabilized by different sets of polar residues (Figure 3B). Interestingly, we found that occupancy of some of these sites by one lipid was coupled to the presence of another lipid at a different site along the translocation pathway. Indeed, as shown in the distribution plots in Figure 5, the presence of Lipid 1 at Site 2 increases the occupancy of the IC-portion of the pathway (connecting Sites 1 and 2) by another lipid (see the distributions for the Lipids 2 and 3 in Figure 5B). Furthermore, as Lipid 1 moves to Site 3 and eventually to Site 4, Lipid 2 progressively transitions to Site 2 (see the peak closest to z = 0Å position of the green curve in Figures 5C–D). The data also suggest that the pathway can be simultaneously occupied by three lipids when the most advanced lipid (Lipid 1) is either in Site 2 or in Site 3. Indeed, when Lipid 1 moves to Site 4, Lipid 3 no longer penetrates (see changes in the peak height located near z = −10 Å for Lipid 3 in Figure 5B–D) and the pathway contains at most two lipids (Lipid 1 and 2). This reflects the finding that Sites 2, 3 and 4 share lipid-coordinating residues (Y2686.51 and K2967.43, see Figure 3).
Figure 5. Multiple lipid head-groups simultaneously occupy the pathway.

(A–D) Histograms of the z position of Lipid 2 (green) and Lipid 3 (blue) phosphate atoms in the trajectory frames in which Lipid 1 occupied Site 1 (A), Site 2 (B), Site 3 (C), or Site 4 (D). Average z position of Lipid 1 phosphate atom at the four sites are shown as vertical dashed lines. (E–F) Corresponding images of the protein with point clouds representing locations of Lipid 2 and Lipid 3 headgroup phosphate atom (green and blue points, respectively) in the trajectory frames in which the phosphate atom of Lipid 1 (red points) is localized to Site 1 (E), Site 2 (F), Site 3 (G), or Site 4 (H).
A kinetic model for opsin-mediated lipid translocation from Markov State Model analysis of MD trajectories
We performed Markov State Model (MSM) analysis as described in Methods to obtain a kinetic model of the structural and dynamic changes in opsin that enable lipid transfer between sites during the translocation process. The first step in constructing the MSM, i.e. reduction of the dimensionality of the configurational space of the system described by all the frames of the combined trajectory (Stages 1 through 4), was carried out with the tICA (“time-structure based independent component analysis”) approach (Molgedey and Schuster, 1994; Naritomi and Fuchigami, 2011; Perez-Hernandez et al., 2013; Schwantes and Pande, 2013). The resulting tICA landscapes for the combined trajectory and for the subset of trajectories corresponding to the four separate MD simulation stages, are shown in Figure 6 as 2D projections along the first and second tICA vectors tIC1 and tIC2. Because we found that sustained lipid presence in the region between TMs 6 and 7 is observed only from Stage 2 onwards, we conclude from a comparison of the panels in Figure 6 that the tICA space built on the combined MD trajectory can be roughly divided into two parts: the left section (smaller tIC 1 values) that contains states of the protein that precede lipid penetration, and the right section of the landscape (larger tIC 1 values) that contains opsin conformations with one or more lipids populating the translocation pathway. Indeed, projections of the z-coordinate of the phosphate atom of the three penetrating lipids and of the E2496.32 – K3117.58 distance along the tIC 1 vector (Figure S2) confirm that larger tIC 1 values correspond to protein conformations with an open IC vestibule and with lipid headgroups inserted between TMs 6 and 7 (see also Figure 1A and Figure 2B).
Figure 6. tlCA analysis identifies protein conformations with/without inserted lipids.

(A) Population weighted 2D tlCA landscape of opsin obtained by projecting all MD snapshots on first two tlCA eigenvectors. The landscape can be broadly divided into two regions (marked by shaded rounded rectangles). The region of small tlC1 represents protein structures preceding the lipid penetration, whereas the region of large tlC1 contain conformations of opsin with one or more lipids on the translocation pathway. (B) The tlCA landscape is divided into four stages (Stage 1, Stage 2, Stage 3, and Stage 4) to represent evolution of the system during the simulations.
Our detailed analysis of the tICA eigenvector contributions to the total fluctuations of the system (see Methods) identified only the first three tICA eigenvectors as important reaction coordinates capturing the dynamics of the lipid translocation process. Therefore, to build the MSM we clustered the 3D tICA space in Figure 6A into 100 microstates (see Methods) as shown in the top panels of Figure 7, and then constructed several transition probability matrices (TPMs – see Methods) for different lag times. The resulting implied time-scales analysis for the first 10 relaxation modes per each TPM (Figure S3) revealed that a lag-time of 40 ns yielded Markovian behavior (see also Methods). Therefore, we used the TPM corresponding to 40 ns lag-time for the MSM analysis.
Figure 7. MSM analysis of lipid translocation process.

Representation of the first two MSM relaxation modes on the eigenvectors tlC1 and tlC2. Red and blue circles in the lower panels show the location of microstates. The population exchanges between blue (positive eigenvectors) microstates and red (negative eigenvectors) microstates. Microstates with larger circles contribute more to the relaxation mode (i.e. correspond to higher absolute value of the MSM eigenvector component).
Figure 7 shows the first two (slowest) relaxation modes of MSM which the implied time-scales analysis identified to have characteristic time-scales of 24.5 μs and 8.8 μs, respectively (Figure S4). The population exchanges between states with positive eigenvectors (blue circles) and states with negative eigenvectors (red circles) evident in Figure 7 indicate that (i)-the first MSM relaxation mode describes the dynamics of the protein that enables initial lipid insertion to start translocation (proceeding from left to right), and (ii)-the second MSM relaxation mode captures conformational dynamics of the protein accompanying lipid translocation through the various sites along the pathway. This is indicated by the transitions from blue to red states being confined to the right side of the tICA landscape (large tIC1 values) where all opsin states have lipid(s) in the translocation pathway.
To examine in detail the time-ordered sequence of structural rearrangements of opsin that are associated with lipid translocation, we performed transition path theory (TPT) analysis (Razavi et al., 2017). For this, the 100 microstates of the 3D tICA space were grouped into 12 macrostates (Figure S4) based on their kinetic similarity as determined by the PCCA+ algorithm (Deuflhard and Weber, 2005). TPT analysis then identified the most probable pathways and quantified the flux associated with each pathway. Based on lipid population histograms in each of the macrostates presented in Figure S5, we identified five macrostates of the protein that precede lipid penetration (the macrostates are numbered according to the PCCA+ algorithm): macrostate 8 (which contains the starting conformation of the system), and macrostates 5, 3, 2, and 7. In all of the remaining seven of the 12 macrostates lipid penetration had occurred and the protein conformations were associated with one or more lipids populating the translocation pathway. This distinction between two classes of microstates confirms the division of the tICA space into the two (left and right) regions (see above).
Importantly, the TPT analysis showed that the combined flux in 4 pathways accounts for ~98% of the total flux of phospholipids, with the top pathway contributing 86% (Figure 8). While such a dominant contribution from a single pathway is expected due to the iteratively guided nature of the MD protocol implemented here, the TPT analysis provides important mechanistic insights into the lipid translocation process itself. Thus, the following set of conformational changes are found to occur along the top pathway indicated by the thick arrows connecting macrostates 8-to-2-to-10-to-12-to-11: the initially closed intracellular vestibule region lined by TMs 6 and 7 (macrostate 8) opens due to: (i)-destabilization of the E2496.32/K3117.58 interaction (Figure S6A) and (ii)- structural rearrangement of the IC segment of TM7 which moves the side chain of residue Y3067.53 from TM6 to TM2 (see Figure S6C–D, macrostate 2). These conformational changes, which according to the time-scales derived from the MSM analysis (Figures S2 and 7) constitute the rate-limiting step of lipid transfer, enable Lipid 1 to penetrate Site 1 and travel to Site 2 (macrostate 10 in Figure 8, see also Figure S5). In the process, the distance between TMs 6 and 7 widens both at the IC end (at the level of Site 1, see Figure 8 and Figure S6A) and in the middle of the bilayer (at the level of Site 2, Figure S6B). As the translocation pathway becomes populated by multiple lipids (macrostate 12, see Figures 8 and S5), the separation between TMs 6 and 7 grows (Figure S6A–B). However, as Lipid 1 reaches Site 4 (in macrostate 11, see Figure 8), the other lipids (Lipid 2 and 3) can be expelled from the translocation pathway (Figure S5) as Y3067.53 turns back towards TM6 (Figure S6C–D) thus interfering with diffusion of these lipids to the EC leaflet.
Figure 8. Pathways for lipid translocation.

Top four pathways for lipid translocation identified from the TPT analysis are shown on the tlCA1 vs tlCA2 landscape divided into 12 macrostates (color coded) using the PCCA+ (see Methods, and Figure S4). The macrostates are numbered according to the PCCA+ algorithm. The thickness of the arrows indicates the relative magnitude of the flux of the pathway. The total flux values for the top pathways are given in the table. The snapshots of the system show representative structures from the macrostates involved in the top pathway. On these snapshots the relevant region of the protein is shown using the same representation as in Figure 4B–G, E2496.32, K3117.58, and Y3067.53 residues are drawn in space fill representation, and the phosphate groups of the three lipids (Lipid 1, 2, and 3) are shown on the translocation pathway using the same color code as in Figures 1 and 5 (Lipid1 – red, Lipid2 – green, Lipid3 – blue).
Interestingly, some macrostates such as 1 and 6, contain conformations of the system with a relatively open translocation pathway (see Figure S6) and with lipids populating various sites along the pathway (Figure S5). Yet, according to the TPT analysis these macrostates do not feature in the top flux pathways. Detailed evaluation of structures in these macrostates showed that the lipids occupy the translocation pathway with their tails, rather than their charged headgroup (Figure S7). Such modes of protein-lipid interaction decrease (rather than increase) the overall hydration in the region, thus impeding the sliding movement of the lipid headgroups. Thus, these macrostates represent kinetically trapped states.
DISCUSSION
There are currently only two families of transmembrane proteins whose members have been identified and validated as phospholipid scramblases (Pomorski and Menon, 2016): Class-A (rhodopsin-like) GPCRs (Menon et al., 2011) and the TMEM16 family of Ca2+-dependent ion channels and/or scramblases (Malvezzi et al., 2013). The latter proteins are homodimers, with each monomer possessing a membrane-facing hydrophilic groove (Brunner et al., 2014). A recent molecular dynamics study of a TMEM16 scramblase suggested that the hydrophilic groove could provide a path for lipid headgroup translocation (Bethel and Grabe, 2016). Because GPCRs do not possess an obvious hydrophilic groove, we hypothesized that a pathway for lipid translocation in these proteins must be generated by means of collective dynamics in the protein.
Our MD simulation results reveal a lipid pathway in opsin that is localized to the region between TMs 6 and 7 and enabled by movements of these helices relative to each other as well as by the repositioning of specific amino acid side chains to create the appropriate environment for the penetrating lipids. The pathway is prepared on the IC side by (i)-a stochastic change in conformation in Y3067.53 that repositions the Tyr sidechain away from TM6 and into the TM bundle towards TM2, and (ii)-the disengagement of the E2496.32/K3117.58 pair of residues. These conformational changes result in ~10Å separation between the IC ends of TM6 and TM7, increasing hydration and enabling lipid headgroup penetration. The complete pathway is then opened when the narrowest region between TM6 and TM7 in the middle of the hydrocarbon core of the lipid bilayer (on the level of C2646.47) widens by ~5Å. When both the IC and middle sections of TM6 and TM7 have separated from each other, the entire region between these two helices is transformed into a continuous, water-containing hydrophilic pathway along which lipids move in a manner consistent with the credit card reader mechanism suggested previously (Pomorski and Menon, 2006).
The key lipid translocation event sampled in our simulation consists of the headgroup of the penetrating lipid moving from the IC side to reach the average position of lipid headgroups in the EC leaflet on a timescale of ~33 μs. While the MSM timescales predicted here from biased MD simulations are likely underestimated, this value is consistent with the experimentally estimated rate of lipid scrambling being >104 s−1, i.e. a single lipid transfer occurs per 100 μs time interval or smaller (Goren et al., 2014; Ploier et al., 2016). Importantly, our MSM analysis suggests that the rate limiting step for the lipid translocation process is related to conformational changes in opsin that enable opening of the hydrophilic pathway between TMs 6 and 7. This molecular level description of opsin/GPCR-mediated lipid translocation accounts for opsin’s unexpected lipid scramblase activity.
In light of our finding that internal hydration of opsin plays a key role in the scrambling mechanism, it is important to note that retinal-bound opsin (rhodopsin), as well as a rhodopsin mutant that favors the metarhodopsin II-like activated protein state (Rho*) also have scramblase activity when reconstituted in phospholipid vesicles (Goren et al., 2014; Menon et al., 2011). Interestingly, compared with opsin and Rho*, much more rhodopsin was needed for reconstitution in order to populate all vesicles with scramblase activity (Goren et al., 2014). This observation can be rationalized by the mechanistic predictions from our computational studies related to the role of the water pathway in the scrambling process: thus, while opsin and metarhodopsin II forms of the protein are generally characterized by a high degree of hydration (Grossfield et al., 2008; Leioatts et al., 2015), the dark state of rhodopsin is less solvated due to bound retinal.
The specifics of our proposed mechanism of lipid translocation enabled by opsin are consistently supported by experimentally determined characteristics of GPCR structure and function as follows:
As detailed above, the kinetics of lipid translocation obtained in the detailed model that emerged from the MSM analysis of our ensemble MD simulations is consistent with that measured in experiments.
Experiments showing that both dimeric and monomeric forms of opsin can scramble phospholipids at the same rate (Ploier et al., 2016), imply that transmembrane helices participating in opsin oligomerization are not directly involved in the scrambling process. While several dimerization interfaces for GPCR proteins (and for rhodopsin specifically) have been suggested from both experimental and computational studies (see, for example, Refs. [(Khelashvili et al., 2010), (Johnston et al., 2012)] and citations therein), the major protein-protein interaction interfaces were shown to involve TM1/H8 segments as well as TMs 4 and 5. As the TM6-TM7 region is likely to remain exposed to lipid even if the proteins were to oligomerize, the pathway we identified is likely to remain exposed to lipid regardless of the oligomerization state of the protein.
The conformational dynamics of opsin that enabled opening of the lipid pathway in our simulations are confined to the region between TMs 6 and 7, distinct from the large-scale conformational changes generally associated with the signaling activity of GPCRs (i.e. swaying of intracellular ends of TMs 5 and 6 away from the TM bundle, see for example Ref. (Gregorio et al., 2017) and citations therein). This is in agreement with experimental results showing that scrambling is a constitutive activity of both ligand-free (more active-like) and ligand-bound (inactive) forms of the opsin protein.
The lipid translocation pathway in opsin revealed by our MD simulations is very similar to the entry pathway of a lipid-like ligand (2-AG) into the cannabinoid CB1 GPCR. Indeed, computational studies involving MD simulations (Hurst et al., 2010) discovered that the sn-2-arachidonoylglycerol (2-AG) fatty acid ligand of the cannabinoid CB2 GPCR partitioned into the protein via an opening between TMs 6 and 7. As 2-AG progressed towards its binding pocket, its polar head group was found to be strongly engaged with residues in CB2R at positions 6.47 and 6.51 that we found were important in opsin for coordinating a lipid along the translocation pathway. Similarly, some of the molecular components that we identify as being important for lipid translocation are similar to those implicated in lipid-protein interactions in other Class-A GPCRs. Thus, recent MD simulations (Neale et al., 2015) reported insertion of a lipid between the IC ends of TMs 6 and 7 of an apo β2-adrenergic GPCR. The head group of the penetrated lipid was seen to interact with the R3.50 component of the functional ionic lock motif (formed by R3.50 and E6.30 residues, in Ballesteros-Weinstein generic numbering).
In light of the reported scrambling activity of several other members of the GPCR family, such as β1- and β2-adrenergic receptors and adenosine A2A receptor (Goren et al., 2014; Menon et al., 2011), these findings suggest that our MD simulation results describing the lipid translocation mechanism we uncovered for opsin could reflect a mechanism common to other GPCR proteins. In this context, we note that some key residues on the lipid translocation pathway, i.e. Y3067.53 and C2646.47, are conserved not only between opsin, β1- and β2-adrenergic receptors, and A2A GPCR (all of which have scramblase activity), but in general within the entire Class-A GPCR family (7.53 position is Tyr in 91% of human Class-A GPCR sequences, whereas 6.47 is Cys in 75% of sequences). Interestingly, the ionic interaction in opsin that is formed by the E2496.32 and K3117.58 pair of residues is poorly conserved as the 6.32 and 7.58 positions are simultaneously occupied by oppositely charged residues only in ~11% of all the human Class-A GPCR sequences. This may suggest that in the majority of Class-A GPCRs the IC ends of TM6 and TM7 could be intrinsically more flexible compared to that in opsin and thus more readily support opening of the lipid translocation pathway.
Because our computational studies identify several key regions in the opsin GPCR that are mechanistically involved in lipid translocation process, the specific structural information that we obtained can guide the rational design of opsin mutants with defined scrambling activity. By testing the functionality of such mutants in our established scramblase activity assays (Goren et al., 2014; Menon et al., 2011; Ploier et al., 2016; Ploier and Menon, 2016) it will be possible to examine explicitly the role of the TM6/7 interface in scrambling.
STAR METHODS
CONTACT FOR REAGENT AND RESOURCES SHARING
Further information and requests for resources and reagents should be directed to and will be fulfilled by the Lead Contact, George Khelashvili (gek2009@med.cornell.edu).
METHOD DETAILS
Molecular Constructs
All computations were based on the X-ray structure of retinal-free opsin (PDBID 4J4Q). This structure also contains opsin-bound synthetic GαCT peptide which was not considered here. Using CHARMM-GUI web interface (Lee et al., 2016), the opsin model was embedded into a lipid membrane consisting of a 9:1 (mole/mole) mixture of POPC (1-palmitoyl-2-oleoyl-sn-glycero-3-phosphocholine) and POPG (1-palmitoyl-2-oleoyl-sn-glycero-3-phospho-(1′-rac-glycerol)) lipids, mimicking the composition of the reconstituted vesicles that have been used for scrambling activity assays (Goren et al., 2014). The protein to lipid ratio was 1:330. After adding a solvation box containing 100 mM NaCl the total system size was ~130,000 atoms.
Molecular dynamics (MD) simulations
All-atom MD simulations were initiated with a previously established multi-step equilibration protocol (Shi et al., 2008). During this stage, the backbone of the protein was first harmonically constrained and subsequently gradually released in three steps of 5 ns each, changing the restrain force constants from 1, to 0.5, and 0.1 kcal/(mol Å2), respectively. This step was followed by ~250 ns of unbiased MD simulations carried out using the NAMD 2.10 (Phillips et al., 2005a) package.
The simulations implemented all option for rigidbonds, 2fs integration time-step, PME for electrostatics interactions (Essmann et al., 1995), and were carried out in NPT ensemble under semi-isotropic pressure coupling conditions, at a temperature of 298 K. The Nose-Hoover Langevin piston algorithm (Phillips et al., 2005a) was used to control the target P = 1 atm pressure with the LangevinPistonPeriod set to 100 fs and LangevinPistonDecay set to 50 fs. The van der Waals interactions were calculated applying a cutoff distance of 12 Å and switching the potential from 10 Å. In addition, vdwforceswitching option was set to on.
After this equilibration phase, MD simulations were continued in four stages (see Table 1, Figure S1) using ACEMD software (Harvey et al., 2009). In Stage 1, four statistically independent unbiased MD simulations were carried out resulting in a cumulative MD simulation time of ~6.1μs (1.8 μs, 1.4 μs, 1.4 μs, and 1.5 pis). A representative conformation of the system from this set of simulations (see Results, Figure S1) was selected to initiate Stage 2 simulations which were carried out in 20 statistically independent replicates, each ~725ns long, resulting in a cumulative time of 14.5μs of trajectory for this stage. Stage 3 simulations were initiated from a representative trajectory frame from Stage 2 (see Results, Figure S1) and were carried out in 20 ~1.3μs-long statistically independent replicates, resulting in cumulative MD trajectory of ~26μs for this stage. Lastly, Stage 4 runs were initiated from an intermediate trajectory frame from Stage 3 (see Results, Figure S1) and were carried out in 20 ~240ns-long independent replicates. The total simulation time for all the three stages was ~51μs. Statistical independence of the simulations was ensured by resetting velocities of all the atoms in the system (at T=298K using random number seed) at the beginning of each stage.
The simulations with ACEMD implemented the PME method for electrostatic calculations, and were carried out according to the protocol developed at Acellera and implemented by us previously (Harvey et al., 2009; Khelashvili et al., 2015) with 4 fs integration time-step and the standard mass repartitioning procedure for hydrogen atoms. The computations were conducted under the NVT ensemble (at T=298K), using the Langevin Thermostat with Langevin Damping Factor set to 0.1.
For all the simulations the latest CHARMM36 force field parameters for proteins, lipids, and ions (Lee et al., 2016; Phillips et al., 2005b) were used.
Quantifying hydration of the intracellular (IC) vestibule in opsin
To quantify hydration of the IC region of opsin lined by TMs 6 and 7, we defined a local cavity by counting the number of water molecules in that region. Specifically, a water molecule was considered to reside in the IC volume between TMs 6 and 7, if its oxygen atom was found within 10Å of any residue in the IC segments of TM6 and TM7 (segments 255–264 and 298–311, respectively). To exclude from this counting any water molecules residing in other (more distal) parts of the IC vestibule of opsin, the additional condition was introduced to consider only those water molecules whose oxygen atom was also within 10Å of any residue in the IC segments of TM2 and TM3 (segments 71–80 and 130–140, respectively).
Markov State Model (MSM) of opsin-mediated lipid translocation process
Application of Markov State Models for automated and unbiased evaluation of large-scale molecular dynamics simulations has been very successful in understanding protein folding mechanisms and most recently in unraveling functional mechanism of GPCRs and other membrane proteins (Beauchamp et al., 2012; Kohlhoff et al., 2014; Razavi et al., 2017; Shukla et al., 2014; Voelz et al., 2010). Here, we utilized MSMs to obtain quantitative kinetic model of opsin-mediated lipid translocation. Briefly, in MSM analysis global conformational changes of a system emerging from the MD simulations are represented as a Markov chain, under conditions that the transitions between different conformations are sampled at long enough time intervals so that each transition is Markovian (Noe and Fischer, 2008; Pande et al., 2010; Prinz et al., 2011) (i.e. transition of the system from one conformation to another does not depend on previous transitions of the system). With Markovian constraint, the MSMs can yield information about long-timescale events from a combination of information from short time-scale events (Chodera et al., 2006).
Dimensionality reduction using the “time-structure based independent component analysis” (tICA)
To construct a MSM from a set of MD trajectories, the conformational space from all trajectories is first reduced by a transformation to a space defined by only a few reaction coordinates of interest. Such dimensionality reduction is necessary both for removing redundant (fast) kinetic modes stored in the atomic coordinates of the system, and to facilitate clustering of conformations based on kinetic similarity before MSM construction (see below). To perform the transformation, we implemented the “time-structure based independent component analysis” (tICA) approach that was shown to identify the slowest reaction coordinates of a system (Molgedey and Schuster, 1994; Naritomi and Fuchigami, 2011; Perez-Hernandez et al., 2013; Razavi et al., 2017; Schwantes and Pande, 2013). Briefly, tICA is based T on constructing a time-lagged covariance matrix (TLCM): CTL(τ)=<X(t)XT(t+τ)> and the covariance matrix C=<X(t)XT(t), where X(t) is the data vector at time t, τ is the lag-time of the TLCM, and the symbol <…> denotes the time average. The slowest reaction coordinates are then identified by solving the generalized eigenvalue problem: CTLV = CVA, where Λ and V are the eigenvalue and eigenvector matrices, respectively. The eigenvectors corresponding to the largest eigenvalues define the slowest reaction coordinates. These reaction coordinates depend on the choice of data vector X.
Following a common practice in the field (Razavi et al., 2014; Schwantes and Pande, 2013; Zhou and Voelz, 2016), we chose an unbiased strategy and defined tICA parameters (i.e. components of X(t) data vectors) as pair-wise distances between every third residue in the transmembrane bundle of opsin. These non-redundant pair-wise distances (2016 pairs in total) between the chosen residues (64 residues in total) are calculated using the closest-heavy algorithm implemented in the MDTraj software package (McGibbon et al., 2015). Each tICA eigenvector had 2016 components (all the pairs serving as parameters), with the relative magnitude of the contribution from each of these components reflecting the importance of the corresponding parameter in forming a particular tICA reaction coordinate. The analysis of contributions of each tICA eigenvector to the total conformational fluctuations revealed that the first 11 tICAs contained ~70% of the total fluctuations of the system (Figure S8). Further evaluation of the 2D landscapes constructed from the pairs of tICA eigenvectors (Figure S9) suggested that only the first 3 eigenvectors capture dynamics of the lipid traversing the opsin hydrophilic grove, and the higher order tICA eigenvectors do not provide any additional coverage of the configuration space. Therefore, the first three tICA reaction coordinates were used to represent the trajectory frames in a dimensionality reduced space, and for the construction of the MSM (see below).
Markov State Model Construction
To construct MSMs, we used MSMBuilder software (Beauchamp et al., 2011)’ (Harrigan et al., 2017) and a procedure described in Ref. (Razavi et al., 2017). Briefly, the tICA space content of trajectory frames was discretized into 100 microstates using automated clustering k-means algorithm, and a transition count matrix (TCM) was built by counting the number of transitions among all microstates. To satisfy detailed balance and local equilibrium, the TCM was then symmetrized using its transpose matrix, as described in Ref. (Beauchamp et al., 2011) and the probabilities of transitions among all microstates were calculated by normalizing the TCM, to obtain the transition probability matrix (TPM). To ensure Markovian behavior, multiple TPMs were constructed for different time intervals between transitions (i.e. MSM lag times), and the relaxation timescales of the system were extracted from:
where τ′ is the lag-time used for building the TPM, λi denotes the ith eigenvalue of the TPM, and τi represents relaxation timescale (also called implied timescale) corresponding to the ith relaxation mode of the system. For a particular set of parameters, the Markovian property of the TPM can be established by verifying the independence of τi from τ′ (see the Results).
Transition Path Theory (TPT) analysis
In order to identify the most probable pathways for the opsin-mediated lipid translocation and quantify timescales for the kinetics of the process, we applied TPT analysis as described in Ref. (Razavi et al., 2017). In brief, the microstate-level representation of the tICA space was transformed into a coarser description by grouping microstates together based on their kinetic similarity, and clustered into macrostates using the Robust Perron Cluster Analysis (PCCA+) (Deuflhard and Weber, 2005) algorithm. A flux matrix (Berezhkovskii et al., 2009) was then constructed for macrostates and the most probable pathways were identified by finding those with the highest flux between the starting macrostate (the macrostate that contains all the initial MD frames for Stage 1) and a final macrostate (the macrostate that contains all the final frames of the MD simulations from stage 4). This was done with the Dijkstra graph theory algorithm (Dijkstra, 1959) implemented in the MSMbuilder software (Beauchamp et al., 2011; Harrigan et al., 2017). The algorithm first finds the top path, and the subsequent paths are then obtained by removing the already identified top path from the flux matrix and repeating the procedure. This iterative approach was used here to determine the first 4 paths, which contribute to ~98% of the total flux (see the Result section).
Supplementary Material
HIGHLIGHTS.
Extensive all-atom molecular dynamics simulations of the opsin GPCR
A hydrophilic pathway is revealed between transmembrane helices 6 and 7 of opsin
Lipids traverse the pathway according to the credit card reader mechanism
Kinetics of the lipid translocation process is quantified using Markov State Models
Acknowledgments
AKM thanks Sam Canis for stimulation. We acknowledge support from the National Institutes of Health, grants EY028314 (G.K. and A.K.M.) and EY024207 (A.K.M.), and the Velux Stiftung (project number 881 (A.K.M.)). GK is also supported by the HRH Prince Alwaleed Bin Talal Bin Abdulaziz Alsaud Institute of Computational Biomedicine at Weill Cornell Medical College through a gratefully acknowledged support from the 1923 Fund. The following computational resources are gratefully acknowledged: resources of the Oak Ridge Leadership Computing Facility (ALCC allocation BIP109) at the Oak Ridge National Laboratory, which is supported by the Office of Science of the U.S. Department of Energy under Contract No. DE-AC05-OOOR22725; an allocation at the National Energy Research Scientific Computing Center (NERSC, repository ml710) supported by the Office of Science of the U.S. Department of Energy under Contract No. DE-AC02-05CH11231; and the computational resources of the David A. Cofrin Center for Biomedical Information in the HRH Prince Alwaleed Bin Talal Bin Abdulaziz Alsaud Institute for Computational Biomedicine at Weill Cornell Medical College.
Footnotes
AUTHOR CONTRIBUTIONS
GK designed and carried out molecular dynamics simulations. GM performed the majority of trajectory the analysis, and AMR carried out the Markov State Model analysis. KP constructed the initial molecular system for simulations. All authors contributed in interpretation of the data, and writing the manuscript.
Supplemental Information includes nine figures.
Publisher's Disclaimer: This is a PDF file of an unedited manuscript that has been accepted for publication. As a service to our customers we are providing this early version of the manuscript. The manuscript will undergo copyediting, typesetting, and review of the resulting proof before it is published in its final citable form. Please note that during the production process errors may be discovered which could affect the content, and all legal disclaimers that apply to the journal pertain.
References
- Ballesteros JA, Weinstein H. Integrated methods for the construction of three-dimensional models and computational probing of structure-function relations in G protein-coupled receptors. Methods in Neurosciences. 1995;40:366–428. [Google Scholar]
- Beauchamp KA, Bowman GR, Lane TJ, Maibaum L, Haque IS, Pande VS. MSMBuilder2: Modeling Conformational Dynamics at the Picosecond to Millisecond Scale. J Chem Theory Comput. 2011;7:3412–3419. doi: 10.1021/ct200463m. [DOI] [PMC free article] [PubMed] [Google Scholar]
- Beauchamp KA, McGibbon R, Lin YS, Pande VS. Simple few-state models reveal hidden complexity in protein folding. Proc Natl Acad Sci USA. 2012;109:17807–17813. doi: 10.1073/pnas.1201810109. [DOI] [PMC free article] [PubMed] [Google Scholar]
- Berezhkovskii A, Hummer G, Szabo A. Reactive flux and folding pathways in network models of coarse-grained protein dynamics. J Chem Phys. 2009;130:205102. doi: 10.1063/1.3139063. [DOI] [PMC free article] [PubMed] [Google Scholar]
- Bethel NP, Grabe M. Atomistic insight into lipid translocation by a TMEM16 scramblase. Proc Natl Acad Sci USA. 2016;113:14049–14054. doi: 10.1073/pnas.1607574113. [DOI] [PMC free article] [PubMed] [Google Scholar]
- Bevers EM, Williamson PL. Getting to the Outer Leaflet: Physiology of Phosphatidylserine Exposure at the Plasma Membrane. Physiol Rev. 2016;96:605–645. doi: 10.1152/physrev.00020.2015. [DOI] [PubMed] [Google Scholar]
- Brunner JD, Lim NK, Schenck S, Duerst A, Dutzler R. X-ray structure of a calcium-activated TMEM16 lipid scramblase. Nature. 2014;516:207–212. doi: 10.1038/nature13984. [DOI] [PubMed] [Google Scholar]
- Chodera JD, Swope WC, Pitera JW, Dill KA. Long-time Protein Folding Dynamics from Short-Time Molecular Dynamics Simulations. Multiscale Modeling & Simulation. 2006;5:1214–1226. [Google Scholar]
- Deuflhard P, Weber M. Robust Perron cluster analysis in conformation dynamics. Linear algebra and its applications. 2005;398:161–184. [Google Scholar]
- Dijkstra EW. A note on two problems in connexion with graphs. Numerische mathematik. 1959;1:269–271. [Google Scholar]
- Ernst OP, Menon AK. Phospholipid scrambling by rhodopsin. Photochemical & photobiological sciences: Official journal of the European Photochemistry Association and the European Society for Photobiology. 2015;14:1922–1931. doi: 10.1039/c5pp00195a. [DOI] [PMC free article] [PubMed] [Google Scholar]
- Essmann U, Perera L, Berkowitz ML, Darden T, Lee H, Pedersen LG. A Smooth Particle Mesh Ewald Method. Journal of Chemical Physics. 1995;103:8577–8593. [Google Scholar]
- Goren MA, Morizumi T, Menon I, Joseph JS, Dittman JS, Cherezov V, Stevens RC, Ernst OP, Menon AK. Constitutive phospholipid scramblase activity of a G protein-coupled receptor. Nature Communications. 2014;5:5115. doi: 10.1038/ncomms6115. [DOI] [PMC free article] [PubMed] [Google Scholar]
- Gregorio GG, Masureel M, Hilger D, Terry D, Juette M, Zhao H, Zhou Z, Perez-Aguilar JM, Hauge M, Mathiesen S, et al. Single-molecule analysis of ligand efficacy in β2AR-G-protein activation. Nature. 2017 doi: 10.1038/nature22354. [DOI] [PMC free article] [PubMed] [Google Scholar]
- Grossfield A, Pitman MC, Feller SE, Soubias O, Gawrisch K. Internal hydration increases during activation of the G-protein-coupled receptor rhodopsin. Journal of Molecular Biology. 2008;381:478–486. doi: 10.1016/j.jmb.2008.05.036. [DOI] [PMC free article] [PubMed] [Google Scholar]
- Harrigan MP, Sultan MM, Hernandez CX, Husic BE, Eastman P, Schwantes CR, Beauchamp KA, McGibbon RT, Pande VS. MSMBuilder: Statistical Models for Biomolecular Dynamics. Biophys J. 2017;112:10–15. doi: 10.1016/j.bpj.2016.10.042. [DOI] [PMC free article] [PubMed] [Google Scholar]
- Harvey MJ, Giupponi G, Fabritiis GD. ACEMD: Accelerating Biomolecular Dynamics in the Microsecond Time Scale. J Chem Theory Comput. 2009;5:1632–1639. doi: 10.1021/ct9000685. [DOI] [PubMed] [Google Scholar]
- Hurst DP, Grossfield A, Lynch DL, Feller S, Romo TD, Gawrisch K, Pitman MC, Reggio PH. A lipid pathway for ligand binding is necessary for a cannabinoid G protein-coupled receptor. J Biol Chem. 2010;285:17954–17964. doi: 10.1074/jbc.M109.041590. [DOI] [PMC free article] [PubMed] [Google Scholar]
- Johnston JM, Wang H, Provasi D, Filizola M. Assessing the relative stability of dimer interfaces in g protein-coupled receptors. PLoS Comput Biol. 2012;8:el002649. doi: 10.1371/journal.pcbi.1002649. [DOI] [PMC free article] [PubMed] [Google Scholar]
- Khelashvili G, Dorff K, Shan J, Camacho-Artacho M, Skrabanek L, Vroling B, Bouvier M, Devi LA, George SR, Javitch JA, et al. GPCR-OKB: the G Protein Coupled Receptor Oligomer Knowledge Base. Bioinformatics. 2010;26:1804–1805. doi: 10.1093/bioinformatics/btq264. [DOI] [PMC free article] [PubMed] [Google Scholar]
- Khelashvili G, Stanley N, Sahai MA, Medina J, LeVine MV, Shi L, De Fabritiis G, Weinstein H. Spontaneous inward opening of the dopamine transporter is triggered by PIP2-regulated dynamics of the N-terminus. ACS Chem Neurosci. 2015;6:1825–1837. doi: 10.1021/acschemneuro.5b00179. [DOI] [PMC free article] [PubMed] [Google Scholar]
- Kohlhoff KJ, Shukla D, Lawrenz M, Bowman GR, Konerding DE, Belov D, Altman RB, Pande VS. Cloud-based simulations on Google Exacycle reveal ligand modulation of GPCR activation pathways. Nature chemistry. 2014;6:15–21. doi: 10.1038/nchem.1821. [DOI] [PMC free article] [PubMed] [Google Scholar]
- Kornberg RD, McConnell HM. Inside-outside transitions of phospholipids in vesicle membranes. Biochemistry. 1971;10:1111–1120. doi: 10.1021/bi00783a003. [DOI] [PubMed] [Google Scholar]
- Lee J, Cheng X, Swails JM, Yeom MS, Eastman PK, Lemkul JA, Wei S, Buckner J, Jeong JC, Qi Y, et al. CHARMM-GUI Input Generator for NAMD, GROMACS, AMBER, OpenMM, and CHARMM/OpenMM Simulations Using the CHARMM36 Additive Force Field. J Chem Theory Comput. 2016;12:405–413. doi: 10.1021/acs.jctc.5b00935. [DOI] [PMC free article] [PubMed] [Google Scholar]
- Leioatts N, Romo TD, Danial SA, Grossfield A. Retinal Conformation Changes Rhodopsin’s Dynamic Ensemble. Biophys J. 2015;109:608–617. doi: 10.1016/j.bpj.2015.06.046. [DOI] [PMC free article] [PubMed] [Google Scholar]
- Malvezzi M, Chalat M, Janjusevic R, Picollo A, Terashima H, Menon AK, Accardi A. Ca2+-dependent phospholipid scrambling by a reconstituted TMEM16 ion channel. Nature communications. 2013;4:2367. doi: 10.1038/ncomms3367. [DOI] [PMC free article] [PubMed] [Google Scholar]
- McGibbon RT, Beauchamp KA, Harrigan MP, Klein C, Swails JM, Hernandez CX, Schwantes CR, Wang LP, Lane TJ, Pande VS. MDTraj: A Modern Open Library for the Analysis of Molecular Dynamics Trajectories. Biophys J. 2015;109:1528–1532. doi: 10.1016/j.bpj.2015.08.015. [DOI] [PMC free article] [PubMed] [Google Scholar]
- Menon I, Huber T, Sanyal S, Banerjee S, Barre P, Canis S, Warren JD, Hwa J, Sakmar TP, Menon AK. Opsin is a phospholipid flippase. Curr Biol. 2011;21:149–153. doi: 10.1016/j.cub.2010.12.031. [DOI] [PMC free article] [PubMed] [Google Scholar]
- Molgedey L, Schuster HG. Separation of a mixture of independent signals using time delayed correlations. Phys Rev Lett. 1994;72:3634–3637. doi: 10.1103/PhysRevLett.72.3634. [DOI] [PubMed] [Google Scholar]
- Naritomi Y, Fuchigami S. Slow dynamics in protein fluctuations revealed by time-structure based independent component analysis: the case of domain motions. J Chem Phys. 2011;134:065101. doi: 10.1063/1.3554380. [DOI] [PubMed] [Google Scholar]
- Neale C, Herce HD, Pomes R, Garcia AE. Can Specific Protein-Lipid Interactions Stabilize an Active State of the Beta 2 Adrenergic Receptor? Biophys J. 2015;109:1652–1662. doi: 10.1016/j.bpj.2015.08.028. [DOI] [PMC free article] [PubMed] [Google Scholar]
- Noe F, Fischer S. Transition networks for modeling the kinetics of conformational change in macromolecules. Curr Opin Struct Biol. 2008;18:154–162. doi: 10.1016/j.sbi.2008.01.008. [DOI] [PubMed] [Google Scholar]
- Pande VS, Beauchamp K, Bowman GR. Everything you wanted to know about Markov State Models but were afraid to ask. Methods. 2010;52:99–105. doi: 10.1016/j.ymeth.2010.06.002. [DOI] [PMC free article] [PubMed] [Google Scholar]
- Perez-Hernandez G, Paul F, Giorgino T, De Fabritiis G, Noe F. Identification of slow molecular order parameters for Markov model construction. J Chem Phys. 2013;139:015102. doi: 10.1063/1.4811489. [DOI] [PubMed] [Google Scholar]
- Phillips JC, Braun R, Wang W, Gumbart J, Tajkhorshid E, Villa E, Chipot C, Skeel RD, Kale L, Schulten K. Scalable molecular dynamics with NAMD. Journal of Computational Chemistry. 2005a;26:1781–1802. doi: 10.1002/jcc.20289. [DOI] [PMC free article] [PubMed] [Google Scholar]
- Phillips JC, Braun R, Wang W, Gumbart J, Tajkhorshid E, Villa E, Chipot C, Skeel RD, Kale L, Schulten K. Scalable molecular dynamics with NAMD. J Comput Chem. 2005b;26:1781–1802. doi: 10.1002/jcc.20289. [DOI] [PMC free article] [PubMed] [Google Scholar]
- Ploier B, Caro LN, Morizumi T, Pandey K, Pearring JN, Goren MA, Finnemann SC, Graumann J, Arshavsky VY, Dittman JS, et al. Dimerization deficiency of enigmatic retinitis pigmentosa-linked rhodopsin mutants. Nature communications. 2016;7:12832. doi: 10.1038/ncomms12832. [DOI] [PMC free article] [PubMed] [Google Scholar]
- Ploier B, Menon AK. A Fluorescence-based Assay of Phospholipid Scramblase Activity. Journal of visualized experiments: JoVE. 2016 doi: 10.3791/54635. [DOI] [PMC free article] [PubMed] [Google Scholar]
- Pomorski T, Menon AK. Lipid flippases and their biological functions. Cell Mol Life Sci. 2006;63:2908–2921. doi: 10.1007/s00018-006-6167-7. [DOI] [PMC free article] [PubMed] [Google Scholar]
- Pomorski TG, Menon AK. Lipid somersaults: Uncovering the mechanisms of protein-mediated lipid flipping. Prog Lipid Res. 2016;64:69–84. doi: 10.1016/j.plipres.2016.08.003. [DOI] [PMC free article] [PubMed] [Google Scholar]
- Prinz JH, Wu H, Sarich M, Keller B, Senne M, Held M, Chodera JD, Schutte C, Noe F. Markov models of molecular kinetics: generation and validation. J Chem Phys. 2011;134:174105. doi: 10.1063/1.3565032. [DOI] [PubMed] [Google Scholar]
- Quazi F, Lenevich S, Molday RS. ABCA4 is an N-retinylidene-phosphatidylethanolamine and phosphatidylethanolamine importer. Nature communications. 2012;3:925. doi: 10.1038/ncomms1927. [DOI] [PMC free article] [PubMed] [Google Scholar]
- Quazi F, Molday RS. ATP-binding cassette transporter ABCA4 and chemical isomerization protect photoreceptor cells from the toxic accumulation of excess 11-cis-retinal. Proc Natl Acad Sci USA. 2014;111:5024–5029. doi: 10.1073/pnas.1400780111. [DOI] [PMC free article] [PubMed] [Google Scholar]
- Razavi AM, Khelashvili G, Weinstein H. A Markov State-based Quantitative Kinetic Model of Sodium Release from the Dopamine Transporter. Sci Rep. 2017;7:40076. doi: 10.1038/srep40076. [DOI] [PMC free article] [PubMed] [Google Scholar]
- Razavi AM, Wuest WM, Voelz VA. Computational screening and selection of cyclic peptide hairpin mimetics by molecular simulation and kinetic network models. Journal of chemical information and modeling. 2014;54:1425–1432. doi: 10.1021/ci500102y. [DOI] [PubMed] [Google Scholar]
- Sanyal S, Menon AK. Flipping lipids: why an’ what’s the reason for? ACS chemical biology. 2009;4:895–909. doi: 10.1021/cb900163d. [DOI] [PMC free article] [PubMed] [Google Scholar]
- Schwantes CR, Pande VS. Improvements in Markov State Model Construction Reveal Many Non-Native Interactions in the Folding of NTL9. J Chem Theory Comput. 2013;9:2000–2009. doi: 10.1021/ct300878a. [DOI] [PMC free article] [PubMed] [Google Scholar]
- Shi L, Quick M, Zhao Y, Weinstein H, Javitch JA. The mechanism of a neurotransmitter:sodium symporter--inward release of Na+ and substrate is triggered by substrate in a second binding site. Mol Cell. 2008;30:667–677. doi: 10.1016/j.molcel.2008.05.008. [DOI] [PMC free article] [PubMed] [Google Scholar]
- Shukla D, Meng Y, Roux B, Pande VS. Activation pathway of Src kinase reveals intermediate states as targets for drug design. Nature communications. 2014;5:3397. doi: 10.1038/ncomms4397. [DOI] [PMC free article] [PubMed] [Google Scholar]
- Voelz VA, Bowman GR, Beauchamp K, Pande VS. Molecular simulation of ab initio protein folding for a millisecond folder NTL9(1–39) J Am Chem Soc. 2010;132:1526–1528. doi: 10.1021/ja9090353. [DOI] [PMC free article] [PubMed] [Google Scholar]
- Zhou G, Voelz VA. Using Kinetic Network Models To Probe Non-Native Salt-Bridge Effects on alpha-Helix Folding. J Phys Chem B. 2016;120:926–935. doi: 10.1021/acs.jpcb.5b11767. [DOI] [PMC free article] [PubMed] [Google Scholar]
Associated Data
This section collects any data citations, data availability statements, or supplementary materials included in this article.