Abstract
The unique metabolic demands of cancer cells underscore potentially fruitful opportunities for drug discovery in the era of precision medicine. However, therapeutic targeting of cancer metabolism has led to surprisingly few new drugs to date. The neutral amino acid glutamine serves as a key intermediate in numerous metabolic processes leveraged by cancer cells including biosynthesis, cell signaling, and oxidative protection. Herein, we report the preclinical development of V-9302, a competitive small molecule antagonist of transmembrane glutamine flux, that selectively and potently targets the amino acid transporter ASCT2 (SLC1A5). Pharmacological blockade of ASCT2 with V-9302 resulted in attenuated cancer cell growth and proliferation, increased cell death, and increased oxidative stress, which collectively, contributed to anti-tumor responses in vitro and in vivo. Representing a new class of targeted therapy, this is the first study to demonstrate the utility of a pharmacological inhibitor of glutamine transport in oncology, laying a framework for paradigm-shifting therapies targeting cancer cell metabolism.
Healthy mammalian cells sequester the amino acid glutamine through an evolutionarily redundant family of cell-surface transporters known as the solute carrier family of proteins (SLC)1. The alanine-serine-cysteine transporter, type-2 (ASCT2, encoded by gene SLC1A5), is a sodium-dependent solute carrier protein responsible for the import of neutral amino acids and is the primary transporter of glutamine in cancer cells2. Elevated ASCT2 levels have been linked to poor survival in many human cancers, including those of the lung3, breast4, and colon5. Furthermore, several studies have attributed signal transduction and oncogene expression with increased demand for glutamine. For example, MYC is responsible for transcribing the machinery of glutaminolysis, including SLC1A56, while a link has also been established between oncogenic RAS and glutamine dependency in colon cancer7 and lung cancer8.
The critical role of glutamine in cancer cell growth and homeostasis suggests the potential of novel therapies targeting glutamine metabolism; however, efforts thus far have been met with limited success9,10. One strategy currently being evaluated in early phase clinical trials targets mitochondrial glutaminase (GLS1; CB-839 (Calithera Biosciences)), an enzyme responsible for converting glutamine to glutamate. While promising, a limitation of this strategy is that targeting GLS1 does not fully address extra-mitochondrial roles of glutamine, which include RAS-independent activation of MAPK signaling11. We hypothesized that antagonizing cell-surface glutamine transport, which could potentially be capable of abrogating multiple facets of glutamine metabolism, may represent a more efficacious approach. In support of this hypothesis, prior genetic studies silencing ASCT2 in cancer cells resulted in dramatic anti-tumor effects4,12. Towards this end, we report development of V-9302, the first small molecule antagonist of a glutamine transporter and evaluate its use in the setting of oncology. Pharmacological blockade of ASCT2 with V-9302 resulted in attenuated cancer cell growth and proliferation, increased cell death, and increased oxidative stress, which collectively, contributed to anti-tumor responses in vitro and in murine models in vivo.
Results
Previously, we discovered a novel series of small-molecule glutamine transport antagonists13. From this series of 2-amino-4-bis(aryloxybenzyl)aminobutanoic acids, a lead (V-9302) emerged (Fig. 1A), which was found to be among the most potent inhibitors of live-cell glutamine uptake reported to date. As shown in Fig. 1B, V-9302 inhibited ASCT2-mediated glutamine uptake in human cells in a concentration-dependent fashion and exhibited a 100-fold improvement in potency (IC50 V-9302 = 9.6 µM) over gamma-L-glutamyl-p-nitroanilide (GPNA; IC50 = 1000 µM)14, a previously reported inhibitor of glutamine uptake. Using a panel of 3H-labeled amino acids transported by multiple transporter systems, including glutamine and other solutes not transported by ASCT2 (Extended Data Fig. 1), we observed that V-9302 preferentially inhibited glutamine transport at up to 10-fold the IC50 concentration (Fig. 1C/1D). Similarly, V-9302 was found to be capable of inhibiting the uptake of another ASCT2 substrate, leucine (Fig. 1D/E.), suggesting that the amino acid transport inhibitory profile was ASCT2-selective but not restricted to glutamine. To confirm that V-9302 binds ASCT2, we employed the Drug Affinity Responsive Target Stability (DARTS) technique15 using HEK-293 cells expressing a tetracycline-inducible ASCT2 vector. The DARTS technique is a target identification strategy that capitalizes upon reduction in protease susceptibility of a target protein upon drug binding15. We observed that ASCT2 was protected from proteolysis in a V-9302 concentration-dependent manner (Fig. 1F, Extended Data Fig. 2A.), indicating a stable V-9302-ASCT2 interaction and, thus, implicating ASCT2 as a putative target of the compound. Interestingly, the ASCT2 paralog, ASCT1 (SLC1A4), was not stabilized in the presence of V-9302 (Extended Data Fig. 2B), suggesting that V-9302 exhibits ASCT2 selectivity.
Figure 1. V-9302, an inhibitor of glutamine transport.
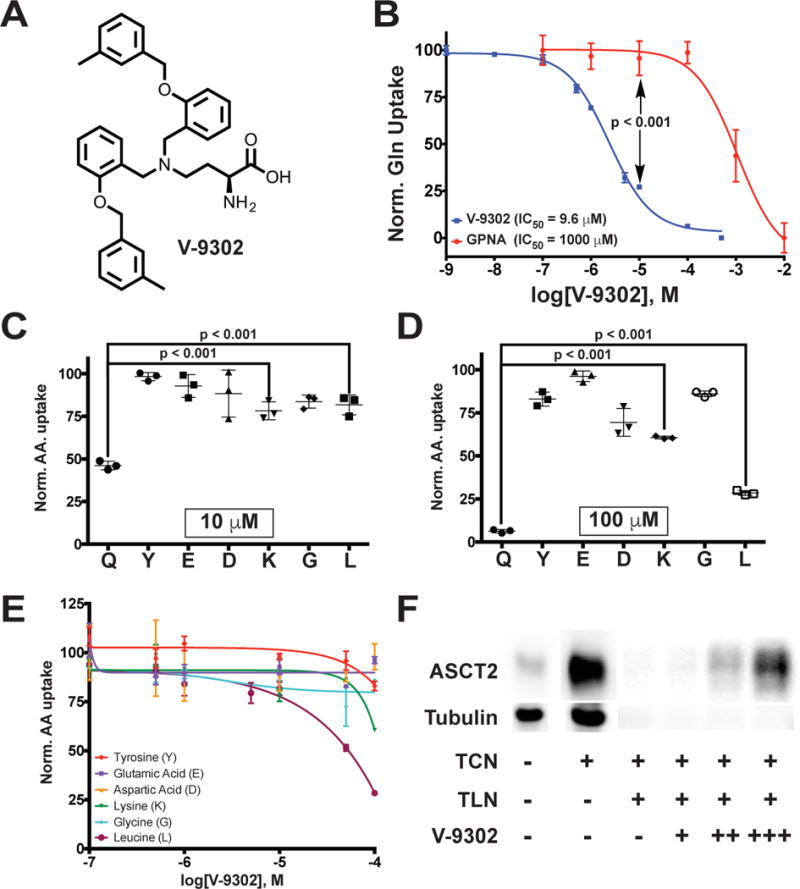
(A) Chemical structure of V-9302. (B) Concentration-dependent inhibition of glutamine uptake in live HEK-293 cells; V-9302 (blue curve), GPNA (red curve); n = 3 independent experiments performed in triplicate. P < 0.001 at 10 µM by Student’s t test. Cellular glutamine accumulation normalized to vehicle control. Normalized amino acid uptake (relative to vehicle) in HEK-293 cells with V-9302 exposure at the IC50 (10 µM, (C)) and 10X the IC50 for glutamine inhibition (100 µM, (D)); n = 3 independent experiments. P < 0.001 by Student’s t test. Q=glutamine, Y=tyrosine, E=glutamic acid, D=aspartic acid, K=lysine, G=glycine, L=leucine. (E) Normalized uptake of 3H-labeled amino acids in HEK293 cells evaluated in the presence of increasing concentrations of V-9302; n = 3 independent experiments. Normalization relative to vehicle control. (F) Drug Affinity Responsive Target Stability (DARTS) assay visualized by immunoblot; tetracycline (TCN)-inducible ASCT2 HEK293 cells. ASCT2 is protected from proteolytic degradation by thermolysin (TLN) in the presence of increasing concentrations of V-9302 (veh = -, + = 50 µM, ++ = 100 µM, +++ = 200 µM. Uncropped gel images are provided in Supplementary Fig. 1. Error bars represent ± std. dev.
To model points of interaction between V-9302 and ASCT2, we utilized an in silico homology model of human ASCT2 (hASCT2)16. We found that V-9302 was compatible with the orthosteric amino acid binding pocket of hASCT2, which is localized within the transmembrane region of the protein (Fig. 2A). The conserved alpha-amino acid head group of V-9302 appeared to form key interactions within the zwitterion recognition site (Fig. 2B), which has been shown through crystallographic data to recognize amino acids and derivatives thereof16. Similarly, docking glutamine into ASCT2 resulted in direct overlap with the putative binding pocket occupied by V-9302 (Fig. 2C). To validate the specific interactions observed, we performed an in silico alanine scan of residues located within the putative V-9302 binding pocket (Fig. 2D). Overall docking scores with mutation of S353 and D464 suggested strong corresponding sidechain interactions at these residues (Fig. 2D). Consistent with the amino acid selectivity assay (Fig. 1C/D), V-9302 interactions with LAT1, another transporter of glutamine, suffered steric hindrance penalties (Fig. 2E/F). In contrast to V-9302, interface scores for glutamine in ASCT2 and LAT1 were favorable in both models (Fig. 2F). These two neutral amino acid transporters are frequently co-expressed and exhibit overlapping substrate specificity, which has led some to propose cooperatively between ASCT2 and LAT1 in certain cancers17,18.
Figure 2. In silico modeling of V-9302 interactions with human ASCT2 (hASCT2).
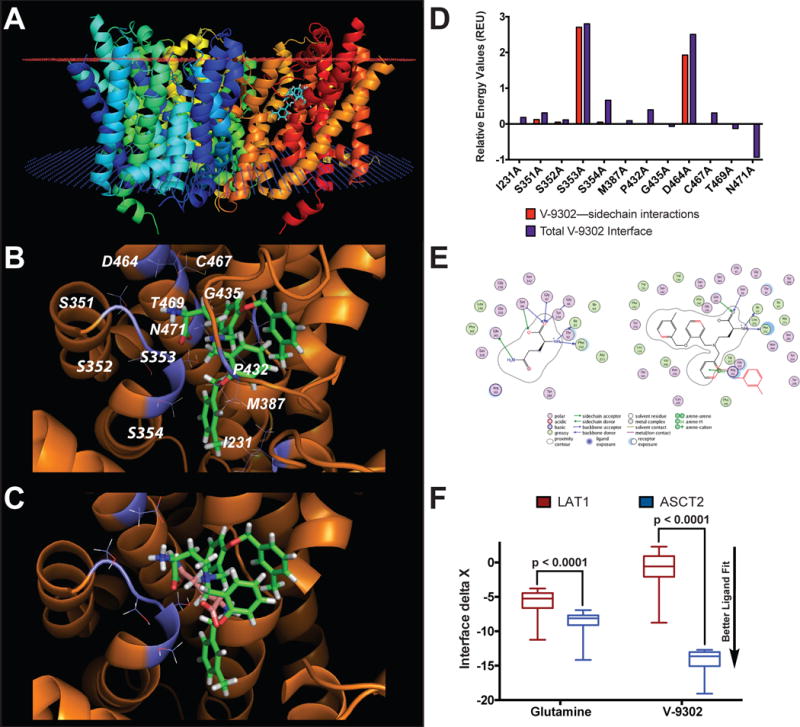
(A) Homology model of hASCT2 (trimer shown) with V-9302 docked into the orthosteric binding site within the transmembrane region of the protein (extracellular membrane - red plane; intracellular membrane - blue plane). (B) Expanded view of residues proximal to V-9302 within the orthosteric binding site. Top scoring pose shown. (C) Overlay of V-9302 and ASCT2 substrate, glutamine, docked into the orthosteric binding site. (D) In silico alanine scan of the hASCT2 binding pocket. Positive values indicate alanine substitution interacts less favorably with V-9302 relative to the native residue. The total interface score is a weighted summation of the hydrogen bonding scores, repulsion penalties, solvation energies, and electrostatic potential. Glutamine and V-9302 were evaluated in a homology model of LAT1. (E) Ligand interaction diagram of glutamine or V-9302 in LAT1 visualized in the MOE molecular modeling and simulation package. Steric clash with the surrounding residues indicated in red (only seen with V-9302). (F) Docking scores for glutamine and V-9302 into LAT1; similar fit observed for glutamine in LAT1 and ASCT2, while V-9302 only fits the ASCT2 binding pocket. n = 100 top scoring poses per condition. P values determined by Student’s t test. For box plots, center line is plotted at the median; the box spans from the first quartile to the third quartile; whiskers represent min to max.
To evaluate the effects of V-9302 on human cancer cells, we conducted an in vitro efficacy screen of 29 human cancer cell lines spanning three tumor types (Fig. 3A1). Given the anaplerotic nature of glutamine, we utilized an ATP-dependent assay of viability as a primary screen, which was validated in independent follow-up screening. In the primary screen, we observed that V-9302 exposure reduced in vitro viability by at least 20% in more than half of the cell lines screened, with sensitivity to V-9302 exposure not obviously linked to select mutational status (Extended Data Fig. 3). Follow-up screening was carried out in a subset of colorectal cancer (CRC) cell lines that exhibited variable sensitivities to V-9302 in the primary screen. Using three independent assays lacking ATP-dependency, we confirmed that V-9302 exposure led to reduced cellular viability and increased cell death (Extended Data Fig. 4)19. While V-9302 impacted either viability or cell death to varying degrees across the panel of cell lines screened, certain particularly sensitive cell lines exhibited dramatically decreased viability and increased cell death, including RKO, SW620, and LIM2537. To elucidate biological correlates of V-9302 sensitivity, we compared cell line sensitivity with ASCT2 levels (Extended Data Fig. 5), as well as viability in media depleted of ASCT2 substrates (Extended Data Fig. 6). Neither membranous nor total ASCT2 levels correlated with V-9302-dependent changes in viability. However, cell lines sensitive to V-9302 exposure exhibited reduced viability and increased cell death when propagated in glutamine-depleted or ASCT2-substrate-depleted media. Finally, we compared cellular viability with exposure to V-9302 or CB-839 in four human CRC cell lines (Fig. 3B). The EC50 concentrations for the four CRC cell lines exposed to V-9302 ranged from approximately 9-15 µM, while CB-839 did not exhibit appreciable activity under identical conditions. Glutamine plays critical roles in T-cell proliferation and activation20. We evaluated the effects of V-9302 on activated CD8-positive T-cells in vitro and found T-cell viability unchanged relative to vehicle (Extended Data Fig. 7A). T-cell activation was also not impaired with V-9302 exposure (Extended Data Fig. 7B).
Figure 3. In vitro Efficacy of V-9302.
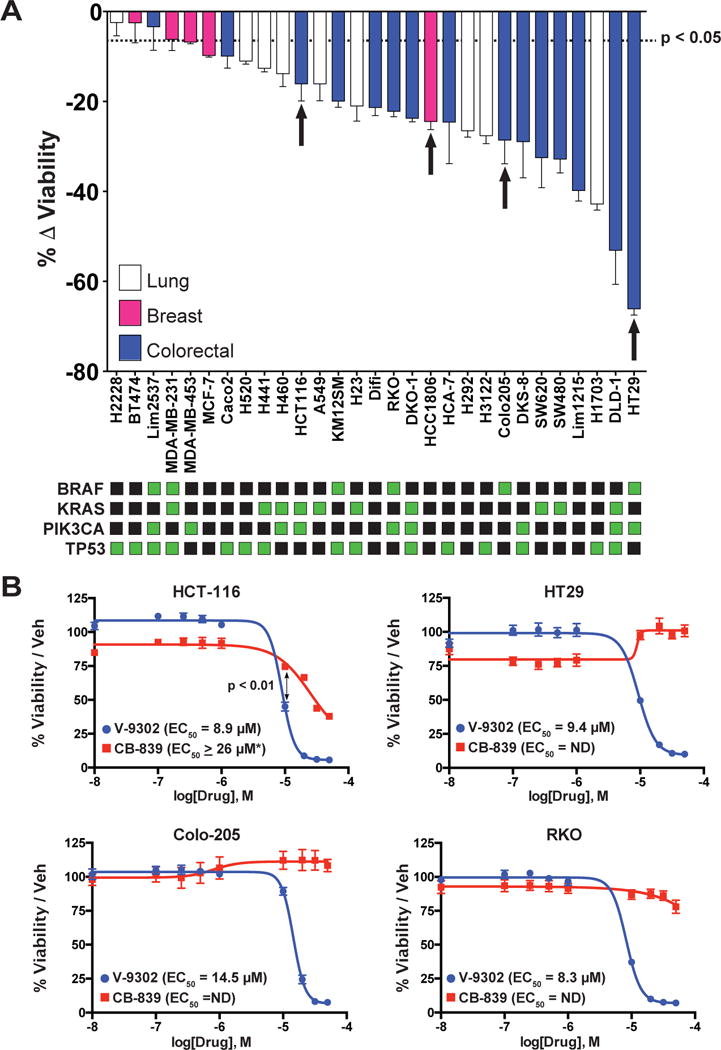
(A) A panel of 29 human cancer cell lines exposed to a single concentration of V-9302 (25 µM, 48 hrs); assay of ATP-dependent viability (CellTiter Glo). Select mutational status highlighted (green squares). Cell lines derived from lung cancer (white bars), breast cancer (pink bars), and colorectal cancer (blue bars) shown; n = 3 independent experiments. Specific cell lines representing a range of in vitro sensitivities prioritized for further evaluation in vivo indicated by arrows. Cell lines with P < 0.05 by Student’s t test relative to vehicle control below dotted line. (B) Direct comparison of V-9302 or CB-839 on the viability of human CRC cell lines. Drug incubated at concentrations shown for 48 hrs. Percent viability relative to vehicle control (MultiTox Glo assay); n = 3 independent experiments. P < 0.01 at 10 µM by Student’s t test. Error bars represent ± std. dev. *Estimated EC50. Error bars represent ± std. dev.
To elucidate determinants of response to V-9302 in vitro, we carried out shRNA knockdown of ASCT2 in HCC1806 cells, as previously shown4, to enable direct comparison with silencing the target. Silencing ASCT2 (Fig. 4A) and V-9302 exposure (Fig. 4B) in HCC1806 cells resulted in analogous downstream effects, including significantly decreased pS6 and a modest decrease in pERK. A similar inhibition profile was observed in V-9302-treated HT29 cells (Extended Data Fig. 8). Using an independent biochemical assay of pERK activity, we validated that V-9302 exposure resulted in a statistically significant, concentration-dependent decrease in pERK not observed with CB-839 in HCC1806 or HT29 cells (Extended Data Fig. 9). In addition, in vitro V-9302 exposure in HCC1806 cells led to increased levels of oxidized glutathione (GSSG) at the expense of reduced glutathione (GSH) (Fig. 4C), and a corresponding increase in intracellular reactive oxygen species (ROS) (Fig. 4D) at concentrations that exceeded the IC50 for glutamine uptake. Like HCC1806 cells, V-9302 exposure led to elevated GSSG levels and ROS in HT29 cells, features not observed with CB-839 (Extended Data Fig. 10). Autophagy following V-9302 exposure was observed in multiple cell lines, which was not unexpected given the relationship between amino acid withdrawal, regulation of mTOR, and autophagy18. Immunofluorescence (Fig. 4E) revealed that V-9302 exposure in HCC1806 cells led to elevated LC3B, a marker of autophagy12. In the same cell line as well as HT29, autophagic flux was elevated with V-9302 exposure in a concentration-dependent manner (Extended Data Fig. 11A/B). Combining V-9302 with the lysosomal inhibitor, chloroquine, further increased the number of autophagic vesicles in HT29 cells (Extended Data Fig. 11B). In contrast, CB-839 exposure did not lead to elevated autophagic flux, with or without the addition of chloroquine (Extended Data Fig. 11C). In HT29 and HCT-116 cells, combined exposure of chloroquine and V-9302 further decreased cell viability compared with single agent exposure or vehicle control. In contrast, CB-839 did not decrease cell viability in these cell lines under identical conditions, nor exhibit a combinatorial effect with chloroquine (Extended Data Fig. 12A/B). Consistent with modulated oxidative stress and increased oxidation of NAD(P)H by glutathione reductase, V-9302 exposure led to decreased optical redox ratio in HCC1806 cells (ratio of NAD(P)H to FAD) (Fig. 4F)21 and decreased the fluorescent lifetimes of both NAD(P)H and FAD (Extended Data Fig. 13). The optical redox ratio of a cell is well-conserved and has been highly validated with independent measurements, including glycolytic activity and oxygen consumption. The changes in optical redox ratio following V-9302 exposure, and their magnitude, are consistent with prior studies correlating these measures with PI3K/Akt/mTOR pathway inhibition in human breast cancer cells22. The efficacy of V-9302 was further evaluated in two CRC organoids developed at Vanderbilt University Medical Center expressing activating mutations in KRAS and BRAF. The viability of both organoid A-007 (BRAFV600E) and A-008 (KRASG12V;p53R248Q;PTENL140Y,) were significantly reduced with exposure to V-9302 (Fig. 4G). In contrast, the same organoids were not significantly affected by CB-839 exposure (Extended Data Fig. 14).
Figure 4. Molecular determinants of ASCT2-antagonism in vitro.
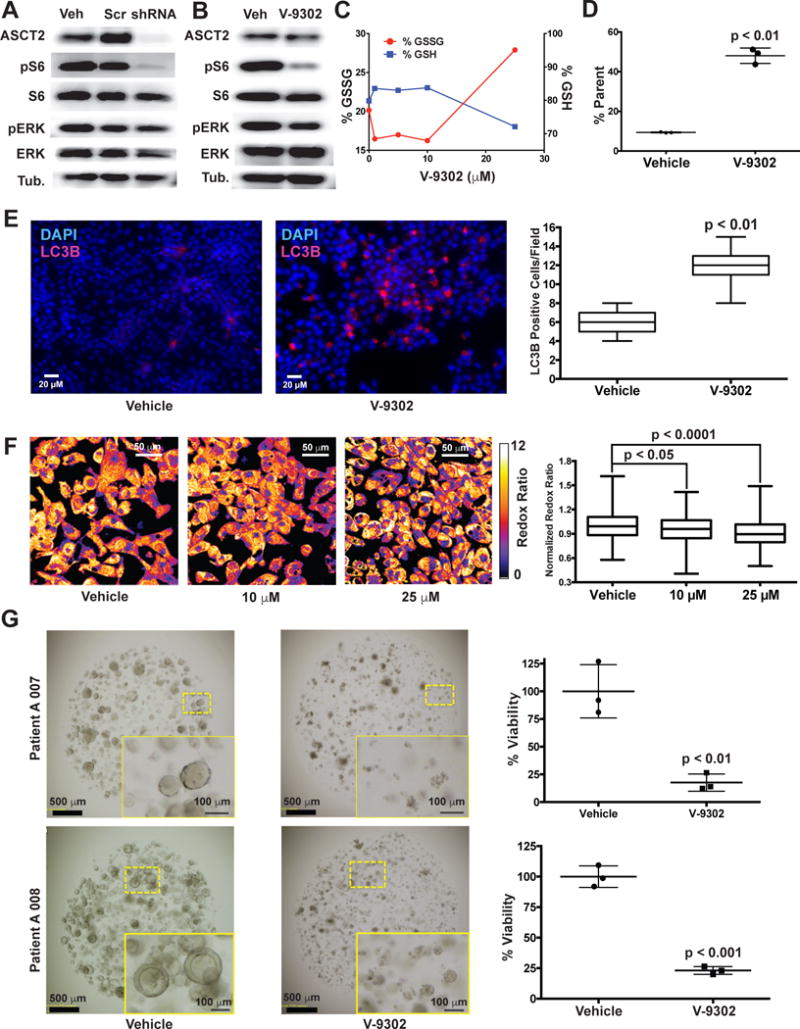
(A) Silencing ASCT2 (shRNA; HCC1806 cells; immunoblot shown) resulted in significantly attenuated pS6 and modestly decreased pERK. (B) V-9302 exposure (25 µM, 48 hrs) exhibited a similar inhibition profile to silencing ASCT2 with shRNA in HCC1806 cells. Uncropped gel images are provided in Supplementrary Fig. 2. (C) V-9302-dependent increase in oxidized glutathione (GSSG, left y-axis) and depletion of reduced glutathione (GSH, right y-axis) and (D) corresponding assay of reactive oxygen species (ROS); HCC1806 cells; n = 3 independent experiments. P < 0.01 by Student’s t test. (E) Effect of V-9302 exposure (25 µM, 48 hrs) on LC3B, a marker of autophagy, in HCC1806 cells. Immunofluorescence photomicrographs (left panels) showing cellular LC3B localization (pink fluorescence). Quantified numbers of LC3B-positive cells per field shown in right panel; n = 3 independent experiments. P < 0.01 by Student’s t test. Magnification 40×. (F) Effect of V-9302 exposure on optical redox-ratio ([FAD]/[NAD(P)H]) in HCC1806 cells. Representative photomicrographs (left) and quantification (right); concentrations shown, 48 hr exposure; n = 3 independent experiments. P values determined by Student’s t test. Magnification 40×. (G) Effects of V-9302 exposure (25 µM, 96 hrs) on the viability of two human colorectal cancer organoids (A007 - BRAFV600E; A008 - KRASG12V;p53R248Q;PTENL140Y.) Representative brightfield photomicrographs (left) and quantified organoid viability (right); n = 3 independent experiments. P values determined by Student’s t test. Error bars represent ± std. dev. For box plots, center line is plotted at the median; the box spans from the first quartile to the third quartile; whiskers represent min to max.
We next evaluated the performance of V-9302 in vivo, first establishing that steady-state plasma concentrations were achieved 4 h post-administration, with a half-life of approximately 6 h in healthy mice (Extended Data Fig. 15). The effects of acute and chronic V-9302 exposure on plasma levels of glucose and glutamine were also evaluated in healthy mice. Following a single acute V-9302 exposure (4 h), plasma glucose levels were not significantly different than vehicle controls, yet plasma glutamine levels were elevated by approximately 50% in V-9302-treated mice compared to vehicle controls, likely a pharmacodynamic effect (Extended Data Fig. 16A/B). Plasma glucose levels in mice chronically exposed to V-9302 or vehicle over a 21-day regimen were not significantly different, while plasma glutamine levels were slightly decreased (Extended Data Fig. 16C/D). To evaluate the effect of V-9302 on glutamine levels in tumors, we employed non-invasive PET imaging using [18F]-4F-glutamine5. Following a single dose of V-9302 (75 mg/kg, 4 h), [18F]-4F-glutamine uptake in tumors was reduced by approximately 50% to levels below background uptake in healthy muscle (Fig 5A–C). Unlike tumors, [18F]-4F-glutamine uptake in muscle was unaffected by V-9302 exposure (Fig. 5C), while [18F]-4F-glutamine uptake in liver was modestly elevated (p = 0.05) following V-9302 treatment. We next carried out chronic exposure studies in tumor-bearing mice. Athymic nude mice bearing HCT-116 (KRASG13D) or HT29 (BRAFV600E) cell-line xenografts were treated with 75 mg/kg per day V-9302 for 21 days. Over the treatment course, V-9302 prevented tumor growth compared to vehicle controls in both HCT-116 (Fig. 5D) and HT29 (Fig. 5F) xenograft models. Consistent with in vitro mechanistic studies, V-9302 led to significantly decreased pS6 in tumor tissue in both HCT-116 (Fig. 5E) and HT29 xenografts (Fig. 5G). In addition to decreased pS6 IHC, V-9302 treatment led to elevated levels of cleaved caspase 3 in both HCT-116 (Fig. 5E) and HT29 xenografts (Fig. 5G). To evaluate V-9302 in a more clinically relevant model, we conducted a similar chronic exposure study in mice bearing a patient-derived xenograft (PDX) tumor (A-008, KRASG12V;p53R248Q;PTENL140Y). Over the treatment course, V-9302 exposure led to a reduction in tumor volume compared to vehicle controls (Fig. 5H/I). To further elaborate in vivo determinants of response to V-9302, we carried out a 10-day exposure studies in aythumic nude mice bearing HCC1806 or Colo-205 xenografts (Extended Data Figs. 17 and 18). Both models exhibited V-9302-dependent tumor growth arrest analogous to that observed in HCT-116 and HT29 xenografts. Response to V-9302 in HCC1806 xenografts was characterized by elevated LC3B and cleaved caspase 3, along with decreased pAKT (Ser473) and pS6 (Extended Data Fig. 17). Similarly, in Colo-205 xenografts, V9302 treatment led to elevated LC3B, cleaved caspase 3 and decreased pAKT (Ser473 and Thr308), as well as increased cleaved PARP and decreased and pERK (Extended Data Fig. 18). Additional insights into V-9302-mediated response in Colo-205 xenografts included decreased tumor BRDU uptake, as well as elevated pGSK3B, pPRAS40, p38, and p53. Over the course of chronic exposure studies, no significant weight loss was observed in V-9302-treated cohorts compared to vehicle-treated controls (Extended Data Fig. 19). Additionally, liver pathology was similar among mice chronically treated with V-9302 or vehicle control (Extended Data Fig. 20).
Figure 5. Evaluation of V-9302 in vivo.
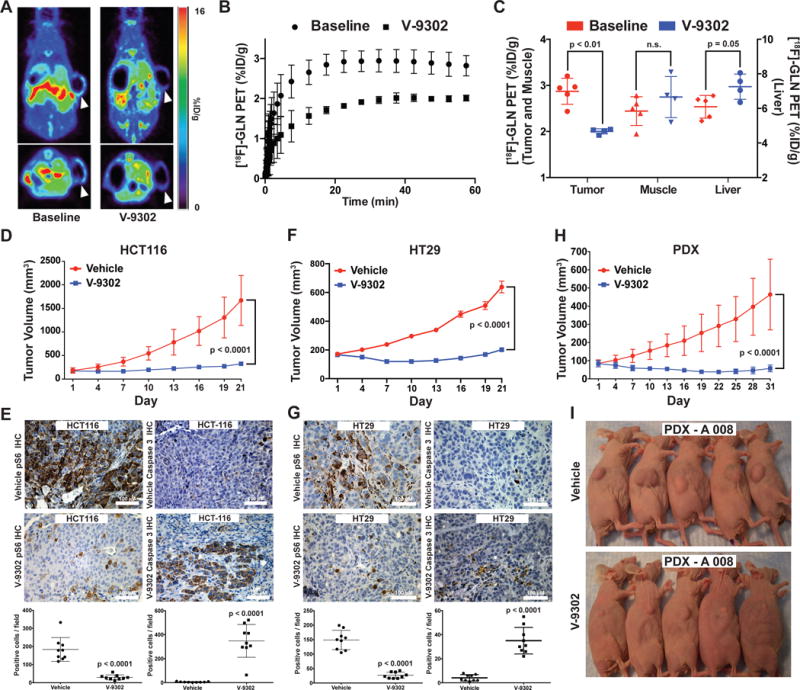
(A) Pharmacodynamic [18F]-4F-Gln PET imaging prior to and 4 h following a single administration of V-9302 (75 mg/kg) in HCC1806 cell line xenograft-bearing mice (arrows indicate xenograft tumor on right flank*). (B) Mean time activity curves (TACs) from tumor regions of interest (n = 4 measurements per condition); data prior to and 4 hrs following V-9302 administration. (C) P values determined by Student’s t test. Quantified tracer accumulation in xenograft tumors, muscle, and liver (n = 4 measurements per condition). Volumetric analysis over 21 day treatment regimen (Vehicle or V-9302; 75 mg/kg, daily) of HCT-116 (D) and HT29 (F) cell line xenografts propagated in athymic nude mice (n = 10 mice per group). Treatment started 12 days post tumor injection for HCT-116 and 4 days post injection for HT29. P values on day 21 determined by Student’s t test. Immunohistochemistry for pS6 and caspase 3 in vehicle-treated or V-9302-treated HCT-116 (E) and HT29 (G) xenografts. Representative photomicrographs and quantitation shown; magnification 20×. P values determined by Student’s t test. (H) Volumetric analysis over 31 day treatment regimen (Vehicle or V-9302; 75 mg/kg, daily) on athymic nude mice bearing patient-derived xenograft tumors (PDX A 008, F3 generation, treatment started 28 days post implantation, KRASG12V;p53R248Q;PTENL140Y ; n = 10 mice per group) P value on day 31 determined by Student’s t test. (I) Photographs of A 008 PDX-bearing mice treated with V-9302 or vehicle; day 16 of 31. (Error bars represent ± std. dev. *Central photopenia observed.
To evaluate the in vivo effects of V-9302 on tumors globally, we carried out an unbiased metabolomic analysis of HT29 xenografts following 21 consecutive days of V-9302 exposure or vehicle treatment. A total of 782 metabolites of known identity that span 50 distinct metabolic pathways were quantitatively evaluated by LC/MS (Metabolon, Supplementary Data 1). Notably, V-9302 exposure significantly (P < 0.05) impacted 239 metabolites that spanned seven metabolic categories (Fig. 6A), each attributable to various aspects of ASCT2 transport and glutamine metabolism. Certain metabolites impacted by V-9302 treatment were directly downstream of ASCT2 transport, such as N-acetylserine, which was reduced in V-9302-treated tumors by greater than 4-fold. Evidence of impacting ATP by V-9302 included significantly reduced creatine-phosphate levels in treated tumors. Confirming earlier in vitro studies that identified oxidative stress as a key impact of V-9302 treatment, oxidized glutathione (GSSG) and 4-hydroxy-nonenal-glutathione were significantly elevated. Other families of metabolites were elevated that appeared to indicate a compensatory metabolic shift to glucose metabolism, including various nucleotide sugars, aminosugars, and metabolites within the pentose phosphate pathway23,24. Several metabolites impacted by V-9302 treatment were related to membrane biosynthesis and integrity. Numerous phospholipids, phosphatidylethanolamines, ceramides, and cholesterol metabolites were modulated by V-9302 exposure, which are largely consistent with an autophagic fingerprint25-29.
Figure 6. Summary of cancer cell programs modulated by V-9302.
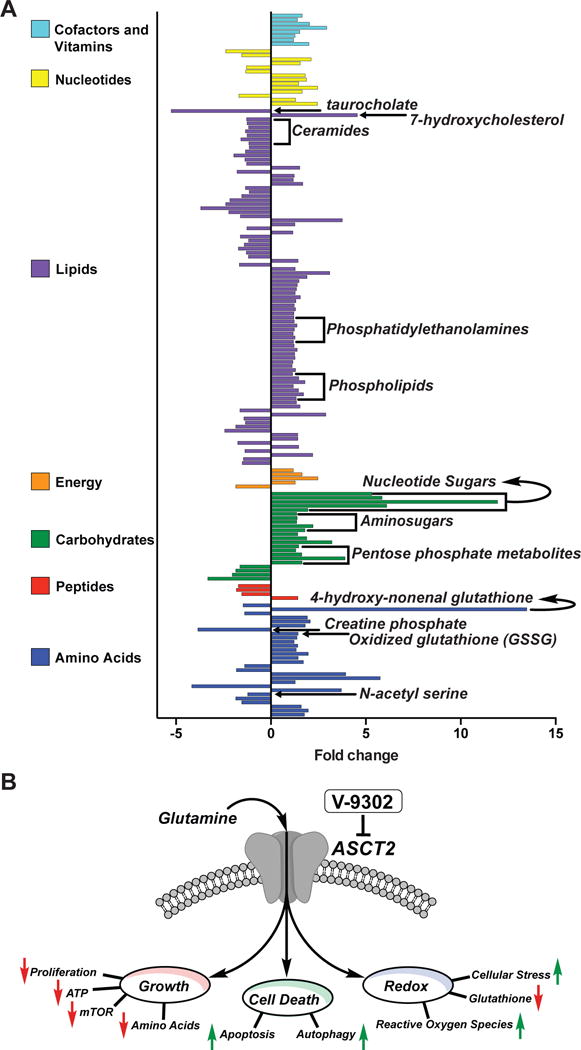
(A) Global metabolomic analysis of HT-29 cell-line xenograft tumor-bearing mice treated with V-9302 or vehicle (n = 5 per condition). Individual statistically significant (p < 0.05 as determined by Welch’s two-sample t test) metabolites spanning seven distinct metabolic families highlighted. Select metabolites involved in glutamine-centric biological processes indicated (see text for details). (B) ASCT2 blockade with V-9302 results in attenuated cancer cell Growth and Proliferation, Cell Death, and Oxidative Stress. Arrows indicate V-9302-induced phenotypes relative to baseline homeostasis. *Additional substrates transported by ASCT2 include Alanine, Serine, Cysteine, Threonine, Leucine, and Asparagine.
Discussion
The diversity of metabolic pathways upon which cancer cells are reliant represent key opportunities for drug development and precision medicine. It is well-recognized that energy production in cancer cells is uniquely dependent upon specific nutrients such as glucose and glutamine. Despite overwhelming evidence illuminating the prominent role of glutamine in cancer cell growth and homeostasis, thus far, few efforts have resulted in therapies capable of effectively antagonizing glutaminolysis.
Mitochondrial glutaminase (GLS1), the enzyme responsible for catalyzing the conversion of glutamine to glutamate, represents a potentially promising target. Glutaminase is elevated in many tumors and tends to be associated with high-grade lesions30. Studies evaluating genetic silencing of GLS1 activity encouraged the development of GLS1 inhibitors 31,32,33. One compound, CB-839 (Calithera Biosciences, San Francisco, CA), is a selective GLS1 inhibitor now being explored clinically in multiple solid and liquid tumors10.
Here, we report the first selective and potent small molecule antagonist of a glutamine transporter, V-9302. We hypothesized that blocking cellular glutamine transport would impart a greater impact on glutamine metabolism in cancer cells compared with targeting downstream enzyme activity (e.g., GLS1), particularly given the extensive biological plasticity leveraged by cancer cells to maintain intracellular glutamate pools. The novel inhibitor V-9302 is distinct from investigational therapies targeting glutamine metabolism as it is designed to abrogate all facets of glutamine signaling and metabolism downstream of ASCT2-mediated import. This differs dramatically from glutaminase inhibitors, which largely overlook the role of glutamine on MAPK signaling11, the activity of GLS234, and the activity of amino acid transporters that require glutamine antiport for their function (e.g., LAT1)18. Specifically antagonizing ASCT2, as shown in this study, results in another distinguishing feature of V-9302, the ability to block ASCT2-mediated transport of additional neutral amino acids beyond glutamine (Fig. 6). Although abrogating cancer cell glutaminolysis represents a central motivation for the development of V-9302, it can not be ruled out that the observed efficacy in vivo may be due, in part, to combinatorial blockade of multiple ASCT2 substrates. While we observed that glutamine withdrawal or combinatorial ASCT2-substrate withdrawal had essentially indistinguishable effects on cell viability in V-9302-sensitive cancer cells, combinatorial depletion of ASCT2 substrates led to enhanced cell death in a portion of the cell lines evaluated. Collectively, these factors may, at least in part explain the difference in efficacy between V-9302 and CB-839 observed in this study. The compound reported here also exhibits unique qualities compared with another reported inhibitor of glutamine uptake, GPNA. Previously reported as an ASCT2 inhibitor, GPNA exhibits poor potency and selectivity in human cells14,35.
We identified several molecular determinants associated with response to V-9302; many of these affect facets of cancer cell growth and proliferation, cell death, and oxidative stress (Fig. 6B). In multiple models, V-9302 exposure resulted in decreased mTOR activity as assessed by pS6 and pAKT (Ser473) levels, which is consistent with diminished amino acid transport and metabolism18. Indeed, we found that mice treated chronically with V-9302 exhibited decreased plasma glutamine levels, which suggests, in part, diminished exchange via LAT1. In support of this, mTOR activity following V-9302 appeared decreased in all models evaluated. In spite of this, we observed elevated pPRAS40 levels in V-9302-treated Colo-205 xenografts, suggesting pro-survival cap-dependent translation36. Although AKT is known to be a major regulator of PRAS40 phosphorylation, data presented here point to AKT-independent PRAS40 regulation, perhaps through PIM1 kinase37. Interestingly, the observed increase in pGSK-3β in Colo-205 xenografts following V-9302 treatment could also be explained by PIM1 activity38, suggesting potential synergy between V-9302 and an inhibitor of PIM1 kinase. Data stemming from global metabolomic analysis was also consistent with impaired amino acid transport in V-9302-treated tumors, with significant impacts on metabolites related to the ASCT2 substrates, glutamine and serine. Given the anaplerotic nature of glutamine, it was not surprising that metabolites related to ATP production were diminished in V-9302-treated tumors. Potentially related to an extra-mitochondrial role of glutamine, we consistently observed that V-9302 exposure led to diminished pERK levels in tumor cells in vitro and in vivo. While V-9302 treatment did not fully abolish pERK levels, it was intriguing to observe that V-9302-treated Colo-205 xenografts exhibited both decreased pERK and decreased BRDU incorporation, suggesting diminished proliferation. Indeed, prior studies have shown that glutamine can activate MAPK signaling independently of EGFR ligand activation39, suggesting that glutamine deprivation as shown here may exert anti-proliferative effects.
Elevated autophagy was another notable characteristic of V-9302-mediated response in vitro and in vivo. Likely a pro-survival response to substrate starvation, combining V-9302 with an autophagy inhibitor further decreased the viability of V-9302-sensitive cells, potentially illuminating a future combination strategy. In addition to autophagy, significantly elevated apoptosis was frequently observed in V-9302-treated tumors. Given that autophagy in this setting appeared to be protective, it is likely that the cell death response to V-9302 was mediated at least in part by apoptosis.
A third feature of response to V-9302 was elevated oxidative stress. Frequently derived from glutamine, glutathione is a key modulator of oxidative stress. We observed that V-9302 impacted the redox state of glutathione in multiple models, leading to correspondingly increased levels of ROS. Additional markers elevated in V-9302-treated Colo-205 xenografts attributable to oxidative stress included elevated cleaved PARP, p38, and p53.
In summary, we report the first pharmacological inhibitor of the glutamine transporter, ASCT2. These results illustrate the promising nature of the lead compound, V-9302, but also that the concept of antagonizing glutamine metabolism at the transporter level represents a potentially viable approach in precision cancer medicine. Pairing patients with glutamine-dependent tumors and this novel class of inhibitors will require validated biomarkers. Since the expression of a transporter alone does not necessarily correlate with its activity, we were not surprised that the response to V-9302 did not correlate with tumor levels of ASCT2. Furthermore, larger studies are needed to evaluate correlates of V-9302 response and oncogene status. However, we did note that tumor cells sensitive to V-9302 were also sensitive to glutamine withdrawal, as well as ASCT2 substrate withdrawal, suggesting that response to V-9302 is likely a function of transporter activity and a tumors reliance upon thereof. Furthermore, given that combining V-9302 with an inhibitor of autophagy resulted in a greater impact on cell viability, it can not be ruled out that sensitivity to V-9302 may be predicated by a cancer cell’s ability to use autophagy as a means to rescue the ASCT2-substrate-deprived phenotype. Importantly, the activity of ASCT2 can be quantitatively assessed using non-invasive PET imaging of glutamine uptake, which may represent a translational biomarker reflective of tumors likely to respond to V-9302 and similar agents.
Methods
General Methods/Reagents and Supplies
All reagents and supplies were obtained from commercial suppliers and in some cases further purified, on an as needed basis. Analytical thin-layer chromatography (TLC) was performed on silica gel plates from Sorbent Technologies with direct visualization via UV light, and/or the use of ninhydrin or potassium permanganate staining. Chromatographic purification of intermediates was performed using silica or C-18 RediSep Rf flash columns on a CombiFlash Rf automated chromatography system. All 1H and 13C NMR spectra were recorded on a Bruker AV-400 (400 mHz and 100 MHz respectively). All 1H and 13C chemical shifts were reported in ppm relative to residual solvent peaks. CB-839 was obtained from Calithera Biosciences. Immortalized cell lines were purchased from commercial vendors (ATCC) authenticated using a commercial vendor (Genetica). Animals were purchased from Harlan and used in accordance with Institutional and Federal guidelines. Human CRC organoids were obtained from patients enrolled in a clinical trial at Vanderbilt University Medical Center in accordance with an IRB approved protocol. For all statistical comparisons, the variance between groups being compared was similar.
Synthesis of V-9302
V-9302 was prepared as previously described13. For this study, V-9302 was purified by reverse phase (C-18) column chromatography (10-90% acetonitrile in water gradient over 60 min) giving a final yield up to 72% over two steps. 1H-NMR (400 MHz, CDCl3) δ (ppm): 7.23 (d, J = 7.36 Hz, 2H), 7.20-7.15 (m, 4H), 7.10-7.06 (m, 6H), 6.89-6.82 (m, 2H), 5.06-4.97 (m, 4H), 3.81 (d, J = 12.92 Hz, 2H), 3.64 (d, J = 12.88 Hz, 2H), 3.00 (dd, J = 7.38 Hz, 4.90 Hz, 1H), 2.75 (s, 2H), 2.29 (s, 6H), 2.01-1.90 (m, 1H), 1.90-1.77 (m, 1H). 13C-NMR (100 MHz, CDCl3) δ (ppm): 172.66 156.91, 138.04, 136.86, 131.82, 129.14, 128.53, 128.42, 128.15, 124.53, 120.91, 112.38, 70.07, 55.75, 52.70, 52.11, 26.51, 21.34. HRMS (TOF, ES+) C34H38N2O4 [M+H]+ calc. mass 539.2904, found 539.2891.
General Procedure for 3H-Amino Acid Uptake Assays
Live-cell amino acid uptake assays using HEK293 cells were carried out in 96-well plates (CulturPlate-96, Perkin Elmer). 96-well plates were coated with poly-D-lysine prior to the assay. Cells were plated at a density of 35,000 cells per well 24 h prior to carrying out the assay. Each set of conditions was replicated at least three times, technically and biologically. Cells were washed three times with 100 µL of assay buffer (containing 137 mM NaCl, 5.1 mM KCl, 0.77 mM KH2PO4, 0.71 mM MgSO4.7H2O, 1.1 mM CaCl2, 10 mM D-glucose, and 10 mM HEPES) to remove cell media. 3H-amino acid (500 nM) in the same buffer was added concomitantly with V-9302 and allowed to incubate for 15 min at 37 ºC. For ASCT2-mediated 3H-glutamine uptake assays, 5 mM of the system-L inhibitor 2-amino-2-norbornanecarboxylic acid (BCH) was added and the assay buffer was adjusted to pH 6.0. For selectivity studies, no BCH was added and the assay was conducted at pH 7.4. Following the incubation period, the 3H-glutamine/inhibitor was removed and the cells were washed three times with assay buffer. The cells were then lysed by the addition of 50 μL of 1 M NaOH. For reading, 150 μL of scintillation fluid (Microscint 40, Perkin Elmer) was added and the plates were counted on a scintillation counter (Topcount, Perkin Elmer). Fifty percent inhibitory concentrations (IC50) were calculated using GraphPad Prism version 6 for Mac OS X, GraphPad Software, San Diego California USA, www.graphpad.com. Error is reported as standard deviation (SD).
Procedure for in silico Docking Studies of V-9302
A model of an inhibitor-bound conformation of hASCT2 was used as a target for ligand docking of V-9302. Two-dimensional structures for all ligands were generated in ChemDraw and imported into Tripos Sybyl for conversion into three-dimensional structures using CONCORD and docking using using RosettaLigand40. Figures for docked complexes were generated and ray-traced using PyMol (The PyMOL Molecular Graphics System, Version 1.5.0.4, Schrodinger, LLC.). In addition, fragment constraints were utilized to encourage placement of the amino acid analog main chain atoms in a location analogous to the positions that were experimentally determined for (2S,3S)-3-[3-[4-(trifluoromethyl)benzoylamino]-benzyloxy]aspartate (TFB-TBOA) in its co-crystal structure within the homologous human excitatory amino acid transporter 1 (hEAAT1, PDB: 5MJU) transporter protein16. Seeding the docking calculations in this way yielded better-scoring docking poses using the empirically derived scoring function, suggesting that this feature of the binding interaction may be conserved between these two systems.
For comparative studies of ASCT2 and LAT1, predictive structures used for docking were generated using homology modeling. To determine suitable template structures, the primary sequence of ASCT2 was extracted from gene SLC1A5 (UniProtKB: Q15758). Using the PDB Search tool within MOE (Molecular Operating Environment, Version 2014.09, Chemical Computing Group), ASCT2 alignments were generated with the crystal structure of hEAAT1, (PDB: 5MJU). The primary sequence of LAT1 used to determine predictive structures was extracted from gene SLC7A5 (UniProtKB: Q01650). LAT1 homology models structures were generated from crystal structures of the Arg+ bound conformation of Escherichia coli AdiC and the ApcT transporter derived from Methanocaldococcus jannaschii (PDB IDs: 3L1L and 3GIA, respectively.) Using the templates and respective sequence alignments, MOE’s homology model application generated initial structures with a well-conserved binding pocket. All resulting ASCT2 and LAT1 structures underwent energy minimization using Amber12 force field potentials and protonation. In order to mimic the lipid bilayer environments of ASCT2 and LAT1, homology models were embedded and relaxed into the membrane using the RosettaMP framework. Upon further refinement, top scoring models of both ASCT2 and LAT1 were used for docking simulations of V-9302 and additional ligands according to the RosettaLigand protocol. Ligand rotational conformer libraries were generated using energy minimization in MMFF94x force field potentials then screened using the MOE conformer search tool. The binding site was identified using prior knowledge of homology binding sites and Surflex-Dock results. Each simulation consisted of 500 iterations while scoring the protein-ligand interface energies. Final models were sorted based on interface_delta_X scores while evidence regarding steric hindrance penalties was extracted based on if_X_fa_rep energies.
In silico Alanine Scan
Docking studies were performed to place V-9302 into the amino-acid binding site of an ASCT2 homology model. The highest-scoring poses were found when the constraints were enabled, to favor poses that anchored the amino acid moiety of the ligands to a similar binding orientation as TFB-TBOA in the structure of the homologous protein hEAAT1. In-silico mutagenesis experiments were conducted by individually changing side chains to alanine, without otherwise changing the conformation of the protein or ligand in ROSETTA. RosettaLigand was then used to re-score the same V-9302 docking pose with each of these Ala mutants. The docking score for each mutant was then compared with the score for the WT model to assess the WT sidechain contribution to the overall score in this binding pose.
Generation of HEK293 cells with tetracycline-inducible ASCT2 expression
T-REx™-293 cells (Invitrogen R71007) were transfected with the plasmid pCDNA5-TO-h-SLC1A5 (Invitrogen V1033-20). The cloning sites consisted of Not1 and Xba; insert OriGene # SC116600. Stably transfected clones were selected via hygromycin (150 µg/ml).
Drug Affinity Responsive Target Stability (DARTS) Assay
DARTS was carried out as previously described15 using T-REx-293 cells with tetracycline-inducible expression of ASCT2 or lysate from 115 mg of homogenized mouse brain for ASCT1. Lysates were exposed to V-9302 at varying concentrations for 35-45 min at room temperature with shaking. Lysates were then incubated at room temperature with the protease Thermolysin (1:100 and 1:200 total enzyme to total substrate) for 30 min. ASCT2 was measured by immunoblotting (ASCT2 antibody: Millipore ABN73; ASCT1 antibody: Cell Signaling 8442).
shRNA
HCC1806 cells were transfected with a lentiviral vector (pLKO.1) containing control shRNA (Sigma SHC002V) or shRNA against ASCT2 (Sigma SHCLNV-NM_005628): 5′-CCGGCTGGATTATGAGGAATGGATACTCGAGTATCCATTCCTCATAATCCAGTTTTTG-3′. ASCT2 expression was measured by immunoblotting (ASCT2 antibody: Millipore ABN73) at 72 h post transduction and after puromycin selection.
Cell viability screens
Viability was evaluated using a commercially available chemiluminescent reagents (CellTiter-Glo, Promega Corp. G7572; MultiTox Glo, Promega Corp. G9270) in 96-well plate format according to the manufacturers protocol. Cells were exposed to either vehicle, V-9302, CB-839, V-9302 + chloroquine (CLQ), or CB-839 + CLQ and incubated for a period of 48 h. Subsequently, CellTiter-Glo reagent was added and the plates were read using a plate reader (BioTek Synergy 4) with standard settings. Each set of conditions was replicated at least three times, technically and biologically. Error is reported as standard deviation (SD). The sulforhodamine B assay was run analogously to the above assays as previously described19.
Measurement of glutathione and reactive oxygen species (ROS)
Glutathione levels were measured using a commercially available kit (Cayman Chemical 703002) according to the manufacturers protocol. Concurrently ROS was measured in cells using CM-H2DCFDA (Life Technologies C6827) coupled with flow cytometry in accordance with the manufacturers protocol. The assay was replicated replicated at least three times, technically and biologically. Significance was calculated using a t-test in Graphpad Prism. Error is reported as standard deviation (SD).
Measurement of pERK
Detection of activated ERK in cell lysates was enabled by the AlphaScreen SureFire ERK assay (Perkin Elmer) according to the manufacturers protocol. Cells were plated in 96-well plates for 24 hours prior to the assay. Cells were treated with either vehicle or indicated concentrations of V-9302 or CB-839 for 48 hours.
Measurement of Autophagic Flux
Autophagic flux was measure using the CYTO-ID autophagy detection kit (Enzo Life Sciences ENZ-51031). HCC1806 and HT29 cells were seeded in 96 well plates the day before the experiment. After overnight incubation, cells were treated with V-9302, CB-839, 500 nM rapamycin as a positive control, or the combinations thereof with 10 uM chloroquine for 18 hours. Following treatment, cells were gently washed with assay buffer followed by addition of the dual color detection solution and incubation at 37 oC for 30 min. The plate was analyzed on a fluorescence microplane reader (BioTek Synergy 4).
Immunoassays
For immunoreactivity studies, tissue samples were diluted to 100 mg/mL in lysis buffer (#7018s, Cell Signaling Technology) and subsequently homogenized, sonicated, and spun at 3.5K RPM for 1 min. Lysate samples were then screened against an array of target-specific capture antibodies using PathScan Intracellular Signaling Array Kits (#7323, Cell Signaling Technology) in accordance with the manufacturer’s instructions and developed using HyBlot CL autoradiography film (#e3012, Denville Scientific Inc.). Processed films were digitized using an Epson Perfection V600 Photo scanner and the relative pixel intensities for each blot quantified using the image processing software ImageJ. Complementary western blot studies were performed by loading 20-40 µg of protein into 7.5-12% SDS PAGE gels, transferred to PVDF membranes (PerkinElmer), and resolved by electrophoresis. Membranes were blocked overnight at 4°C in trisbuffered saline 0.1% Tween-20 (TBST) containing 5% w/v nonfat dry milk powder and subsequently incubated with antibodies to p-ERK 1/2 Thr202/Tyr204 (Cell Signaling, 4370), pS6 (Cell Signaling, #4858) LC3B, (anti LC3B, Cell signaling 2775), or b-tubulin (Novus Biologicals, NB600-936); Membrane chemiluminescence was imaged on a Xenogen IVIS 200 system.
Immunofluorescence
HCC1806 cells were treated V-9302 (25 µM aqueous, 1% DMSO) for 48 h. Following treatment, cells were fixed with 70% methanol for 5-10 min. LC3B was visualized with 1:100 primary antibody (anti LC3B, Cell signaling 2775) at 37 ºC for 45 min followed by application of 1:600 secondary antibody (Rhodamine Red, Invitrogen R6394) at 37 ºC for 30 min and DAPI for 4 min. Images were acquired with a fluorescence microscope at visualized at 40× magnification.
In vivo BrdU incorporation assay
Four hours after the final treatment the mice were injected with bromodeoxyuridine (BrdU) labeling reagent (Zymed Laboratories, South San Francisco, CA). Six hours after injection mice were killed. The tumors were harvested, fixed in paraffin, and sectioned. Slides were stained with anti-BrdU primary antibody (mouse IgG) followed by rhodamine red-labeled goat anti-mouse secondary antibody (Invitrogen Molecular Probes, Carlsbad, CA). Sections were counterstained with the nucleophilic dye 4′,6-diamidino-2-phenylindole (DAPI). Photographs were obtained, scanned into Photoshop software, and quantified. The mean and standard error of BrdU incorporating cells were determined (n = 3). To quantify endothelial cell proliferation in vivo, high-power photographs were taken. The endothelial cells surrounding blood vessels were confirmed by two separate observers and quantified for each treatment condition as stated above (n = 6).
Immunohistochemistry (IHC)
For IHC, animals were sacrificed and tumor tissue samples were collected within 4 h of the final V-9302 dose, fixed in 10% formalin for 24 h then stored in 70% EtOH/PBS. Tissues were sectioned (5 µm thickness) and stained for pS6 (Cell Signaling, #4858) and caspase 3 (Cell Signaling #9661). Tissue slides were imaged at 20× magnification.
Fluorescence Redox Ratio Imaging
HCC 1806 cells were plated on 35-mm glass-bottom petri dishes for imaging (MatTek Corp). Fluorescence intensity and lifetime images were acquired using a custom-built multiphoton fluorescence lifetime system (Bruker), with a 40x oil-immersion objective (1.3 NA) and an inverted microscope (TiE, Nikon). A titanium:sapphire laser (Chameleon Ultra II, Coherent) was tuned to 750 nm for two-photon excitation of NAD(P)H and tuned to 890 nm for two-photon excitation of FAD. A 440/80nm bandpass filter was used to collect NAD(P)H fluorescence emission, and a 550/100nm was used to collect FAD emission. A pixel dwell time of 4.8 μs was used to collect images that were 256×256 pixels, with a total integration time of 60 seconds. A GaAsP PMT (H7422P-40, Hamamatsu) detected emitted photons. The field of view acquired was 270 μm × 270 μm, and 6 fields of view were acquired per treatment group. Time-correlated single photon counting electronics (SPC-150, Becker and Hickl) were used to acquire fluorescence decay curves. The second harmonic generated signal from urea crystals at 900 nm excitation was used to measure the instrument response function, which was found to have a full width at half maximum of 220 ps. Fluorescence lifetime validation was performed by imaging a fluorescent bead (Polysciences Inc) and confirming that the measured lifetime (2.1 ns) agreed with previously published values22. The assay was replicated replicated at least three times, technically and biologically.
A histogram of photon counts per temporal bin (decay curve) was constructed for each pixel in the image and then deconvolved with the instrument response function. Decay curves were then fit to a two-component exponential decay to account for the distinct free and protein-bound lifetimes of NAD(P)H and FAD, using SPCImage software (Becker & Hickl). The decay fit is given by Equation 1, where I(t) represents the fluorescence intensity measured at time t after the laser pulse, α1 and α2 represent the fractional contributions of the short and long lifetime components to the overall intensity, respectively, □1 and □2 represent the fluorescence lifetimes of the short and long lifetime components, respectively, and C represents a constant level of background light.
| Equation 1 |
The mean lifetime (□m) of NAD(P)H or FAD represents the weighted average of the short and long lifetime components (Equation 2).
| Equation 2 |
An automated cell segmentation routine was written using CellProfiler to identify individual cell cytoplasms and extract average fluorescence intensity and fluorescence lifetime values for each cell in the field of view. Intensity values for each pixel were calculated by integrating the decay curve for each pixel. Optical redox ratio values were calculated for each cell by dividing the average intensity of NAD(P)H by the average intensity of FAD. Optical redox ratio values were normalized to vehicle. For each imaging endpoint, values for all cells imaged in each treatment group were averaged together to generate mean and standard error values. An unpaired t-test with Welch’s correction was performed for all comparisons of imaging values.
Organoid culture and viability assay
Human CRC-derived organoids were prepared as reported method with modification41. Briefly, specimens from freshly resected tumors were minced and digested with 2 mg/ml type 2 collagenase (Worthington, NJ, USA). Samples were passed through 40 µm filters (Greiner Bio One, NC, USA) and epithelial cells trapped on the filters were embed in Matrigel (Corning, MA, USA) and cultured with advanced DMEM/F12 supplemented with N2 and B27 supplements (Thermo Fischer, MA, USA), 50 ng/ml rhEGF (R&D systems, MN, USA) and 1% antibiotic-antimycotic (Corning). For viability assay, organoids were dissociated by TrypLE express (Thermo Fischer) and suspended in Matrigel. 5 µl of cell suspension in Matrigel drops were placed into non-treated 96 well plates (Corning) and overlaid with experimental medium, which consisted of either V-9302, CB-839, or vehicle at indicated concentration in advanced DMEM/F12 supplemented with N2 and B27 supplements, 1% antibiotic-antimycotic and 4 mM L-glutamine (GE Healthcare, OH, USA). After 4 days of culture, images of the organoids in Matrigel were captured and the number of viable cells were quantified with CellTiter Aqueous One Cell Proliferation Assay kit (Promega, WI, USA) and a Synergy 4 plate reader (BioTek, VT, USA). The assay was replicated replicated at least three times, technically and biologically. Significance was calculated using a t-test in Graphpad Prism. Error is reported as standard deviation (SD).
V-9302 plasma stability assay
Whole blood samples (n = 5 mice) were assayed for V-9302 levels with time by Sano Informed Prescribing, Inc. (Franklin, TN). Liquid chromatography – tandem mass spectroscopy (LC-MS/MS) analyses were performed via reverse phase chromatography using a Shimadzu Nexera X2 UPLC (Columbia, MD) coupled with a QTrap® 5500 (Sciex, Framinghman, MA, USA). Standard curve and quality control samples were made by spiking V-9302 in fresh whole blood and then applying to 10 μL Mitra® Microsamplers (Neoteryx, LLC, Torrance, CA). Blank samples were made using fresh whole blood applied to Mitra® Microsamplers and allowed to dry for at least 24 h. All data were collected using Sciex Analyst 1.6.2 software and analyzed with MultiQuant 3.0 software. Error is reported as standard deviation (SD).
Plasma metabolite analysis
To quantify plasma glutamine and glucose, whole blood was collected from healthy mice (n = 10) chronically exposed to V-9302 (75 mg/kg, daily) or vehicle with sacrifice 4 h after the final treatment. Following centrifugation, plasma was collected and 50 µL was added to a 96-well plate in triplicate. Plasma samples were diluted with 50 µL of assay buffer (YSI 2357) and glucose and glutamine were quantified directly using a YSI 2950D Biochemistry Analyzer (YSI Inc). Significance was calculated using a t-test in Graphpad Prism. Error is reported as standard deviation (SD).
CD8+cell studies
CD8+ cells were isolated from the spleens of 8-12 week old C57BL6 mice on standard chow from Jackson Labs maintained under IACUC approved protocols. CD8+ cells were stained using the proliferative dye Cell Trace Violet (LifeTech) before stimulation as per manufacturer’s protocol. Cells were stimulated on 5 ug/mL anti-CD3/CD28-coated plates in media containing IL-2 (‘activated’, 10 ng/mL), or in tissue-culture treated plates in media containing IL-7 (‘naive’, 1 ng/mL) for up to 7 days. Cells were removed at each day described for viability, cell counts, proliferation, and surface markers of activation. Cell surface markers used were CD62L-FITC and APC, CD44-PECy5 and CD25-PE. All data were acquired in triplicate on a MacsQuant Analyzer (Miltenyi Biotec) and analyzed using FlowJo V10 (TreeStar software).
Synthesis of 4-[18F]-fluoroglutamine
4-[18F]fluoroglutamine and the requisite tosylate precursor were produced as previously reported5.
PET imaging and analysis
Animal handling methods for PET imaging studies were conducted as reported5,42. Prior to imaging, animals were allowed to acclimate to facility environment for at least 1 h in a warmed chamber at 31.5 °C. Animals were administered 10.4–11.8 MBq 4-[18F]fluoroglutamine via intravenous injection and imaged using a Concorde Microsystems Focus 220 microPET scanner (Siemens Preclinical Solutions). During imaging, animals were maintained under 2% isoflurane anesthesia in oxygen at 2 L/min and kept warm for the duration of the PET scan. PET images in xenograft-bearing mice were acquired as 60-minute dynamic data sets. Imaging was initiated three hours post-treatment following vehicle or V-9302 (75 mg/kg) administration. PET data were reconstructed using a three-dimensional (3D) ordered subset expectation maximization/maximum a posteriori (OSEM3D/MAP) algorithm. The resulting three-dimensional reconstructions had an x-y voxel size of 0.474 mm and inter-slice distance of 0.796 mm. ASIPro software (Siemens Preclinical Solutions) was used to manually draw 3D regions of interest (ROIs) surrounding the entire tumor volume. 4-[18F]fluoroglutamine uptake was quantified as the percentage of the injected dose per gram of tissue (%ID/g). Significance was calculated using a t-test in Graphpad Prism. Error is reported as standard deviation (SD).
In vivo tumor studies
For in vivo studies, cell-line xenograft tumors were propagated in 6-week old, female athymic nude mice from immortalized cell lines. For HCC-1806 (10×106 cells), HCT-116 (5×10⁶), and HT29 (10×106) cells were injected. Palpable tumors were typically visible within 2-3 weeks. For imaging studies (HCC-1806), tumors were propagated to approximately 500 mm3. For treatment studies (HCT-116, HT29) tumors were propagated to approximately 200 mm3 prior to therapy and were randomly assigned into treated and untreated cohorts. For generating the PDX, primary tumor tissue was obtained form a patient at Vanderbilt University Medical Center under an IRB approved protocol. The tumor tissue was genotyped within the VANTAGE core facility. Xenograft was generated as previously described 41. Briefly, tumor tissues were sectioned into approximately 125 cubic millimeter pieces then implanted subcutaneously without further manipulation. PDX tumors were propagated to the F3 generation for V-9302 treatment studies. For treatment, V-9302 was reconstituted in a vehicle of phosphate buffered saline supplemented with 2% DMSO and administered intraperitoneally. Tumor volumes were measured manually using calipers every third day and quantified using the formula V = W • L • (H/2).
Metabolomics
HT-29 (n = 10) tumor samples were harvested and snap frozen within 4 h of the final dose of V-9302 or vehicle. Metabolomic data acquisition was outsourced to Metabolon, Inc. Samples were prepared using the automated MicroLab STAR® system from Hamilton Company. To remove protein, dissociate small molecules bound to protein or trapped in the precipitated protein matrix, and to recover chemically diverse metabolites, proteins were precipitated with methanol under vigorous shaking for 2 min (Glen Mills GenoGrinder 2000) followed by centrifugation. The resulting extract was divided into five fractions: two for analysis by two separate reverse phase (RP)/UPLC-MS/MS methods with positive ion mode electrospray ionization (ESI), one for analysis by RP/UPLC-MS/MS with negative ion mode ESI, one for analysis by HILIC/UPLC-MS/MS with negative ion mode ESI, and one sample was reserved for backup. Samples were placed briefly on a TurboVap® (Zymark) to remove the organic solvent. All methods utilized a Waters ACQUITY ultra-performance liquid chromatography (UPLC) and a Thermo Scientific Q-Exactive high resolution/accurate mass spectrometer interfaced with a heated electrospray ionization (HESI-II) source and Orbitrap mass analyzer operated at 35,000 mass resolution. The sample extract was dried then reconstituted in solvents compatible to each of the four methods. Each reconstitution solvent contained a series of standards at fixed concentrations to ensure injection and chromatographic consistency. One aliquot was analyzed using acidic positive ion conditions, chromatographically optimized for more hydrophilic compounds. In this method, the extract was gradient eluted from a C18 column (Waters UPLC BEH C18-2.1×100 mm, 1.7 µm) using water and methanol, containing 0.05% perfluoropentanoic acid (PFPA) and 0.1% formic acid (FA). Another aliquot was also analyzed using acidic positive ion conditions, however it was chromatographically optimized for more hydrophobic compounds. In this method, the extract was gradient eluted from the same afore mentioned C18 column using methanol, acetonitrile, water, 0.05% PFPA and 0.01% FA and was operated at an overall higher organic content. Another aliquot was analyzed using basic negative ion optimized conditions using a separate dedicated C18 column. The basic extracts were gradient eluted from the column using methanol and water, however with 6.5 mM Ammonium Bicarbonate at pH 8. The fourth aliquot was analyzed via negative ionization following elution from a HILIC column (Waters UPLC BEH Amide 2.1×150 mm, 1.7 µm) using a gradient consisting of water and acetonitrile with 10 mM Ammonium Formate, pH 10.8. Raw data was extracted, peak-identified and QC processed using Metabolon’s hardware and software. Compounds were identified by comparison to library entries of purified standards or recurrent unknown entities. Metabolon maintains a library based on authenticated standards that contains the retention time/index (RI), mass to charge ratio (m/z), and chromatographic data (including MS/MS spectral data) on all molecules present in the library. Furthermore, biochemical identifications are based on three criteria: retention index within a narrow RI window of the proposed identification, accurate mass match to the library +/- 10 ppm, and the MS/MS forward and reverse scores between the experimental data and authentic standards. The MS/MS scores are based on a comparison of the ions present in the experimental spectrum to the ions present in the library spectrum. Peaks were quantified using area-under-the-curve. For studies spanning multiple days, a data normalization step was performed to correct variation resulting from instrument inter-day tuning differences. For many studies, two types of statistical analysis are usually performed: significance tests and classification analysis. Standard statistical analyses are performed in ArrayStudio on log transformed data. For those analyses not standard in ArrayStudio, the programs R (http://cran.r-project.org/) or JMP are used.
Statistics and reproducibility
Sample sizes and statistical tests for each experiment are denoted in the figure legends or respective methods section. All analyses and graphs were generated with GraphPad Prism 6. A p value of < 0.05 was considered significant; exact p values can be found in the Figures.
Data availability
All data supporting the findings of this study are available from the corresponding author on request. A life Sciences Reporting Summary is available.
Extended Data
Extended Data Fig. 1. Amino acid transporters and substrates used for selectivity screening.
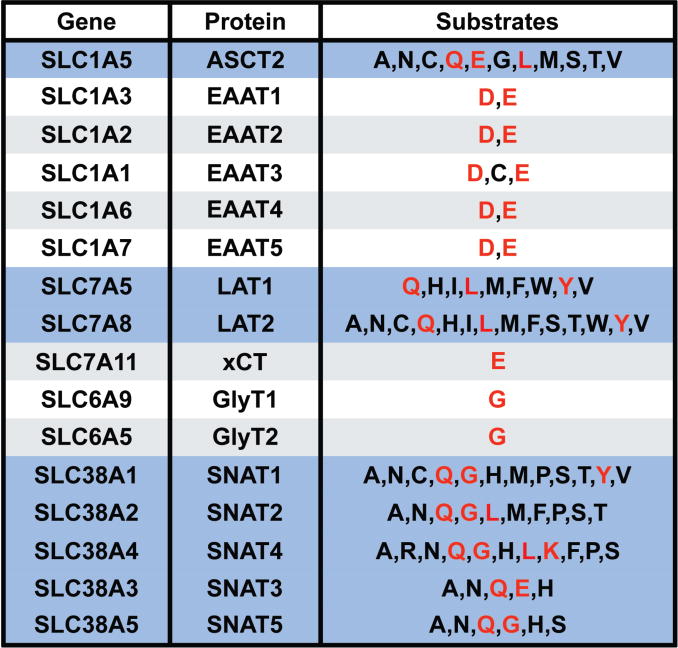
(A) Common transporters and amino acid substrates shown. Amino acids designated by one-letter codes. Transporters responsible for glutamine uptake shown in blue shading. Amino acid substrates utilized to evaluate the selectivity of V-9302 shown in red.
Extended Data Fig. 2. Drug Affinity Responsive Target Stability (DARTS) assay comparing the stabilization of ASCT2 and ASCT1 by V-9302.
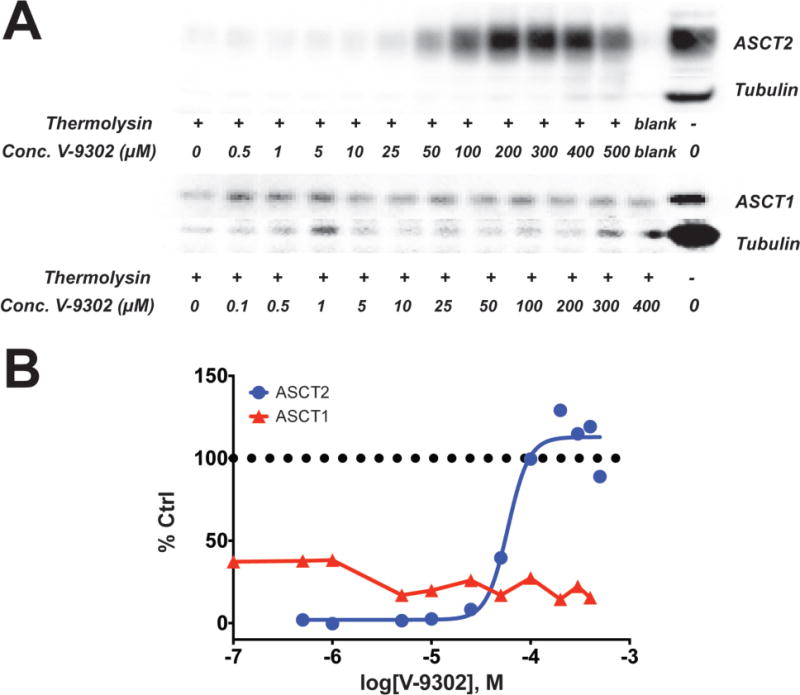
(A) Immunoblots for ASCT2 and ASCT2 illustrating concentration dependent stabilization of ASCT2 in the presence of the protease thermolysin by V-9302. ASCT1 is not similarly protected by V-9302. Uncroppped gel images are provided in Supplementrary Fig. 3. (B) Immunoblot densitometry analysis DARTS immunoblots for ASCT2 and ASCT1. Percent control (Ctrl) relative to ASCT2 or ASCT1 immunoreactivity, respectively, without thermolysin.
Extended Data Fig. 3. Summary and annotation of human cancer cell lines utilized in CellTiter Glo viability screen of V-9302 activity (graph shown in Figure 3).
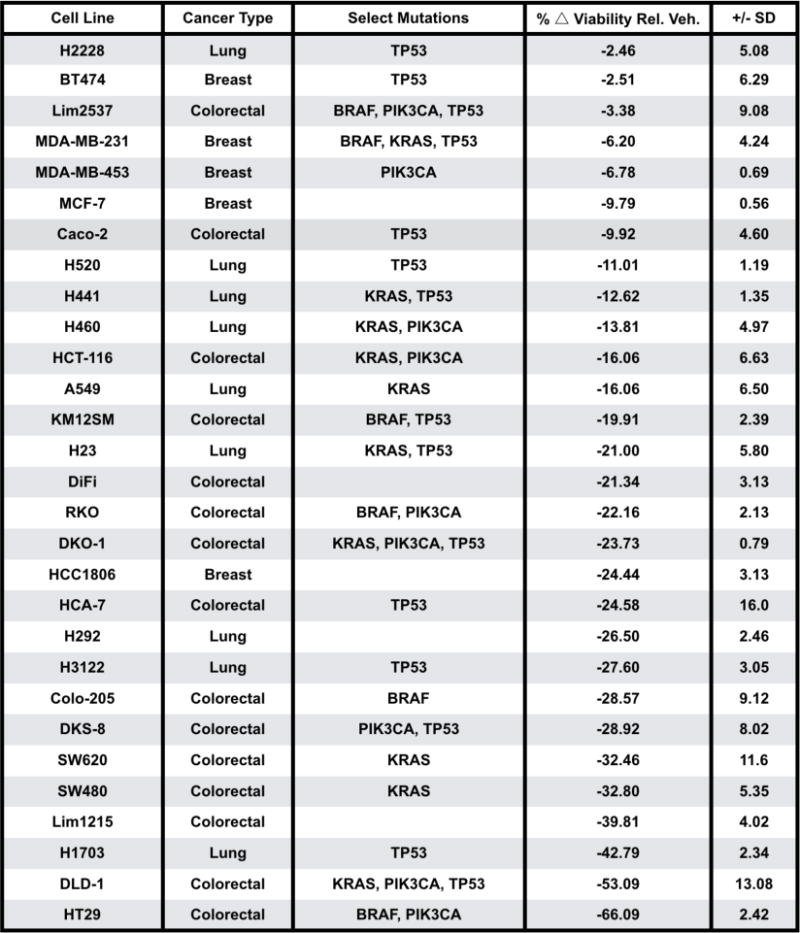
Percent change in viability relative to vehicle control following 25 µM V-9302 exposure for 48 h (% △viability relative to vehicle); standard deviation (SD).
Extended Data Fig. 4. Follow-up viabiity screening of V-9302 activity in human CRC cells.
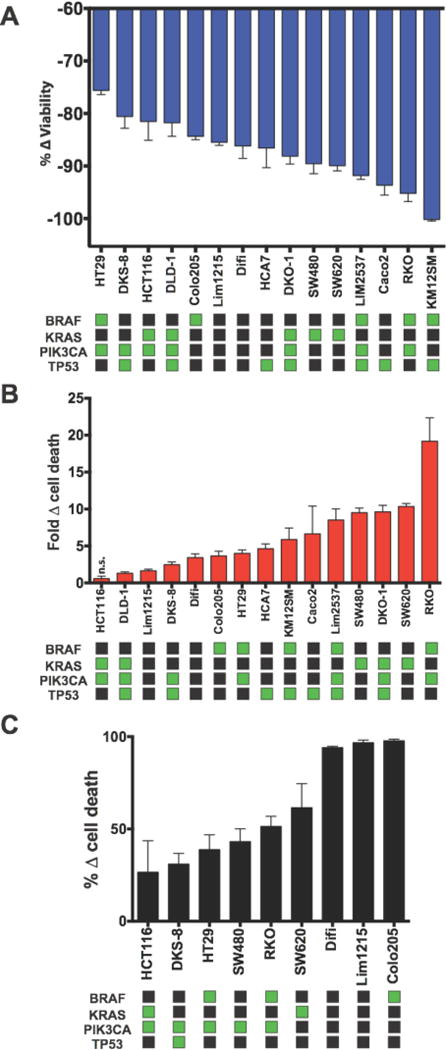
In vitro multiplex assay (MultiTox Glo) of 15 colorectal cancer cell lines exposed to V-9302 (25 µM, 48 h). V-9302-dependent changes in the number of live cells (A, blue) and dead cells (B, red) relative to vehicle control; n = 3 independent experiments. (C) V-9302 Sulforhodamine B assay evaluating V-9302-dependent cell death in 9 colorectal cancer cell lines in vitro. Data for each assay relative to vehicle control; n = 3 independent experiments. Select mutational status (green squares) shown. All data is p < 0.05 as determined by Student’s t test relative to vehicle control unless otherwise indicated. n.s. = not statistically significant. Error bars represent ± std. dev.
Extended Data Fig. 5. Lack of correlation between ASCT2 protein levels and sensitivity to V-9302.

(A) Membranous and (B) total ASCT2 levels evaluated by western blotting in thirteen human CRC cell lines. Uncropped gel images are provided in Supplementary Fig. 4. Neither membranous (C) nor total (D) ASCT2 levels quantified by densitometry correlated with V-9302 sensitivity. Immunoblots normalized to total protein gel loading control.
Extended Data Fig. 6. Effect of glutamine withdrawal (A/B) or combinatorial ASCT2 substrate withdrawal (C/D) on cellular viability and cell death in V-9302 sensitive human CRC cell lines.
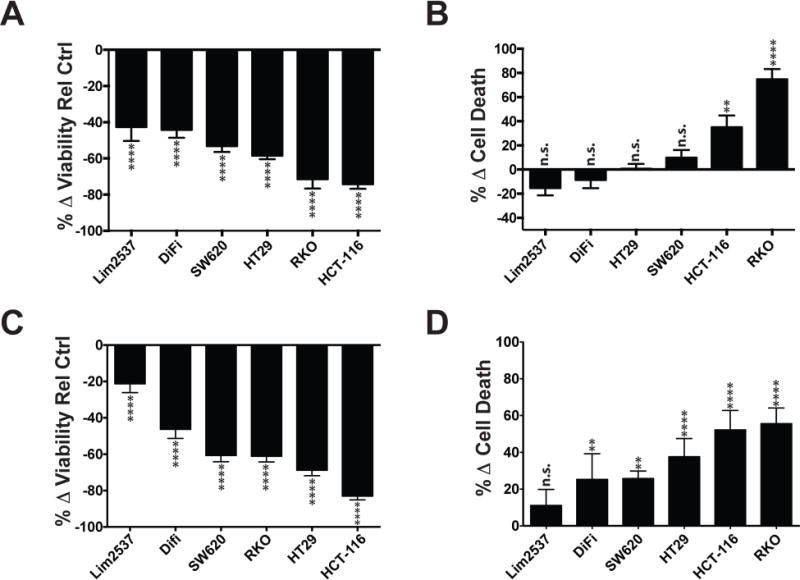
Cell lines propagated for 48 hrs in either glutamine-depleted or ASCT2-substrate-depleted media (without alanine, serine, cysteine, threonine, glutamine, asparagine, methionine, glycine, leucine, valine, glutamate); Multi-Tox Glo assay. (A) Cell viability and (B) cell death with glutamine withdrawal (C) Cell viability and (D) cell death with ASCT2-substrate withdrawal. Percent change relative to standard media control. n.s. = not statistically significant; ** = p < 0.01; **** = p < 0.0001 as determined by Student’s t test. Error bars represent ± std. dev.
Extended Data Fig. 7. Viability and activation of mouse T-cells following V-9302 exposure for 96 hrs.
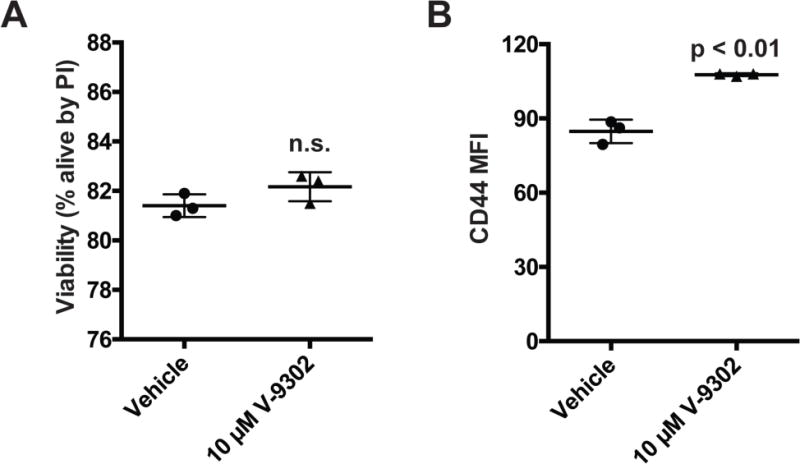
(A) Viability analyzed by propidium iodide flow cytometry. (B) Activation of T-cells as measured by flow cytometry for CD44 expressions; mean fluorescence intensity (MFI). n = 3 independent experiments. P values determined by Student’s t test
Extended Data Fig. 8. Effects of V-9302 exposure (25 µM, 48 h) on pS6 and pERK in HT29 cells.

Uncropped gel images are provided in Supplementrary Fig. 5.
Extended Data Fig. 9. Validation of V-9302-dependent decrease in pERK levels in HCC1806 and HT29 cells; SureFire biochemical assay.
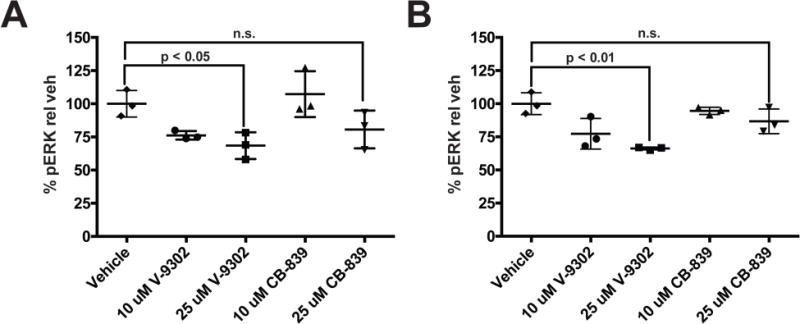
Comparison of V-9302 and glutaminase inhibitor, CB839. (A) HCC1806 and (B) HT-29 cells. Drug concentrations shown; treatment duration 48 h; n = 3 independent experiments. P values determined by Student’s t test. n.s. = not statistically significant. Error bars represent ± std. dev.
Extended Data Fig. 10. Evaluation of oxidized glutathione (GSSG) levels in HT-29 cells with V-9302 or CB-839 exposure. (A) Oxidized glutathione (GSSG) and (B) reactive oxygen species (ROS).

Drug concentrations shown, cells treated for 48 hrs; n = 3 independent experiments. P values determined by Student’s t test. Error bars represent ± std. dev.
Extended Data Fig. 11. Analysis of autophagic flux with V-9302 exposure.
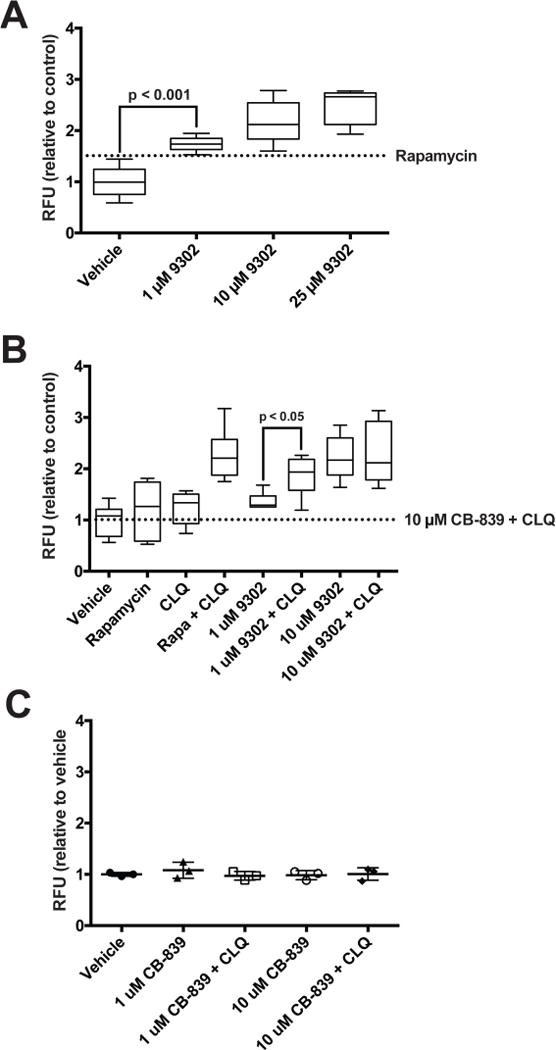
(A) Autophagic vesicles in HCC1806 cells with exposure to increasing concentrations of V-9302; 8 h treatment duration, concentrations shown; n = 3 independent experiments. P values determined by Student’s t test. Vesicles induced by rapamycin (dotted line, 500 nM, positive control). Combination of lysosomal inhibitor chloroquine (10 µM) and V-9302. (B) or CB-839 (C) in HT29 cells. CLQ = chloroquine. n = 3 independent experiments. P values determined by Student’s t test. For box plots, center line is plotted at the median; the box spans from the first quartile to the third quartile; whiskers represent min to max. Error bars represent ± std. dev.
Extended Data Fig. 12. Additive effect on cellular viability between V-9302 and chloroquine but not CB-839 and chloroquine.
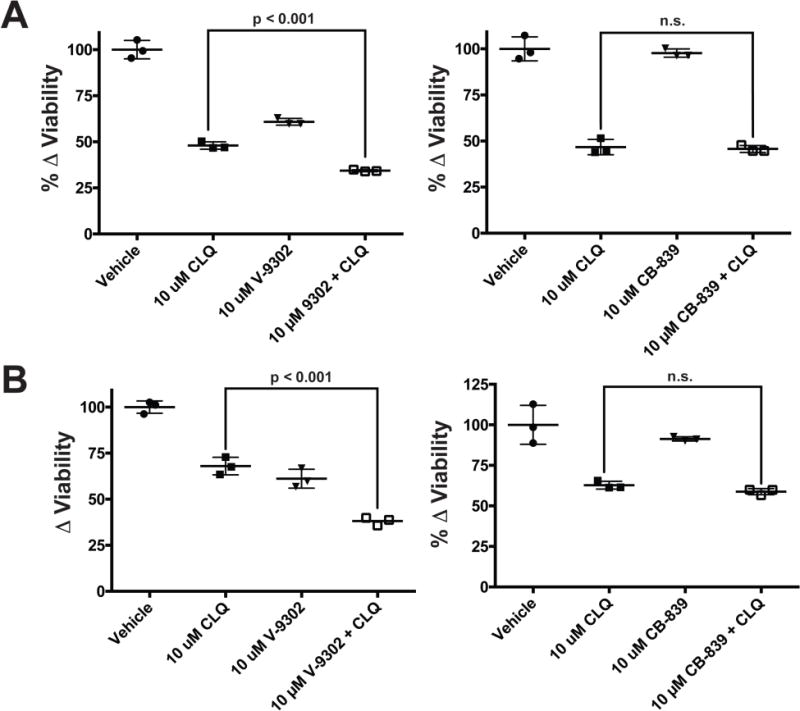
HT29 cells (A) and HCT-116 cells (B) exposed to V-9302 (concentrations shown), CB-839 (concentrations shown), chloroquine (CLQ, 10 µM), and the combinations thereof for 48 h; n = 3 independent experiments. P values determined by Student’s t test. n.s. = not statistically significant. Error bars represent ± std. dev.
Extended Data Fig. 13. Fluorescence lifetimes of NAD(P)H and FAD measured by optical spectroscopy were reduced with exposure to V-9302 (10 µM) in HCC1806 cells.
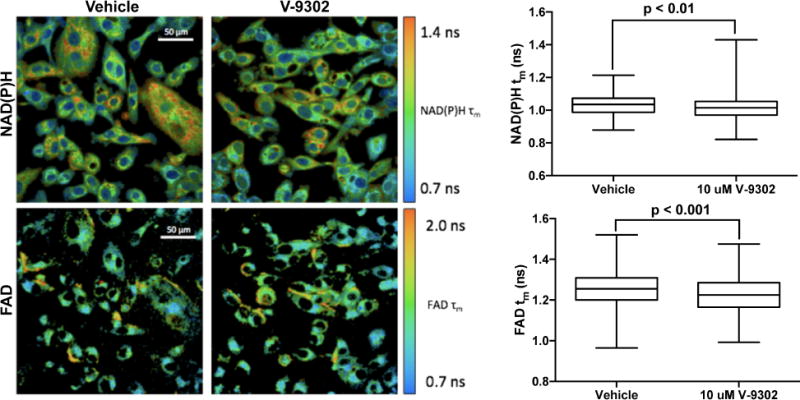
Drug exposure 48 h, magnification 40×; n = 3 independent experiments. P values determined by Student’s t test. For box plots, center line is plotted at the median; the box spans from the first quartile to the third quartile; whiskers represent min to max Error bars represent ± std. dev.
Extended Data Fig. 14. Viability of human CRC organoids A 007 (BRAFV600E) (A) and A 008 (KRASG12V;p53R248Q;PTENL140Y) (B) with exposure to CB-839 (35 µM, 96 h).
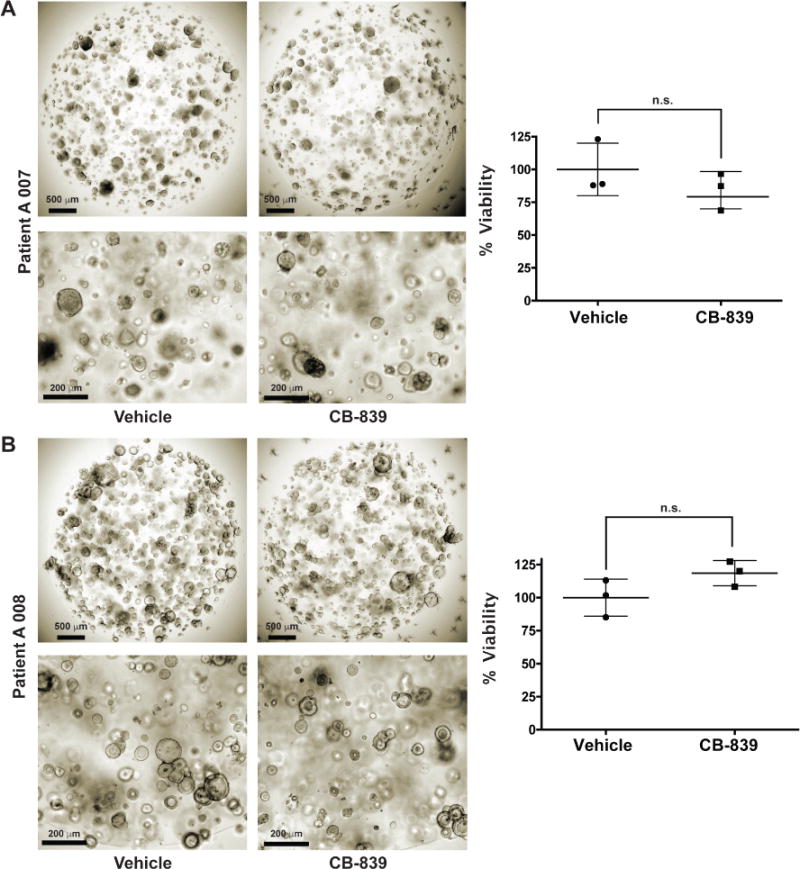
n = 3 independent experiments. P values determined by Student’s t test. n.s. = not statistically significant. Error bars represent ± std. dev.
Extended Data Fig. 15. Longitudinal assay of V-9302 concentration in whole blood following a single dose (75 mg/kg) in healthy C57BL/6 mice (n = 5 replicates at each time point).
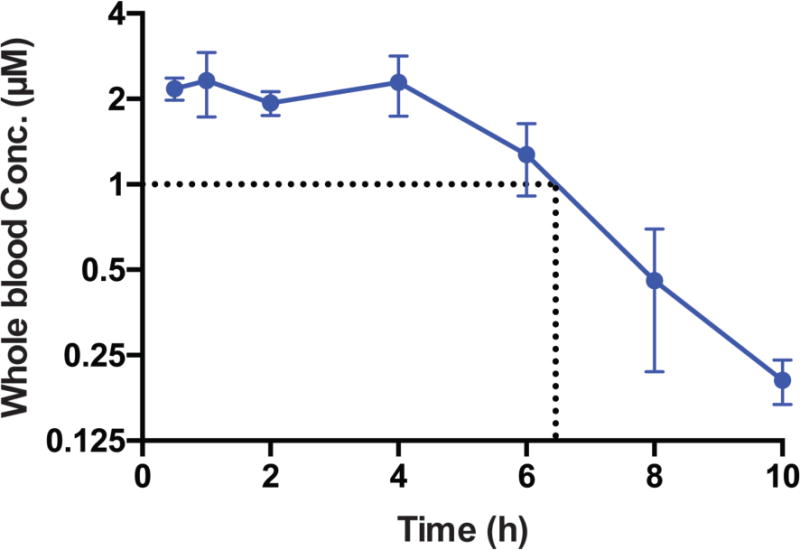
Error bars represent ± std. dev.
Extended Data Fig. 16. Evaluation of acute (A/B) and chronic (C/D) V-9302 exposure on plasma glucose (A/C) and glutamine (B/D) in mice.
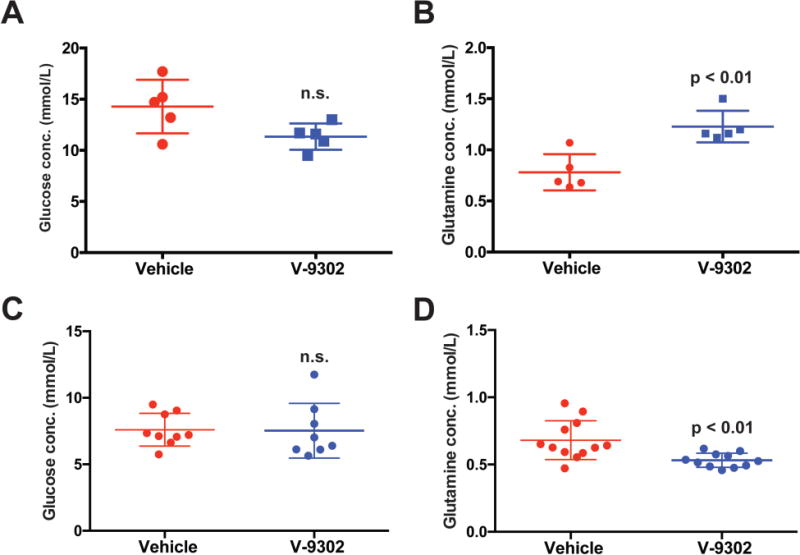
Acute exposure consisted of a single dose (75 mg/kg) with metabolites assayed 4 h post-treatment. Chronic exposure analysis at the conclusion of 21 day treatment course (75 mg/kg daily), with metabolites assayed 4 h following the final V-9302 dose; n > 5 independent experiments. n.s. = not statistically significant. P values determined by Student’s t test.
Extended Data Fig. 17. Evaluation of V-9302 in vivo in HCC1806 cell line xenograft-bearing mice.
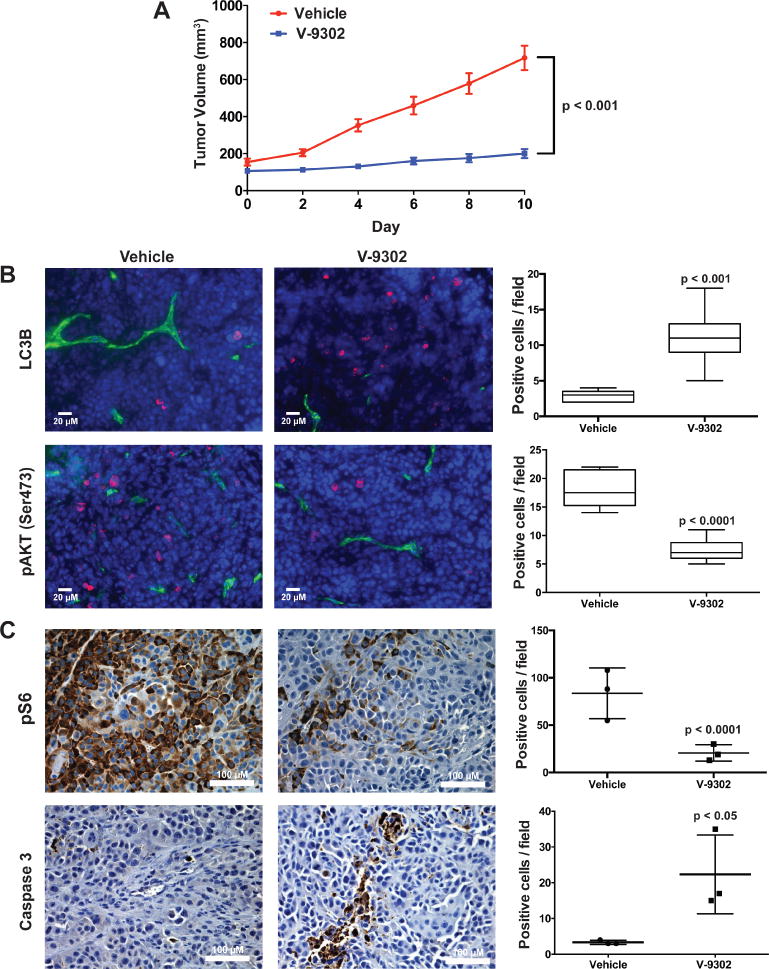
(A) Tumor volumetric analysis of mice treated with vehicle or V-9302 (75 mg/kg per day) for 10 days. n = 5 mice per group. Treatment started 9 days post injection. P value at day 10 determined by Student’s t test. (B) Immunofluorescence analysis of tumor tissues harvested from vehicle- or V-9302-treated mice; LC3B and pAKT (Ser473) shown (pink). CD-31 positive vessels shown in green and nuclei in blue (DAPI). 20× magnification. P values determined by Student’s t test. (C) Effects of V-9302 treatment on pS6-positive cells and caspase 3-positive cells by immunohistochemistry. Quantitative analysis consisted of the mean counts of at least three representative fields from three vehicle and three V-9302-treated mice. For box plots, center line is plotted at the median; the box spans from the first quartile to the third quartile; whiskers represent min to max. Error bars represent ± std. dev.
Extended Data Fig. 18. Evaluation of V-9302 in vivo in colo-205 cell line xenograft bearing mice.
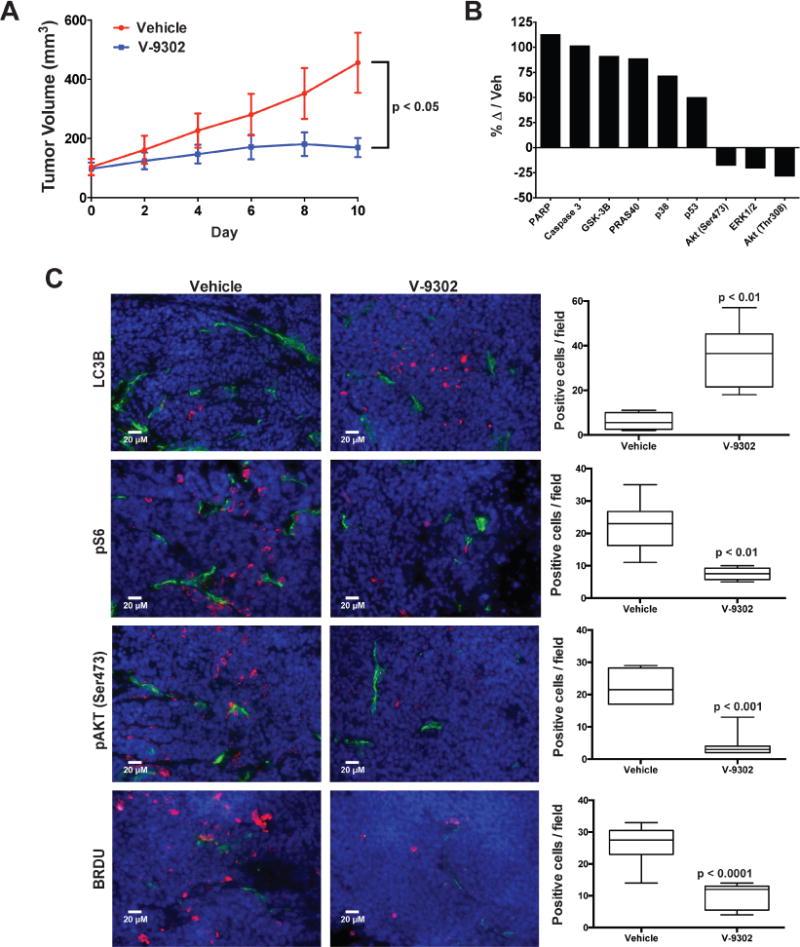
(A) Tumor volumetric analysis of mice treated with vehicle or V-9302 (75 mg/kg per day) for 10 days; n = 5 mice per group. Treatment started 6 days post injection. P value at day 10 determined by Student’s t test. (B) Immuno dot-blot assay of markers of cellular response to V-9302 in colo-205 cell line xenograft tumors; change in marker immunoreactivity relative to vehicle control. (C) Immnunofluorescence assay of LC3B-, pS6-, pAKT (Ser473)-, and BRDU-positive cells by immunofluorescence (pink). CD-31 positive vessels shown in green and nuclei in blue (DAPI). 20× magnification. Representative images shown. Quantitative analysis consisted of the mean counts of at least three representative fields from three vehicle and three V-9302 treated mice. P values determined by Student’s t test. For box plots, center line is plotted at the median; the box spans from the first quartile to the third quartile; whiskers represent min to max. Error bars represent ± std. dev.
Extended Data Fig. 19.
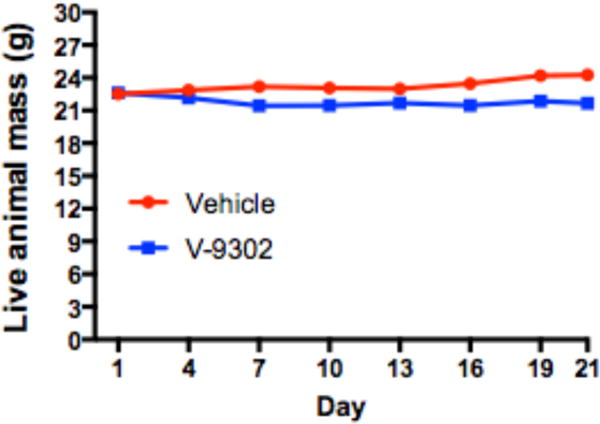
Longitudinal assessment of the mass of live athymic nude mice (n = 20 mice) treated daily with V-9302 (75 mg/kg per day) or vehicle over 21 days.
Extended Data Fig. 20. Representative photomicrographs of H&E stained liver sections from athymic nude mice chronically treated with 75 mg/kg per day V-9302 or vehicle over 21 days.
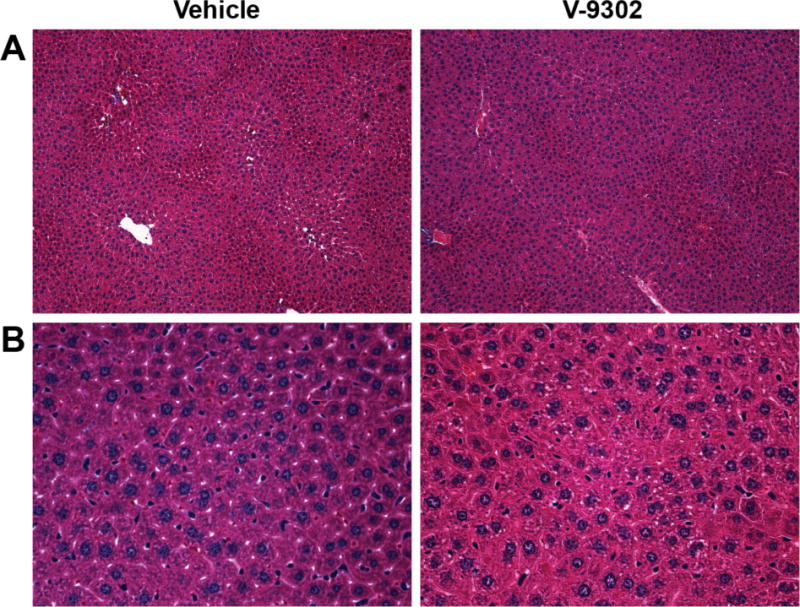
Magnification 20× (A) and 40× (B) shown. An experienced GI pathologist (MKW) found no discernible difference between liver pathology in mice treated with V-9302 or vehicle (n = 5).
Supplementary Material
Acknowledgments
The authors wish to acknowledge research support from the Vanderbilt Ingram Cancer Center Support Grant (NIH NCI P30CA068485, HCM), which supports the VICC Chemical Synthesis Core, VUMC Radiochemistry Core and Center for Small Animal Imaging; the Kleberg Foundation (HCM); a Vanderbilt Trans-Institutional Program (TIPS) Award to the Vanderbilt Center for Molecular Probes (HCM); the Vanderbilt SPORE in GI Cancer (NIH NCI P50CA095103, RJC & HCM); an OIA from the NCI (NIH NCI R35CA197570, RJC), and the Vanderbilt Digestive Disease Research Center (NIH DK P30DK058404, HCM). The authors acknowledge M. Tantawy for assistance with PET imaging, Frank Revetta for histology expertise, and Adam Rosenberg and Allison Cohen for helpful discussions and editorial assistance.
Footnotes
Supplementary Information
Supplementary Information contains complete metabolic data for V-9302.
Author Contributions
M.L.S. performed or designed most of the experiments with assistance from A.F., L.G., P.Z., and J.L. S.T.S. and J.A.S. performed computational modeling. J.K. and R.J.C. performed organoid studies. J.B. enrolled patients who provided tissues for organoids and PDXs. J.T.S. and M.C.S. performed optical redox ratio measurements. M.O.J. and J.C.R. performed T-cell experiments. M.K.W. interpreted pathology samples. M.L.N. oversaw radiopharmaceutical productions and provided technical assistance. H.C.M. designed and supervised the study. M.L.S., M.L.N, and H.C.M wrote the manuscript. All authors edited and approved the manuscript.
Competing financial interests
The authors declare no competing financial interests.
References
- 1.Pochini L, Scalise M, Galluccio M, Indiveri C. Membrane transporters for the special amino acid glutamine: structure/function relationships and relevance to human health. Front Chem. 2014;2:61. doi: 10.3389/fchem.2014.00061. [DOI] [PMC free article] [PubMed] [Google Scholar]
- 2.Jin L, Alesi GN, Kang S. Glutaminolysis as a target for cancer therapy. Oncogene. 2016;35:3619–3625. doi: 10.1038/onc.2015.447. [DOI] [PMC free article] [PubMed] [Google Scholar]
- 3.Hassanein M, et al. SLC1A5 mediates glutamine transport required for lung cancer cell growth and survival. Clin Cancer Res. 2013;19:560–570. doi: 10.1158/1078-0432.CCR-12-2334. [DOI] [PMC free article] [PubMed] [Google Scholar]
- 4.van Geldermalsen M, et al. ASCT2/SLC1A5 controls glutamine uptake and tumour growth in triple-negative basal-like breast cancer. Oncogene. 2016;35:3201–3208. doi: 10.1038/onc.2015.381. [DOI] [PMC free article] [PubMed] [Google Scholar]
- 5.Schulte ML, et al. Non-Invasive Glutamine PET Reflects Pharmacological Inhibition of BRAFV600E In Vivo. Mol Imaging Biol. 2016 doi: 10.1007/s11307-016-1008-z. [DOI] [PMC free article] [PubMed] [Google Scholar]
- 6.Gao P, et al. c-Myc suppression of miR-23a/b enhances mitochondrial glutaminase expression and glutamine metabolism. Nature. 2009;458:762–765. doi: 10.1038/nature07823. [DOI] [PMC free article] [PubMed] [Google Scholar]
- 7.Watanabe T, et al. Differential gene expression signatures between colorectal cancers with and without KRAS mutations: crosstalk between the KRAS pathway and other signalling pathways. Eur J Cancer. 2011;47:1946–1954. doi: 10.1016/j.ejca.2011.03.029. [DOI] [PubMed] [Google Scholar]
- 8.Romero R, et al. Keap1 loss promotes Kras-driven lung cancer and results in dependence on glutaminolysis. Nat Med. 2017 doi: 10.1038/nm.4407. [DOI] [PMC free article] [PubMed] [Google Scholar]
- 9.Shukla K, et al. Design, synthesis, and pharmacological evaluation of bis-2-(5-phenylacetamido-1,2,4-thiadiazol-2-yl)ethyl sulfide 3 (BPTES) analogs as glutaminase inhibitors. J Med Chem. 2012;55:10551–10563. doi: 10.1021/jm301191p. [DOI] [PMC free article] [PubMed] [Google Scholar]
- 10.Harding JJ, et al. Safety and tolerability of increasing doses of CB-839, a first-in-class, orally administered small molecule inhibitor of glutaminase, in solid tumors. J Clin Oncol. 2015;33 [Google Scholar]
- 11.Rhoads JM, et al. Glutamine metabolism stimulates intestinal cell MAPKs by a cAMP-inhibitable, Raf-independent mechanism. Gastroenterology. 2000;118:90–100. doi: 10.1016/s0016-5085(00)70417-3. [DOI] [PubMed] [Google Scholar]
- 12.Willems L, et al. Inhibiting glutamine uptake represents an attractive new strategy for treating acute myeloid leukemia. Blood. 2013;122:3521–3532. doi: 10.1182/blood-2013-03-493163. [DOI] [PMC free article] [PubMed] [Google Scholar]
- 13.Schulte ML, Khodadadi AB, Cuthbertson ML, Smith JA, Manning HC. 2-Amino-4-bis(aryloxybenzyl)aminobutanoic acids: A novel scaffold for inhibition of ASCT2-mediated glutamine transport. Bioorg Med Chem Lett. 2016;26:1044–1047. doi: 10.1016/j.bmcl.2015.12.031. [DOI] [PMC free article] [PubMed] [Google Scholar]
- 14.Esslinger CS, Cybulski KA, Rhoderick JF. N-gamma-Aryl glutamine analogues as probes of the ASCT2 neutral amino acid transporter binding site. Bioorgan Med Chem. 2005;13:1111–1118. doi: 10.1016/j.bmc.2004.11.028. [DOI] [PubMed] [Google Scholar]
- 15.Lomenick B, et al. Target identification using drug affinity responsive target stability (DARTS) Proc Natl Acad Sci U S A. 2009;106:21984–21989. doi: 10.1073/pnas.0910040106. [DOI] [PMC free article] [PubMed] [Google Scholar]
- 16.Canul-Tec JC, et al. Structure and allosteric inhibition of excitatory amino acid transporter 1. Nature. 2017;544:446–451. doi: 10.1038/nature22064. [DOI] [PMC free article] [PubMed] [Google Scholar]
- 17.Fuchs BC, Bode BP. Amino acid transporters ASCT2 and LAT1 in cancer: partners in crime? Semin Cancer Biol. 2005;15:254–266. doi: 10.1016/j.semcancer.2005.04.005. [DOI] [PubMed] [Google Scholar]
- 18.Nicklin P, et al. Bidirectional transport of amino acids regulates mTOR and autophagy. Cell. 2009;136:521–534. doi: 10.1016/j.cell.2008.11.044. [DOI] [PMC free article] [PubMed] [Google Scholar]
- 19.Vichai V, Kirtikara K. Sulforhodamine B colorimetric assay for cytotoxicity screening. Nat Protoc. 2006;1:1112–1116. doi: 10.1038/nprot.2006.179. [DOI] [PubMed] [Google Scholar]
- 20.Rathmell JC. T Cell Myc-tabolism. Immunity. 2011;35:845–846. doi: 10.1016/j.immuni.2011.12.001. [DOI] [PMC free article] [PubMed] [Google Scholar]
- 21.Skala M, Ramanujam N. Multiphoton redox ratio imaging for metabolic monitoring in vivo. Methods Mol Biol. 2010;594:155–162. doi: 10.1007/978-1-60761-411-1_11. [DOI] [PMC free article] [PubMed] [Google Scholar]
- 22.Walsh AJ, et al. Quantitative optical imaging of primary tumor organoid metabolism predicts drug response in breast cancer. Cancer Res. 2014;74:5184–5194. doi: 10.1158/0008-5472.CAN-14-0663. [DOI] [PMC free article] [PubMed] [Google Scholar]
- 23.Deberardinis RJ, Sayed N, Ditsworth D, Thompson CB. Brick by brick: metabolism and tumor cell growth. Curr Opin Genet Dev. 2008;18:54–61. doi: 10.1016/j.gde.2008.02.003. [DOI] [PMC free article] [PubMed] [Google Scholar]
- 24.Hanover JA, Krause MW, Love DC. The hexosamine signaling pathway: O-GlcNAc cycling in feast or famine. Biochim Biophys Acta. 2010;1800:80–95. doi: 10.1016/j.bbagen.2009.07.017. [DOI] [PMC free article] [PubMed] [Google Scholar]
- 25.Obeid LM, Linardic CM, Karolak LA, Hannun YA. Programmed cell death induced by ceramide. Science. 1993;259:1769–1771. doi: 10.1126/science.8456305. [DOI] [PubMed] [Google Scholar]
- 26.Tresse E, Kosta A, Giusti C, Luciani MF, Golstein P. A UDP-glucose derivative is required for vacuolar autophagic cell death. Autophagy. 2008;4:680–691. doi: 10.4161/auto.6084. [DOI] [PubMed] [Google Scholar]
- 27.Sentelle RD, et al. Ceramide targets autophagosomes to mitochondria and induces lethal mitophagy. Nat Chem Biol. 2012;8:831–838. doi: 10.1038/nchembio.1059. [DOI] [PMC free article] [PubMed] [Google Scholar]
- 28.Dall’Armi C, Devereaux KA, Di Paolo G. The role of lipids in the control of autophagy. Curr Biol. 2013;23:R33–45. doi: 10.1016/j.cub.2012.10.041. [DOI] [PMC free article] [PubMed] [Google Scholar]
- 29.Shatz O, Holland P, Elazar Z, Simonsen A. Complex Relations Between Phospholipids, Autophagy, and Neutral Lipids. Trends Biochem Sci. 2016;41:907–923. doi: 10.1016/j.tibs.2016.08.001. [DOI] [PubMed] [Google Scholar]
- 30.Huang F, Zhang Q, Ma H, Lv Q, Zhang T. Expression of glutaminase is upregulated in colorectal cancer and of clinical significance. Int J Clin Exp Pathol. 2014;7:1093–1100. [PMC free article] [PubMed] [Google Scholar]
- 31.Xiang Y, et al. Targeted inhibition of tumor-specific glutaminase diminishes cell-autonomous tumorigenesis. J Clin Invest. 2015;125:2293–2306. doi: 10.1172/JCI75836. [DOI] [PMC free article] [PubMed] [Google Scholar]
- 32.Seltzer MJ, et al. Inhibition of glutaminase preferentially slows growth of glioma cells with mutant IDH1. Cancer Res. 2010;70:8981–8987. doi: 10.1158/0008-5472.CAN-10-1666. [DOI] [PMC free article] [PubMed] [Google Scholar]
- 33.Gross MI, et al. Antitumor activity of the glutaminase inhibitor CB-839 in triple-negative breast cancer. Mol Cancer Ther. 2014;13:890–901. doi: 10.1158/1535-7163.MCT-13-0870. [DOI] [PubMed] [Google Scholar]
- 34.Suzuki S, et al. Phosphate-activated glutaminase (GLS2), a p53-inducible regulator of glutamine metabolism and reactive oxygen species. Proc Natl Acad Sci U S A. 2010;107:7461–7466. doi: 10.1073/pnas.1002459107. [DOI] [PMC free article] [PubMed] [Google Scholar]
- 35.Chiu M, et al. GPNA inhibits the sodium-independent transport system L for neutral amino acids. Amino Acids. 2017;49:1365–1372. doi: 10.1007/s00726-017-2436-z. [DOI] [PubMed] [Google Scholar]
- 36.McKinley ET, Zhao P, Coffey RJ, Washington MK, Manning HC. 3′-Deoxy-3′-[18F]-Fluorothymidine PET imaging reflects PI3K-mTOR-mediated pro-survival response to targeted therapy in colorectal cancer. PLoS One. 2014;9:e108193. doi: 10.1371/journal.pone.0108193. [DOI] [PMC free article] [PubMed] [Google Scholar]
- 37.Wiza C, Nascimento EB, Ouwens DM. Role of PRAS40 in Akt and mTOR signaling in health and disease. Am J Physiol Endocrinol Metab. 2012;302:E1453–1460. doi: 10.1152/ajpendo.00660.2011. [DOI] [PubMed] [Google Scholar]
- 38.Santio NM, et al. The PIM1 kinase promotes prostate cancer cell migration and adhesion via multiple signalling pathways. Exp Cell Res. 2016;342:113–124. doi: 10.1016/j.yexcr.2016.02.018. [DOI] [PubMed] [Google Scholar]
- 39.Rhoads JM, et al. L-glutamine stimulates intestinal cell proliferation and activates mitogen-activated protein kinases. Am J Physiol. 1997;272:G943–953. doi: 10.1152/ajpgi.1997.272.5.G943. [DOI] [PubMed] [Google Scholar]
- 40.Meiler J, Baker D. ROSETTALIGAND: protein-small molecule docking with full side-chain flexibility. Proteins. 2006;65:538–548. doi: 10.1002/prot.21086. [DOI] [PubMed] [Google Scholar]
- 41.Kondo J, et al. Retaining cell-cell contact enables preparation and culture of spheroids composed of pure primary cancer cells from colorectal cancer. Proc Natl Acad Sci U S A. 2011;108:6235–6240. doi: 10.1073/pnas.1015938108. [DOI] [PMC free article] [PubMed] [Google Scholar]
- 42.McKinley ET, et al. 18FDG-PET predicts pharmacodynamic response to OSI-906, a dual IGF-1R/IR inhibitor, in preclinical mouse models of lung cancer. Clin Cancer Res. 2011;17:3332–3340. doi: 10.1158/1078-0432.CCR-10-2274. [DOI] [PMC free article] [PubMed] [Google Scholar]
Associated Data
This section collects any data citations, data availability statements, or supplementary materials included in this article.
Supplementary Materials
Data Availability Statement
All data supporting the findings of this study are available from the corresponding author on request. A life Sciences Reporting Summary is available.


