

Abstract
Acoustically evoked seizures (e.g., audiogenic seizures or AGS) are common in models of inherited epilepsy and occur in a variety of species including rat, mouse, and hamster. Two models that have been particularly well studied are the genetically epilepsy prone rat (GEPR-3) and the Wistar audiogenic rat (WAR) strains. Acute and repeated AGS, as well as comorbid conditions, displays a close phenotypic overlap in these models. Whether these similarities arise from convergent or divergent structural changes in the brain remains unknown. Here, we examined the brain structure of Sprague Dawley (SD) and Wistar (WIS) rats, and quantified changes in the GEPR-3 and WAR, respectively. Brains from adult, male rats of each strain (n=8-10 per group) were collected, fixed, and embedded in agar and imaged using a 7-T Bruker MRI. Post-acquisition analysis included voxel-based morphometry (VBM), diffusion tensor imaging (DTI), and manual volumetric tracing. In the VBM analysis, GEPR-3 displayed volumetric changes in brainstem structures known to be engaged by AGS (e.g., superior and inferior colliculus, periaqueductal grey) and in forebrain structures (e.g., striatum, septum, nucleus accumbens). WAR displayed volumetric changes in superior colliculus, and a broader set of limbic regions (e.g., hippocampus, amygdala/piriform cortex). The only area of significant overlap in the two strains was the midline cerebellum: both GEPR-3 and WAR showed decreased volume compared to their control strains. In the DTI analysis, GEPR-3 displayed decreased fractional anisotropy (FA) in the corpus callosum, posterior commissure and commissure of the inferior colliculus (IC). WAR displayed increased FA only in the commissure of IC. These data provide a biological basis for further comparative and mechanistic studies in the GEPR-3 and WAR models, as well as provide additional insight into commonalities in the pathways underlying AGS susceptibility and behavioral comorbidity.
Keywords: epilepsy, brainstem, limbic, tonic, clonic, colliculus, cerebellum, comorbidity, audiogenic seizure, imaging, MRI, white matter, grey matter
1. Introduction
Acoustically evoked seizures (e.g., audiogenic seizures or AGS) are common in models of inherited epilepsy and have been reported in a variety of species including rat, mouse, and hamster (Faingold, 1988; Garcia-Cairasco et al., 2017; Muñoz et al., 2017; Poletaeva et al., 2017; Ross and Coleman, 2000). Seizures in all of these models have been shown to critically involve brainstem regions, including the inferior colliculus (IC) and superior colliculus (SC), as well as the periaqueductal grey (Faingold, 1988; Garcia-Cairasco et al., 2017; Ross and Coleman, 2000). Across species and strains, acute AGS typically consists of a combination of wild running seizures (WRS) which evolve into bouncing clonus or back arching tonus, with or without extension of the fore- and hind-limbs (Ross and Coleman, 2000).
Two key AGS models which display similar seizure phenotypes are the Genetically Epilepsy Prone Rat (GEPR-3s) and the Wistar Audiogenic Rat (WAR) strains (Faingold, 1999; Garcia-Cairasco et al., 2017; Mishra et al., 1989). The GEPR-3 (Dailey et al., 1989) and WAR (Doretto et al., 2003) models were derived from Sprague Dawley (SD) and Wistar (WIS) rats, respectively. In GEPR-3, a single AGS episode consists of WRS that evolve into generalized bouncing clonus followed in severe cases by tonic extension of the forelimb. Like the GEPR-3s, a single AGS episode in WARs consists of WRS. This is followed by tonic seizures, back-arching tonus, fore- and hindlimb extension, and eventually post-tonic clonus.
Interestingly, repeated acoustic stimulation in these models, initially described as “audiogenic kindling” in Wistar susceptible animals from Strasbourg (WIS AS), permanently modifies the profile of AGS (Marescaux et al., 1987; Vergnes et al., 1987). These alterations are reflected in behavioral, histological and EEG alterations due to the recruitment of additional brain circuits (e.g., limbic structures, neocortex) (Dutra Moraes et al., 2000; Galvis-Alonso et al., 2004; Garcia-Cairasco et al., 1996; Marescaux et al., 1987; Merrill et al., 2005; Naritoku et al., 1992). Audiogenic kindling in GEPR-3 results in typical forebrain-type seizures, characterized by facial and forelimb clonus; this is associated with a reduction in severity of hindbrain seizure responses (Merrill et al., 2005; Naritoku et al., 1992). Similarly, audiogenic kindling of WARs, results in a progressive increase in forebrain seizure severity, including facial and forelimb clonus, and an attenuation of brainstem behavioral seizure responses (Garcia-Cairasco et al., 1996; Romcy-Pereira and Garcia-Cairasco, 2003).
In addition to the remarkably similar seizure phenotypes across these independently developed models, both GEPR-3 and WAR also display a variety of other alterations, including decreased weight gain (Jobe and Dailey, 2006; Umeoka et al., 2011), alterations in serotonergic neurotransmission (Dailey et al., 1992, 1996, Statnick et al., 1996, 1996; Totola et al., 2017), increased glucocorticoid signaling (Jobe and Dailey, 2006; Umeoka et al., 2011), and behavioral phenotypes consistent with anxiety and depression (Castro et al., 2017; Garcia-Cairasco et al., 1998; Jobe and Dailey, 2006). These comorbidities in the WAR (see: (Garcia-Cairasco et al., 2017) for a review) and GEPR (see: (Jobe and Dailey, 2006) for a review) strains may have relevance to comorbidities seen in human epilepsies.
Thus prima facie observations across independent laboratories using either GEPR-3 or WAR strains make it clear that there are phenotypic similarities. However, despite these similarities, there is a paucity of in-depth investigations that directly interrogate these strains to determine whether AGS susceptibility arises from convergent or divergent structural changes in the brain. To address this gap in knowledge, we examined the brain structure of SD rats and WIS rats, and quantified changes in the GEPR-3 and WAR, respectively, using voxel-based morphometry (VBM) and diffusion tensor imaging (DTI).
2. Materials and Methods
2.1 Animals
Sixty day-old, male rats of the following strains were used for the present experiments: GEPR-3 (n=8), SD (n=10), WAR (n=8), and WIS (n=10). GEPR and SD rats were obtained from the colony at Georgetown University School of Medicine, Washington DC (USA), while WAR and WIS rats were obtained at the University of São Paulo - Ribeirão Preto School of Medicine, Ribeirão Preto (Brazil). Tissues collected at the University of São Paulo were shipped to Georgetown University for analysis.
In the SD, GEPR, and WAR groups, at least one brain per group was damaged during removal from the skull and thus excluded from VBM analysis. In the end, 5 GEPR brains, 10 SD brains, 6 WAR brains and 10 WIS brains were used for the VBM analysis. Similar quality control was performed for the DTI scans, with final groups sizes of GEPR = 4, SD = 7, WIS = 10 and WAR = 6. Manual tracing experiments used intermediate group numbers based on the location of damage relative to the region being traced.
2.2 Tissue Collection and Preparation
Rats were deeply anesthetized with pentobarbital-based euthanasia solution prior to perfusion. Rats were perfused transcardially with 300 ml of ice-cold phosphate buffered saline (pH 7.4) followed by 300 ml of freshly prepared 4% paraformaldehyde in phosphate buffer. Following perfusion, the soft tissues of the head were dissected away, the skull opened at the foramen magnum and the brain post-fixed in situ for 48 h in paraformaldehyde. After postfixation, brains were removed from the skull and stored in phosphate buffer prior to embedding. Brains were embedded in 3% agar in phosphate buffered saline within 50 ml conical tubes. Care was taken to avoid introducing air bubbles into the agar, which in pilot studies we found to interfere with imaging. After embedding, tubes were sealed with parafilm and the brains stored at 4C prior to imaging.
2.3 Magnetic Resonance Imaging Acquisition
Imaging was performed in a 7-T Bruker MRI run by Paravision 5.1 (Bruker Biospin, Ettlingen, Germany). The embedded brain was placed within a 40-mm diameter transmit-receive quadrature volume coil located within the isocenter of the magnet.
For voxel based morphometry, a T2-weighted rapid acquisition with relaxation enhancement (RARE) sequence was used to obtain three-dimensional (3D) images. The following imaging parameters were used: TR = 2500 ms, TE = 36 ms, RARE factor = 12, FOV = 20×25×30 mm3, matrix size = 171 × 214 × 256, spatial resolution = 117μm.
For Diffusion Tensor Imaging (DTI), a 3D DTI echo planar imaging (EPI) spin echo sequence was acquired with the following parameters: TR = 500 ms; TE = 24.77 ms; Δ=10 ms; δ=5 ms; RARE factor 4; b = 1000 s/mm2; FOV = 2 × 2.5 × 3 cm2 and matrix = 171 × 214 × 256; spatial resolution = 117μm. Thirty gradient directions and five baseline volumes were used. The total image acquisition time was 15 h.
2.4 Voxel-Based Morphometry Analysis
For VBM Raw 2dseq data were converted to DICOM files, exported, and converted to NIFTI format for further processing. Images were processed using a brain extraction tool, the Medical Image Processing, Analysis and Visualization software (or MIPAV, NIH) to remove the signal from the agar medium. These skull-stripped images were re-sized by a factor of 10, which enabled further processing using conventional neuroimaging software packages. Dimensions listed in subsequent steps refer to those of the re-scaled images. The rescaled images were aligned to a Wistar atlas via a 12-parameter affine transformation using FSL (FMRIB Software Library, Oxford, UK). Following alignment, images were re-sampled into 1.25 mm isotropic voxels.
VBM processing was performed using the Statistical Parametric Mapping 8 (SPM8, Wellcome Trust Centre for Neuroimaging) toolbox and software in MATLAB 2009. Images were segmented into images of gray matter (GM), and white matter (WM) by applying a unified segmentation approach (Ashburner and Friston, 2005) using the probabilistic maps of the rat brain (Valdés-Hernández et al., 2011) in SPM8 with the default setting. Whole brain grey and white matter volumes were estimated using get_totals.m plugin for SPM (Nemoto et al., 2011). The unmodulated GM and WM images were used to create a customized, population-specific template using diffeomorphic anatomical registration using exponentiated lie algebra (DARTEL) template-creation tool (Ashburner, 2007). After DARTEL registration, each gray and white matter image was normalized onto the custom template space created by DARTEL and then was rigid-aligned to the rat template space. Finally, the two tissue class images were smoothed with a 5-mm FWHM Gaussian kernel. The resulting images were entered into an analysis in SPM12 (Wellcome Trust Centre for Neuroimaging), and contrasts T-maps were generated for each pair of comparisons of interest (see statistics below). These T-maps were converted to log P-maps using the CAT12 toolbox (Gaser and Dahnke, n.d.). Log P-Maps were further processed using Mango (Mango: Multi-image analysis GUI, n.d.) to generate images, overlays, and for contrast-masking. This voxel-based morphometry (VBM) pipeline was used to quantitate regional brain volume differences across strains in a region-of-interest agnostic and automated manner.
2.5 Manual Volume Estimation
To confirm a subset of analyses, the volume of several regions were manually traced using the Volumest plugin (Merzin, n.d.) for ImageJ/FIJI to perform a Calvieri Estimation of the volume. For these analysis the re-scaled and affine transformed images from the prior analysis were used; volumes reported in the text were re-transformed back to the original image dimensions. For the cerebellar vermis (Lobules 5 and 6), images were traced a minimum of two times with a high reliability between estimations (R2=0.91). Volumes were estimated based on the anatomical boundaries in the Paxinos MRI/DTI rat brain atlas, with manual tracing beginning at sections equivalent to ~12mm posterior to bregma and ending ~10mm posterior to bregma (Paxinos et al., 2015). Volumes of the lateral ventricles were likewise estimated using the Volumest plugin. Manual tracing began at sections equivalent to ~1.6mm anterior to bregma through ~0.6mm posterior to bregma per the Paxinos MRI/DTI rat brain atlas (Paxinos et al., 2015). Volumes of the dorsal striatum (caudate and putamen) were traced from ~1.9mm anterior to bregma through ~2.1mm posterior to bregma. Values from the two observers were averaged for statistical analysis after inter-rater reliability measures showed a high correspondence between observations (R2=0.99).
For qualitative rating of ventriculomegaly, each image was assigned either a score from 0 to 2. Zero = no ventricular enlargement, 1 = mild ventricular enlargement extending a portion of the way through the rostrocaudal length of the ventricle, or 2 = severe ventricular enlargement present throughout the entire rostrocaudal extent. Each image was scored three times by an observer blinded to scan identity. Spearman’s r was > 0.90 for these ratings. The median of these values was used for statistical analysis. These manual volume tracing methods were used to extend and confirm our voxel-based morphometry outcomes.
2.6 Diffusion Tensor Imaging Analysis
For DTI analysis, 2dseq image files were imported directly into DSI Studio (Yeh, n.d.). Images were threshold-masked, reconstructed, and fiber tracking was performed. Color-coded images were exported from DSI studio for graphical display purposes. Volumes encoding fractional anisotropy (FA) were exported to FIJI for further processing.
In FIJI, FA values were calculated by two observers blind to scan identity. The inter-rater reliability (R2) for these values was 0.84 and the intra-rater reliability (R2) was 0.85. In cases where initial values deviated significantly between observers or observations, regions were retraced. Fiber pathways of interest were traced at the following coordinates (in mm) relative to bregma in the Paxinos MRI/DTI atlas (Paxinos et al., 2015): corpus callosum (1.39), anterior commissure (−0.36), fornix (−0.86), posterior commissure (−5.11), commissure of the inferior colliculus (−8.36). Corpus callosum, anterior commissure, posterior commissure, and commissure of the inferior colliculus were traced at the midline. The fornix was traced unilaterally across its dorsoventral extent in the identified section. Thus, through a combination of automated reconstruction steps and manual tracing, diffusion tensor imaging (DTI) was used to quantitate white matter microstructure across strains.
2.7 Statistical Analysis
P maps with an uncorrected height threshold of P<0.001 and a false-discovery rate of P<0.05 were used to define cluster-wise extent thresholds employing the non-stationary cluster extent correction method of Hayasaka et al. (Hayasaka et al., 2004).
For manual volume estimation, assessment of total grey and white matter volumes, and FA values for DTI, data were analyzed by Analysis of Variance (ANOVA) with Holm-Sidak corrected post-tests used for pairwise comparisons.
Comparisons across strains after these ANOVAs were limited to the following a priori determined combinations: (1) SD vs GEPR, (2) WIS vs WAR, (3) SD vs WIS, and (4) GEPR vs WAR. We had no a priori interest or hypotheses regarding SD as compared to WAR or WIS as compared to GEPR, and thus did not compute these comparisons for VBM, manual tracing and DTI analyses.
3. Results
3.1 Tissue Volumes
We first assessed total grey and white matter volumes in the two seizure susceptible strains, as compared to their respective control strains (Fig 1A). While there was a main effect of tissue type (F1,25=5964, P<0.0001) and a main effect of strain (F3,25=4.301, P=0.014), there was no significant tissue type-by-strain interaction (F3,25=1.297, P=0.2972). We also assessed the simple effect of genotype within each level of tissue type, and failed to find significant differences across the strains (F3,25=2.086, P=0.1276 for white matter; F3,25=1.274, P=0.3050 for grey matter). Upon analysis of total brain volume (F3,25=4.301, P=0.0141), it became clear that the previously detected effect of strain was driven by a small, but statistically significant difference between the GEPR-3 and WAR (P<0.05) and also between GEPR-3 and WIS (P<0.05), with GEPR-3 displaying larger brain volumes. When this analysis was repeated normalizing for whole brain volume, tissue type did not differ as a function of strain.
Figure 1. Grey and white matter and ventricular volumes in audiogenic and control strains.
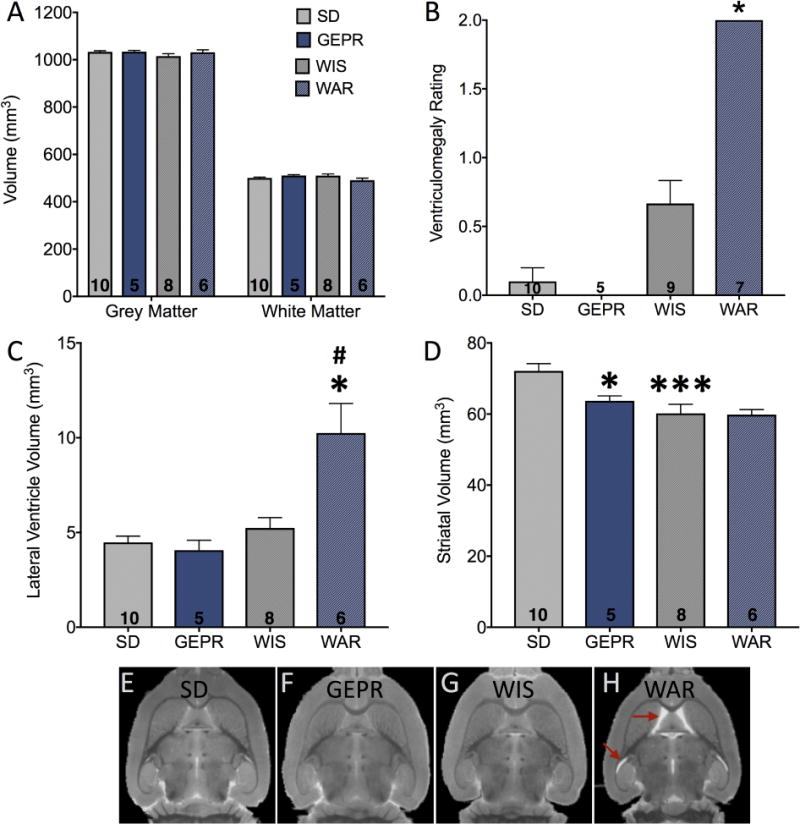
(A) Total grey and white matter as a function of strain. (B) Ventriculomegaly rating scale; * = significantly greater than WIS, P<0.05. (C) Lateral ventricle volume by hand-tracing, * = significantly different than WIS, # = significantly different than GEPR, Ps<0.05. (D) Striatal (caudate-putamen) volume by hand tracing. *, *** = significantly different than SD, P<0.05 and P<0.001, respectively. Representative horizontal sections from each strain are shown in E-H; red arrows indicate the region of ventriculomegaly in the WAR strain.
3.2 Ventricular Size
Using a qualitative rating scale that scored each image for the presence or absence of ventriculomegaly, we found that all WAR brains, but none of the GEPR-3, SD, or WIS brains, displayed severe ventriculomegaly. Kruskal-Wallis test revealed a significant difference across groups (K=23.79, P<0.0001; Figure 1B); pairwise comparisons revealed significantly higher rating scores for ventriculomegaly in WAR as compared to either SD, GEPR or WIS (p<0.05; Dunn’s post-test). Our ex vivo VBM segmentation approach did not allow for automated assessment of ventricular volume, so we next performed hand tracing of the lateral ventricles in each strain. As shown in Figure 1C, volumetric measurements confirmed the pattern observed for the ventriculomegaly scale (F3,27=11.29, p<0.001). WAR animals displayed significantly greater ventricle size than the WIS and GEPR groups (p=0.0005 and p=0.003, Holm-Sidak Corrected, respectively).
To determine if the change in ventricular volume was associated with a decrease in volume of adjacent structures, we calculated the volumes of the striatum. As shown in Figure 1D, striatal volumes did not differ between WIS and WAR strains, but consistent with our VBM analysis (see below) striatal volume was significantly reduced in GEPR as compared to SD rats (p <0.05) and was likewise smaller in WIS as compared to SD rats (p=0.0008). These effects were revealed by ANOVA (F3,27=8.326, p=0.0004 with Holm-Sidak corrected pairwise comparisons). Representative horizontal sections for each group are shown in Figure 1E-G; the ventriculomegaly in the WAR animals is indicated by the red arrows. We found significant correlations between our ventriculomegaly rating scale and measured ventricular volume (Spearman’s r = 0.785; p<0.001), between ventriculomegaly rating scale and striatal volume (Spearman’s r = −0.527; p=0.002) and between striatal and ventricular volume estimates (Pearson’s r = −0.394; p=0.03). Thus, while WAR animals displayed enlarged ventricles, this was not accompanied by a change in volume of the adjacent striatum. By contrast, GEPRs displayed decreased striatal volume, but no alteration in ventricular volume.
3.3 – Voxel Based Morphometry
P maps were generated from the VBM analyses as described; all clusters visible in the maps presented in Figs 2–5 exceeded the threshold for statistical significance; each map shows an overlay of the grey- and white matter contrasts for both directions of comparison (e.g., GEPR - SD and SD - GEPR).
Figure 2. Volume differences between Sprague-Dawley and Genetically Epilepsy Prone Rats.

P value map showing clusters of increased (red) and decreased (blue) volumes in the GEPR strain as compared to its control strain (Sprague Dawley).
Figure 5. Volumetric decrease in midline cerebellum is present in both GEPR and WAR strains.
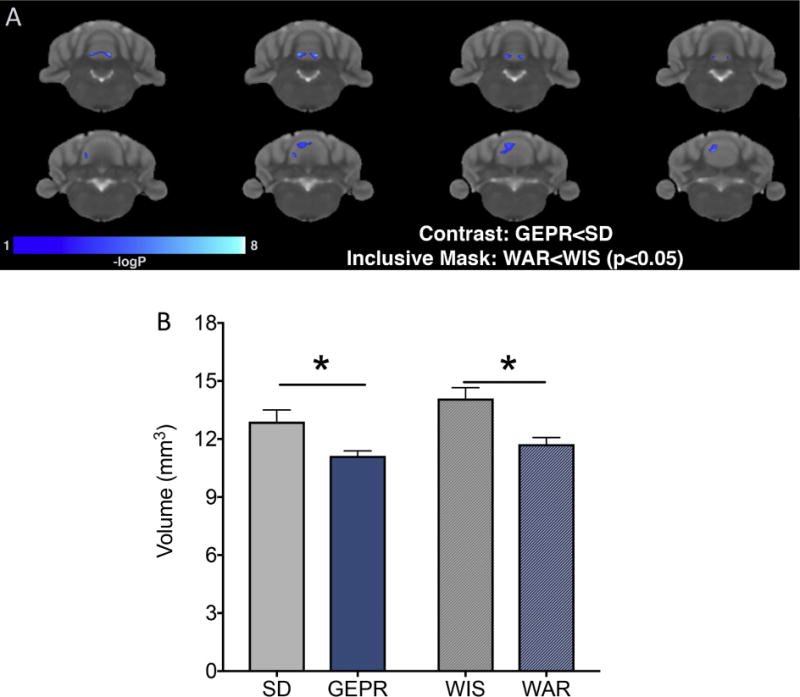
(A) P value map showing clusters of decreased volumes in the GEPR strain, as compared to the SD strain at the same locations where volumetric decreases in the WAR, as compared to WIS strain was found. These clusters in the cerebellum were the only clusters meeting these criteria. (B) Histogram showing manually traced volume estimates for midline cerebellum across strains. * = P<0.05.
The P map for GEPR-3 and SD is shown in Fig 2. In GEPR-3, bilateral decreases in the volume of a region encompassing the anterior nucleus accumbens and endopiriform nuclei were evident as compared to SD. In addition, a bilateral increase in the volume of the claustrum, and an adjacent decrease in the volume of the dorsomedial aspect of the caudate nucleus were also found in GEPR-3. This decrease in the caudate is consistent with our manual tracing results in Fig 1. The volume of the anterior commissure was decreased in GEPR-3 as compared to SD; however, the volume of a region encompassing the corpus callosum, dorsal fornix, and ventral hippocampal commissure was increased. Quantification also showed a small bilateral decrease in the ventral hippocampus/amygdalohippocampal area in GEPRs as compared to SD, and a similar decrease was found in the cortex surrounding the rhinal fissure (i.e., the ecto- peri- and dorsolateral entorhinal cortex). A volumetric increase in the SC, periaqueductal grey (PAG) and dorsal raphe was found in GEPRs as compared to SD. Finally, at the level of the cerebellum, decreases were found in the third, fourth, and sixth lobules of the vermis, whereas volumetric increases were found in the fifth lobule of the vermis. Thus, both volumetric increases and decreases in GEPRs relative to SDs were identified.
P maps for WAR as compared to WIS are shown in Figure 3. The overlays of the grey- and white- matter contrasts (WAR - WIS and WIS - WAR) revealed a decrease in volume in the anterior corpus callosum, immediately dorsal to the septal nuclei in WAR as compared to WIS. Additional limbic regions were enlarged in the WAR as compared to WIS strain, including portions of the lateral septum and septofimbrial nucleus, and the fimbria and dorsal fornix extending into the CA1 and CA3 fields of the hippocampus. Moreover, a volumetric increase was found in the posterior piriform cortex, a cluster that extended to the medial portion of the amygdala at its anterior extend and to the medial entorhinal cortex at its posterior portion. Volumetric decreases in WAR relative to WIS were detected in the stria medularis and corpus callosum/cingulum, as well as in the lateral geniculate nucleus and unilaterally within the SC. At the level of the cerebellum, a volumetric decrease was found in the third, fourth, fifth and sixth lobules. Thus, both volumetric increases and decreases in WARs relative to WISs were identified.
Figure 3. Volume differences between Wistar and Wistar Audiogenic Rats.

P value map showing clusters of increased (red) and decreased (blue) volumes in the WAR strain as compared to its control strain (Wistar).
When comparing regions in the GEPR-3 vs. WAR, we used an exclusion mask for regions that differed between the control strains (P<0.05). Thus, Figure 4 shows regions that differ in the two seizure strains, but not between their respective control strains. This analysis yielded additional regions that were not detected in the comparisons between the seizure-prone strains and their respective control strains. These regions included larger volumes in the infralimbic, cingulate, primary motor, and primary somatosensory cortices of GEPR-3 as compared to WAR. Similarly, GEPR-3 displayed larger volumes in the anterior hippocampus, hypothalamus, and central nucleus of the IC as compared to WAR.
Figure 4. Volume differences between GEPR and WAR strains.

P value map showing clusters of increased (red) and decreased (blue) volumes in the GEPR strain as compared to the WAR strain. These differences were masked to exclude any voxels that differed between the control strains (P<0.05, uncorrected); i.e., any difference shown in this figure is in a region that does not differ between Sprague-Dawley and Wistar strains.
When we examined regions that differed in GEPR-3 as compared to SD and also differed in WAR as compared to WIS, only the cerebellar vermis was detected (Figure 5A). Volumetric decreases in lobule 3, 4 and 5, were evident in both strains. We confirmed this finding with manual tracing of volumes. As shown in Figure 5b, we found a main effect of strain (F3,27=5.381, p =0.0049), with Holm-Sidak corrected comparisons revealing significant (P<0.05) decreases in volume between GERP and SD, as well as WAR and WIS. Thus, while GEPRs and WARs displayed a variety of volumetric differences relative to each other, only the midline cerebellum differed in both strains relative to their respective control strains.
3.4 – Diffusion Tensor Imaging
We next evaluated changes in white matter in GEPR-3, SD, WAR, and WIS using diffusion tensor imaging. Representative fractional anisotropy maps are shown in Figure 6A and are quantified in Figure 6B. A two-way ANOVA revealed a significant main effect of strain (F4,92=20.68, P<0.0001), a significant main effect of region (F3,23=12.8, P<0.0001) and a significant strain-by-region interaction (F12,92=2.1, P=0.022). Holm-Sidak corrected planned comparisons (GEPR-3 vs. SD, WAR vs. WIS, GEPR-3 vs. WAR and SD vs. WIS) revealed three types of differences: differences between background strains, differences between seizure strains, and differences between a seizure strain and its respective background strain. In the corpus callosum, GEPR-3 displayed significantly lower FA values than did either the SD or WAR strains. In the anterior commissure and fornix, a significantly greater FA value was found in WAR as compared to GEPR-3. In the posterior commissure, GEPR-3 displayed significantly lower FA values than either SD or WAR. Finally, in the commissure of the IC, GEPR-3 displayed lower FA values than SD or WAR and WIS displayed lower FA values than either SD or WAR. Thus, both GEPR and WAR strains displayed alterations in white matter microstructure relative both to their control strains and to each other.
Figure 6. Diffusion tensor imaging reveals differences in white matter between strains.

(A) Color-coded map showing fiber directionality. Panels on the left indicate the levels at which fractional anisotropy (FA) measurements were made for each region. f = fornix, ac = anterior commissure, cc = corpus callosum, pc = posterior commissure, cic = commissure of the inferior colliculus. Expanded view on the right shows a representative image through each region of interest for each strain. Data are quantified in (B) which shows mean + SEM FA values for each region and strain. # = significantly different than reference strain (SD vs WIS; GEPR vs WAR); P<0.05. * = significantly different than control strain (GEPR vs SD; WAR vs WIS); P<0.05.
4. Discussion
Here we have shown that despite the striking AGS phenotypic similarities between GEPR-3 and WAR, the pattern of brain alterations in these strains is surprisingly different. While the brain regions that differed between AGS strains and control strains are consistent with a priori hypotheses based on existing knowledge of the seizure networks in these strains, the lack of convergence across strains is quite notable. Only one region, the midline cerebellum, displayed a similar decrease in volume in both GEPR-3 and WAR animals.
While in vivo imaging provides the key advantage of enabling multiple scans of the same subjects longitudinally, we employed post-mortem analyses in the present study for several reasons. First, post-mortem scans offer significantly improved image quality, because of mechanical stability, and second, post-mortem scans offer a greatly increased signal-to-noise ratio. Although there are general concerns about fixation process-induced changes in structure, Oguz et al. (Oguz et al., 2013) have reported that there are no differences between in vivo and post-mortem brain MRI measurements in rodent tissue. Thus, the utilization of post-mortem scans is a valid and reliable method for volumetric studies of rodents with the advantage of the improvement in the image quality.
Further underscoring the utility of our approach, the manually-traced volume estimates for both the striatum and the lateral ventricles fall within the range previously reported using other MRI and histological approaches (Andersson, 2002; Biezonski et al., 2016; Mengler et al., 2014; Pfefferbaum et al., 2004). Moreover, while spontaneous ventriculomegaly has not been previously reported in WAR animals, it has been reported to occur in WIS animals (Tu et al., 2014), the strain from which the WAR strain was derived. The frequency of spontaneous ventriculomegaly in the WIS strain in the present study was similar to that previously reported (Tu et al., 2014); however, the magnitude of this enlargement was subtle as compared to the WAR strain. Interestingly, despite an enlargement of the ventricles, manual tracing did not reveal a reduction in caudate-putamen volume in the WAR strain, but did show a decrease in caudate-putamen volume in the GEPRs. GEPRs displayed decreased volume in the dorsomedial striatum (Fig 2) and smaller overall striatal volume (Fig 1), whereas WARs displayed increased volume in the posterior caudate (Fig 3) without an overall change in striatal volume (Fig 1). It is possible that the larger volume in the posterior caudate masked a volumetric decrease in the anterior caudate in our manual tracing analysis, as ventricular volume and caudate volume were negatively correlated in our sample. The functional significance of these changes is unclear, however, it is worth noting that increased activity within the striatum has been associated with seizure suppressive effects (Turski et al., 1987).
4.1 Volumetric changes in brainstem regions and relevance to seizure circuitry
The brain networks we found to be altered in the strains with AGS susceptibility generally fall into three categories: brainstem structures, limbic structures, and basal ganglia structures. c-Fos and/or local cerebral glucose utilization studies indicate that these networks are broadly activated during acute or chronic (kindled) audiogenic seizures in GEPR-3 and GEPR-9 strains (Eells et al., 2000, 2004) and in the Wistar AS rat, another audiogenic strain derived from Wistar rats in Strasbourg (Nehlig et al., 1996).
Brainstem regions are necessary and sufficient for AGS; pre-collicular transections, which separate the forebrain from brainstem do not alter AGS (although, they do impair audiogenic kindling) (Doretto et al., 2009). In both GEPR and WAR strains, AGS activity has been reported to originate in the IC, a site in which GEPR-3 animals display enhanced calcium channel currents in IC neurons (N’Gouemo et al., 2009) and decreased GABA concentrations (Lasley, 1991) [although see (Ribak et al., 1988a)]. Moreover, GEPR-9 animals display increased numbers of GABAergic neurons in the IC (Ribak, 2017; Roberts et al., 1985b, 1985a) with the number of small neurons in the central IC predicting seizure susceptibility in GEPR-SD backcrosses (Ribak et al., 1988b). Such changes may also occur in the IC of GEPR-3. Similarly, activity within the IC is necessary for AGS in WARs (Garcia-Cairasco and Sabbatini, 1991; Terra and Garcia-Cairasco, 1994). When we compared the volumes of the GEPR-3 to the WAR strains, while controlling for volume differences in the control strains, we found a significant enlargement of the IC in the GEPRs, as compared to WARs. Interestingly, this increase was most prominent in the central nucleus of the IC, raising the possibility that histological exploration of this region in the GEPR-3s may be meaningful. The divergent pattern of fractional anisotropy in commissure of the IC in GEPR vs. WAR strains is particularly intriguing - we detected abnormalities in both strains, but in opposite directions; the degree to which these changes are associated with either divergent or convergent functional outcomes remains to be explored.
The superior colliculus (SC) is another site of interest in the AGS network, and is necessary for initiation of WRS, at least in the GEPR-9 (Faingold and Randall, 1999). While more evident in the GEPR than in the WAR, we found volumetric increases in the SC. This cluster differed in location within the SC across the two strains, and thus did not survive the conjunction analysis in Fig 5. In both strains, the SC has been shown to play an integral part in the AGS network. For example, mid-collicular transections (i.e., between the IC and SC) reduce AGS severity in GEPR-9 (Ribak et al., 1994), GEPR-3 (Browning et al., 1999), and WAR (Tsutsui et al., 1992) strains. Moreover, pharmacological suppression of activity within the SC reduces AGS in both GEPR-3 (Raisinghani and Faingold, 2003) and WAR strains (Rossetti et al., 2011). Interestingly, while bicuculline injection into the SC has been reported to induce AGS-like responses in GEPR-3 animals, it has also been associated with a suppression of MES-induced tonic seizures and limbic evoked seizures, specifically when placed in the deep layers (Merrill et al., 2003) near the region described by Shehab, Redgrave and colleagues as the dorsal mid-brain anticonvulsant zone (Shehab et al., 1995). Consistent with this, optogenetic stimulation of the SC suppresses seizures in GEPR-3s (Soper et al., 2016). Interestingly, the SC may also provide an interface with the limbic system, as ablation of the SC reduces acquisition of audiogenic kindling in WAR animals (Doretto et al., 2009).
Regions upstream of the SC, e.g., the substantia nigra pars reticulata (SNpr), have also been implicated in seizure control, both broadly (Iadarola and Gale, 1982) and in both the WAR and GEPR-9 strains (Browning, 1986; Doretto et al., 1994; Doretto and Garcia-Cairasco, 1995; Garcia-Cairasco and Sabbatini, 1991; Millan et al., 1988; Rossetti et al., 2011; Terra and Garcia-Cairasco, 1992) although it has not been previously examined in GEPR-3s. Interestingly, despite changes in the downstream targets of the nigra (e.g., colliculus), we did not detect any regional alterations in the SNpr in the present study.
The periaqueductal gray (PAG) is likewise a critical contributor to AGS in the GEPR (N’Gouemo and Faingold, 1999). Within the PAG, we found an increased volume localized to the lateral and ventral PAG. Interestingly, blockade of glutamate receptors in this region abolishes seizure activity in both GEPR-3 (Raisinghani and Faingold, 2003) and GEPR-9 (N’Gouemo and Faingold, 1999). The PAG cluster also likely overlaps with the dorsal raphe nucleus; serotonin deficiencies have been reported in both the GEPR-3 and GEPR-9 strains (Dailey et al., 1992). Moreover, depletion of serotonin significantly exacerbates seizures in the GEPR-3 strain (Clough et al., 1996). In the WAR strain, a recent report has shown reduced tryptophan hydroxylase expression in specific nuclei of the raphe complex (Totola et al, 2017), although serotonin levels have not been directly evaluated in this strain. Despite the importance of these structures to the AGS network, we found no significant changes in volume of either the IC or PAG of the WAR strain.
4.2 Volumetric changes in limbic regions: relevance to seizure circuitry and comorbidities
With regard to limbic structures, the pattern of volumetric changes differed in WAR and GEPR-3, as compared to their respective control strains. WAR displayed volumetric changes in a larger number of limbic regions as compared to GEPR-3; these regions included amygdala, hippocampus and associated fiber tracts, septum, and posterior piriform cortex. Not all of these regions survived the masked analysis in Fig. 4, presumably because volumes also differed between the control strains. The only major limbic regions displaying volume changes in GEPR-3 were limbic associated cortices such as the piriform and rhinal cortex. These changes are of interest as these are critical components of the limbic seizure network, both in rodent models and in human patients with temporal lobe epilepsy (Vismer et al., 2015). In both GEPR-3 and GEPR-9, AGS episodes trigger c-Fos induction in forebrain regions (e.g., amygdala, piriform cortex) in addition to canonical brainstem components of the AGS network (Eells et al., 2000). Audiogenic kindling is associated with a strengthening of evoked input to lateral amygdala in GEPRs (Feng and Faingold, 2002); consistent with this, repeated acoustic stimulation results in progressive engagement of electrographic seizure activity in the amygdala of WARs (Dutra Moraes et al., 2000), whereas focal inhibition of the amygdala suppresses audiogenic kindling in Wistar AS rats (Hirsch et al., 1997). Glutamatergic neurotransmission in the amygdala has bidirectional impact on AGS in GEPRs. Blockade reduces the clonic component of AGS in non-kindled GEPR-3, suppresses facial and forelimb clonus in audiogenic kindled GEPR-3; by contrast, NMDA agonists produce facial and forelimb clonus following AGS in GEPR-3 and post-tonic clonus in GEPR-9 (Raisinghani, 2003; Raisinghani and Faingold, 2005). WAR display mild mossy fiber sprouting in the hippocampus and neuroplastic changes in amygdala and perirhinal cortex following audiogenic kindling (Garcia-Cairasco et al., 1996).
The limbic alterations we found may also bear relevance to comorbidities such as anxiety and depression. In WARs, increased anxiety in the elevated plus maze and open field tests has been reported (Garcia-Cairasco et al., 1998). Decreased sucrose consumption and increased immobility time in the forced swim test have been reported in GEPRs, likely consistent with deficits in serotonergic and noradrenergic neurotransmission in these rats (Jobe and Dailey, 2006). WARs similarly display increased immobility in the forced swim task, although they do not show deficits in sucrose preference; in fact they show increased sucrose preference (Castro et al., 2017). The degree to which these behaviors would be modified by audiogenic kindling has not been examined in either strain; likewise, determining the effects of audiogenic kindling on brain volume in both strains will be of future interest.
4.2 Volumetric changes in cerebellum: relevance to seizure control?
The cluster we identified in the cerebellum of both WAR and GEPR animals may be of particular interest. GEPR-3 display increased NE content in the cerebellum, but decreased norepinephrine (NE) content in other brain regions (Jobe et al., 1982) and lower serotonin in cerebellum as compared to either control SD rats or GEPR-9 (Dailey et al., 1992). Moreover, both GEPR-3 and GEPR-9 display reduced sensitivity to GABAergic inhibition within the cerebellum (Gould et al., 1995; Molnar et al., 2000). While equivalent studies have not been performed in WAR, our imaging findings underscore the importance of examining this further. There is a long history of interest in the cerebellum as a target for deep brain stimulation, largely stemming from the pioneering studies of Cooper et al (Cooper et al., 1976). The technological advances of optogenetics have renewed interest in the cerebellum as a target, due to increased specificity of manipulations which have been suggested to reduce side effects. For example, optogenetic activation of GABAergic neurons within the cerebellar vermis potently disrupts seizures in a mouse model of temporal lobe epilepsy (Krook-Magnuson et al., 2014). Our present findings raise the possibility that the cerebellum may also be an attractive target for brain stimulation to control seizures in models of inherited epilepsy.
5. Conclusions
Here, we have documented the pattern of structural alterations seen in the brains of two commonly utilized rat models of inherited epilepsy, the GEPR-3 and WAR strains. Despite behavioral and phenotypic similarities between these strains, the profile of regional brain volume changes was different between strains. Consistent with the increasing awareness of the importance of considering strain differences in models of epilepsy (Löscher et al., 2017), we believe that characterization of other audiogenic rat strains (e.g., the GEPR-9 or Wistar AS) using the approaches in the present study may uncover commonalities in brain alterations in AGS models. The present data also provide an anatomical basis for new testable hypotheses regarding both the seizure and comorbid phenotypes of these rodent models of inherited epilepsy.
Highlights.
- GEPR-3 rats display volumetric abnormalities in brainstem components of the audiogenic seizure network
- WAR rats display volumetric abnormalities in forebrain/limbic structures
- WAR rats display ventriculomegaly
- Both GEPR-3 and WAR strains display volumetric decreases in midline cerebellum
Acknowledgments
We thank Dr. Theodore Turesky for his helpful comments on this manuscript and Evan Wicker and Robert Hammack for assistance collecting and embedding tissue. PAF was supported by KL2TR001432 and R01NS097762. PN was supported by R01AA020073. The Preclinical Imaging Research Laboratory is partially supported by NIH/NCI grant P30-CA0510008. NGC is funded by the National Program of Excellence (PROEX-CAPES) to the Graduate Program in Physiology FMRP-USP, Brazil and the Thematic Project-FAPESP-Brazil (2007/50261-4). NGC holds a CNPq-Brazil Investigator Fellowship (305883/2014-3).
Abbreviations
- SD
Sprague Dawley
- GEPR-3
Genetically Epilepsy Prone Rat 3
- WIS
Wistar
- WAR
Wistar Audiogenic Rat
- VBM
Voxel based morphometry
- DTI
diffusion tensor imaging
- FA
fractional anisotropy
- SC
superior colliculus
- IC
inferior colliculus
- AGS
audiogenic seizure
Footnotes
Publisher's Disclaimer: This is a PDF file of an unedited manuscript that has been accepted for publication. As a service to our customers we are providing this early version of the manuscript. The manuscript will undergo copyediting, typesetting, and review of the resulting proof before it is published in its final citable form. Please note that during the production process errors may be discovered which could affect the content, and all legal disclaimers that apply to the journal pertain.
Author Contributions
PAF designed and supervised the experiments with input from OR, CA, NGC, and PN. OR, CA, and YL designed imaging acquisition parameters. YL acquired images and performed post-processing and VBM analyses. JACdO, ALFD, and AF prepared samples of WAR and Wistar brains. ALFD, AF, and PAF performed manual tracing studies. VS and PAF performed DTI analyses. PAF performed statistical analyses and DTI post-processing. CA, NGC, PN, and PAF obtained funding. PAF and YL wrote the manuscript with input from PN, OR, CA, VS, and NGC. All authors edited the manuscript.
References
- Andersson C. Striatal Volume Changes in the Rat Following Long-term Administration of Typical and Atypical Antipsychotic Drugs. Neuropsychopharmacology. 2002;27:143–151. doi: 10.1016/S0893-133X(02)00287-7. [DOI] [PubMed] [Google Scholar]
- Ashburner J. A fast diffeomorphic image registration algorithm. NeuroImage. 2007;38:95–113. doi: 10.1016/j.neuroimage.2007.07.007. [DOI] [PubMed] [Google Scholar]
- Ashburner J, Friston KJ. Unified segmentation. NeuroImage. 2005;26:839–851. doi: 10.1016/j.neuroimage.2005.02.018. [DOI] [PubMed] [Google Scholar]
- Biezonski D, Shah R, Krivko A, Cha J, Guilfoyle DN, Hrabe J, Gerum S, Xie S, Duan Y, Bansal R, Leventhal BL, Peterson BS, Kellendonk C, Posner J. Longitudinal magnetic resonance imaging reveals striatal hypertrophy in a rat model of long-term stimulant treatment. Transl Psychiatry. 2016;6:e884. doi: 10.1038/tp.2016.158. [DOI] [PMC free article] [PubMed] [Google Scholar]
- Browning RA. Neuroanatomical localization of structures responsible for seizures in the GEPR: lesion studies. Life Sci. 1986;39:857–867. doi: 10.1016/0024-3205(86)90367-x. [DOI] [PubMed] [Google Scholar]
- Browning RA, Wang C, Nelson DK, Jobe PC. Effect of precollicular transection on audiogenic seizures in genetically epilepsy-prone rats. Exp Neurol. 1999;155:295–301. doi: 10.1006/exnr.1998.6981. [DOI] [PubMed] [Google Scholar]
- Castro GP, de Medeiros DC, de Guarnieri LO, Mourão FAG, Pinto HPP, Pereira GS, Moraes MFD. Wistar audiogenic rats display abnormal behavioral traits associated with artificial selection for seizure susceptibility. Epilepsy Behav. 2017;71:243–249. doi: 10.1016/j.yebeh.2015.08.039. [DOI] [PubMed] [Google Scholar]
- Clough R, Statnick M, Maring-Smith M, Wang C, Eells J, Browning R, Dailey J, Jobe P. Fetal raphe transplants reduce seizure severity in serotonin-depleted GEPRs. Neuroreport. 1996;8:341–346. doi: 10.1097/00001756-199612200-00067. [DOI] [PubMed] [Google Scholar]
- Cooper IS, Amin I, Riklan M, Waltz JM, Poon TP. Chronic cerebellar stimulation in epilepsy. Clinical and anatomical studies. Arch Neurol. 1976;33:559–570. doi: 10.1001/archneur.1976.00500080037006. [DOI] [PubMed] [Google Scholar]
- Dailey JW, Mishra PK, Ko KH, Penny JE, Jobe PC. Serotonergic abnormalities in the central nervous system of seizure-naive genetically epilepsy-prone rats. Life Sci. 1992;50:319–326. doi: 10.1016/0024-3205(92)90340-u. [DOI] [PubMed] [Google Scholar]
- Dailey JW, Reigel CE, Mishra PK, Jobe PC. Neurobiology of seizure predisposition in the genetically epilepsy-prone rat. Epilepsy Res. 1989;3:3–17. doi: 10.1016/0920-1211(89)90063-6. [DOI] [PubMed] [Google Scholar]
- Dailey JW, Yan QS, Adams-Curtis LE, Ryu JR, Ko KH, Mishra PK, Jobe PC. Neurochemical correlates of antiepileptic drugs in the genetically epilepsy-prone rat (GEPR) Life Sci. 1996;58:259–266. doi: 10.1016/0024-3205(95)02286-4. [DOI] [PubMed] [Google Scholar]
- Doretto MC, Burger RL, Mishra PK, Garcia-Cairasco N, Dailey JW, Jobe PC. A microdialysis study of amino acid concentrations in the extracellular fluid of the substantia nigra of freely behaving GEPR-9s: relationship to seizure predisposition. Epilepsy Res. 1994;17:157–165. doi: 10.1016/0920-1211(94)90015-9. [DOI] [PubMed] [Google Scholar]
- Doretto MC, Cortes-de-Oliveira JA, Rossetti F, Garcia-Cairasco N. Role of the superior colliculus in the expression of acute and kindled audiogenic seizures in Wistar audiogenic rats. Epilepsia. 2009;50:2563–2574. doi: 10.1111/j.1528-1167.2009.02164.x. [DOI] [PubMed] [Google Scholar]
- Doretto MC, Fonseca CG, Lôbo RB, Terra VC, Oliveira JAC, Garcia-Cairasco N. Quantitative study of the response to genetic selection of the Wistar audiogenic rat strain (WAR) Behav Genet. 2003;33:33–42. doi: 10.1023/a:1021099432759. [DOI] [PubMed] [Google Scholar]
- Doretto MC, Garcia-Cairasco N. Differential audiogenic seizure sensitization by selective unilateral substantia nigra lesions in resistant Wistar rats. Physiol Behav. 1995;58:273–282. doi: 10.1016/0031-9384(95)00050-s. [DOI] [PubMed] [Google Scholar]
- Dutra Moraes MF, Galvis-Alonso OY, Garcia-Cairasco N. Audiogenic kindling in the Wistar rat: a potential model for recruitment of limbic structures. Epilepsy Res. 2000;39:251–259. doi: 10.1016/s0920-1211(00)00107-8. [DOI] [PubMed] [Google Scholar]
- Eells JB, Clough RW, Browning RA, Jobe PC. Comparative fos immunoreactivity in the brain after forebrain, brainstem, or combined seizures induced by electroshock, pentylenetetrazol, focally induced and audiogenic seizures in rats. Neuroscience. 2004;123:279–292. doi: 10.1016/j.neuroscience.2003.08.015. [DOI] [PubMed] [Google Scholar]
- Eells JB, Clough RW, Miller JW, Jobe PC, Browning RA. Fos expression and 2-deoxyglucose uptake following seizures in developing genetically epilepsy-prone rats. Brain Res Bull. 2000;52:379–389. doi: 10.1016/S0361-9230(00)00276-8. [DOI] [PubMed] [Google Scholar]
- Faingold CL. Neuronal networks in the genetically epilepsy-prone rat. Adv Neurol. 1999;79:311–321. [PubMed] [Google Scholar]
- Faingold CL. The genetically epilepsy-prone rat. Gen Pharmacol. 1988;19:331–338. doi: 10.1016/0306-3623(88)90025-0. [DOI] [PubMed] [Google Scholar]
- Faingold CL, Randall ME. Neurons in the deep layers of superior colliculus play a critical role in the neuronal network for audiogenic seizures: mechanisms for production of wild running behavior. Brain Res. 1999;815:250–258. doi: 10.1016/s0006-8993(98)01136-6. [DOI] [PubMed] [Google Scholar]
- Feng HJ, Faingold CL. Synaptic plasticity in the pathway from the medial geniculate body to the lateral amygdala is induced by seizure repetition. Brain Res. 2002;946:198–205. doi: 10.1016/s0006-8993(02)02884-6. [DOI] [PubMed] [Google Scholar]
- Galvis-Alonso OY, Cortes De Oliveira JA, Garcia-Cairasco N. Limbic epileptogenicity, cell loss and axonal reorganization induced by audiogenic and amygdala kindling in wistar audiogenic rats (WAR strain) Neuroscience. 2004;125:787–802. doi: 10.1016/j.neuroscience.2004.01.042. [DOI] [PubMed] [Google Scholar]
- Garcia-Cairasco N, Oliveira JA, Wakamatsu H, Bueno ST, Guimarães FS. Reduced exploratory activity of audiogenic seizures susceptible Wistar rats. Physiol Behav. 1998;64:671–674. doi: 10.1016/s0031-9384(98)00129-2. [DOI] [PubMed] [Google Scholar]
- Garcia-Cairasco N, Sabbatini RM. Possible interaction between the inferior colliculus and the substantia nigra in audiogenic seizures in Wistar rats. Physiol Behav. 1991;50:421–427. doi: 10.1016/0031-9384(91)90089-7. [DOI] [PubMed] [Google Scholar]
- Garcia-Cairasco N, Umeoka EHL, Cortes de Oliveira JA. The Wistar Audiogenic Rat (WAR) strain and its contributions to epileptology and related comorbidities: History and perspectives. Epilepsy Behav EB. 2017;71:250–273. doi: 10.1016/j.yebeh.2017.04.001. [DOI] [PubMed] [Google Scholar]
- Garcia-Cairasco N, Wakamatsu H, Oliveira JA, Gomes EL, Del Bel EA, Mello LE. Neuroethological and morphological (Neo-Timm staining) correlates of limbic recruitment during the development of audiogenic kindling in seizure susceptible Wistar rats. Epilepsy Res. 1996;26:177–192. doi: 10.1016/s0920-1211(96)00050-2. [DOI] [PubMed] [Google Scholar]
- Gaser C, Dahnke R. CAT - A Computational Anatomy Toolbox for the Analysis of Structural MRI Data. doi: 10.1093/gigascience/giae049. n.d. [DOI] [PMC free article] [PubMed] [Google Scholar]
- Gould EM, Curto KA, Craig CR, Fleming WW, Taylor DA. The role of GABAA receptors in the subsensitivity of Purkinje neurons to GABA in genetic epilepsy prone rats. Brain Res. 1995;698:62–68. doi: 10.1016/0006-8993(95)00813-6. [DOI] [PubMed] [Google Scholar]
- Hayasaka S, Phan KL, Liberzon I, Worsley KJ, Nichols TE. Nonstationary cluster-size inference with random field and permutation methods. NeuroImage. 2004;22:676–687. doi: 10.1016/j.neuroimage.2004.01.041. [DOI] [PubMed] [Google Scholar]
- Hirsch E, Danober L, Simler S, Pereira de Vasconcelos A, Maton B, Nehlig A, Marescaux C, Vergnes M. The amygdala is critical for seizure propagation from brainstem to forebrain. Neuroscience. 1997;77:975–984. doi: 10.1016/S0306-4522(96)00503-9. [DOI] [PubMed] [Google Scholar]
- Iadarola MJ, Gale K. Substantia nigra: site of anticonvulsant activity mediated by gamma-aminobutyric acid. Science. 1982;218:1237–40. doi: 10.1126/science.7146907. [DOI] [PubMed] [Google Scholar]
- Jobe PC, Dailey JW. Genetically Epilepsy-Prone Rats (GEPRs) in Drug Research. CNS Drug Rev. 2006;6:241–260. doi: 10.1111/j.1527-3458.2000.tb00150.x. [DOI] [Google Scholar]
- Jobe PC, Laird HE, Ko KH, Ray T, Dailey JW. Abnormalities in monoamine levels in the central nervous system of the genetically epilepsy-prone rat. Epilepsia. 1982;23:359–366. doi: 10.1111/j.1528-1157.1982.tb05421.x. [DOI] [PubMed] [Google Scholar]
- Krook-Magnuson E, Szabo GG, Armstrong C, Oijala M, Soltesz I. Cerebellar Directed Optogenetic Intervention Inhibits Spontaneous Hippocampal Seizures in a Mouse Model of Temporal Lobe Epilepsy. eneuro. 2014:1. doi: 10.1523/ENEURO.0005-14.2014. ENEURO.0005-14.2014. [DOI] [PMC free article] [PubMed] [Google Scholar]
- Lasley SM. Roles of neurotransmitter amino acids in seizure severity and experience in the genetically epilepsy-prone rat. Brain Res. 1991;560:63–70. doi: 10.1016/0006-8993(91)91215-m. [DOI] [PubMed] [Google Scholar]
- Löscher W, Ferland RJ, Ferraro TN. The relevance of inter- and intrastrain differences in mice and rats and their implications for models of seizures and epilepsy. Epilepsy Behav. 2017;73:214–235. doi: 10.1016/j.yebeh.2017.05.040. [DOI] [PMC free article] [PubMed] [Google Scholar]
- Mango: Multi-image analysis GUI. University of Texas; n.d. [Google Scholar]
- Marescaux C, Vergnes M, Kiesmann M, Depaulis A, Micheletti G, Warter JM. Kindling of audiogenic seizures in Wistar rats: an EEG study. Exp Neurol. 1987;97:160–168. doi: 10.1016/0014-4886(87)90290-1. [DOI] [PubMed] [Google Scholar]
- Mengler L, Khmelinskii A, Diedenhofen M, Po C, Staring M, Lelieveldt BPF, Hoehn M. Brain maturation of the adolescent rat cortex and striatum: Changes in volume and myelination. NeuroImage. 2014;84:35–44. doi: 10.1016/j.neuroimage.2013.08.034. [DOI] [PubMed] [Google Scholar]
- Merrill MA, Clough RW, Jobe PC, Browning RA. Brainstem Seizure Severity Regulates Forebrain Seizure Expression in the Audiogenic Kindling Model. Epilepsia. 2005;46:1380–1388. doi: 10.1111/j.1528-1167.2005.39404.x. [DOI] [PubMed] [Google Scholar]
- Merrill MA, Clough RW, Jobe PC, Browning RA. Role of the superior colliculus and the intercollicular nucleus in the brainstem seizure circuitry of the genetically epilepsy-prone rat. Epilepsia. 2003;44:305–314. doi: 10.1046/j.1528-1157.2003.31802.x. [DOI] [PubMed] [Google Scholar]
- Merzin M. Volumest: Applying stereological method in radiology. Volume Measurement n.d. [Google Scholar]
- Millan MH, Meldrum BS, Boersma CA, Faingold CL. Excitant amino acids and audiogenic seizures in the genetically epilepsy-prone rat. II Efferent seizure propagating pathway. Exp Neurol. 1988;99:687–698. doi: 10.1016/0014-4886(88)90185-9. [DOI] [PubMed] [Google Scholar]
- Mishra PK, Dailey JW, Reigel CE, Jobe PC. Audiogenic convulsions in moderate seizure genetically epilepsy-prone rats (GEPR-3s) Epilepsy Res. 1989;3:191–198. doi: 10.1016/0920-1211(89)90023-5. [DOI] [PubMed] [Google Scholar]
- Molnar LR, Fleming WW, Taylor DA. Alterations in neuronal gamma-aminobutyric acid(A) receptor responsiveness in genetic models of seizure susceptibility with different expression patterns. J Pharmacol Exp Ther. 2000;295:1258–1266. [PubMed] [Google Scholar]
- Muñoz LJ, Carballosa-Gautam MM, Yanowsky K, García-Atarés N, López DE. The genetic audiogenic seizure hamster from Salamanca: The GASH:Sal. Epilepsy Behav EB. 2017;71:181–192. doi: 10.1016/j.yebeh.2016.03.002. [DOI] [PubMed] [Google Scholar]
- Naritoku DK, Mecozzi LB, Aiello MT, Faingold CL. Repetition of audiogenic seizures in genetically epilepsy-prone rats induces cortical epileptiform activity and additional seizure behaviors. Exp Neurol. 1992;115:317–324. doi: 10.1016/0014-4886(92)90197-x. [DOI] [PubMed] [Google Scholar]
- Nehlig A, Pereira de Vasconcelos A, Vergnes M, Boyet S, Marescaux C. Interictal cerebral metabolic levels in Wistar rats sensitive to audiogenic seizures. Brain Res. 1996;724:97–102. doi: 10.1016/0006-8993(96)00278-8. [DOI] [PubMed] [Google Scholar]
- Nemoto K, Dan I, Rorden C, Ohnishi T, Tsuzuki D, Okamoto M, Yamashita F, Asada T. Lin4Neuro: a customized Linux distribution ready for neuroimaging analysis. BMC Med Imaging. 2011;11 doi: 10.1186/1471-2342-11-3. [DOI] [PMC free article] [PubMed] [Google Scholar]
- N’Gouemo P, Faingold CL. The periaqueductal grey is a critical site in the neuronal network for audiogenic seizures: modulation by GABA(A), NMDA and opioid receptors. Epilepsy Res. 1999;35:39–46. doi: 10.1016/s0920-1211(98)00128-4. [DOI] [PubMed] [Google Scholar]
- N’gouemo P, Faingold CL, Morad M. Calcium channel dysfunction in inferior colliculus neurons of the genetically epilepsy-prone rat. Neuropharmacology. 2009;56:665–675. doi: 10.1016/j.neuropharm.2008.11.005. [DOI] [PMC free article] [PubMed] [Google Scholar]
- Oguz I, Yaxley R, Budin F, Hoogstoel M, Lee J, Maltbie E, Liu W, Crews FT. Comparison of Magnetic Resonance Imaging in Live vs. Post Mortem Rat Brains. PLoS ONE. 2013;8:e71027. doi: 10.1371/journal.pone.0071027. [DOI] [PMC free article] [PubMed] [Google Scholar]
- Paxinos G, Watson C, Calabrese E, Badea A, Johnson GA. MRI/DTI atlas of the rat Brain. Elsevier, Academic Press; London; San Diego: 2015. [Google Scholar]
- Pfefferbaum A, Adalsteinsson E, Sullivan EV. In vivo structural imaging of the rat brain with a 3-T clinical human scanner. J Magn Reson Imaging. 2004;20:779–785. doi: 10.1002/jmri.20181. [DOI] [PubMed] [Google Scholar]
- Poletaeva II, Surina NM, Kostina ZA, Perepelkina OV, Fedotova IB. The Krushinsky-Molodkina rat strain: The study of audiogenic epilepsy for 65years. Epilepsy Behav EB. 2017;71:130–141. doi: 10.1016/j.yebeh.2015.04.072. [DOI] [PubMed] [Google Scholar]
- Raisinghani M. Glutamatergic activation of the amygdala differentially mimics the effects of audiogenic seizure kindling in two substrains of genetically epilepsy-prone rats. Exp Neurol. 2003;183:516–522. doi: 10.1016/S0014-4886(03)00177-8. [DOI] [PubMed] [Google Scholar]
- Raisinghani M, Faingold CL. Neurons in the amygdala play an important role in the neuronal network mediating a clonic form of audiogenic seizures both before and after audiogenic kindling. Brain Res. 2005;1032:131–140. doi: 10.1016/j.brainres.2004.11.007. [DOI] [PubMed] [Google Scholar]
- Raisinghani M, Faingold CL. Identification of the requisite brain sites in the neuronal network subserving generalized clonic audiogenic seizures. Brain Res. 2003;967:113–122. doi: 10.1016/s0006-8993(02)04232-4. [DOI] [PubMed] [Google Scholar]
- Ribak CE. An abnormal GABAergic system in the inferior colliculus provides a basis for audiogenic seizures in genetically epilepsy-prone rats. Epilepsy Behav EB. 2017;71:160–164. doi: 10.1016/j.yebeh.2015.02.024. [DOI] [PMC free article] [PubMed] [Google Scholar]
- Ribak CE, Byun MY, Ruiz GT, Reiffenstein RJ. Increased levels of amino acid neurotransmitters in the inferior colliculus of the genetically epilepsy-prone rat. Epilepsy Res. 1988a;2:9–13. doi: 10.1016/0920-1211(88)90003-4. [DOI] [PubMed] [Google Scholar]
- Ribak CE, Khurana V, Lien NT. The effect of midbrain collicular knife cuts on audiogenic seizure severity in the genetically epilepsy-prone rat. J Hirnforsch. 1994;35:303–311. [PubMed] [Google Scholar]
- Ribak CE, Roberts RC, Byun MY, Kim HL. Anatomical and behavioral analyses of the inheritance of audiogenic seizures in the progeny of genetically epilepsy-prone and Sprague-Dawley rats. Epilepsy Res. 1988b;2:345–355. doi: 10.1016/0920-1211(88)90046-0. [DOI] [PubMed] [Google Scholar]
- Roberts RC, Kim HL, Ribak CE. Increased numbers of neurons occur in the inferior colliculus of the young genetically epilepsy-prone rat. Brain Res. 1985a;355:277–281. doi: 10.1016/0165-3806(85)90050-1. [DOI] [PubMed] [Google Scholar]
- Roberts RC, Ribak CE, Oertel WH. Increased numbers of GABAergic neurons occur in the inferior colliculus of an audiogenic model of genetic epilepsy. Brain Res. 1985b;361:324–338. doi: 10.1016/0006-8993(85)91303-4. [DOI] [PubMed] [Google Scholar]
- Romcy-Pereira RN, Garcia-Cairasco N. Hippocampal cell proliferation and epileptogenesis after audiogenic kindling are not accompanied by mossy fiber sprouting or Fluoro-Jade staining. Neuroscience. 2003;119:533–546. doi: 10.1016/s0306-4522(03)00191-x. [DOI] [PubMed] [Google Scholar]
- Ross K, Coleman J. Developmental and genetic audiogenic seizure models: behavior and biological substrates. Neurosci Biobehav Rev. 2000;24:639–653. doi: 10.1016/S0149-7634(00)00029-4. [DOI] [PubMed] [Google Scholar]
- Rossetti F, Rodrigues MCA, de Oliveira JAC, Garcia-Cairasco N. Behavioral and EEG effects of GABAergic manipulation of the nigrotectal pathway in the Wistar audiogenic rat strain. Epilepsy Behav EB. 2011;22:191–199. doi: 10.1016/j.yebeh.2011.06.033. [DOI] [PubMed] [Google Scholar]
- Shehab S, Simkins M, Dean P, Redgrave P. The dorsal midbrain anticonvulsant zone–I. Effects of locally administered excitatory amino acids or bicuculline on maximal electroshock seizures. Neuroscience. 1995;65:671–679. doi: 10.1016/0306-4522(94)00515-7. [DOI] [PubMed] [Google Scholar]
- Soper C, Wicker E, Kulick CV, N’Gouemo P, Forcelli PA. Optogenetic activation of superior colliculus neurons suppresses seizures originating in diverse brain networks. Neurobiol Dis. 2016;87:102–115. doi: 10.1016/j.nbd.2015.12.012. [DOI] [PMC free article] [PubMed] [Google Scholar]
- Statnick MA, Dailey JW, Jobe PC, Browning RA. Abnormalities in brain serotonin concentration, high-affinity uptake, and tryptophan hydroxylase activity in severe-seizure genetically epilepsy-prone rats. Epilepsia. 1996;37:311–321. doi: 10.1111/j.1528-1157.1996.tb00565.x. [DOI] [PubMed] [Google Scholar]
- Terra VC, Garcia-Cairasco N. NMDA-dependent audiogenic seizures are differentially regulated by inferior colliculus subnuclei. Behav Brain Res. 1994;62:29–39. doi: 10.1016/0166-4328(94)90035-3. [DOI] [PubMed] [Google Scholar]
- Terra VC, Garcia-Cairasco N. Neuroethological evaluation of audiogenic seizures and audiogenic-like seizures induced by microinjection of bicuculline into the inferior colliculus. II Effects of nigral clobazam microinjections. Behav Brain Res. 1992;52:19–28. doi: 10.1016/s0166-4328(05)80321-3. [DOI] [PubMed] [Google Scholar]
- Totola LT, Takakura AC, Oliveira JAC, Garcia-Cairasco N, Moreira TS. Impaired central respiratory chemoreflex in an experimental genetic model of epilepsy. J Physiol. 2017;595:983–999. doi: 10.1113/JP272822. [DOI] [PMC free article] [PubMed] [Google Scholar]
- Tsutsui J, Terra VC, Oliveira JA, Garcia-Cairasco N. Neuroethological evaluation of audiogenic seizures and audiogenic-like seizures induced by microinjection of bicuculline into the inferior colliculus. I Effects of midcollicular knife cuts. Behav Brain Res. 1992;52:7–17. doi: 10.1016/s0166-4328(05)80320-1. [DOI] [PubMed] [Google Scholar]
- Tu TW, Turtzo LC, Williams RA, Lescher JD, Dean DD, Frank JA. Imaging of Spontaneous Ventriculomegaly and Vascular Malformations in Wistar Rats: Implications for Preclinical Research. J Neuropathol Exp Neurol. 2014;73:1152–1165. doi: 10.1097/NEN.0000000000000140. [DOI] [PMC free article] [PubMed] [Google Scholar]
- Turski L, Meldrum BS, Cavalheiro EA, Calderazzo-Filho LS, Bortolotto ZA, Ikonomidou-Turski C, Turski WA. Paradoxical anticonvulsant activity of the excitatory amino acid N-methyl-D-aspartate in the rat caudate-putamen. Proc Natl Acad Sci U A. 1987;84:1689–93. doi: 10.1073/pnas.84.6.1689. [DOI] [PMC free article] [PubMed] [Google Scholar]
- Umeoka EHL, Garcia SB, Antunes-Rodrigues J, Elias LLK, Garcia-Cairasco N. Functional characterization of the hypothalamic–pituitary–adrenal axis of the Wistar Audiogenic Rat (WAR) strain. Brain Res. 2011;1381:141–147. doi: 10.1016/j.brainres.2011.01.042. [DOI] [PubMed] [Google Scholar]
- Valdés-Hernández PA, Sumiyoshi A, Nonaka H, Haga R, Aubert-Vásquez E, Ogawa T, Iturria-Medina Y, Riera JJ, Kawashima R. An in vivo MRI Template Set for Morphometry, Tissue Segmentation, and fMRI Localization in Rats. Front Neuroinformatics. 2011;5:26. doi: 10.3389/fninf.2011.00026. [DOI] [PMC free article] [PubMed] [Google Scholar]
- Vergnes M, Kiesmann M, Marescaux C, Depaulis A, Micheletti G, Warter JM. Kindling of audiogenic seizures in the rat. Int J Neurosci. 1987;36:167–176. doi: 10.3109/00207458709058791. [DOI] [PubMed] [Google Scholar]
- Vismer MS, Forcelli PA, Skopin MD, Gale K, Koubeissi MZ. The piriform, perirhinal, and entorhinal cortex in seizure generation. Front Neural Circuits. 2015;9:27. doi: 10.3389/fncir.2015.00027. [DOI] [PMC free article] [PubMed] [Google Scholar]
- Yeh FC. DSIstudio n.d. [Google Scholar]