

Abstract
Objective
To determine whether the extent of overlap of the genetic architecture among the sporadic late-onset Alzheimer’s Disease (sLOAD), familial late-onset AD (fLOAD), sporadic earlyonset AD (sEOAD), and autosomal dominant early-onset AD (eADAD).
Methods
Polygenic risk scores (PRSs) were constructed using previously identified 21 genome-wide significant loci for LOAD risk.
Results
We found that there is an overlap in the genetic architecture among sEOAD, fLOAD, and sLOAD. The highest association of the PRS and risk (odds ratio [OR] = 2.27; P = 1.29 × 10⁻⁷) was observed in sEOAD, followed by fLOAD (OR = 1.75; P = 1.12 × 10⁻⁷) and sLOAD (OR = 1.40; P = 1.21 × 10⁻³). The PRS was associated with cerebrospinal fluid ptau181-Aβ42 on eADAD (P = 4.36 × 10⁻²).
Conclusion
Our analysis confirms that the genetic factors identified for LOAD modulate risk in sLOAD and fLOAD and also sEOAD cohorts. Specifically, our results suggest that the burden of these risk variants is associated with familial clustering and earlier onset of AD. Although these variants are not associated with risk in the eADAD, they may be modulating age at onset.
Keywords: Polygenic risk score, Sporadic late-onset Alzheimer’s disease, Early-onset Alzheimer’s disease, Early-onset autosomal dominant, Late-onset Alzheimer’s disease, Dominantly inherited Alzheimer network, APOE, APP, PSEN1, PSEN2, Genetic architecture, Area under the curve, Genetic risk factor, Disease modifier, Age at onset, Cerebrospinal fluid, Aβ, Tau
1. Introduction
Alzheimer’s disease (AD) is the most common form of dementia. In AD, the onset of cognitive impairment is preceded by a long preclinical phase, lasting approximately 15 to 20 years [1]. There is a large variability in the age at onset (AAO) of AD, and only a small fraction of cases (1%) present clinical symptoms at an early AAO (before the age of 65 years). AD has a substantial but heterogeneous genetic component. Mutations in the amyloid β precursor protein (APP) and presenilin genes [2–6] cause the Mendelian forms of AD. Although autosomal dominant AD typically is associated with early symptoms onset (autosomal dominant early-onset AD [eADAD]), some families that carry known pathogenic mutations present a late onset (onset >65–70 years) [7], suggesting a continuum between late and early onset. In addition, a large proportion of AD cases with strong familial history of dementia also present a late onset and a complex genetic architecture (familial late-onset AD [fLOAD]) [8].
Most of the sporadic AD cases present a late onset (sporadic LOAD [sLOAD]) [9] but occasionally can present an early onset (sporadic early-onset AD [sEOAD]). The apolipoprotein E (APOE) ε4 allele increases risk for sEOAD, sLOAD [6], and also for fLOAD [7,10] (3-fold effect size for heterozygous carriers and 12-fold for homozygous carriers [11,12]). More recent genome-wide association studies (GWASs) of LOAD have identified additional loci with moderate protective and risk effects [13–18]. The International Genomics of Alzheimer’s Project study is a case control GWAS meta-analysis includes late-onset cases from both unrelated and familial studies. Further studies suggest that polygenic risk scores (PRSs) created based on the 21 genome-wide loci capture the overall genetic architecture of LOAD and may help to predict AD risk [10,19,20].
The PRS aggregates the effects that multiple genetic markers (both protective and risk variants) confer to individuals for a specific complex trait [21]. When employed as biomarkers, PRS can provide important insights about the prognosis of the disease and can highlight early intervention strategies as well as inclusion criteria for targeted enrollment in clinical trials. Furthermore, PRS can be employed as a measure to identify the extent of overlap between the genetic architecture of comorbid complex traits [22]. This is done by evaluating the pleiotropic effects that the markers identified in one trait have in another trait, usually evaluated in an independent cohort [20]. For example, this approach has been employed to study the shared genetic architecture between schizophrenia and cognitive function, as well as between depressive disorder and body mass index [22].
Although multiple studies have analyzed the effect of PRS in sLOAD [19,20] or fLOAD [8] cases, no study have used the PRS to compare the relative burden of risk variants in the familial versus the sporadic late-onset forms. Neither has been compared the genetic architecture of the early- versus the late-onset forms of the disease both in the familial and sporadic presentation. Therefore, a thorough evaluation of these variants will help us understand the extent of the genetic architecture shared among the different classifications of AD.
We analyzed the extent of overlap in the genetic architecture of sLOAD, fLOAD, sEOAD, and eADAD. To do so, we derived the PRS from common variants identified in the GWAS of LOAD [18] and tested it in cohorts of affected participants with European ancestry with early- and late-onset in both familial and sporadic studies. Then we tested the association of the PRS with the clinical status in each of these. Finally, we explored whether the PRS is modulating additional aspects of AD, and evaluated its association with the AAO.
2. Materials and methods
2.1. Samples
We included participants with European ancestry from the Knight-Alzheimer’s Disease Research Center (Knight-ADRC) and the Dominantly Inherited Alzheimer Network (DIAN) study at Washington University [23], the Alzheimer’s Disease Neuroimaging Initiative (ADNI) [24], and the National Institute on Aging Genetics Initiative for Late-Onset Alzheimer’s Disease (NIA-LOAD) [25].
2.1.1. Cohorts
2.1.1.1. Autosomal dominant early-onset AD
eADAD are defined as affected participants who carry known highly penetrant mutations in the presenilin or APP genes. All the samples were selected from the DIAN study.
2.1.1.2. Familial LOAD
fLOAD includes affected subjects from families with a recorded family history of AD. To be considered a fLOAD, two siblings were required to have a diagnosis of definite or probable LOAD (onset >65 years) and a third biologically-related family member (first, second, or third degree) was also required, regardless of cognitive status. Only one proband per family was included. All the samples were selected from the NIA-LOAD study.
2.1.1.3. Sporadic EOAD
sEOAD were defined as participants with diagnosis of AD, with an AAO <65 years without documented familial history of AD. Samples were selected from the Knight-ADRC and ADNI.
2.1.1.4. Sporadic LOAD
sLOAD defined as participants with a clinical diagnosis of probable AD, AAO >65 years, and insufficient family history to qualify under the fLOAD criteria. Samples were selected from the Knight-ADRC and ADNI.
2.1.1.5. Controls
Controls were defined as individuals older than 65 years who after neurological assessment were determined to be nonaffected. Unrelated samples were selected from the Knight-ADRC and ADNI.
We included 236 sEOAD, 1021 sLOAD, and 687 controls from the Knight-ADRC; 122 sEOAD, 226 sLOAD, and 324 cognitively normal controls from ADNI; 1220 unrelated fLOAD from the NIA-LOAD and 249 eADAD (mutation carriers from the DIAN study).
2.1.2. Description of the AD data sets
Knight-ADRC research participants were evaluated by Clinical Core Personnel at Washington University. All the cases received a diagnosis of dementia of the Alzheimer’s type, using criteria equivalent to the National Institute of Neurological and Communication Disorders and Stroke-Alzheimer’s Disease and Related Disorders Association for probable AD [26,27] and their severity, was determined using the Clinical Dementia Rating (CDR) [28]. Controls received the same assessment as the cases but were nondemented (CDR = 0). Neuropsychological and clinical assessments and biological samples were collected for all participants as described previously [29–34]. Potential family history was obtained for all participants. Written consent was obtained from all participants. ADNI individuals were evaluated as described in the ADNI procedures manual (www.adni-info.org).
Affected participants from the NIA-LOAD Family Study had been diagnosed with AD dementia (National Institute of Neurological and Communication Disorders and Stroke-Alzheimer’s Disease and Related Disorders Association) for probable AD [27]. All individuals had a family history of AD. Probands were required to have a diagnosis of definite or probable LOAD (onset >60 years) and a sibling with definite, probable or possible LOAD with a similar AAO. A third biologically related family member (first, second, or third degree) was also required, regardless of cognitive status. If unaffected, this individual had to be ≥60 years of age, but ≥50 years of age if diagnosed with AD or mild cognitive impairment. Within each pedigree, we selected a single individual to screen by identifying the youngest affected family member with the most definitive diagnosis (i.e., individuals with autopsy confirmation were chosen over those with clinical diagnosis only).
Finally, eADAD participants (n = 249) were drawn from the DIAN [1,35]. Individuals at risk for carrying a mutation for autosomal dominant AD (i.e., PSEN1, PSEN2, or APP) mutations were enrolled in the DIAN study. Participants from families with known pathogenic eADAD mutations were recruited from 197 families at six sites in the USA, one in the UK, and three in Australia [1,35]. The process of recruitment and enrollment has been described in detail previously [1,35].
2.2. Genotyping platforms and proxy selection
Table 1 summarizes the demographic and clinical characteristics of each clinical group. The Institutional Review Board of all participating institutions approved the study.
Table 1.
Demographics of the cohorts
| Cohort | N | Female (%) | Age (SD)* | APOE ε4+ (%)† |
|---|---|---|---|---|
| Autosomal dominant early onset (DIAN) | 249 | 57.03 | 37.16 (14.03) | 27.18 |
| Sporadic early onset | 358 | 49.17 | 60.41 (4.83) | 62.74 |
| Familial late onset | 1220 | 63.10 | 75.30 (8.34) | 74.08 |
| Sporadic late onset | 1247 | 57.30 | 76.18 (7.00) | 58.27 |
| Nondemented (controls) | 1011 | 56.38 | 77.03 (7.05) | 31.22 |
Abbreviations: DIAN, Dominantly Inherited Alzheimer Network; SD, standard deviation.
Age at onset for affected participants and age of last assessment for non-demented subjects and for DIAN participants’ age of recruitment.
Percentage of participants’ carriers of APOE ε4 allele.
The fLOAD cohort is part of NIA-LOAD and was genotyped as described previously [9]. Participants, from the Knight-ADRC, DIAN, and ADNI, were genotyped with the Illumina 610 chip, Omni-express chip, or HumanCore Exome (Illumina, San Diego, CA, USA). All samples were imputed using SHAPEIT/IMPUTE2 [36,37] with the 1000 Genomes Project as reference panel [38]. We discarded genotypes that did not pass quality criteria and retained those with dosage levels >0.9 across all three genotype possibilities and an information score filter >0.3.
In addition, we performed gender verification and tested for duplicates and unexpected familial relatedness, which were removed from our analysis, by estimating the pairwise genome-wide estimates of the proportion identity-by-descent. We performed standard quality control procedures on each genotyping array separately before combining data. A call rate ≥98% was applied for single-nucleotide polymorphisms (SNPs) and individuals. SNPs not in Hardy-Weinberg equilibrium (P < 1 × 10⁻⁶) or with minor allele frequency (MAF) <0.02 were excluded. We inferred the population structure and confirmed the ethnicity of participants by calculating the principal components using PLINK v1.9 (http://www.cog-genomics.org/plink2) (Supplementary Fig. 1). Only individuals who clustered within the European-American samples were included in the study.
APOE genotype was determined for all individuals [33]. Briefly, APOE ε2, ε3, and ε4 isoforms were determined by genotyping rs7412 and rs429358 using TaqMan genotyping technology as previously described [33,39].
We employed proxy SNPs to tag the genome-wide significant loci reported for sLOAD [18] that did not pass our quality control process (Supplementary Table 1). We selected the SNPs with the highest genotyping rates, the highest R2 and D’ values (in both imputed data and in the 1000 genomes) to the reported SNPs in the IGAP study [18].
2.3. Screening of mutation in known AD or FTD genes
We sequenced the most common genes that carry pathogenic variants for AD and frontotemporal dementia (FTD). We restricted our analysis to those genes listed in the AD&FTD Mutation Database (http://www.molgen.vib-ua.be/ADMutations, accessed November, 2016), particularly, we focused on APP, PSEN1, and PSEN2 for AD and GRN, MAPT, C9ORF72, CHMP2B, FUS, TARDBP, TBK1, and VCP for FTD. The genotypes were obtained sequencing all the Mendelian genes as described elsewhere [7]. The presence of the C9ORF72 expanded hexanucleotide repeat and the number repeats for the longest allele was determined by previously reported methods [40,41].
2.4. Computation of PRS
We derived a weighted PRS [21], modeling the odd ratios (ORs) as reported in IGAP study [18] (Supplementary Table 1) using a logarithm of base 2 transformation. SNPs utilized for the score would either need to have a high genotyping rate (greater than 90%) or otherwise be a reasonable proxy to the IGAP hits. We utilized PLINK v1.90b3.42 to calculate the PRS choosing the score function and the no-mean-imputation option to ensure that no scores would be imputed. The resulting mean was corrected by the multiplying allele count (log OR score).
2.5. Statistical analysis
The association of the PRS with case-control status was tested using a logistic regression, including age and gender as covariates. All samples within each data set were included in this analysis. Age was not included as a covariate in the eADAD analyses because the autosomal dominant AD cases were significantly younger (by design) than the controls.
The area under the curve (AUC) for receiver operating characteristic (ROC) analysis was calculated for the entire range of PRS included in each of the cohorts using the R package pROC v1.8, correcting for the same covariates as the logistic model. The areas obtained for the models were compared using the function roc.test.
To compare the effect of the PRS between the different data sets, we calculated the OR of the PRS by comparing the first versus the last tertile using logistic regression (The R Foundation for Statistical Computing v3.3.1). To analyze the eADAD cohort, we employed the functions glmer and lmer (package gee 4.13.19) clustering at family level to ascertain the effect of the PRS on clinical status and cerebrospinal fluid (CSF) biomarkers, respectively. The statistical significance between the effects of the cohorts was calculated deriving the Z-score of the absolute difference of the ORs, corrected by its standard error.
For all analyses, we employed multiple models to investigate the extent of overlap of the genetic architecture of AD under different scenarios: model 1, model 2, and model 3.
Model 1 includes the calculated PRS correcting for sex and study as well as age for the late-onset cohorts.
Model 2 extends model 1 by incorporating the effects of APOE ε2 and ε4 genotypes as covariates, which are also weighted by logarithm base 2 of the ORs (i.e., ε2/ε2 = 0.6; ε2/ε3 = 0.6; ε2/ε4 = 2.6; ε3/ε4 = 3.2; ε4/ε4 = 14.9) as previously reported [11]. Sex, study, and age (for the late-onset cohorts) are also included as covariates in the model 2.
In model 3, the effects of APOE alleles are included into the PRS, and we also corrected for sex, study, and age (for the late-onset cohorts).
Quantile regression [42] models for the relation between the PRS and the AAO for sporadic early- and late-onset participants were calculated for the 5-quantiles (quintiles) using the R package quantreg v5.29.
2.6. Analyte measurement
CSF tau, phosphorylated tau-181 (ptau181), and amyloid β 42 (Aβ42)—markers of neuronal injury, neurofibrillary tangles, and amyloid, respectively—were measured in the DIAN study. Biomarker values were measured following internal standards and controls [43,44]. CSF was collected in the morning under fasting conditions by means of lumbar puncture. Samples were shipped on dry ice to the DIAN biomarker core laboratory. Concentrations in the CSF of Aβ1-42, total tau, and tau phosphorylated at threonine 181 were measured by immunoassay (INNOTEST amyloid β1-42 and INNO-BIA AlzBio3; Innogenetics). All values had to meet quality-control standards, including a coefficient of variation of 25% or less, kit “controls” within the expected range as defined by the manufacturer, and measurement consistency between plates of a common sample that was included in each run. CSF values were normalized as previously described [33,45] before analyses.
2.7. ADNI material and methods
Data used in the preparation of this article were obtained from the ADNI database (www.loni.ucla.edu/ADNI). The ADNI was launched in 2003 by the National Institute on Aging, the National Institute of Biomedical Imaging and Bioengineering, the Food and Drug Administration, private pharmaceutical companies, and nonprofit organizations, as a $60 million, 5-year public-private partnership. The principal investigator of this initiative is Michael W. Weiner, M.D. ADNI is the result of efforts of many co-investigators from a broad range of academic institutions and private corporations, and subjects have been recruited from over 50 sites across the United States and Canada. The initial goal of ADNI was to recruit 800 adults, ages 55 to 90 years, to participate in the research; approximately 200 cognitively normal older individuals to be followed for 3 years, 400 people with MCI to be followed for 3 years, and 200 people with early AD to be followed for 2 years. For up-to-date information see www.adni-info.org.
3. Results
3.1. The PRS derived from genome-wide meta-analysis studies has similar effect for fLOAD and sLOAD
We initially verified the prediction accuracy of the PRS by ascertaining the cohort of sLOAD from the Knight-ADRC and ADNI participants. We observed that the PRS is significantly associated with clinical status for sLOAD (model 1: OR = 1.40; P = 1.21 × 10⁻³; Table 2). Given the strong effect that APOE genotypes have on LOAD, we ascertained the association of the PRS correcting for the effects of APOE genotypes (model 2). We observed a similar OR = 1.41 (P = 1.33 × 10⁻³; Table 2) that was not significantly different to the OR estimated when APOE was not included as a covariate (Pmodel 1 vs model 2 = .94). Then, we extended the PRS to reflect the risk and protection effects of the ε4 and ε2 genotypes (model 3). The addition of the APOE genotype increased the effect of the PRS (OR = 4.01; P = 5.29 × 10⁻³⁴; Table 2).
Table 2.
Association results of the logistic regression models for extreme tertiles of the PRS derived for each of the cohorts and compared to nondemented participants*
| Cohort | PRS (model 1)
|
PRS APOE corrected (model 2)
|
PRS with APOE effects (model 3)
|
|||
|---|---|---|---|---|---|---|
| OR | P | OR | P | OR | P | |
| Autosomal dominant early-onset AD | 0.96 | 9.73 × 10⁻¹ | 0.98 | 9.92 × 10⁻¹ | 0.98 | 9.66 × 10⁻¹ |
| Sporadic early-onset AD | 2.27 | 1.29 × 10⁻⁷ | 2.21 | 1.59 × 10⁻⁶ | 6.44 | 5.80 × 10⁻²⁶ |
| Familial late-onset AD | 1.75 | 1.12 × 10⁻⁷ | 2.01 | 1.29 × 10⁻⁶ | 7.85 | 2.52 × 10−48 |
| Sporadic late-onset AD | 1.40 | 1.21 × 10⁻³ | 1.41 | 1.33 × 10⁻³ | 4.01 | 5.29 × 10⁻³⁴ |
Abbreviations: AD, Alzheimer’s disease; APOE, apolipoprotein E; PRS, polygenic risk score.
The models correct for the sex and contributing study for the early-onset data sets and also age at onset or age of last assessment for the late-onset. The PRS was analyzed by itself (model 1). Model 2 extends it and corrects for the effects of APOE genotypes, modeling them as covariates. In the model 3, the PRS includes the risk and protection conferred by APOE genotypes. These results are a product of analyzing the tertiles with lowest and highest PRS (Please refer to Supplementary Table 3 for the analysis done in the entire range of PRS scores).
The ROC analysis revealed an AUC (model 3 AUC = 0.67; 95% CI = 0.65–0.69; Fig. 1), which resembles the results of other studies [10,20]. (Please refer to Supplementary Fig. 2 for the ROC curves of additional models.)
Fig. 1.
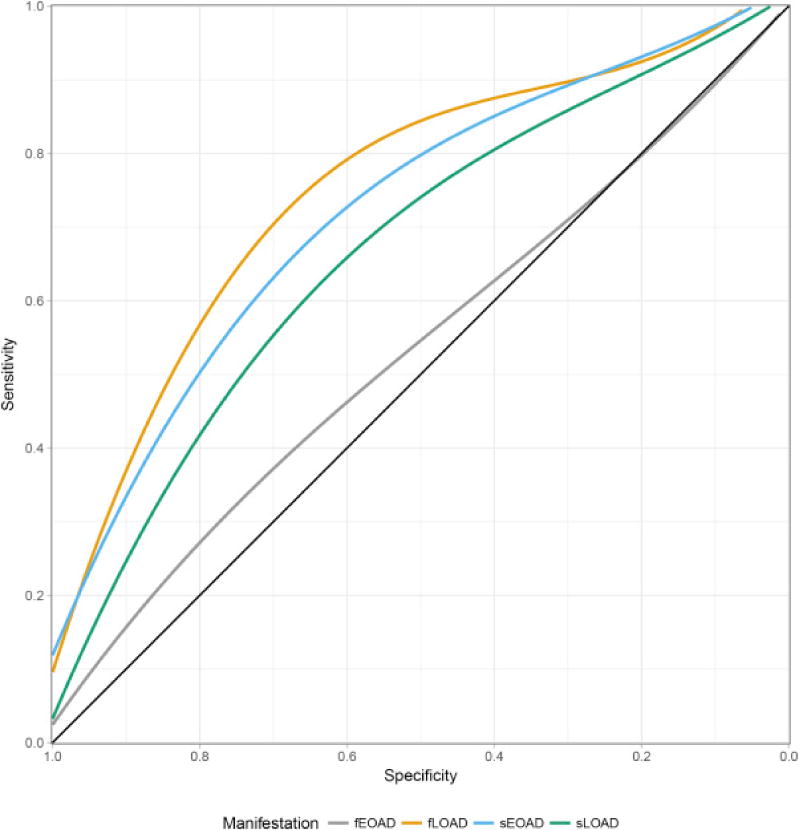
Receiver operating characteristics—Area under the curve for the different cohorts analyzed. The lines correspond for the accuracy of obtained for the models that included gender, study, age (for late-onset data sets), and APOE ε4/ε2 alleles. Abbreviations: fEOAD, familial early-onset Alzheimer’s disease; fLOAD, familial late-onset Alzheimer’s disease; sEOAD, sporadic early-onset Alzheimer’s disease; sLOAD, sporadic late-onset Alzheimer’s disease.
The PRS was also significantly associated with risk in the fLOAD cohort (model 1: OR = 1.75; P = 1.12 × 10⁻⁷; Table 2). The OR of the PRS for the fLOAD did not change when we corrected for the APOE genotypes (Pmodel 1 vs model 2 = .44). The effect of the PRS with fLOAD was similar to that seen for sLOAD, and the strength of the association of the PRS was not statistically different (ORsLOAD = 1.40 vs. ORfLOAD = 1.75; P = .13).
The model 3, which includes the effects of APOE ε2 and ε4 genotypes into the PRS, showed an OR = 7.85 (P = 2.52 × 10−48; Table 2) for the fLOAD, which is significantly higher than the OR calculated for the sLOAD (ORsLOAD = 4.01 vs. ORfLOAD = 7.85; P = 3.01 × 10⁻³). The AUC (model 3) for the fLOAD = 0.75 (95% CI = 0.73–0.78; Fig. 1) was also significantly higher than the AUC for sLOAD (Venkatraman’s test, P < 2.2 × 10⁻¹⁶). This difference is driven by a higher number of APOE ε4 carriers in the fLOAD cohort (Table 1), as previously reported [7].
3.2. The effect of the PRS is significantly higher for sEOAD than for the fLOAD or sLOAD
To study possible effects that the PRS might have for sEOAD, we analyzed a cohort of participants with sEOAD included in the Knight-ADRC and ADNI studies. None of these participants carry a pathogenic mutation in the known AD or FTD genes [7,41]. We derived the PRS and included elderly nondemented participants as controls. Thus, the statistical model corrects for sex, but not age. We observed an increased OR associated with the PRS (model 1: OR = 2.27; P = 1.29 × 10⁻⁷; Table 2), which did not differ significantly when we corrected for the effect of APOE genotypes (Pmodel 1 vs model 2 = .91; see Table 2). However, the OR for the sEOAD was significantly higher than the OR estimated for the fLOAD cohort (ORsLOAD = 1.40 vs. ORsEOAD = 2.27; P = 9.78 × 10⁻³) and sLOAD (ORfLOAD = 1.75 vs. ORsEOAD = 2.27; P = 9.88 × 10⁻³).
We also observed an increased OR when the effects of APOE alleles were included into the PRS (model 3: OR = 6.44; P = 5.80 × 10⁻²⁶; Table 2). The OR of the PRS with APOE for the sEOAD was also significantly higher than the OR calculated for the sLOAD (ORsLOAD = 4.01 vs. ORfLOAD = 6.44; P = 2.45 × 10⁻²), but not for the fLOAD. This is driven by the high enrichment of APOE ε4 alleles in the familial cases. Consistently with these analyses, the ROC analysis for model including the PRS and APOE revealed a better performance for the sEOAD AUC = 0.72 (95% CI = 0.69–0.76; Fig. 1) compared with the sLOAD (AUC = 0.67; Venkatraman’s test P = 2.00 × 10⁻³; Fig. 1).
To confirm that the sEOAD cases have a higher genetic burden than the sLOAD, we compared the PRS of the sEOAD versus the sLOAD directly, instead of comparing the OR. We observed that the PRS for sEOAD is significantly higher than that for sLOAD (model 1 P = 1.95 × 10⁻³ and model 2 P = 9.04 × 10⁻³), suggesting that these loci could explain in part the earlier onset of these cases. We observed similar results for the analysis of sEOAD cases restricted to an AAO >60 years (data not shown).
3.3. PRS is associated with the AAO for the AD cases with sporadic AD
The increased OR that the PRS showed for clinical status when analyzing the sEOAD compared with the one obtained for the sLOAD led us to question the possible association of PRS with the AAO. In particular, we hypothesized that the additive effects of the genome-wide significant loci identified for LOAD would affect the AAO of AD for participants from unrelated studies, regardless of the classification of the onset of symptoms (i.e., early vs. late).
We initially verified that in our cohort of sLOAD, the PRS was associated with AAO, and as expected, a lower AAO was associated with higher PRS (model 1 P = 1.52 × 10⁻²⁸; 6.3 months lower AAO per standard deviation [SD] increase of PRS; model 2 P = 7.62 × 10⁻³ and 6 months lower AAO). In contrast, the analysis within the sEOAD cohort did not show a significant association (model 1 P = .37 and model 2 P = .33). However, this lack of association could be due to the lower variability of the AAO in the sEOAD.
To test this hypothesis, we investigated the effect of PRS on AAO in all sporadic AD cases (including all early- and late-onset cases) in specific quantiles of the AAO. We employed quantile regression analysis to model the association of the PRS to 5-quantiles (quintiles) of AAO [46]. This analysis showed that for all the quintiles, the PRS is significantly associated with AAO (P <.05; Supplementary Table 2 panel A). Our analyses revealed that all the coefficient estimates fall within the confidence intervals of the ordinary least squares method employed to solve linear regressions (Supplementary Fig. 3), indicating that (1) a linear regression analysis should be sufficient to analyze the association between the PRS and the entire range of AAO (lower 10.9 months per unit of SD of the PRS; model 1 P = 1.06 × 10⁻⁴) and (2) this association is not driven exclusively by the cases with older AAO, but all the cases (both early- and late-onset cases). We observed similar results when we modeled the effects of APOE as covariates (10.3 months lower AAO per SD increase of PRS; model 2 P = 1.52 × 10⁻⁴; see Supplementary Table 2 panel B for the quantile regression P-values and Supplementary Fig. 3).
These analyses indicate that the genetic factors identified for LOAD not only increase the risk for sEOAD but also their additive effects modulate the entire spectrum of AAO of sporadic AD cases.
3.4. PRS is not associated with risk for eADAD but shows a significant association with CSF ptau181-Aβ42 ratio
We derived the PRS, based on the genetic factors identified for LOAD, for DIAN participants. The DIAN cohort includes subjects with autosomal dominant AD, and our analyses are restricted to carriers of known pathogenic mutations in APP, PSEN1, or PSEN2 genes. We calculated the PRS for these subjects along with elderly nondemented participants, which we employed as controls. In a similar approach to the one we employed for the sEOAD, age was not included in the model, as by design of the test, it predicts perfectly the case-control status. Our analysis did not show any significant association of the PRS with the clinical status for this cohort (model 1: OR = 0.96; P = 9.73 × 10⁻¹; Table 2). Neither did we observe a significant association of the PRS when we incorporated the risk conferred by the APOE ε4 and ε2 alleles into the PRS (model 3: OR = 0.98; P = 9.66 × 10⁻¹; Table 2). Nevertheless, we observed that the PRS is associated with the CSF ptau181-Aβ42 ratio (β = 0.18; P = 4.36 × 10⁻²) and also CSF tau (β = 0.08; P = 4.27 × 10⁻²) in the eADAD affected participants included in the DIAN study. The CSF ptau181-Aβ42 ratio was previously shown to be a strong predictor of both the progression of cognitively normal subjects to very mild or mild dementia [47] and the rate of decline across time in individuals with very mild dementia [43]. These results suggest that if any, the effect size of the genetic architecture of LOAD is too small to be significantly identified with statistical power conferred by the cohort of eADAD; but still it also indicates that these genetic risk factors are modulating biological aspects of AD, as it is shown by the association of the PRS and the CSF ptau181-Aβ42 ratio.
4. Discussion
To test for common genetic architecture among autosomal dominant and sporadic forms of early- and late-onset AD, we analyzed four cohorts of well-characterized participants and a common set of elderly nondemented participants. We derived PRS for the participants, assuming an additive non-interaction effect of the common (MAF > 5%) genome-wide significant variants identified for LOAD in the IGAP meta-analysis. This approach allowed us to demonstrate a significant overlap in the genetic architecture of the sporadic early-onset. In contrast, we would have required larger sample sizes if we would have used just SNPs, instead of the PRS. This is because the relatively small effect size of the genetic variants identified to LOAD. We also anticipate that the PRS will become more powerful and specific as novel GWAS loci are identified and additional variants with lower frequency (MAF < 5%) associated with AD (i.e., TREM2 [48,49], PLD3 [50], SORL1 [51,52], or ABCA7 [34,53]) are also incorporated in these analyses.
We chose to include affected participants from the NIA-LOAD, Knight-ADRC, and ADNI that were also analyzed in the IGAP study, obtaining more accurate estimates, but restricting the employment of this study as an independent replication. However, the analysis of participants from non-overlapping families with the IGAP study shown similar effects (Supplementary Table 4). Cases from families with strong incidence and cases with undetermined familial history of AD were employed in the IGAP study. In any case, our analysis showed that the fLOAD and sLOAD cases have similar burden of generic risk factors. However, the samples with a strong family history (fLOAD), independent of the pattern of heritance, show the highest percentage of APOE ε4 carriers, which is reflected in a higher OR once the effect of this allele is incorporated in the PRS (model 3).
Interestingly, the analysis of the sEOAD participants revealed that the PRS has a more pronounced effect on individuals with younger AAO. Indeed, this finding not only indicates that the genetic architecture is shared among sporadic cases but also suggests that AAO of AD is modulated by the additive effect of these loci. We subsequently confirmed this hypothesis identifying a similar effect for different quintiles of the AAO (Supplementary Table 2 and Supplementary Fig. 3).
We could not identify a significant association of the PRS with the eADAD cohort (DIAN). However, this cohort has the smallest number of participants. Our empirical power estimates showed that the sample size of this cohort provides a 98% chances to detect an association with ORs comparable with that observed for sEOAD. It is more likely that the lack of association of the PRS with eADAD is not because of statistical power but because the GWAS loci do not confer risk for this population, characterized by the presence of mutations in APP, PSEN1, and PSEN2 genes. Nonetheless, we identified an association of the PRS with the CSF ptau181-Aβ42 ratio in the participants with eADAD; showing that these loci have additional effects on AD pathophysiology most likely in AAO, but it could also affect disease duration or rate of progression.
Pathway analyses from the AD GWAS that includes the loci included in this study identified that the immune and inflammation as one of the most important pathways for LOAD [54]. Some of the loci included in the PRS are also clearly involved in immune response and/or inflammation (BIN1, CR1, SP1, or HLA between others). This is also supported by the identification of low-frequency coding variant associated with AD risk in TREM2, which is clearly involved on immune response and inflammation [49,55,56]. Our results indicate that in the non-Mendelian form of the disease the immune response and inflammation play also an important role and that a higher number of risk variants in those genes will lead to an earlier onset. On the other hand, this is not the case of the Mendelian cases, in which the disease is caused by a single variant that affects Aβ production [57]. However, the association of the PRS with CSF ptau181-Aβ42 ratio suggests that the immune response and inflammation genes also play a role in eADAD.
The effect size of the IGAP loci are lower to that of APOE, and the AUC for ROC indicate that the additive effect of these loci are not strong predictors of disease status (usually expected to be higher than 0.95). However, the identification of those loci are important from a biological point of view because as explained previously they identified novel pathways implicated on AD, and they are helpful to analyze potential overlap of the genetic architecture of multiple complex traits. In addition, our results indicate that individuals with familial history or earlier onset are enriched for these genetic factors. These findings can have important repercussion in the design of future genetic studies. Selecting AD cases with earlier onset (but not Mendelian mutations) or strong family history should provide more statistical power than a similar number of sporadic late-onset cases.
One limitation of this study is that to evaluate the extent of overlap of the genetic architectures among the distinct classification of AD we employed common genome-wide significant and replicated variants. A recent study indicates that the SNPs that are significant for AD risk but do not pass the stringent multiple test correction thresholds of GWASs can still be informative for the PRS [20]. Additional studies show that low-frequency variants not analyzed in GWASs are also associated with sLOAD risk [48,50]. Therefore, further studies including common and rare variants may provide more accurate estimation of the genetic burden of the sEOAD and familial samples in comparison with the sLOAD.
In conclusion, our analysis revealed an overlap among the genetic architecture of the affected participants with either strong or not familial AD history. The genetic factors identified for LOAD also affect subjects with earlier AAO who are not carriers of AD Mendelian mutation, with a higher effect in risk than that observed in the late-onset participants and modulate the age at symptom onset of AD.
Supplementary Material
RESEARCH IN CONTEXT.
Systematic review: We evaluated whether the genetic architecture of sporadic late-onset Alzheimer’s disease (sLOAD) is shared with sporadic early-onset (sEOAD), autosomal dominant early-onset AD (eADAD), and familial late-onset (fLOAD). Polygenic risk scores (PRSs) were constructed using 21 genome-wide significant loci identified for sLOAD.
Interpretation: We identified an overlap in the genetic architecture among sEOAD (odd ratio [OR] = 2.27; P = 1.29 × 10⁻⁷), fLOAD (OR = 1.75; P = 1.12 × 10⁻⁷), and sLOAD (OR = 1.40; P = 1.21 × 10⁻³), but not for the eADAD.
Future directions: The fact that the PRS showed a higher effect size for the sEOAD and fLOAD than that observed for sLOAD can have important repercussion in the design of future genetic studies. Selecting these cases should provide more statistical power than a similar number of sLOAD. Low-frequency variants associated with AD and common variants not satisfying genome-wide threshold can improve the accuracy of the PRS and improve the understanding of the shared genetic architecture among the different manifestations of AD.
Acknowledgments
We thank all participants and their families for their commitment and dedication to helping advance research into the early detection and causation of AD and the DIAN research and support staff at each of the participating sites for their contributions to this study.
This work was supported by grants from the National Institutes of Health (R01-AG044546, P01-AG003991, RF1AG053303, R01-AG035083, and R01-NS085419) and the Alzheimer’s Association (NIRG-11-200110). This research was conducted while C.C. was a recipient of a New Investigator Award in Alzheimer’s disease from the American Federation for Aging Research. C.C. is a recipient of a BrightFocus Foundation Alzheimer’s Disease Research grant (A2013359S). The recruitment and clinical characterization of research participants at Washington University were supported by NIH P50 AG05681, P01 AG03991, and P01 AG026276.
Data collection and sharing for this project were supported by the Dominantly Inherited Alzheimer Network (DIAN; U19AG032438, P50 AG-16570, and P50 AG-005142) funded by the National Institute on Aging (NIA) and the German Center for Neurodegenerative Diseases (DZNE). This work was also supported by the NIHR Queen Square Dementia Biomedical Research Unit and the MRC Dementias Platform UK (MR/L023784/1 and MR/009076/1). Exome chip sequencing was supported by the DIAN-TU Pharma Consortium, (the DIAN-TU Pharma Consortium, http://dian-tu.wustl.edu/en/pharma-consortium-members). Data collection and sharing for this project were funded by the Alzheimer’s Disease Neuroimaging Initiative (ADNI) (National Institutes of Health Grant U01 AG024904) and DOD ADNI (Department of Defense, award number W81XWH-12-2-0012). ADNI is funded by the National Institute on Aging, the National Institute of Biomedical Imaging and Bioengineering, and through generous contributions from the following: AbbVie; Alzheimer’s Association; Alzheimer’s Drug Discovery Foundation; Araclon Biotech; BioClinica, Inc.; Biogen; Bristol-Myers Squibb Company; CereSpir, Inc.; Cogstate; Eisai Inc.; Elan Pharmaceuticals, Inc.; Eli Lilly and Company; EuroImmun; F. Hoffmann-La Roche Ltd. and its affiliated company Genentech, Inc.; Fujirebio; GE Healthcare; IXICO Ltd.; Janssen Alzheimer Immunotherapy Research & Development, LLC.; Johnson & Johnson Pharmaceutical Research & Development LLC.; Lumosity; Lundbeck; Merck & Co., Inc.; Meso Scale Diagnostics, LLC.; NeuroRx Research; Neurotrack Technologies; Novartis Pharmaceuticals Corporation; Pfizer Inc.; Piramal Imaging; Servier; Takeda Pharmaceutical Company; and Transition Therapeutics. The Canadian Institutes of Health Research is providing funds to support ADNI clinical sites in Canada. Private sector contributions are facilitated by the Foundation for the National Institutes of Health (www.fnih.org). The grantee organization is the Northern California Institute for Research and Education, and the study is coordinated by the Alzheimer’s Therapeutic Research Institute at the University of Southern California. ADNI data are disseminated by the Laboratory for Neuro Imaging at the University of Southern California. We thank the Genome Technology Access Center in the Department of Genetics at Washington University School of Medicine for helping with genomic analysis. The Center is partially supported by NCI Cancer Center Support grant number P30 CA91842 to the Siteman Cancer Center and by ICTS/CTSA grant number UL1TR000448 from the National Center for Research Resources (NCRR), a component of the National Institutes of Health (NIH), and NIH Roadmap for Medical Research. This work was supported by access to equipment made possible by the Hope Center for Neurological Disorders and the Departments of Neurology and Psychiatry at Washington University School of Medicine.
Footnotes
Supplementary data
Supplementary data related to this article can be found at http://dx.doi.org/10.1016/j.jalz.2017.08.013.
Scripts and Code: The R code and scripts we employed to perform the analysis are available in the supplementary information and also in plain text format (file PRS.r)
References
- 1.Bateman RJ, Xiong C, Benzinger TL, Fagan AM, Goate A, Fox NC, et al. Clinical and biomarker changes in dominantly inherited Alzheimer’s disease. N Engl J Med. 2012;367:795–804. doi: 10.1056/NEJMoa1202753. [DOI] [PMC free article] [PubMed] [Google Scholar]
- 2.Goate A, Chartier-Harlin MC, Mullan M, Brown J, Crawford F, Fidani L, et al. Segregation of a missense mutation in the amyloid precursor protein gene with familial Alzheimer’s disease. Nature. 1991;349:704–6. doi: 10.1038/349704a0. [DOI] [PubMed] [Google Scholar]
- 3.Sherrington R, Rogaev EI, Liang Y, Rogaeva EA, Levesque G, Ikeda M, et al. Cloning of a gene bearing missense mutations in early-onset familial Alzheimer’s disease. Nature. 1995;375:754–60. doi: 10.1038/375754a0. [DOI] [PubMed] [Google Scholar]
- 4.Levy-Lahad E, Wasco W, Poorkaj P, Romano DM, Oshima J, Pettingell WH, et al. Candidate gene for the chromosome 1 familial Alzheimer’s disease locus. Science. 1995;269:973–7. doi: 10.1126/science.7638622. [DOI] [PubMed] [Google Scholar]
- 5.De Strooper B, Annaert W. Proteolytic processing and cell biological functions of the amyloid precursor protein. J Cell Sci. 2000;113:1857–70. doi: 10.1242/jcs.113.11.1857. [DOI] [PubMed] [Google Scholar]
- 6.Karch CM, Cruchaga C, Goate AM. Alzheimer’s disease genetics: from the bench to the clinic. Neuron. 2014;83:11–26. doi: 10.1016/j.neuron.2014.05.041. [DOI] [PMC free article] [PubMed] [Google Scholar]
- 7.Cruchaga C, Haller G, Chakraverty S, Mayo K, Vallania FL, Mitra RD, et al. Rare variants in APP, PSEN1 and PSEN2 increase risk for AD in late-onset Alzheimer’s disease families. PLoS One. 2012;7:e31039. doi: 10.1371/journal.pone.0031039. [DOI] [PMC free article] [PubMed] [Google Scholar]
- 8.Tosto G, Bird TD, Tsuang D, Bennett DA, Boeve BF, Cruchaga C, et al. Polygenic risk scores in familial Alzheimer disease. Neurology. 2017;88:1180–6. doi: 10.1212/WNL.0000000000003734. [DOI] [PMC free article] [PubMed] [Google Scholar]
- 9.Lee JH, Cheng R, Graff-Radford N, Foroud T, Mayeux R, National Institute on Aging Late-Onset Alzheimer’s Disease Family Study G Analyses of the National Institute on Aging Late-Onset Alzheimer’s Disease Family Study: implication of additional loci. Arch Neurol. 2008;65:1518–26. doi: 10.1001/archneur.65.11.1518. [DOI] [PMC free article] [PubMed] [Google Scholar]
- 10.Tosto G, Bird T, Tsuang D, Bennet AD, Boeve B, Cruchaga C, et al. Polygenic risk scores in Familial Alzheimer’s Disease. Neurology. 2016;88:1180–6. doi: 10.1212/WNL.0000000000003734. [DOI] [PMC free article] [PubMed] [Google Scholar]
- 11.Farrer LA, Cupples LA, Haines JL, Hyman B, Kukull WA, Mayeux R, et al. Effects of age, sex, and ethnicity on the association between apolipoprotein E genotype and Alzheimer disease. A meta-analysis. APOE and Alzheimer Disease Meta Analysis Consortium. JAMA. 1997;278:1349–56. [PubMed] [Google Scholar]
- 12.Corder EH, Saunders AM, Strittmatter WJ, Schmechel DE, Gaskell PC, Small GW, et al. Gene dose of apolipoprotein E type 4 allele and the risk of Alzheimer’s disease in late onset families. Science. 1993;261:921–3. doi: 10.1126/science.8346443. [DOI] [PubMed] [Google Scholar]
- 13.Kamboh MI, Demirci FY, Wang X, Minster RL, Carrasquillo MM, Pankratz VS, et al. Genome-wide association study of Alzheimer’s disease. Transl Psychiatry. 2012;2:e117. doi: 10.1038/tp.2012.45. [DOI] [PMC free article] [PubMed] [Google Scholar]
- 14.Harold D, Abraham R, Hollingworth P, Sims R, Gerrish A, Hamshere ML, et al. Genome-wide association study identifies variants at CLU and PICALM associated with Alzheimer’s disease. Nat Genet. 2009;41:1088–93. doi: 10.1038/ng.440. [DOI] [PMC free article] [PubMed] [Google Scholar]
- 15.Hollingworth P, Harold D, Sims R, Gerrish A, Lambert JC, Carrasquillo MM, et al. Common variants at ABCA7, MS4A6A/MS4A4E, EPHA1, CD33 and CD2AP are associated with Alzheimer’s disease. Nat Genet. 2011;43:429–35. doi: 10.1038/ng.803. [DOI] [PMC free article] [PubMed] [Google Scholar]
- 16.Lambert JC, Heath S, Even G, Campion D, Sleegers K, Hiltunen M, et al. Genome-wide association study identifies variants at CLU and CR1 associated with Alzheimer’s disease. Nat Genet. 2009;41:1094–9. doi: 10.1038/ng.439. [DOI] [PubMed] [Google Scholar]
- 17.Naj AC, Jun G, Beecham GW, Wang LS, Vardarajan BN, Buros J, et al. Common variants at MS4A4/MS4A6E, CD2AP, CD33 and EPHA1 are associated with late-onset Alzheimer’s disease. Nat Genet. 2011;43:436–41. doi: 10.1038/ng.801. [DOI] [PMC free article] [PubMed] [Google Scholar]
- 18.Lambert JC, Ibrahim-Verbaas CA, Harold D, Naj AC, Sims R, Bellenguez C, et al. Meta-analysis of 74,046 individuals identifies 11 new susceptibility loci for Alzheimer’s disease. Nat Genet. 2013;45:1452–8. doi: 10.1038/ng.2802. [DOI] [PMC free article] [PubMed] [Google Scholar]
- 19.Escott-Price V, Shoai M, Pither R, Williams J, Hardy J. Polygenic score prediction captures nearly all common genetic risk for Alzheimer’s disease. Neurobiol Aging. 2016;49:214.e7–214.e11. doi: 10.1016/j.neurobiolaging.2016.07.018. [DOI] [PubMed] [Google Scholar]
- 20.Escott-Price V, Sims R, Bannister C, Harold D, Vronskaya M, Majounie E, et al. Common polygenic variation enhances risk prediction for Alzheimer’s disease. Brain. 2015;138:3673–84. doi: 10.1093/brain/awv268. [DOI] [PMC free article] [PubMed] [Google Scholar]
- 21.International Schizophrenia C. Purcell SM, Wray NR, Stone JL, Visscher PM, O’Donovan MC, et al. Common polygenic variation contributes to risk of schizophrenia and bipolar disorder. Nature. 2009;460:748–52. doi: 10.1038/nature08185. [DOI] [PMC free article] [PubMed] [Google Scholar]
- 22.Clarke TK, Hall LS, Fernandez-Pujals AM, MacIntyre DJ, Thomson P, Hayward C, et al. Major depressive disorder and current psychological distress moderate the effect of polygenic risk for obesity on body mass index. Transl Psychiatry. 2015;5:e592. doi: 10.1038/tp.2015.83. [DOI] [PMC free article] [PubMed] [Google Scholar]
- 23.Knight-ADRC, DIAN. Knight-Alzheimer’s Disease Research Center and the Dominantly Inherited Alzheimer Network study at Washing-ton University [Google Scholar]
- 24.Available at: http://www.adni-info.org. TAsDNIAAf.
- 25.Available at: https://www.nia.nih.gov/research/dn/alzheimers-disease-genetics-initiative. TNIoAGIfL-OAsDN-LAf.
- 26.McKhann G, Drachman D, Folstein M, Katzman R, Price D, Stadlan EM. Clinical diagnosis of Alzheimer’s disease: report of the NINCDS-ADRDA Work Group under the auspices of Department of Health and Human Services Task Force on Alzheimer’s Disease. Neurology. 1984;34:939–44. doi: 10.1212/wnl.34.7.939. [DOI] [PubMed] [Google Scholar]
- 27.Berg L, McKeel DW, Jr, Miller JP, Storandt M, Rubin EH, Morris JC, et al. Clinicopathologic studies in cognitively healthy aging and Alzheimer’s disease: relation of histologic markers to dementia severity, age, sex, and apolipoprotein E genotype. Arch Neurol. 1998;55:326–35. doi: 10.1001/archneur.55.3.326. [DOI] [PubMed] [Google Scholar]
- 28.Morris JC. The Clinical Dementia Rating (CDR): current version and scoring rules. Neurology. 1993;43:2412–4. doi: 10.1212/wnl.43.11.2412-a. [DOI] [PubMed] [Google Scholar]
- 29.Cruchaga C, Nowotny P, Kauwe JS, Ridge PG, Mayo K, Bertelsen S, et al. Association and Expression Analyses With Single-Nucleotide Polymorphisms in TOMM40 in Alzheimer Disease. Arch Neurol. 2011;68:1013–9. doi: 10.1001/archneurol.2011.155. [DOI] [PMC free article] [PubMed] [Google Scholar]
- 30.Benitez BA, Karch CM, Cai Y, Jin SC, Cooper B, Carrell D, et al. The PSEN1, p.E318G Variant Increases the Risk of Alzheimer’s Disease in APOE-epsilon4 Carriers. Plos Genet. 2013;9:e1003685. doi: 10.1371/journal.pgen.1003685. [DOI] [PMC free article] [PubMed] [Google Scholar]
- 31.Cruchaga C, Graff C, Chiang HH, Wang J, Hinrichs AL, Spiegel N, et al. Association of TMEM106B gene polymorphism with age at onset in granulin mutation carriers and plasma granulin protein levels. Arch Neurol. 2011;68:581–6. doi: 10.1001/archneurol.2010.350. [DOI] [PMC free article] [PubMed] [Google Scholar]
- 32.Cruchaga C, Kauwe JS, Harari O, Jin SC, Cai Y, Karch CM, et al. GWAS of Cerebrospinal Fluid Tau Levels Identifies Risk Variants for Alzheimer’s Disease. Neuron. 2013;78:256–68. doi: 10.1016/j.neuron.2013.02.026. [DOI] [PMC free article] [PubMed] [Google Scholar]
- 33.Cruchaga C, Kauwe JS, Nowotny P, Bales K, Pickering EH, Mayo K, et al. Cerebrospinal fluid APOE levels: an endophenotype for genetic studies for Alzheimer’s disease. Hum Mol Genet. 2012;21:4558–71. doi: 10.1093/hmg/dds296. [DOI] [PMC free article] [PubMed] [Google Scholar]
- 34.Del-Aguila JL, Fernandez MV, Jimenez J, Black K, Ma SM, Deming Y, et al. Role of ABCA7 loss-of-function variant in Alzheimer’s disease: a replication study in European-Americans. Alzheimers Res Ther. 2015;7:73. doi: 10.1186/s13195-015-0154-x. [DOI] [PMC free article] [PubMed] [Google Scholar]
- 35.Morris JC, Aisen PS, Bateman RJ, Benzinger TL, Cairns NJ, Fagan AM, et al. Developing an international network for Alzheimer research: The Dominantly Inherited Alzheimer Network. Clin Investig (Lond) 2012;2:975–84. doi: 10.4155/cli.12.93. [DOI] [PMC free article] [PubMed] [Google Scholar]
- 36.Delaneau O, Coulonges C, Zagury JF. Shape-IT: new rapid and accurate algorithm for haplotype inference. BMC Bioinformatics. 2008;9:540. doi: 10.1186/1471-2105-9-540. [DOI] [PMC free article] [PubMed] [Google Scholar]
- 37.Howie B, Marchini J, Stephens M. Genotype imputation with thousands of genomes. G3 (Bethesda) 2011;1:457–70. doi: 10.1534/g3.111.001198. [DOI] [PMC free article] [PubMed] [Google Scholar]
- 38.Howie B, Fuchsberger C, Stephens M, Marchini J, Abecasis GR. Fast and accurate genotype imputation in genome-wide association studies through pre-phasing. Nat Genet. 2012;44:955–9. doi: 10.1038/ng.2354. [DOI] [PMC free article] [PubMed] [Google Scholar]
- 39.Cruchaga C, Kauwe JS, Mayo K, Spiegel N, Bertelsen S, Nowotny P, et al. SNPs associated with cerebrospinal fluid phosphotau levels influence rate of decline in Alzheimer’s disease. PLoS Genet. 2010;6:e1001101. doi: 10.1371/journal.pgen.1001101. [DOI] [PMC free article] [PubMed] [Google Scholar]
- 40.Harms MB, Cady J, Zaidman C, Cooper P, Bali T, Allred P, et al. Lack of C9ORF72 coding mutations supports a gain of function for repeat expansions in amyotrophic lateral sclerosis. Neurobiol Aging. 2013;34:2234.e13–2234.e19. doi: 10.1016/j.neurobiolaging.2013.03.006. [DOI] [PMC free article] [PubMed] [Google Scholar]
- 41.Harms M, Benitez BA, Cairns N, Cooper B, Cooper P, Mayo K, et al. C9orf72 Hexanucleotide Repeat Expansions in Clinical Alzheimer Disease. JAMA Neurol. 2013;70:736–41. doi: 10.1001/2013.jamaneurol.537. [DOI] [PMC free article] [PubMed] [Google Scholar]
- 42.Koenker R, Bassett G. Regression Quantiles. Econometrica. 1978;46:33–50. [Google Scholar]
- 43.Fagan AM, Mintun MA, Mach RH, Lee SY, Dence CS, Shah AR, et al. Inverse relation between in vivo amyloid imaging load and cerebrospinal fluid Abeta42 in humans. Ann Neurol. 2006;59:512–9. doi: 10.1002/ana.20730. [DOI] [PubMed] [Google Scholar]
- 44.Shaw LM, Vanderstichele H, Knapik-Czajka M, Clark CM, Aisen PS, Petersen RC, et al. Cerebrospinal fluid biomarker signature in Alzheimer’s disease neuroimaging initiative subjects. Ann Neurol. 2009;65:403–13. doi: 10.1002/ana.21610. [DOI] [PMC free article] [PubMed] [Google Scholar]
- 45.Harari O, Cruchaga C, Kauwe JS, Ainscough BJ, Bales K, Pickering EH, et al. Phosphorylated tau-Abeta42 ratio as a continuous trait for biomarker discovery for early-stage Alzheimer’s disease in multiplex immunoassay panels of cerebrospinal fluid. Biol Psychiatry. 2014;75:723–31. doi: 10.1016/j.biopsych.2013.11.032. [DOI] [PMC free article] [PubMed] [Google Scholar]
- 46.Sherwood B, Zhou AX, Weintraub S, Wang L. Using quantile regression to create baseline norms for neuropsychological tests. Alzheimers Dement (Amst) 2016;2:12–8. doi: 10.1016/j.dadm.2015.11.005. [DOI] [PMC free article] [PubMed] [Google Scholar]
- 47.Fagan AM, Roe CM, Xiong C, Mintun MA, Morris JC, Holtzman DM. Cerebrospinal fluid tau/beta-amyloid(42) ratio as a prediction of cognitive decline in nondemented older adults. Arch Neurol. 2007;64:343–9. doi: 10.1001/archneur.64.3.noc60123. [DOI] [PubMed] [Google Scholar]
- 48.Benitez BA, Cruchaga C. TREM2 and neurodegenerative disease. N Engl J Med. 2013;369:1567–8. doi: 10.1056/NEJMc1306509#SA4. [DOI] [PMC free article] [PubMed] [Google Scholar]
- 49.Guerreiro R, Wojtas A, Bras J, Carrasquillo M, Rogaeva E, Majounie E, et al. TREM2 variants in Alzheimer’s disease. N Engl J Med. 2013;368:117–27. doi: 10.1056/NEJMoa1211851. [DOI] [PMC free article] [PubMed] [Google Scholar]
- 50.Cruchaga C, Karch CM, Jin SC, Benitez BA, Cai Y, Guerreiro R, et al. Rare coding variants in the phospholipase D3 gene confer risk for Alzheimer’s disease. Nature. 2014;505:550–4. doi: 10.1038/nature12825. [DOI] [PMC free article] [PubMed] [Google Scholar]
- 51.Rogaeva E, Meng Y, Lee JH, Gu Y, Kawarai T, Zou F, et al. The neuronal sortilin-related receptor SORL1 is genetically associated with Alzheimer disease. Nat Genet. 2007;39:168–77. doi: 10.1038/ng1943. [DOI] [PMC free article] [PubMed] [Google Scholar]
- 52.Fernandez MV, Black K, Carrell D, Saef B, Budde J, Deming Y, et al. SORL1 variants across Alzheimer’s disease European American cohorts. Eur J Hum Genet. 2016;24:1828–30. doi: 10.1038/ejhg.2016.122. [DOI] [PMC free article] [PubMed] [Google Scholar]
- 53.Steinberg S, Stefansson H, Jonsson T, Johannsdottir H, Ingason A, Helgason H, et al. Loss-of-function variants in ABCA7 confer risk of Alzheimer’s disease. Nat Genet. 2015;47:445–7. doi: 10.1038/ng.3246. [DOI] [PubMed] [Google Scholar]
- 54.International Genomics of Alzheimer’s Disease C. Convergent genetic and expression data implicate immunity in Alzheimer’s disease. Alzheimers Dement. 2015;11:658–71. doi: 10.1016/j.jalz.2014.05.1757. [DOI] [PMC free article] [PubMed] [Google Scholar]
- 55.Jin SC, Carrasquillo MM, Benitez BA, Skorupa T, Carrell D, Patel D, et al. TREM2 is associated with increased risk for Alzheimer’s disease in African Americans. Mol Neurodegener. 2015;10:19. doi: 10.1186/s13024-015-0016-9. [DOI] [PMC free article] [PubMed] [Google Scholar]
- 56.Benitez BA, Cooper B, Pastor P, Jin SC, Lorenzo E, Cervantes S, et al. TREM2 is associated with the risk of Alzheimer’s disease in Spanish population. Neurobiol Aging. 2013;34:1711.e15–7. doi: 10.1016/j.neurobiolaging.2012.12.018. [DOI] [PMC free article] [PubMed] [Google Scholar]
- 57.Holtzman DM, Morris JC, Goate AM. Alzheimer’s disease: the challenge of the second century. Sci Transl Med. 2011;3:77sr1. doi: 10.1126/scitranslmed.3002369. [DOI] [PMC free article] [PubMed] [Google Scholar]
Associated Data
This section collects any data citations, data availability statements, or supplementary materials included in this article.