Abstract
Purpose
Endothelial nitric oxide synthase (eNOS) plays a central role in regulating vascular tone, blood flow, and microvascular permeability. Endothelial dysfunction, including eNOS dysfunction, is an early biomarker of vascular disease. This study aimed to show that myocardial T1 mapping during nitric oxide synthase (NOS) inhibition could assess coronary microvascular eNOS function.
Methods
Wild type (WT) mice, eNOS−/− mice, and WT mice fed a high-fat diet (HFD) underwent T1 mapping at baseline and for 20 minutes after injection of LNAME, a NOS inhibitor. First-pass perfusion MRI was performed in WT mice at baseline and 5 minutes after LNAME injection.
Results
T1 mapping detected an increase in myocardial T1 five minutes after 4 mg/kg LNAME injection compared to baseline in control mice (T1=1515±30 ms with LNAME vs. T1=1402±30 ms at baseline, P<0.05). No change in myocardial T1 after LNAME injection was observed in eNOS−/− mice. The change in T1 after LNAME injection was less in HFD mice (ΔT1=31±14 ms at 12 weeks of diet and ΔT1=16±17 ms at 18 weeks of diet) compared to mice fed a standard diet (ΔT1=113±15 ms), with P<0.05. First-pass MRI measured similar perfusion at baseline and 5 minutes after LNAME injection.
Conclusion
NOS inhibition causes an increase in myocardial T1 in healthy mice, and this effect is mediated through eNOS. T1 mapping during NOS inhibition detects coronary microvascular eNOS dysfunction in HFD mice. T1 mapping during NOS inhibition may be useful in preclinical studies aiming to investigate mechanisms underlying and therapies for coronary microvascular eNOS dysfunction.
Keywords: T1 mapping, nitric oxide synthase inhibition, coronary endothelial function, microvascular permeability, mouse, eNOS
Introduction
The vascular endothelium is a monolayer of cells that lines the inner surface of blood vessels. Endothelial nitric oxide synthase (eNOS), an enzyme that produces nitric oxide (NO) in the vascular endothelium, plays a central role in regulating vascular properties such as tone, regional blood flow, and microvascular permeability. Cardiovascular risk factors such as obesity1, diabetes mellitus2 and hypertension3 lead to excess production of superoxide or, more generally, reactive oxygen species, in the vascular wall. The resulting vascular oxidative stress leads to a process referred to as eNOS uncoupling, where eNOS dysfunction occurs and eNOS is converted from an NO producer to a superoxide producer4. Under these conditions, the central roles of eNOS in endothelial function are compromised, and instead of promoting vascular health, eNOS contributes to oxidative stress and endothelial dysfunction. A minimally-invasive imaging method to assess eNOS function would enable the study of mechanisms leading to eNOS dysfunction and of potential therapies targeting eNOS, as eNOS dysfunction presently is not fully understood and there are limited therapies that promote normal eNOS function.
Prior studies have shown that pharmacological inhibition of NOS with agents such as NG-nitro-L-arginine methyl ester (LNAME) rapidly depletes the local vessel wall NO concentration, leading to a rapid increase in microvascular permeability, protein efflux from the blood to the extracellular space, and microvascular fluid efflux5–10. We hypothesized that MRI T1 mapping of the heart during NOS inhibition could detect changes in compartmental water content resulting from acute changes in microvascular permeability and fluid efflux. Furthermore, we hypothesized that these changes are mediated through eNOS and would be diminished in a disease state with eNOS dysfunction. The overall goal of this study was to show that T1 mapping during pharmacological NOS inhibition could be used to assess vascular eNOS function in the heart.
Methods
Experimental Design
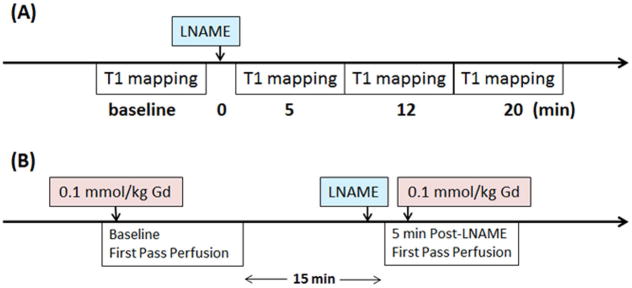
We first sought to show that T1 mapping of the heart during NOS inhibition could detect an increase in myocardial T1. For these studies, healthy 19-week-old male wild type (WT) C57Bl/6 mice underwent T1 mapping before and after injection of a NOS inhibitor. The pharmacological agent LNAME was chosen as the NOS inhibitor as it is tolerated by both animals5,9,11,12 and humans13 when injected intravenously and is commercially available (Sigma-Aldrich, St. Louis, MO. Product number: N5751). LNAME was dissolved in sterile saline, and two doses of LNAME, 2 mg/kg (n = 8) and 4 mg/kg (n = 6) were tested. The bolus concentrations were 1 mg/mL and 2 mg/mL, respectively, and the total injection volume ranged from 55 to 60 μL. The data acquisition protocol for the LNAME T1 mapping experiments is shown in Figure 1A.
Figure 1.
Schematic timing diagram of (A) the LNAME T1 mapping experiments, and (B) the LNAME first-pass perfusion experiments.
Next, we tested the hypothesis that the change in myocardial T1 during NOS inhibition is mediated specifically through eNOS. For these studies, we performed experiments in 13-week-old male eNOS knockout (eNOS−/−) mice on a C57Bl/6 background (n = 7) (Jackson Laboratory, Bar Harbor, Maine. Stock number: 002684 | eNOS KO) using the LNAME T1 mapping protocol described above and with an LNAME dose of 4 mg/kg.
Previous studies have shown that pharmacological agents such as adenosine that cause vasodilation and changes in vascular tone and perfusion can also cause a detectable increase in myocardial T114. To exclude the possibility that increases in myocardial T1 during NOS inhibition may be due to potential vasodilatory effects, we measured myocardial perfusion at baseline and during NOS inhibition using gadolinium-enhanced first-pass perfusion MRI15 in male WT control mice (n = 6). As shown in the data acquisition protocol for the LNAME first-pass perfusion experiments (Figure 1B), baseline and post-LNAME first-pass perfusion images were acquired within the same imaging session, and each used a 0.1 mmol/kg dose of Gd-DTPA. The bolus concentration of Gd solution was 0.05 M. The total injection volume, which included two injections of Gd solution and one injection of LNAME solution, ranged from 160 to 180 μL. A 15-minute waiting period between first-pass measurements was employed to allow contrast agent wash out. Post-LNAME perfusion was measured 5 minutes after intravenous injection of LNAME to match the timing of the LNAME T1 mapping experiment.
Finally, we sought to show that LNAME T1 mapping could detect eNOS dysfunction in a mouse model of cardiac microvascular disease. For the disease model we chose male C57BL/6 mice fed a high fat diet (HFD), as this model exhibits hallmarks of diabetic cardiomyopathy16,17, and has previously been shown to develop coronary endothelial dysfunction18–20. To test the hypothesis that T1 mapping with NOS inhibition can detect coronary microvascular eNOS dysfunction in HFD mice, mice underwent HFD feeding (60% calories from fat, Diet 12492, Research Diets Inc., New Brunswick, NJ) for 12 (18-week-old, n = 10) and 18 weeks (24-week-old, n=10), and at each time point MRI T1 mapping with 4 mg/kg LNAME was performed. The LNAME solution injection volume ranged from 65 to 110 μL.
Animal Handling
All animal studies were performed under protocols that comply with the Guide for the Care and Use of Laboratory Animals (NIH publication no. 85–23, Revised 1996) and were approved by the Animal Care and Use Committee at our institution. An indwelling tail vein catheter was established to deliver LNAME (Sigma-Aldrich Biotechnology, St Louis, MO, USA) and/or Gd-DTPA (Magnevist, 0.1 mmol/kg body weight) during MRI. Body temperature was maintained at 36 ± 0.5°C using circulating warm water and anesthesia was maintained using 1.25% isoflurane in O2 during MRI.
MRI Acquisitions
MRI was performed on a 7T Clinscan system (Bruker, Ettlingen, Germany) using 30-mm or 35-mm diameter birdcage RF coils and an MR-compatible physiological monitoring and gating system for mice (SA Instruments, Inc., Stony Brook, NY). The larger diameter RF coil was used when necessary to accommodate the heavier HFD mice. Localizer imaging was performed to select a mid-ventricular short-axis slice.
T1 mapping MRI was performed using a spiral Look-Locker T1-mapping method for mice combined with cardio-respiratory gating, as previously described21. The technique uses fuzzy-clustering of spiral k-space interleafs22 to ensure accurate T1 estimation even with varying respiratory or heart rate. Imaging parameters included: TR = 7 s, TE = 0.67 ms, flip angle = 3°, field of view (FOV) = 30 x 30 mm2, number of averages = 3, number of spiral interleaves = 84, interleaves per heartbeat = 3 and in-plane resolution = 0.23 x 0.23 mm2. Using ky-t undersampling with randomness and a low-rank compressed-sensing reconstruction23, the acquisition was rate-2 accelerated, providing a scan time of 7 minutes.
First-pass gadolinium-enhanced MRI was performed using a dual-contrast saturation-recovery sequence with ky-t undersampling and a motion-compensated compressed sensing reconstruction algorithm as recently described15. Briefly, a saturation pulse is applied after detection of the ECG R-wave and thereafter two slices are acquired in each cardiac cycle: the arterial input function (AIF) and the tissue function (TF). Imaging parameters included: TR = 2.1 ms, TE = 1.2 ms, FOV = 28x11 mm2, base resolution = 128, phase resolution = 80%, image resolution = 0.27 x 0.22 mm2, excitation flip angle = 15°, slice thickness = 1 mm, number of frames = 300, acceleration rate = 2, AIF saturation delay = 24 ms with centrically-ordered phase encoding, and TF saturation delay = 84 ms with linearly-ordered phase encoding. Twenty phase-encode lines were acquired for each AIF image and 20 lines were acquired for each TF image. Contrast agent was injected intravenously 10 seconds after the start of the first-pass acquisition. Proton density weighted images were acquired at the end of the acquisition to normalize signal intensities for perfusion analysis. All imaging parameters were kept the same for proton density weighted image acquisitions compared to the saturation recovery portion of the image acquisition, except that no saturation pulse was applied upon detection of the ECG R-wave and a flip angle of 5° was used.
Image analysis
Image reconstruction and analysis were performed in MATLAB (Mathworks, Natick, MA). Undersampled T1 mapping and first-pass perfusion images were reconstructed using Block LOw-rank Sparsity with Motion-guidance (BLOSM)23. For the respiratory-gated T1 mapping images which did not suffer from respiratory motion, BLOSM motion guidance was not used and a single block covering the entire image was used, such that the BLOSM reconstruction reduced to a simple low-rank reconstruction method. To quantify myocardial T1, regions of interest (ROIs) for the myocardium were drawn manually and included the entire left-ventricular myocardial area within a slice using conservative delineation of the endocardial and epicardial borders. Signal intensity-time curves were fitted to the following equation: Mz(t) = Mo + (Mz(0) − Mo) exp(−t/T1). An optimal fit of the model parameters M0, Mz(0) and T1 was obtained by minimizing the mean squared error. To quantify myocardial blood flow (MBF), perfusion analysis was performed as previously described15. Briefly, ROIs for blood and myocardium were drawn, and signal intensity was normalized by proton density weighted images. Normalized signal intensity was converted to T1 and T1 was converted to gadolinium concentration using methods described by Cernicanu and Axel24, and MBF was quantified using Fermi deconvolution25.
Statistical Analysis
Statistical analyses were performed using SigmaPlot (Systat Software Inc., Point Richmond, CA). Changes in myocardial T1 and absolute MBF were analyzed for various experimental groups of mice at various time points using analysis of variance (ANOVA) and the t-test, as appropriate. All values in the text, tables and graphs are presented as mean ± standard error.
Results
NOS inhibition causes an increase in myocardial T1
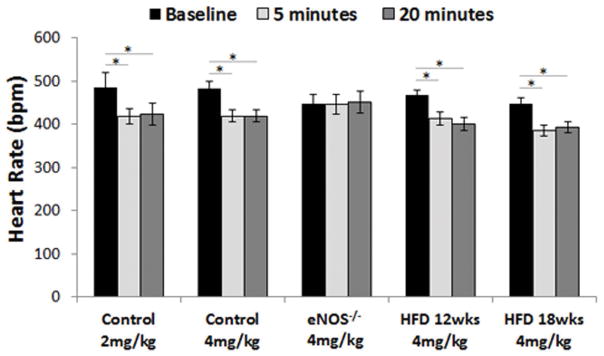
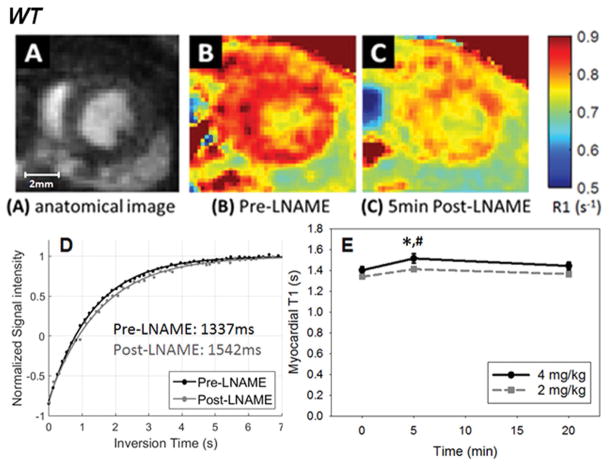
Intravenous administration of 2 mg/kg and 4 mg/kg LNAME caused a significant decrease in heart rate in control mice (Figure 2). The results of our studies performing T1 mapping after infusion of LNAME in WT mice are shown in Figure 3. The average area of the myocardial ROIs among all mice was 134 ± 4 pixels or 7.1 ± 0.2 mm2. An example showing the T1 lengthening effect of NOS inhibition is shown in Figure 3B and C where the R1 (R1 = 1/T1) map 5 minutes after injection of 4 mg/kg LNAME (Figure 3C) shows a reduction in myocardial R1 compared to baseline (Figure 3B). The same data displayed as myocardial T1 relaxation curves prior to and 5 minutes post LNAME injection illustrate the quality of the Look-Locker measurement data and also show the T1-lengthening effect of LNAME (Figure 3D). Figure 3E summarizes data from all mice and shows that T1 mapping after the injection of LNAME detected a transient increase in T1, as T1 was elevated at 5 minutes post injection (T1 = 1515 ± 30 ms with 4 mg/kg LNAME vs. T1 = 1402 ± 30 ms at baseline, P < 0.05). T1 decreased toward its baseline value at 20 minutes after injection. Two-way ANOVA also showed that myocardial T1 measured 5 minutes after a 4 mg/kg LNAME injection was significantly greater than T1 measured 5 minutes after a 2 mg/kg LNAME injection (P < 0.05).
Figure 2.
Intravenous administration of 2mg/kg and 4mg/kg LNAME caused a significant decrease in heart rate in control mice (*P < 0.01). 4mg/kg LNAME also caused a significant decrease in heart rate in HFD mice but not in eNOS−/− mice.
Figure 3.
(A) Example anatomical image used to visualize myocardial borders. R1 maps of the heart acquired before (B) and 5 minutes after injection of 4 mg/kg LNAME (C), demonstrating the decrease in R1 observed in response to NOS inhibition. (D) Example myocardial T1 relaxation curves prior to and 5 minutes after 4 mg/kg LNAME. (E) The time course of myocardial T1 after intravenous injection of LNAME at two doses is shown. Myocardial T1 measured five minutes after 4 mg/kg LNAME injection was higher than at baseline (*P < 0.05) and was higher than 5 minutes after 2mg/kg LNAME (# P < 0.05).
The LNAME-induced myocardial T1 increase is mediated through eNOS
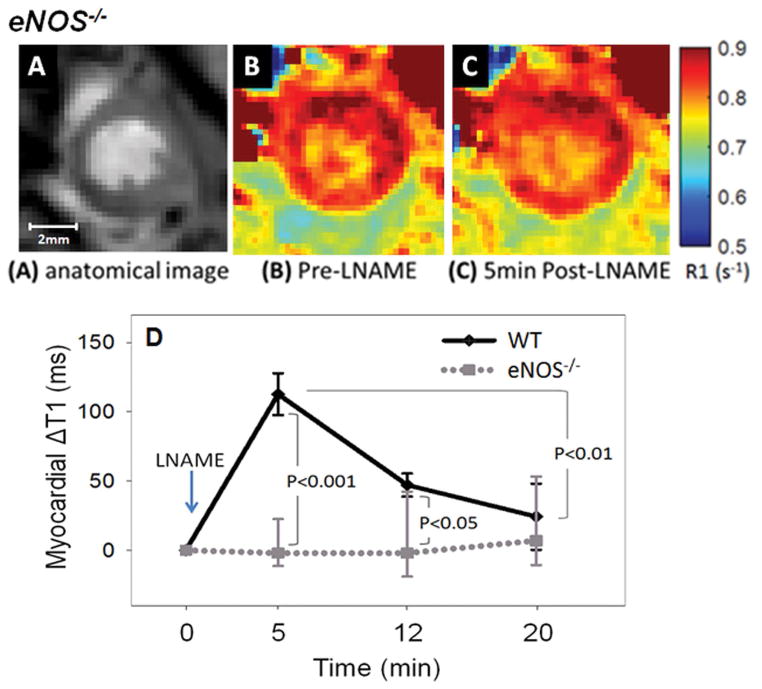
In our second set of experiments we performed LNAME T1 mapping in eNOS−/− mice. Intravenous administration of 4mg/kg LNAME caused no change in heart rate in eNOS−/− mice (Figure 2). As shown in Figure 4, no difference was observed in R1 maps of an example eNOS−/− mouse between baseline (Figure 4B) and after LNAME injection (Figure 4C). The graph shown in Figure 4D summarizes the results of T1 mapping after 4 mg/kg LNAME in WT and eNOS−/− mice, showing that while LNAME caused a significant and transient increase in myocardial T1 in WT mice, the effect was completely blunted in eNOS−/− mice.
Figure 4.
NOS inhibition with 4 mg/kg LNAME caused a significant transient increase in myocardial T1 in WT mice but not in eNOS−/− mice. An example anatomical image used to visualize myocardial borders is shown in (A). R1 maps of the heart of eNOS−/− mice acquired before and 5 minutes after injection of 4 mg/kg LNAME are shown in (B) and (C), respectively. The time course of the change in myocardial T1 after intravenous injection of LNAME is shown in (D) for WT and eNOS−/− mice.
Myocardial perfusion does not change with LNAME
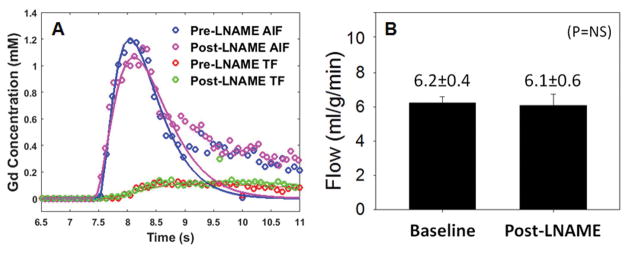
Data from first-pass perfusion MRI acquired at baseline and after 4 mg/kg LNAME injection are shown in Figure 5. Specifically, Figure 5A shows example AIF and TF curves from baseline and during NOS inhibition in one mouse. Both the AIFs and TFs are similar at baseline and 5-minutes after LNAME. Figure 5B summarizes the results from all LNAME perfusion data showing that first-pass MRI in WT mice measured similar perfusion at baseline (6.2 ± 0.4 ml/g/min) and 5 minutes after LNAME (6.1 ± 0.6 ml/g/min), suggesting no vasodilatory effects (P = NS).
Figure 5.
Myocardial perfusion is similar before and after LNAME injection. Example arterial input function (AIF) and tissue function (TF) curves from pre- and post-LNAME acquisitions (A). Myocardial perfusion was 6.2 ± 0.4 ml/g/min at baseline and 6.1 ± 0.6 ml/g/min after LNAME (B).
LNAME T1 mapping detects eNOS dysfunction in HFD mice
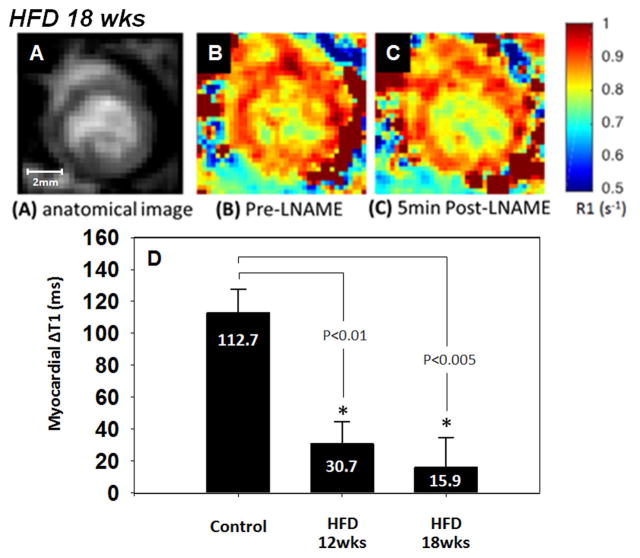
Body weight was significantly higher in the HFD mice at 12 and 18 weeks post-diet and it progressively increased with time (Figure 6). Intravenous administration of 4mg/kg LNAME caused a significant decrease in heart rate in mice fed a HFD for 12 and 18 weeks (Figure 2). The LNAME T1 mapping results from mice fed a HFD compared to controls are shown in Figure 7. Specifically, example R1 maps from a HFD mouse after 18 weeks of diet show no observable change in R1 when comparing the baseline (Figure 7B) and post-LNAME R1 maps (Figure 7C). A bar graph summarizing myocardial ΔT1 results (T1 measured 5 minutes after LNAME injection minus T1 at baseline) is shown in Figure 7D for WT and HFD mice. These measurements detected a significant difference in ΔT1 for mice fed a HFD for 12 and 18 weeks compared to mice fed a control chow diet (P < 0.01).
Figure 6.
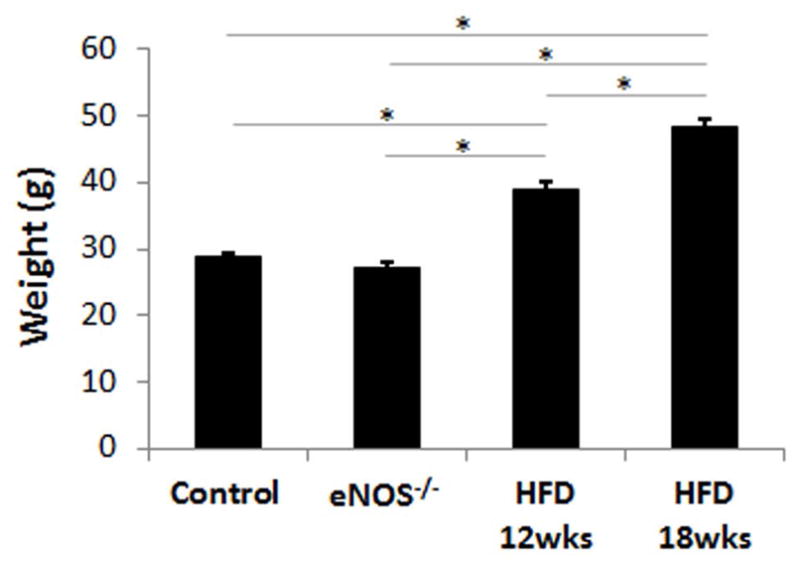
Body weight was significantly higher in the HFD mice at 12 and 18 weeks post-diet and it progressively increased with time (*P < 0.01).
Figure 7.
Anatomical image (A), pre-LNAME R1 map (B), and post-LNAME R1 map (C) of a mouse 18 weeks after initiation of a high fat diet (HFD). One-way ANOVA detected significant differences in the change of myocardial T1 assessed five minutes after LNAME injection between the HFD groups and the control mice fed a standard chow diet (D).
Discussion
The major finding of this study is that an increase in myocardial T1 during NOS inhibition is a marker of coronary microvascular endothelial function, or, more specifically, of coronary microvascular eNOS function. Others have previously sought to image coronary endothelial function. For example, Hays et al. showed that coronary artery cross-sectional area and blood flow before and during isometric handgrip exercise can be used to assess coronary endothelial function26. The present method uniquely probes the effect of inhibiting NOS on coronary microvascular permeability and, as demonstrated by the experiments in eNOS−/− mice, the effect was shown to be specifically mediated by eNOS. Thus, this method uses imaging to noninvasively probe the function of an enzyme that plays a key role in normal vascular physiology and in coronary microvascular pathophysiology.
In our experiments, we injected a bolus of LNAME and observed the system kinetics by imaging before and serially after the injection. The increase in myocardial T1 observed at 5 minutes after LNAME injection is consistent with prior literature where light and electron microscopy detected opening of interendothelial junctions (IEJ) within a few minutes of injecting LNAME9. In the same study, it was also observed that the response to LNAME on IEJ opening lasted longer than 30 minutes, which is longer than the transient effect of LNAME on myocardial T1 that we observed. This difference may be due to the higher dose of LNAME that was used in the IEJ experiment (30 mg/kg vs. 4 mg/kg), or due to the ex vivo context of the IEJ study as compared to our in vivo experiments. The return of T1 toward baseline that we observed at 20 minutes after LNAME injection is likely due to clearance by the lymphatic system, and the time course of our results is consistent with prior studies showing that acute edema causes gradual and significant elevation in the lymphatic flow rate within 30 minutes in the pulmonary27,28 and mesenteric lymphatic systems29.
Prior studies show that endothelial dysfunction is an early biomarker of vascular disease30–35. In the present study we detected coronary microvascular eNOS dysfunction at 12 and 18 weeks of HFD. Previously we showed that myocardial perfusion reserve is impaired in HFD mice at 18 weeks of diet, but not at 12 weeks of diet17. Thus, our imaging methods show that coronary microvascular eNOS dysfunction precedes impairment of myocardial perfusion reserve, which is consistent with the current understanding of the progression of coronary vascular disease in HFD mice.
Others have applied myocardial T1 mapping after the infusion of adenosine and observed an increase in T114. As adenosine is a vasodilator that increases blood flow and blood volume, that effect is attributed to vasodilation and an increase in myocardial blood volume. Our first-pass gadolinium-enhanced MRI experiments showed no change in myocardial blood flow. Also, LNAME is known to cause vasoconstriction. Given these results, it is unlikely that our observations of increased myocardial T1 after injection of LNAME are due to an increase in blood volume.
Our method probes microvascular eNOS function. In addition to the roles of eNOS in vasodilation, blood flow, and microvascular permeability, eNOS also plays important roles in inhibition of platelet aggregation and adhesion to the vascular wall36–38, an early event in the development of atherosclerosis, suppression of vascular smooth muscle cell proliferation39–41, and modulation of leukocyte-endothelial interactions42–44. Thus, methods to noninvasively assess eNOS function may be used in the future to shed light on the roles of microvascular eNOS in normal physiology and with regard to its various roles and functions.
Therapies that may prevent or treat eNOS dysfunction includes bone marrow cell treatment45,46, gene therapy47,48, drugs targeting the renin–angiotensin–aldosterone system12,49,50, and statins51. LNAME T1 mapping may be a useful method to test whether therapeutic agents promote improved eNOS function.
The present study had several limitations. In order to keep the total anesthesia time under two hours, we did not acquire whole-heart cine images, which would have provided heart weight and global left-ventricular function data. LNAME causes an increase in blood pressure5. Even though NOS inhibition with intravenous LNAME has been used previously for human imaging studies13, the side effect of increased blood pressure is not conducive to routine use in human subjects. Nonetheless, this method may be useful for preclinical studies that investigate mechanisms underlying and therapies for coronary microvascular endothelial dysfunction. The method was well tolerated in serial MRI sessions in anesthetized mice. While we showed that coronary microvascular endothelial dysfunction precedes impaired myocardial perfusion reserve in HFD mice, we did not determine the earliest time point where coronary microvascular endothelial dysfunction can be detected in this disease model. Future studies may seek to more precisely determine the time of onset of coronary microvascular endothelial dysfunction in HFD mice. We employed myocardial T1 mapping but not T2 mapping. The latter measurements would provide useful data, however the data acquisition times for current myocardial T2 mapping sequences for mice52,53 are long compared to the timing of changes in myocardial relaxation times after LNAME injection, which precluded the acquisition of these data. By applying better acceleration methods, T2 maps may be acquired in the future.
Acknowledgments
We acknowledge funding from Amercian Heart Association predoctoral fellowship 16PRE29750008, NIH 1S10RR019911-01 and NIH R01 EB001763. We acknowledge Dr. Brent French for helpful discussions regarding the role of eNOS in vascular function.
References
- 1.Ohara Y, Peterson TE, Harrison DG. Hypercholesterolemia increases endothelial superoxide anion production. Journal of Clinical Investigation. 1993;91(6):2546. doi: 10.1172/JCI116491. [DOI] [PMC free article] [PubMed] [Google Scholar]
- 2.Hink U, Li H, Mollnau H, Oelze M, Matheis E, Hartmann M, Skatchkov M, Thaiss F, Stahl RA, Warnholtz A. Mechanisms underlying endothelial dysfunction in diabetes mellitus. Circulation research. 2001;88(2):e14–e22. doi: 10.1161/01.res.88.2.e14. [DOI] [PubMed] [Google Scholar]
- 3.Kerr S, Brosnan MJ, McIntyre M, Reid JL, Dominiczak AF, Hamilton CA. Superoxide anion production is increased in a model of genetic hypertension. Hypertension. 1999;33(6):1353–1358. doi: 10.1161/01.hyp.33.6.1353. [DOI] [PubMed] [Google Scholar]
- 4.Förstermann U, Münzel T. Endothelial nitric oxide synthase in vascular disease: from marvel to menace. Circulation. 2006;113(13):1708–14. doi: 10.1161/CIRCULATIONAHA.105.602532. [DOI] [PubMed] [Google Scholar]
- 5.Filep JG, Foldes-Filep E, Sirois P. Nitric oxide modulates vascular permeability in the rat coronary circulation. Br J Pharmacol. 1993;108(2):323–6. doi: 10.1111/j.1476-5381.1993.tb12803.x. [DOI] [PMC free article] [PubMed] [Google Scholar]
- 6.Kubes P, Granger DN. Nitric oxide modulates microvascular permeability. Am J Physiol. 1992;262(2 Pt 2):H611–5. doi: 10.1152/ajpheart.1992.262.2.H611. [DOI] [PubMed] [Google Scholar]
- 7.Kurose I, Wolf R, Grisham MB, Granger DN. Modulation of ischemia/reperfusion-induced microvascular dysfunction by nitric oxide. Circ Res. 1994;74(3):376–82. doi: 10.1161/01.res.74.3.376. [DOI] [PubMed] [Google Scholar]
- 8.Baldwin AL, Thurston G, al Naemi H. Inhibition of nitric oxide synthesis increases venular permeability and alters endothelial actin cytoskeleton. Am J Physiol. 1998;274(5 Pt 2):H1776–84. doi: 10.1152/ajpheart.1998.274.5.H1776. [DOI] [PubMed] [Google Scholar]
- 9.Predescu D, Predescu S, Shimizu J, Miyawaki-Shimizu K, Malik AB. Constitutive eNOS-derived nitric oxide is a determinant of endothelial junctional integrity. Am J Physiol Lung Cell Mol Physiol. 2005;289(3):L371–81. doi: 10.1152/ajplung.00175.2004. [DOI] [PubMed] [Google Scholar]
- 10.He P, Liu B, Curry FE. Effect of nitric oxide synthase inhibitors on endothelial [Ca2+]i and microvessel permeability. Am J Physiol. 1997;272(1 Pt 2):H176–85. doi: 10.1152/ajpheart.1997.272.1.H176. [DOI] [PubMed] [Google Scholar]
- 11.Garcia JL, Fernandez N, Garcia-Villalon AL, Monge L, Gomez B, Dieguez G. Effects of nitric oxide synthesis inhibition on the goat coronary circulation under basal conditions and after vasodilator stimulation. Br J Pharmacol. 1992;106(3):563–7. doi: 10.1111/j.1476-5381.1992.tb14375.x. [DOI] [PMC free article] [PubMed] [Google Scholar]
- 12.Imanishi T, Tsujioka H, Ikejima H, Kuroi A, Takarada S, Kitabata H, Tanimoto T, Muragaki Y, Mochizuki S, Goto M, et al. Renin inhibitor aliskiren improves impaired nitric oxide bioavailability and protects against atherosclerotic changes. Hypertension. 2008;52(3):563–72. doi: 10.1161/HYPERTENSIONAHA.108.111120. [DOI] [PubMed] [Google Scholar]
- 13.Frandsenn U, Bangsbo J, Sander M, Hoffner L, Betak A, Saltin B, Hellsten Y. Exercise-induced hyperaemia and leg oxygen uptake are not altered during effective inhibition of nitric oxide synthase with N(G)-nitro-L-arginine methyl ester in humans. J Physiol. 2001;531(Pt 1):257–64. doi: 10.1111/j.1469-7793.2001.0257j.x. [DOI] [PMC free article] [PubMed] [Google Scholar]
- 14.Liu A, Wijesurendra RS, Francis JM, Robson MD, Neubauer S, Piechnik SK, Ferreira VM. Adenosine Stress and Rest T1 Mapping Can Differentiate Between Ischemic, lnfarcted, Remote, and Normal Myocardium Without the Need for Gadolinium Contrast Agents. Jacc-Cardiovascular Imaging. 2016;9(1):27–36. doi: 10.1016/j.jcmg.2015.08.018. [DOI] [PMC free article] [PubMed] [Google Scholar]
- 15.Naresh NK, Chen X, Roy RJ, Antkowiak PF, Annex BH, Epstein FH. Accelerated dual-contrast first-pass perfusion MRI of the mouse heart: development and application to diet-induced obese mice. Magn Reson Med. 2015;73(3):1237–45. doi: 10.1002/mrm.25238. [DOI] [PMC free article] [PubMed] [Google Scholar]
- 16.Calligaris SD, Lecanda M, Solis F, Ezquer M, Gutierrez J, Brandan E, Leiva A, Sobrevia L, Conget P. Mice long-term high-fat diet feeding recapitulates human cardiovascular alterations: an animal model to study the early phases of diabetic cardiomyopathy. PLoS One. 2013;8(4):e60931. doi: 10.1371/journal.pone.0060931. [DOI] [PMC free article] [PubMed] [Google Scholar]
- 17.Naresh NK, Butcher JT, Lye RJ, Chen X, Isakson BE, Gan LM, Kramer CM, Annex BH, Epstein FH. Cardiovascular magnetic resonance detects the progression of impaired myocardial perfusion reserve and increased left-ventricular mass in mice fed a high-fat diet. J Cardiovasc Magn Reson. 2016;18(1):53. doi: 10.1186/s12968-016-0273-y. [DOI] [PMC free article] [PubMed] [Google Scholar]
- 18.Ketonen J, Pilvi T, Mervaala E. Caloric restriction reverses high-fat diet-induced endothelial dysfunction and vascular superoxide production in C57Bl/6 mice. Heart Vessels. 2010;25(3):254–62. doi: 10.1007/s00380-009-1182-x. [DOI] [PubMed] [Google Scholar]
- 19.Molnar J, Yu S, Mzhavia N, Pau C, Chereshnev I, Dansky HM. Diabetes induces endothelial dysfunction but does not increase neointimal formation in high-fat diet fed C57BL/6J mice. Circ Res. 2005;96(11):1178–84. doi: 10.1161/01.RES.0000168634.74330.ed. [DOI] [PubMed] [Google Scholar]
- 20.Kobayasi R, Akamine EH, Davel AP, Rodrigues MA, Carvalho CR, Rossoni LV. Oxidative stress and inflammatory mediators contribute to endothelial dysfunction in high-fat diet-induced obesity in mice. J Hypertens. 2010;28(10):2111–9. doi: 10.1097/HJH.0b013e32833ca68c. [DOI] [PubMed] [Google Scholar]
- 21.Naresh NK, Chen X, Moran E, Tian Y, French BA, Epstein FH. Repeatability and variability of myocardial perfusion imaging techniques in mice: Comparison of arterial spin labeling and first-pass contrast-enhanced MRI. Magn Reson Med. 2015 doi: 10.1002/mrm.25769. [DOI] [PMC free article] [PubMed] [Google Scholar]
- 22.Vandsburger MH, Janiczek RL, Xu Y, French BA, Meyer CH, Kramer CM, Epstein FH. Improved arterial spin labeling after myocardial infarction in mice using cardiac and respiratory gated look-locker imaging with fuzzy C-means clustering. Magn Reson Med. 2010;63(3):648–57. doi: 10.1002/mrm.22280. [DOI] [PMC free article] [PubMed] [Google Scholar]
- 23.Chen X, Salerno M, Yang Y, Epstein FH. Motion-compensated compressed sensing for dynamic contrast-enhanced MRI using regional spatiotemporal sparsity and region tracking: block low-rank sparsity with motion-guidance (BLOSM) Magn Reson Med. 2014;72(4):1028–38. doi: 10.1002/mrm.25018. [DOI] [PMC free article] [PubMed] [Google Scholar]
- 24.Cernicanu A, Axel L. Theory-based signal calibration with single-point T1 measurements for first-pass quantitative perfusion MRI studies. Acad Radiol. 2006;13(6):686–93. doi: 10.1016/j.acra.2006.02.040. [DOI] [PubMed] [Google Scholar]
- 25.Jerosch-Herold M, Wilke N, Stillman AE. Magnetic resonance quantification of the myocardial perfusion reserve with a Fermi function model for constrained deconvolution. Med Phys. 1998;25(1):73–84. doi: 10.1118/1.598163. [DOI] [PubMed] [Google Scholar]
- 26.Hays AG, Hirsch GA, Kelle S, Gerstenblith G, Weiss RG, Stuber M. Noninvasive visualization of coronary artery endothelial function in healthy subjects and in patients with coronary artery disease. J Am Coll Cardiol. 2010;56(20):1657–65. doi: 10.1016/j.jacc.2010.06.036. [DOI] [PubMed] [Google Scholar]
- 27.Erdmann AJ, 3rd, Vaughan TR, Jr, Brigham KL, Woolverton WC, Staub NC. Effect of increased vascular pressure on lung fluid balance in unanesthetized sheep. Circ Res. 1975;37(3):271–84. doi: 10.1161/01.res.37.3.271. [DOI] [PubMed] [Google Scholar]
- 28.Bhattacharya M, Kallet RH, Ware LB, Matthay MA. Negative-Pressure Pulmonary Edema. Chest. 2016;150(4):927–933. doi: 10.1016/j.chest.2016.03.043. [DOI] [PubMed] [Google Scholar]
- 29.Zhang W, Shibamoto T, Kuda Y, Kurata Y, Shinomiya S, Kida M, Tsuchida H. Vascular perfusion limits mesenteric lymph flow during anaphylactic hypotension in rats. Am J Physiol Regul Integr Comp Physiol. 2012;302(10):R1191–6. doi: 10.1152/ajpregu.00695.2011. [DOI] [PubMed] [Google Scholar]
- 30.Bonetti PO, Lerman LO, Lerman A. Endothelial dysfunction: a marker of atherosclerotic risk. Arterioscler Thromb Vasc Biol. 2003;23(2):168–75. doi: 10.1161/01.atv.0000051384.43104.fc. [DOI] [PubMed] [Google Scholar]
- 31.Hadi HA, Carr CS, Al Suwaidi J. Endothelial dysfunction: cardiovascular risk factors, therapy, and outcome. Vasc Health Risk Manag. 2005;1(3):183–98. [PMC free article] [PubMed] [Google Scholar]
- 32.Suwaidi JA, Hamasaki S, Higano ST, Nishimura RA, Holmes DR, Jr, Lerman A. Long-term follow-up of patients with mild coronary artery disease and endothelial dysfunction. Circulation. 2000;101(9):948–54. doi: 10.1161/01.cir.101.9.948. [DOI] [PubMed] [Google Scholar]
- 33.Brunner H, Cockcroft JR, Deanfield J, Donald A, Ferrannini E, Halcox J, Kiowski W, Luscher TF, Mancia G, Natali A, et al. Endothelial function and dysfunction. Part II: Association with cardiovascular risk factors and diseases. A statement by the Working Group on Endothelins and Endothelial Factors of the European Society of Hypertension. J Hypertens. 2005;23(2):233–46. doi: 10.1097/00004872-200502000-00001. [DOI] [PubMed] [Google Scholar]
- 34.Gokce N, Keaney JK, Jr, JAV . Endotheliopathies: Clinical manifestations of endothelial dysfunction. In: JL, AIS, editors. Thrombosis and Hemorrhage. 2. Williams and Wilkins; 1998. pp. 901–924. [Google Scholar]
- 35.Levine GN, Keaney JF, Jr, Vita JA. Cholesterol reduction in cardiovascular disease. Clinical benefits and possible mechanisms. N Engl J Med. 1995;332(8):512–21. doi: 10.1056/NEJM199502233320807. [DOI] [PubMed] [Google Scholar]
- 36.Alheid U, Frölich JC, Förstermann U. Endothelium-derived relaxing factor from cultured human endothelial cells inhibits aggregation of human platelets. Thrombosis research. 1987;47(5):561–571. doi: 10.1016/0049-3848(87)90361-6. [DOI] [PubMed] [Google Scholar]
- 37.Busse R, Lackhoff A, Bassenge E. Endothelium-derived relaxant factor inhibits platelet activation. Naunyn-Schmiedeberg’s archives of pharmacology. 1987;336(5):566–571. doi: 10.1007/BF00169315. [DOI] [PubMed] [Google Scholar]
- 38.Radomski MW, Palmer RM, Moncada S. The anti-aggregating properties of vascular endothelium: interactions between prostacyclin and nitric oxide. Br J Pharmacol. 1987;92(3):639–46. doi: 10.1111/j.1476-5381.1987.tb11367.x. [DOI] [PMC free article] [PubMed] [Google Scholar]
- 39.Garg UC, Hassid A. Nitric oxide-generating vasodilators and 8-bromo-cyclic guanosine monophosphate inhibit mitogenesis and proliferation of cultured rat vascular smooth muscle cells. Journal of Clinical Investigation. 1989;83(5):1774. doi: 10.1172/JCI114081. [DOI] [PMC free article] [PubMed] [Google Scholar]
- 40.Nunokawa Y, Tanaka S. Interferon-γ inhibits proliferation of rat vascular smooth muscle cells by nitric oxide generation. Biochemical and biophysical research communications. 1992;188(1):409–415. doi: 10.1016/0006-291x(92)92400-r. [DOI] [PubMed] [Google Scholar]
- 41.Nakaki T, Nakayama M, Kato R. Inhibition by nitric oxide and nitric oxide-producing vasodilators of DNA synthesis in vascular smooth muscle cells. European Journal of Pharmacology: Molecular Pharmacology. 1990;189(6):347–353. doi: 10.1016/0922-4106(90)90031-r. [DOI] [PubMed] [Google Scholar]
- 42.Arndt H, Smith CW, Granger DN. Leukocyte-endothelial cell adhesion in spontaneously hypertensive and normotensive rats. Hypertension. 1993;21(5):667–673. doi: 10.1161/01.hyp.21.5.667. [DOI] [PubMed] [Google Scholar]
- 43.Kubes P, Suzuki M, Granger D. Nitric oxide: an endogenous modulator of leukocyte adhesion. Proceedings of the National Academy of Sciences. 1991;88(11):4651–4655. doi: 10.1073/pnas.88.11.4651. [DOI] [PMC free article] [PubMed] [Google Scholar]
- 44.Dimmeler S, Zeiher AM. Nitric oxide–an endothelial cell survival factor. Cell Death & Differentiation. 1999;6(10) doi: 10.1038/sj.cdd.4400581. [DOI] [PubMed] [Google Scholar]
- 45.Wohlfart P, Xu H, Endlich A, Habermeier A, Closs EI, Hubschle T, Mang C, Strobel H, Suzuki T, Kleinert H, et al. Antiatherosclerotic effects of small-molecular-weight compounds enhancing endothelial nitric-oxide synthase (eNOS) expression and preventing eNOS uncoupling. J Pharmacol Exp Ther. 2008;325(2):370–9. doi: 10.1124/jpet.107.128009. [DOI] [PubMed] [Google Scholar]
- 46.Sasaki K, Heeschen C, Aicher A, Ziebart T, Honold J, Urbich C, Rossig L, Koehl U, Koyanagi M, Mohamed A, et al. Ex vivo pretreatment of bone marrow mononuclear cells with endothelial NO synthase enhancer AVE9488 enhances their functional activity for cell therapy. Proc Natl Acad Sci U S A. 2006;103(39):14537–41. doi: 10.1073/pnas.0604144103. [DOI] [PMC free article] [PubMed] [Google Scholar]
- 47.Chen AF, Ren J, Miao CY. Nitric oxide synthase gene therapy for cardiovascular disease. Jpn J Pharmacol. 2002;89(4):327–36. doi: 10.1254/jjp.89.327. [DOI] [PubMed] [Google Scholar]
- 48.O’Connor DM, O’Brien T. Nitric oxide synthase gene therapy: progress and prospects. Expert Opin Biol Ther. 2009;9(7):867–78. doi: 10.1517/14712590903002047. [DOI] [PubMed] [Google Scholar]
- 49.Satoh M, Fujimoto S, Arakawa S, Yada T, Namikoshi T, Haruna Y, Horike H, Sasaki T, Kashihara N. Angiotensin II type 1 receptor blocker ameliorates uncoupled endothelial nitric oxide synthase in rats with experimental diabetic nephropathy. Nephrol Dial Transplant. 2008;23(12):3806–13. doi: 10.1093/ndt/gfn357. [DOI] [PMC free article] [PubMed] [Google Scholar]
- 50.Imanishi T, Ikejima H, Tsujioka H, Kuroi A, Kobayashi K, Muragaki Y, Mochizuki S, Goto M, Yoshida K, Akasaka T. Addition of eplerenone to an angiotensin-converting enzyme inhibitor effectively improves nitric oxide bioavailability. Hypertension. 2008;51(3):734–41. doi: 10.1161/HYPERTENSIONAHA.107.104299. [DOI] [PubMed] [Google Scholar]
- 51.John S, Schlaich M, Langenfeld M, Weihprecht H, Schmitz G, Weidinger G, Schmieder RE. Increased bioavailability of nitric oxide after lipid-lowering therapy in hypercholesterolemic patients. Circulation. 1998;98(3):211–216. doi: 10.1161/01.cir.98.3.211. [DOI] [PubMed] [Google Scholar]
- 52.Beyers RJ, Smith RS, Xu Y, Piras BA, Salerno M, Berr SS, Meyer CH, Kramer CM, French BA, Epstein FH. T(2) -weighted MRI of post-infarct myocardial edema in mice. Magn Reson Med. 2012;67(1):201–9. doi: 10.1002/mrm.22975. [DOI] [PMC free article] [PubMed] [Google Scholar]
- 53.Coolen BF, Simonis FF, Geelen T, Moonen RP, Arslan F, Paulis LE, Nicolay K, Strijkers GJ. Quantitative T2 mapping of the mouse heart by segmented MLEV phase-cycled T2 preparation. Magnetic resonance in medicine. 2014;72(2):409–417. doi: 10.1002/mrm.24952. [DOI] [PubMed] [Google Scholar]


