Abstract
Purpose
To measure temperature over a large brain volume with fine spatiotemporal resolution.
Methods
A 3D stack-of-stars echo-planar imaging (3D SoS EPI) sequence combining EPI and radial sampling with golden angle spacing was implemented at 3 Tesla for proton resonance frequency-shift temperature imaging. The sequence acquires a 188×188×43 image matrix with 1.5×1.5×2.75 mm3 spatial resolution. Temperature maps were reconstructed using SENSE image reconstruction followed by the image domain hybrid method, and using the k-space hybrid method. In vivo temperature maps were acquired without heating to measure temperature precision in the brain, and in a phantom during high-intensity focused ultrasound sonication.
Results
In vivo temperature standard deviation was less than 1°C at dynamic scan times down to 0.75 seconds. For a given frame rate, scanning at a minimum TR with minimum acceleration yielded the lowest standard deviation. With frame rates around 3.0 seconds, the scan was tolerant to a small number of receive coils, and temperature standard deviation was 48% higher than a standard 2DFT temperature mapping scan, but provided whole-brain coverage. Phantom temperature maps with no visible aliasing were produced for dynamic scan times as short as 0.38 seconds. k-Space hybrid reconstructions were more tolerant to acceleration.
Conclusion
3D SoS EPI temperature mapping provides volumetric brain coverage and fine spatiotemporal resolution.
Keywords: MR thermometry, magnetic resonance imaging-guided focused ultrasound, high-intensity focused ultrasound, non-Cartesian, EPI
Introduction
Temperature monitoring with magnetic resonance imaging (MRI) has enabled many emerging minimally invasive thermal therapies, including MR-guided focused ultrasound (MRgFUS) and radiofrequency, microwave, and laser interstitial thermal therapies. Of these, MRgFUS is a completely noninvasive method that uses an external transducer to focus high-power ultrasound into tissue for ablation [1]. MRgFUS has been used successfully in humans to treat uterine fibroids [2], bone metastasis-related pain [3], cancer [4–6], and deep brain tissue [7–11]. Additionally, transcranial MRgFUS [12] has been used without ablation to disrupt the blood-brain barrier for improved drug delivery [13] and induce neuromodulation [14].
MRI-derived temperature maps based on the proton resonance frequency (PRF) shift with temperature are predominantly used to guide MRgFUS treatment [15]. Temperature maps are typically acquired using phase-sensitive 2D Fourier transform (2DFT) gradient-recalled echo (GRE) pulse sequences with a long echo time (TE). To maintain adequate signal-to-noise ratio (SNR) for temperature monitoring, most clinical MR thermometry implementations for transcranial MRgFUS image a single 2DFT slice [16]. While acoustic energy from MRgFUS is nominally focused to a single point in one slice, there is an ever-present risk that unintended heating may occur in the near- and far-fields of the transducer. Therefore, repeated sonications with different scanning planes are required to capture both the focal spot and the background with sufficient speed, precision, and volumetric coverage, leading to long treatment times and reduced patient safety.
Previous efforts in volumetric thermometry have used pulse sequences that acquire k-space data more efficiently and/or temperature reconstruction methods that exploit undersampled k-space data, so that a full volume of data can be viewed at a high frame rate. Multi-slice echo-planar imaging (EPI) [17], segmented 3D EPI [18], and multi-slice excitation [19] sequences have been proposed. Multi-echo Cartesian [20, 21] and spiral [22, 23] sequences have been shown to optimize SNR in the presence of off-resonance effects. Iterative temperature reconstruction approaches have also enabled acceleration via temporal regularization [24–27] or fitting constrained treatment models [28]; generally, these approaches can be applied to any k-space trajectory. Of note, high acceleration parallel imaging-based techniques (which require multiple receive coils in close proximity to the body) are currently incompatible with transcranial MRgFUS since the coils must sit outside the transducer, far away from the head.
In this work, we describe and validate a hybrid radial-Cartesian pulse sequence that acquires a 3D stack-of-stars k-space trajectory with EPI planes (3D SoS EPI) for volumetric thermometry. EPI is performed in the slice dimension to provide rapid slice sampling of a volume k-space. Successive EPI planes are spaced by the golden angle [29], so that radial spokes are approximately evenly distributed regardless of the width of the reconstruction window. This enables the length and positions of reconstruction windows to be set retrospectively. The center of k-space (which contains most of the dynamic image contrast) is acquired each TR, ensuring that peak heat will not be missed. Also, unlike other non-Cartesian trajectories, off-resonance phase is mostly accrued in the EPI phase-encode dimension where it is straightforward to correct [30]. This sequence has been demonstrated in neuroimaging applications other than thermometry [31–35].
Here, we reconstruct volumetric temperature maps from 3D SoS EPI using both non-Cartesian SENSE image reconstruction [36] followed by hybrid multibaseline subtraction and referenceless temperature map estimation [37], and the k-space hybrid method [28]. Each slice is reconstructed in parallel. In vivo experiments without heating and phantom experiments with heating were performed at 3 Tesla to characterize temperature precision across acceleration factors, repetition times and number of receive coils, and to compare the sequence with a 2DFT temperature mapping sequence [38]. We further show that heating-induced chemical shift (CS) pixel shifts that arise in the hot spot can be corrected retrospectively [30]. Aspects of this work have been presented previously in Ref. [39].
Methods
Pulse Sequence
Figure 1a shows the k-space sampling pattern of the 3D SoS EPI pulse sequence, which was implemented on a 3 T scanner (Philips Achieva, Philips Healthcare, Best, The Netherlands). Following slab excitation along the phase-encode axis, each TR acquires a 2D GRE-EPI plane using in-plane frequency-encoding (kx−ky) along a radial line and through-plane Cartesian phase-encoding (kz). The plane is rotated between consecutive TRs by 111.25° about the phase-encoded (kz) axis to acquire a 3D stack-of-stars k-space trajectory with golden angle spacing [29]. Gradient spoiling is applied at the end of each TR [40]. The sequence was implemented with parameters: 28.0×28.0 cm2 in-plane (axial) FOV; 188×188 in-plane matrix size; 1.50×1.50 mm2 in-plane voxel size; 43 slices; slice thickness 2.75 mm; TE 17 ms; phase-encode direction F/H; phase-encoding pixel bandwidth 31.9 Hz/px; frequency-encoding bandwidth 1904.9 Hz/px; spectrally-selective fat suppression. The encoded 43 slice imaging volume in the slab direction was 9 mm wider than the excited slab to prevent wrap-around artifacts. The minimum TR for the sequence was 47 ms. Second-order shimming was performed prior to acquisition. Prior to dynamic scanning, non-phase-encoded echoes are acquired for each rotated EPI plane to estimate line-to-line delays and phase shifts for ghost correction.
Figure 1.
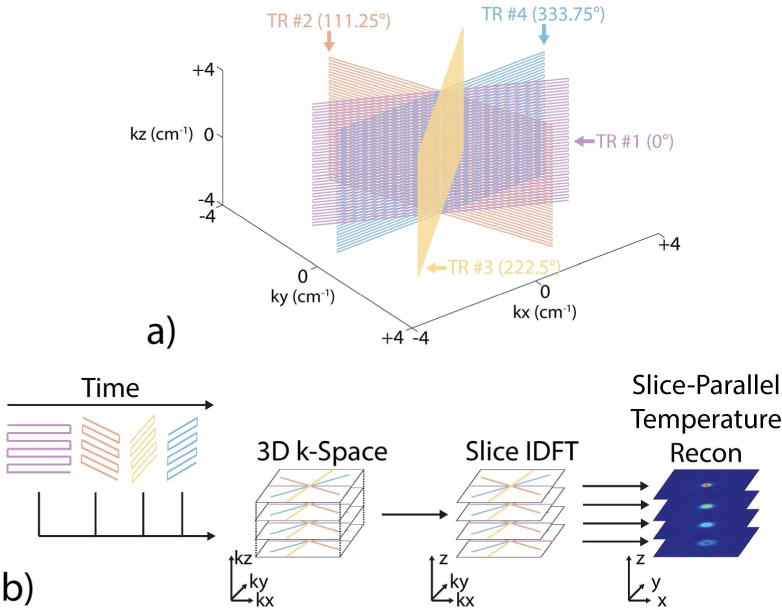
3D SoS EPI k-space sampling pattern and temperature reconstruction pipeline. (a) 3D SoS EPI combines in-plane radial sampling and through-plane Cartesian EPI sampling. Each TR acquires one 2D GRE-EPI plane. Successive EPI planes are spaced by the golden angle (111.25°), producing radial spokes in a 3D stack-of-stars k-space trajectory. (b) One volume k-space or one dynamic in the reconstruction spans any contiguous set of radial lines in the acquisition. The length and position of the reconstruction window can be set retrospectively. In this illustration, data from four consecutive TRs forms a k-space volume, which is inverse Fourier transformed in the slice dimension (z) to produce a hybrid k-space/image domain volume (kx−ky−z). Slices are then processed in parallel to reconstruct temperature maps using CG-SENSE with hybrid multibaseline subtraction and referenceless thermometry, or with k-space hybrid thermometry.
Temperature Reconstruction
Temperature maps were reconstructed offline in MATLAB R2015a (MathWorks, Natick, MA, USA) using Vanderbilt University’s parallel computing cluster (Advanced Computing Center for Research and Education, Vanderbilt University, Nashville, TN, USA). Figure 1b shows the 3D SoS EPI temperature reconstruction pipeline. First, EPI ghost correction was performed on each EPI plane in the dynamic acquisition [41]. Next, each volume k-space was inverse Fourier transformed along the slice (z) dimension, creating a hybrid k-space/image domain (kx−ky−z) volume. One volume k-space in the reconstruction (i.e., one dynamic) spanned a contiguous set of radial lines; the acceleration factor/dynamic scan time was adjusted post-acquisition (e.g., fewer contiguous radial lines per dynamic for more acceleration/shorter dynamic scan time). Each slice’s k-space data in the hybrid volume was then reconstructed in parallel using one Intel Xeon Westmere processing core (Intel Corporation, Santa Clara, CA) and 1 GB of RAM per slice.
Temperature maps were reconstructed using one of two temperature reconstruction methods:
The hybrid multibaseline subtraction and referenceless method [37] after image reconstruction using conjugate gradient (CG)-SENSE [36], or
The k-space hybrid method [28].
CG-SENSE image reconstructions used 30 iterations and nonuniform fast Fourier transforms [42]. Both temperature reconstruction approaches fit the same hybrid multibaseline and referenceless image model, but in k-space hybrid, the Fourier transform of the model is directly fit to the k-space data, skipping the image reconstruction step. The hybrid multibaseline and referenceless image model is given by:
| [1] |
where yj is the complex-valued MR signal at voxel j, are complex baseline library images reconstructed from fully-sampled k-space data acquired prior to treatment, wl are baseline image weights, A is a matrix of smooth (e.g., low-order polynomial) basis functions, c is a polynomial coefficient vector, and θ is a heating-induced phase shift, which is negative for a temperature increase [15]. The role of the baseline library images is to capture physiological and anatomical amplitude and phase variations across respiratory and cardiac cycles. The polynomial phase shift Ac models phase changes induced by smooth magnetic field shifts, such as center frequency drift and those caused by respiration. The phase shift θ that results from targeted heating is modeled as a focal shift separate from these other phase components. In both the CG-SENSE plus image domain hybrid and k-space hybrid algorithms, the model in Eq. 1 is fit to the acquired data in a least-squares sense using an alternating minimization algorithm, in which the variables w, c, and θ are alternately updated while holding the others fixed. Sparsity of θ is exploited by the algorithms to separate it from the non-sparse polynomial phase shift, and reflects the fact that in a targeted thermal therapy like MRgFUS, temperature rises will occur in a minority of image voxels. Once fit, the phase shifts in θ are converted to temperature changes in degrees Celsius according to:
| [2] |
where γ is the gyromagnetic ratio in radians per second per Tesla, α = −0.01 ppm/°C is the PRF change coefficient, B0 is the main field strength in Tesla, and T E is the echo time in seconds [15]. Further details are provided in Refs. [37] and [28]. Experimental data sets described below and MATLAB code to process data sets can be downloaded from https://bitbucket.org/wgrissom/epi_stackofstars_thermometry.
In Vivo Experiments
To evaluate temperature precision in vivo, 5 healthy volunteers (3F/2M) were scanned without heating with the approval of the Institutional Review Board at Vanderbilt University. An 8-channel head coil array was used for reception.
First, a 3D SoS EPI scan was collected in each subject to measure temperature standard deviation (using the approach described below) across acceleration factors/dynamic scan times: no acceleration (300 radial lines; 14.1 s per dynamic), 2× (150 lines; 7.1 s), 4.7× (64 lines; 3.0 s), 9.4× (32 lines; 1.5 s), 18.8× (16 lines; 0.75 s), and 37.5× (8 lines; 0.38 s). These scans used the sequence’s minimum TR of 47 ms and a 14° flip angle (the Ernst angle, assuming a brain T1 of 1400 ms at 3.0 T). The scans lasted 2 minutes (2450 radial lines were acquired). For each acceleration factor, temperature maps were reconstructed from consecutive non-overlapping temporal windows. To investigate the tradeoff between TR and acceleration factor for a fixed dynamic scan time, 3D SoS EPI scans were then acquired at three TRs (47, 90, and 180 ms). Subjects were scanned at the Ernst angle (14° for TR = 47 ms, 20° for TR = 90 ms, and 28° for TR = 180 ms) and for 2 minutes per acquisition (2450 radial lines for TR = 47 ms, 1250 lines for TR = 90 ms, 650 lines for TR = 180 ms). From each data set, temperature maps were reconstructed from non-overlapping temporal windows with an acceleration factor set to achieve a dynamic scan time of 3 seconds (64 radial lines per dynamic for TR = 47 ms, 34 lines for TR = 90 ms, 17 lines for TR = 180 ms). Most current MRgFUS systems use the scanner’s single-channel body coil for receive, and the number of receive coils that can be placed close to the head for high SNR and sensitivity encoding will likely remain limited in the near future. For this reason, we also investigated the dependence of temperature precision on the number of coils by compressing the multicoil data from 8 to 6, 4, 2, and 1 coil(s) by truncating the singular values of the data matrix before temperature reconstruction [43]. Coil-compressed images and temperature maps were reconstructed from the 47 ms TR data set with 4.7× acceleration/3.0 second dynamic scan time. We note that the SNR in these compressed reconstructions will still be higher than that of a body coil scan, so the results will primarily characterize how temperature precision depends on the spatial encoding provided by a multicoil array. Also note that in the one-coil case, the SENSE reconstruction becomes a single-coil iterative reconstruction, with no sensitivity encoding. In addition to the single-shot 3D SoS EPI scans above, images were acquired in one subject using two and three interleaved EPI shots to qualitatively evaluate reduction of off-resonance distortions with additional shots. This increased the phase-encoding pixel bandwidth from 31.9 Hz/px (single-shot) to 61.9 Hz/px (two shots) and 99.0 Hz/px (three shots). No other scan parameters were changed.
To compare the temperature precision of 3D SoS EPI against a standard 2DFT temperature mapping sequence and illustrate differences in volume coverage, 2DFT scans were also acquired in each subject with representative parameters [38]: 28.0×28.0 cm2 FOV; 188×96 image matrix; 1.50×3.0 mm2 voxel size; 1 slice; slice thickness 2.75 mm; TE/TR 12 ms/35 ms; flip angle 13°; phase-encode direction A/P; frequency-encoding pixel bandwidth 60 Hz/px; spectrally-selective fat suppression; dynamic scan time 3.3 s. The scans were repeated in three slice orientations (axial, sagittal, and coronal). Temperature standard deviation was calculated using the same hybrid multibaseline and referenceless processing applied to the CG-SENSE plus image domain hybrid 3D SoS EPI reconstructions. Subjects were scanned for 2 minutes/40 dynamics. The first 4 images were used in the 2DFT baseline library, so that approximately the same total time was spent on baseline acquisition for 2DFT and 3D SoS EPI. The resulting 2DFT maps were compared to those reconstructed from a TR = 47 ms 3D SoS EPI acquisition with 4.3× acceleration/69 lines per dynamic, so that the dynamic scans were matched (3.3 seconds per dynamic).
For the above experiments, in vivo temperature errors and subsequently temperature standard deviation were calculated using the hybrid model validation procedure described in [28]. Briefly, the hybrid image model in Equation 1 was twice fit to each frame of data. The first 300 radial lines of each 3D SoS EPI acquisition were used to reconstruct a baseline image for this model using CG-SENSE. All reconstructions used a single baseline, so w was fixed to 1, and a first-order polynomial basis (drift and two linear terms) [37]. In the first fit, only the polynomial coefficients c were updated, while the temperature phase shifts θ were held fixed at zero. In the second fit, the estimate of c from the first fit was held fixed, and only θ was updated, with no sparsity penalty or other regularization. Using this approach, all residual temperature errors after fitting the baseline and referenceless components of the model are captured in θ. The temperature error maps were then used to calculate through-time temperature standard deviation maps [23], and to calculate temperature standard deviation across all brain voxels, time points, and subjects. Temperature standard deviation was computed in brain tissue only, as determined using an automatic segmentation algorithm [44]. The through-time standard deviation maps were upsampled onto a 1.50 mm3 isotropic grid for display.
Phantom Heating Experiments
A cylindrical tissue-mimicking gel phantom was sonicated using a Philips Sonalleve MR-HIFU system (Philips Healthcare, Vantaa, Finland) operated at 1.1 MHz and 110 W for 30 s. A single point 14.0 cm from the transducer was targeted with A/P FUS beam propagation. A 3D SoS EPI scan was acquired during the sonication with a TR of 47 ms, no fat suppression and A/P phase-encoding, but otherwise the same parameters as the in vivo scans. A five-element HIFU abdominal coil array was used for reception. The phantom was allowed to cool for 10 minutes between consecutive sonications. Temperature maps were compared across acceleration factors.
Temperature maps from 3D SoS EPI were further compared to 2DFT temperature maps. The same imaging parameters from the in vivo scan were used for 2DFT, except without fat suppression and with R/L phase-encoding. For all acceleration factors, temperature maps were reconstructed using a single baseline, 6 TR/282 ms window spacing, and a zeroth-order polynomial basis. ℓ1 sparsity and roughness regularization parameters were tuned for these reconstructions to be λ = 2 × 10⁻⁵ and β = 2−14, respectively [28]. The hybrid model parameters w, c, and θ were all initialized to zeros in the first dynamic, and were thereafter initialized to the previous dynamic’s values. At peak heat, CG-SENSE plus image domain hybrid 3D SoS EPI temperature maps were reconstructed with and without chemical shift compensation applied in the EPI phase encode dimension [30].
Results
In Vivo Experiments
Figure 2a shows 3D SoS EPI through-time temperature standard deviation maps versus acceleration factor in one subject. Temperature uncertainty increased with acceleration factor for both reconstruction methods, but increased more rapidly for CG-SENSE plus image domain hybrid. Figure 2b plots temperature standard deviation calculated over all brain voxels, time, and all 5 subjects. The k-space hybrid reconstructions achieved uncertainty less than 1°C up to an acceleration factor of 18.8×, corresponding to a dynamic scan time of 0.75 seconds. The CG-SENSE plus image domain hybrid reconstructions achieved uncertainty less than 1°C up to 2× acceleration, and 1.13°C uncertainty at 4.7×, corresponding to a dynamic scan time of 3.0 seconds. Figure 3a shows through-time temperature standard deviation maps versus TR in one subject, reconstructed with a fixed 3 second dynamic scan time. Figure 3b plots temperature standard deviation calculated over all brain voxels, time, and subjects. Temperature uncertainty increases with increasing TR for both CG-SENSE plus image domain hybrid and k-space hybrid reconstructions. These results indicate that it is better to acquire more data with a minimum TR than to use a longer TR to obtain higher signal amplitude in each readout. Again, k-space hybrid reconstructions have consistently lower uncertainty than CG-SENSE plus image domain hybrid. Figure 4a shows through-time temperature standard deviation maps versus number of receive coils for one subject, and Figure 4b plots temperature standard deviation calculated over space, time and all five subjects. Figure 4a shows that through-time temperature standard deviations generally increased as the number of coils decreased, though due to significantly increased blurring in the CG-SENSE reconstructions for two coils and one coil (which is visible in the magnitude images of Figure 4a), the through-time temperature standard deviation maps of CG-SENSE plus image-domain hybrid actually improved. However, temperature variability over space and subjects increased moreso in those cases, and Figure 4b shows that the overall temperature precision of both reconstructions consistently degraded as the number of coils decreased. In all cases though, k-space hybrid temperature precision was better than 1°C, and except for the one coil reconstruction, CG-SENSE plus image domain hybrid temperature precision was better than 1.25°C.
Figure 2.
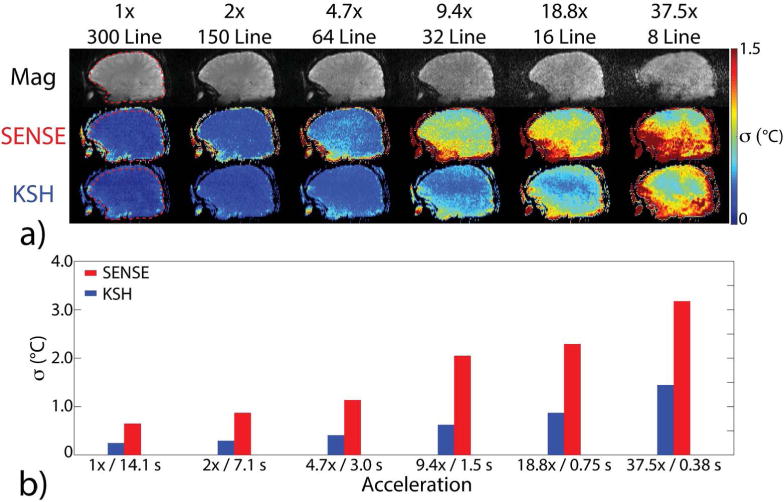
In vivo temperature precision (σ) versus acceleration factor/dynamic scan time, for a TR of 47 ms. (a) Brain magnitude images and through-time temperature standard deviation maps in one of the five volunteers are shown across acceleration factors, from 300 lines (no acceleration/14.1 s per dynamic) to 8 lines (37.5× acceleration/0.38 s per dynamic), using CG-SENSE plus image domain hybrid (SENSE) and k-space hybrid (KSH) reconstruction methods. Images are cropped A-P to display the central 22.0 cm FOV. (b) Temperature standard deviation versus acceleration factor, calculated over the brain volumes of 5 subjects. Standard deviations were calculated from brain tissue only using an automatic brain segmentation algorithm. The ROI for the subject in (a) is outlined in the 1×/no acceleration column.
Figure 3.
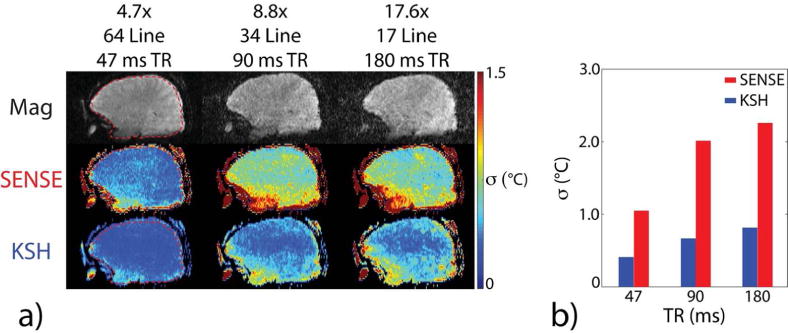
In vivo temperature precision versus TR with a fixed dynamic scan time of 3 seconds (varying acceleration). (a) Brain magnitude images and through-time temperature standard deviation maps using CG-SENSE plus image domain hybrid (SENSE) and k-space hybrid (KSH) reconstructions in one of the five volunteers across TRs (47, 90, and 180 ms). Images are cropped A-P to display the central 22.0 cm FOV. (b) Temperature standard deviation versus TR, calculated over the brain volumes of 5 subjects. The ROI for the subject in (a) is outlined in the 47 ms TR column.
Figure 4.
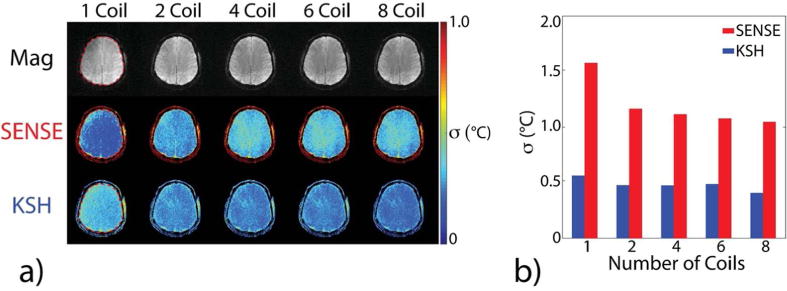
In vivo temperature precision versus number of receive coils, for TR 47 ms and 4.7× acceleration, corresponding to 3 seconds/64 radial lines per dynamic. (a) Brain magnitude images and through-time temperature standard deviation maps in one of the five volunteers across the number of receive coils. Images were cropped A-P and R-L to display the central 22.0 cm FOV. (b) Temperature standard deviation versus number of coils, calculated over the brain volumes of 5 subjects. The ROI for the subject in (a) is outlined in the 1 coil column.
Figure 5 compares 3D SoS EPI and 2DFT temperature standard deviation. Temperature uncertainty at the edge of the brain was higher in 2DFT, due to its higher sensitivity to physiological noise (e.g., brain pulsation during the cardiac cycle, respiration, subject motion). These uncertainties are averaged down in 3D SoS EPI since the center of k-space is sampled every TR. Average temperature standard deviation was calculated in ROIs that excluded blood vessel artifacts, zipper-like artifacts across the frequency-encoded dimension that may be due to external interference, and uncertainties around the edge of the brain in the 2DFT maps. Excluding these artifacts, computed across 5 subjects and 3 slice orientations, 3D SoS EPI had approximately 48% higher temperature uncertainty than 2DFT (0.27°C for 2DFT vs. 0.40°C for 3D SoS EPI). However, this tradeoff in temperature precision enables full brain coverage with 3D SoS EPI, as illustrated in Figure 6.
Figure 5.
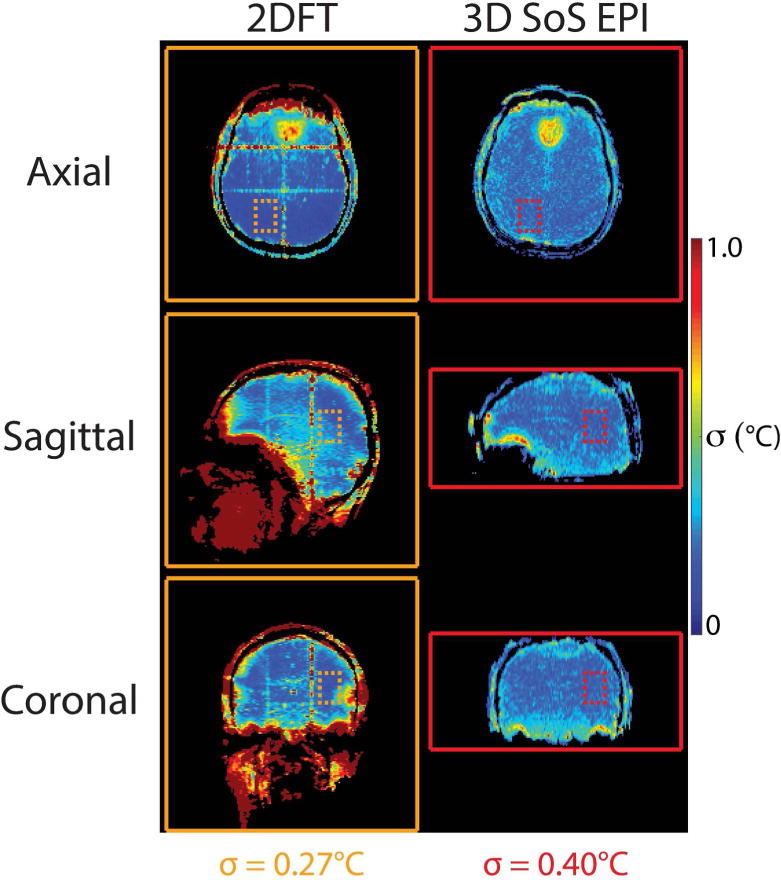
In vivo temperature precision of 3D SoS EPI compared to standard 2DFT single-slice temperature mapping. Through-time temperature standard deviation maps in one of five volunteers from each sequence, in axial, sagittal, and coronal slice orientations. 3D SoS EPI maps were reconstructed at a 3.3 second dynamic scan time matched to 2DFT (4.3× acceleration factor/69 radial lines per dynamic). Images were not cropped; solid lines indicate the FOV of each acquisition. Temperature standard deviation calculated over all 5 subjects was 0.27°C for 2DFT and 0.4°C for 3D SoS EPI. For 2DFT, temperature standard deviation was calculated in ROIs (dashed lines) that excluded artifacts and brain edges.
Figure 6.
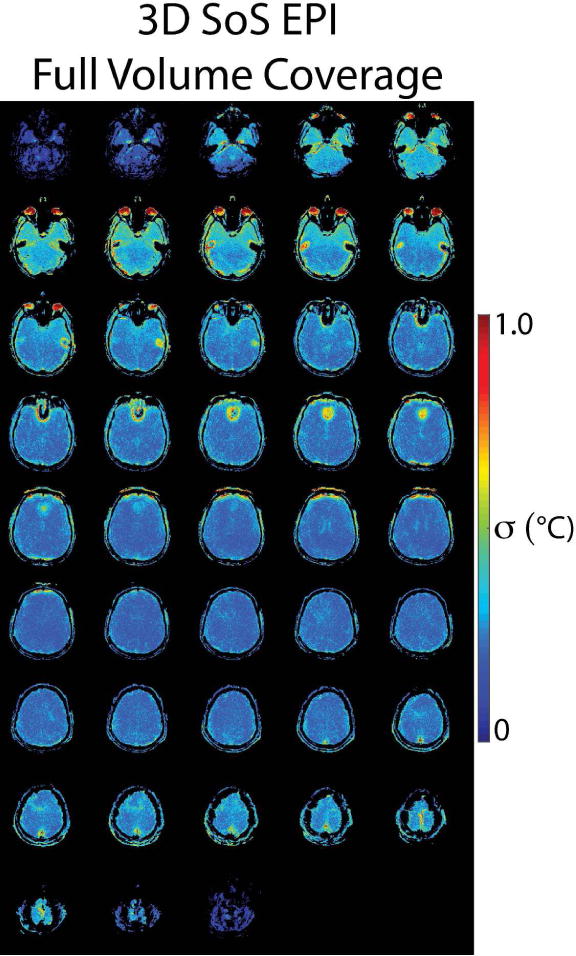
Axial through-time temperature standard deviation maps in one of five volunteers from the 3D SoS EPI sequence, to illustrate the sequence’s overall brain coverage.
Figure 7 illustrates off-resonance distortions in 3D SoS EPI versus multishot factor. Geometric distortions (white arrows) are present in brain regions where field inhomogeneities are significant. Off-resonance causes signal to shift in the slice dimension. Distortions are reduced when multiple shots are used, which increases the pixel bandwidth from 31.9 Hz/px (single-shot) to 61.9 Hz/px (two shots) and 99.0 Hz/px (three shots). At 3.0 T, the PRF changes by 1.27 Hz per °C, so the expected pixel shifts also improve with more shots (25.1°C/px with single-shot EPI, 48.7°C/px with two shots, 78.0°C/px with three shots). An axial slice positioned for monitoring MRgFUS thalamotomy (red arrow) is also shown, which contains no visible distortions around the thalamus with any number of shots.
Figure 7.
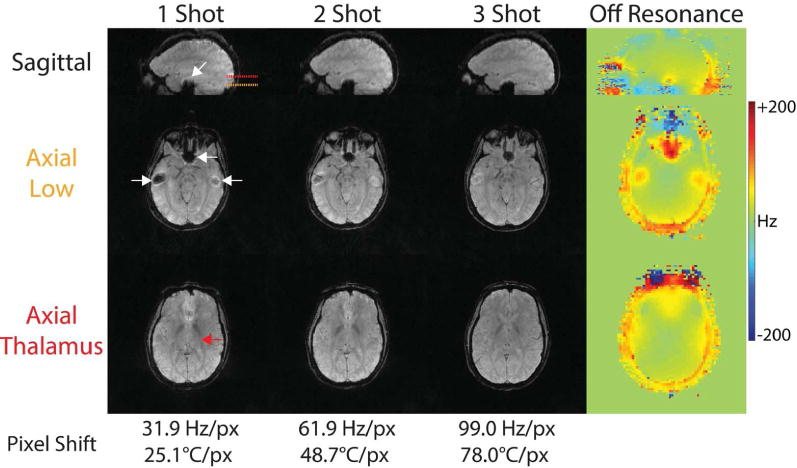
Minimizing in vivo off-resonance distortions in 3D SoS EPI with multishot acquisitions. Due to its relatively low pixel bandwidth in the EPI phase-encode dimension (31.9 Hz), single-shot EPI suffers from signal dropouts in regions with large off-resonance, such as near the sinuses (white arrows). This is mitigated when the 3D SoS EPI readout is divided into multiple shorter shots. There are no visible distortions at any multishot factor in the region targeted for thalamotomy (red arrow).
Phantom Heating Experiments
Figure 8 shows phantom images and temperature maps acquired during focused ultrasound sonication across acceleration factors, and Figure 9 plots k-space hybrid-reconstructed temperature in the hottest voxel versus time with no acceleration/14.1 seconds per image, and 4.7× acceleration/3.0 seconds per image. k-Space hybrid peak heat temperature maps perpendicular to the ultrasound beam in 3D SoS EPI are very similar up to acceleration factors of 37.5× (8 lines per dynamic or 0.38 s). The peak temperature changes in the hottest voxel for each reconstruction range from 33.7 to 35.7°C, with somewhat greater variability at the higher accelerations where temperature standard deviation reaches 1°C (Figure 2b). CG-SENSE plus image domain hybrid temperature maps are also similar up to an acceleration factor of 4.7× (64 lines per dynamic or 3.0 s), but due to undersampling of the higher spatial frequencies, the hot spot is blurred out and peak temperature is underestimated at higher factors, and overall peak heat temperature changes in the hottest voxel range from 17.3 to 36.3°C. Figure 9 shows that the longer reconstruction window of the 300-line k-space hybrid reconstruction blurs out the temporal evolution of the hottest voxel’s temperature, which in particular results in a higher initial temperature and a slightly lower peak temperature compared to a 64-line reconstruction.
Figure 8.
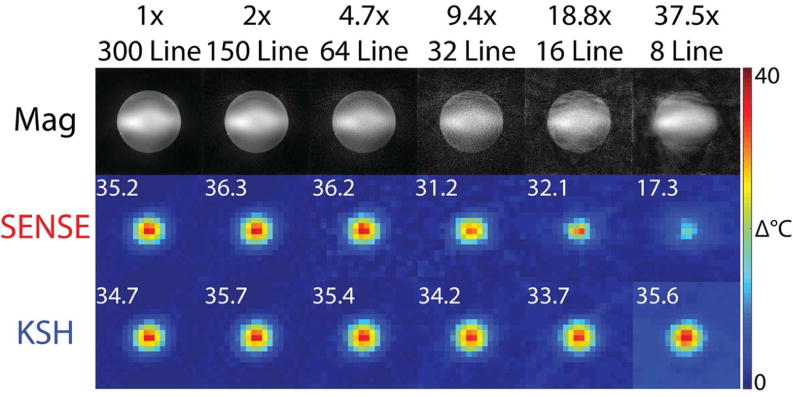
Phantom heating versus acceleration factor. Peak heat temperature maps perpendicular to the ultrasound beam reconstructed across acceleration factors, from 300 lines (no acceleration/14.1 s per dynamic) to 8 lines (37.5× acceleration/0.38 s). The inset numbers report peak temperature in the hottest voxel for each reconstruction. Temperature maps were cropped F-H and R-L to display the central 9.5 cm FOV. Magnitude images were not cropped and display the entire 28.0 cm.
Figure 9.
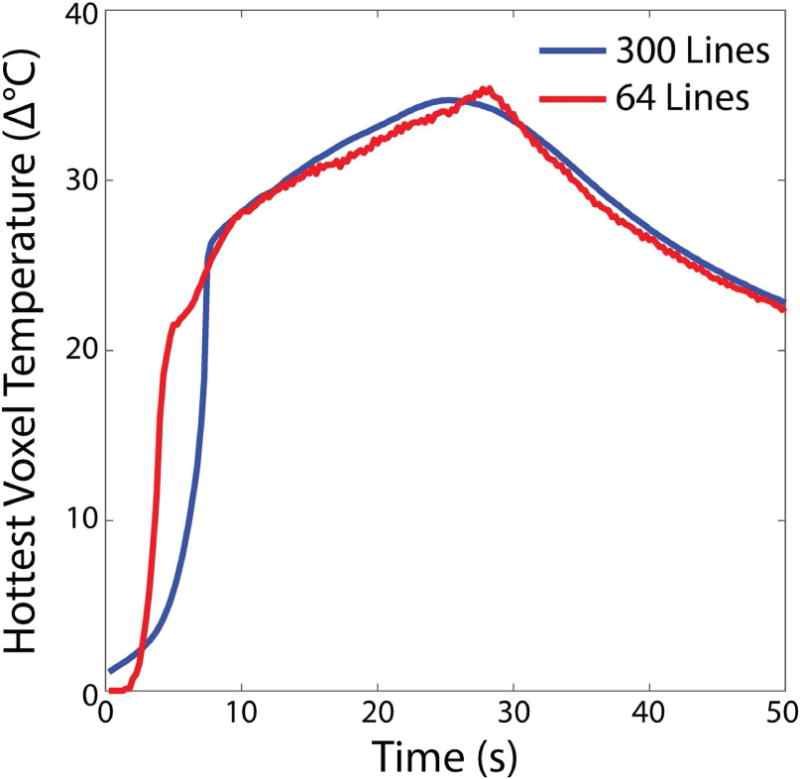
Phantom temperature curves for 300 lines (14.1 s per dynamic) and 64 lines (3 s per dynamic), in the hottest voxel.
3D SoS EPI and 2DFT temperature maps in a plane parallel to the ultrasound beam are compared in Figure 10a, and profiles through the middle of the hot spot in each dimension are plotted in Figure 10b. 3D SoS EPI maps are shown with and without chemical shift (CS) compensation in the EPI phase encode dimension (the vertical dimension in Figure 10a). The full width at half maximum of the hot spot was 11.5 mm parallel to the beam/3.7 mm perpendicular to the beam for 2DFT (peak temperature 33.3°C), 13.1 mm parallel/4.2 mm perpendicular for 3D SoS EPI (peak temperature 34.4°C), and 13.1 mm parallel/4.1 mm perpendicular for 3D SoS EPI after CS correction (peak temperature 34.5°C). The differences in full width at half maximum between 3D SoS EPI and 2DFT are less than the encoded voxel size in each dimension, and are likely due to a slightly wider imaging point spread function for the 3D SoS EPI reconstructions. As expected, chemical shift correction shifted the hot spot by approximately one voxel (2.75 mm) in the phase encode dimension, so that its peak better lined up with the 2DFT temperature profile, which was acquired with a higher pixel bandwidth (60 Hz/px or 47.2°C/pixel in 2DFT vs. 31.9 Hz/px or 25.1°C/pixel in 3D SoS EPI). The Supporting Information Video shows entire 2DFT and 3D SoS EPI time series temperature maps. The top row in the video shows maps from a single 3D SoS EPI slice matching a 2DFT slice taken parallel to the ultrasound beam. A maximal intensity projection volume rendering of the 3D SoS EPI acquisition volume is displayed with temperature overlaid in the bottom row, and is rotated over a range of viewing angles. With slice-parallel processing, each 3D SoS EPI volume took 3.4±0.8 s (averaged across dynamics) to reconstruct using CG-SENSE plus image domain hybrid; k-space hybrid took 80.7±14.2 s. Compute times were not recorded for the in vivo temperature error reconstructions since that version of the algorithm would not be used during treatment.
Figure 10.

Phantom heating spatial profiles. (a) 3D SoS EPI and 2DFT peak heat temperature maps parallel to the ultrasound beam, which propagates in the vertical dimension. 3D SoS EPI maps are shown before and after CS correction, which is applied in the EPI phase-encode/vertical dimension. Temperature maps were cropped to display the central 5.4 cm × 2.3 cm FOV. The encoding directions for each pulse sequence are labeled and were chosen so that chemical shift artifacts accrued in the same direction in both scans (parallel to ultrasound beam propagation). (b) Heating profiles at peak heat in the center of the hot spot, parallel (‖) and perpendicular (⊥) to ultrasound propagation. CS correction shifted the 3D SoS EPI temperature profile by approximately one pixel (1.5 mm) in the parallel dimension.
Discussion
3D SoS EPI combines non-Cartesian radial sampling in-plane and Cartesian EPI sampling through-plane. EPI in the slice dimension provides rapid slice sampling of a volume k-space. Successive EPI planes are spaced by the golden angle, producing radial spokes in a 3D stack-of-stars k-space. Golden angle spacing approximately evenly distributes radial spokes, regardless of the width of the reconstruction window [29]. This enables the length and position of the reconstruction window to be determined retrospectively. Furthermore, unlike 2DFT scans and conventional 3D EPI and spiral scans, 3D SoS EPI samples the center of k-space in every TR, so a sliding window reconstruction will not miss the peak of the heating curve (a clinically important parameter [16]). In this work, in vivo experiments characterized the dependence of temperature precision on acceleration factor, TR, and number of receive coils. Phantom heating experiments were also performed using a clinical MRgFUS system. Both sets of experiments compared the sequence to a standard single-slice 2DFT temperature mapping sequence.
Two approaches to reconstructing 3D SoS EPI temperature maps were compared. The first was CG-SENSE image reconstruction followed by image domain hybrid temperature estimation, and the second was the k-space hybrid method. The first approach comprised separate image reconstruction and temperature estimation steps, which is the more familiar and widely-available workflow. It also required less compute time than k-space hybrid, so it could be more readily implemented on a scanner for real-time use. However, its temperature uncertainty was always higher than k-space hybrid’s, and its maximum acceleration was more limited. This is because CG-SENSE reconstructed a completely new image at each dynamic, without leveraging prior data. In comparison, k-space hybrid directly fits a phase-shifted fully-sampled baseline image to the k-space data. This resulted in lower errors due to undersampling and consequently lower temperature uncertainty. In practice, this translates to higher acceleration factors and/or the requirement of fewer receive coils, with the tradeoff of longer computation times. Thus, in the near term, CG-SENSE plus image domain hybrid reconstruction is better suited for real-time use with moderate acceleration, while k-space hybrid is better suited for retrospective use with higher acceleration. Temporally-constrained reconstruction may represent a middle ground between these two strategies [27].
In vivo experiments showed that k-space hybrid and CG-SENSE plus image domain hybrid temperature reconstructions achieved a temperature uncertainty better than or near 1.0°C up to a clinically representative dynamic scan time of 3 seconds [16], with k-space hybrid providing lower uncertainty at all factors and better than 1.0°C uncertainty down to a 0.75 second dynamic scan time. Temperature maps with no visible errors were also obtained with both methods down to a 3 second dynamic scan time in phantom MRgFUS heating experiments. We found that temperature uncertainty increased when TR was increased while maintaining a fixed 3 second dynamic scan time, suggesting that the benefit of higher signal with longer TRs is offset by the concomitant reduction in signal averaging and errors from increased k-space undersampling. The temperature precisions of the reconstructions were tolerant to a small number of receive coils, which is important since imaging in MRgFUS is presently receive coil-limited since the transducer must be closest to the body. Current clinical neuro MRgFUS systems either use a single-channel body coil for reception, or an eight-channel receive coil that sits outside the transducer and provides limited spatial encoding capability. As expected, the uncertainty of the reconstructions did increase as the number of coils decreased, though it remained near 0.5°C for k-space hybrid reconstructions across all numbers of coils.
MR thermometry for transcranial MRgFUS neurosurgery is currently based on a single-slice 2DFT sequence [16]. 3D SoS EPI (reconstructed at a matched dynamic scan time) achieved slightly worse temperature uncertainty (0.4°C across all subjects) than 2DFT (0.27°C), but this tradeoff enabled volumetric brain coverage and the uncertainty was still much better than 1.0°C. Furthermore, to our knowledge, no other temperature imaging sequence provides volumetric thermometry with equivalent spatiotemporal resolution. While scans were not performed with a clinical transcranial MRgFUS system in this work, the in-plane FOV of the 3D SoS EPI scan is large enough to accommodate the water bath of the ExAblate Neuro system (InSightec Ltd., Haifa, Israel), and matched the FOV of the 2DFT scan which was set based on that system. The in vivo comparison to 2DFT also indicated that 3D SoS EPI may be less sensitive to brain and blood pulsations, though due to its lower through-slice bandwidth it may be more sensitive to off-resonance changes caused by motion such as nodding, which changes the off-resonance distribution around the sinuses. However, in practice MRgFUS treatments use a stereotactic frame to immobilize the head which minimizes such motion. Since our experiments were not performed with a clinical transcranial MRgFUS system, we cannot make absolute assertions about 3D SoS EPI temperature standard errors for actual systems. We expect that errors would be larger on actual systems, principally due to larger distances between receive coils and the head. However, one can reasonably expect that the relative performance of 3D SoS EPI to single-slice 2DFT (the standard clinical sequence) would be preserved when moving to a clinical system.
A weakness of the present implementation of 3D SoS EPI is its relatively low pixel bandwidth in the phase encode dimension, which in the present study was the head-foot dimension. This led to through-plane distortions in brain regions above the sinuses and ear canals, and a shift (approximately one pixel) of the peak of the hot spot in the phantom experiment. As demonstrated, these distortions and hot spot shifts are most easily addressed using multishot scans, which increase pixel bandwidth by a factor equal to the number of shots. However, this comes at the cost of scan time. If multiple receive coils are available across the slice dimension, parallel imaging acceleration in that dimension would also increase pixel bandwidth by a factor equal to the acceleration factor. This would either necessitate a full 3D image/temperature reconstruction, or a k-space-domain parallel imaging reconstruction such as GRAPPA to fill in missing data in the phase encode dimension prior to in-plane radial reconstruction [45]. We also demonstrated that a previously-described chemical shift compensation method can correct hot spot displacement in the slice dimension. Real-time implementations of that algorithm are available [30]. Another possible source of 3D SoS EPI image and temperature map distortions is readout delays and line-to-line phase shifts that cause ghosting in the phase encode dimension. These were addressed in the current implementation by acquiring non-phase-encoded reference scans for each EPI plane and estimating correction terms from them that were applied to the phase-encoded data [41]. Though it was not observed in the current implementation, radial scans also often suffer from trajectory errors that cause projections to miss the center of k-space. These could be compensated using an automatic trajectory correction method that estimates the errors from the data itself, based on data consistency between projections [46, 47]. Finally, we note that Svedin et al have also explored 3D golden angle radial acquisitions for MR thermometry [48, 49]. Specifically, they developed a 3D golden angle acquisition for thermometry in the breast. Compared to the 3D SoS EPI scan described here, the authors traded off volumetric coverage for the ability to separate water and fat images and measure , which may enable thermometry in fat. They used the phase at the center of k-space for respiration correction, and reconstructed images using a radial keyhole technique; the same reconstruction could be applied to 3D SoS EPI.
Conclusion
We proposed and validated a hybrid radial-EPI temperature mapping pulse sequence that can acquire temperature maps with volumetric brain coverage and 1.5 mm × 1.5 mm (in-plane) × 2.75 mm (through-plane) spatial resolution. High frame rates can be obtained using either the k-space hybrid temperature reconstruction method or a standard CG-SENSE plus image domain hybrid method.
Supplementary Material
Supporting Video S1: 2DFT and 3D SoS EPI time series temperature maps acquired during focused ultrasound heating of a gel phantom. The top row shows maps from a single 3D SoS EPI slice matching a 2DFT slice taken parallel to the ultrasound beam. A maximal intensity projection volume rendering of the 3D SoS EPI acquisition volume is displayed with temperature overlaid in the bottom row, and is rotated over a range of viewing angles.
Acknowledgments
This work was supported by the Focused Ultrasound Foundation and NIH grants R01 DA 019912 and T32 GM 007347.
References
- 1.Kobus T, McDannold N. Update on clinical magnetic resonance-guided focused ultrasound applications. Magn Reson Imaging Clin N Am. 2015;23:657–667. doi: 10.1016/j.mric.2015.05.013. [DOI] [PMC free article] [PubMed] [Google Scholar]
- 2.Tempany CMC, Stewart EA, McDannold N, Quade BJ, Jolesz FA, Hynynen K. MR imaging-guided focused ultrasound surgery of uterine leiomyomas: a feasibility study. Radiology. 2003;226:897–905. doi: 10.1148/radiol.2271020395. [DOI] [PubMed] [Google Scholar]
- 3.Catane R, Beck A, Inbar Y, Rabin T, Shabshin N, Hengst S, Pfeffer R, Hanannel A, Dogadkin O, Liberman B, et al. MR-guided focused ultrasound surgery (MRgFUS) for the palliation of pain in patients with bone metastases–preliminary clinical experience. Ann Oncol. 2006;18:163–167. doi: 10.1093/annonc/mdl335. [DOI] [PubMed] [Google Scholar]
- 4.Hynynen K, Pomeroy O, Smith DN, Huber PE, McDannold NJ, Kettenbach J, Baum J, Singer S, Jolesz FA. MR imaging-guided focused ultrasound surgery of fibroadenomas in the breast: a feasibility study. Radiology. 2001;219:176–185. doi: 10.1148/radiology.219.1.r01ap02176. [DOI] [PubMed] [Google Scholar]
- 5.McDannold N, Clement GT, Black P, Jolesz F, Hynynen K. Transcranial magnetic resonance imaging-guided focused ultrasound surgery of brain tumors: initial findings in 3 patients. Neurosurgery. 2010;66:323–332. doi: 10.1227/01.NEU.0000360379.95800.2F. [DOI] [PMC free article] [PubMed] [Google Scholar]
- 6.Chopra R, Colquhoun A, Burtnyk M, N’djin WA, Kobelevskiy I, Boyes A, Siddiqui K, Foster H, Sugar L, Haider MA, et al. MR imaging-controlled transurethral ultrasound therapy for conformal treatment of prostate tissue: initial feasibility in humans. Radiology. 2012;265:303–313. doi: 10.1148/radiol.12112263. [DOI] [PubMed] [Google Scholar]
- 7.Martin E, Jeanmonod D, Morel A, Zadicario E, Werner B. High-intensity focused ultrasound for noninvasive functional neurosurgery. Ann Neurol. 2009;66:858–861. doi: 10.1002/ana.21801. [DOI] [PubMed] [Google Scholar]
- 8.Jeanmonod D, Werner B, Morel A, Michels L, Zadicario E, Schiff G, Martin E. Transcranial magnetic resonance imaging-guided focused ultrasound: noninvasive central lateral thalamotomy for chronic neuropathic pain. Neurosurg Focus. 2012;32:E1. doi: 10.3171/2011.10.FOCUS11248. [DOI] [PubMed] [Google Scholar]
- 9.Elias WJ, Huss D, Voss T, Loomba J, Khaled M, Zadicario E, Frysinger RC, Sperling SA, Wylie S, Monteith SJ, et al. A pilot study of focused ultrasound thalamotomy for essential tremor. N Engl J Med. 2013;369:640–8. doi: 10.1056/NEJMoa1300962. [DOI] [PubMed] [Google Scholar]
- 10.Magara A, Bühler R, Moser D, Kowalski M, Pourtehrani P, Jeanmonod D. First experience with MR-guided focused ultrasound in the treatment of Parkinson’s disease. J Ther Ultrasound. 2014;2:11. doi: 10.1186/2050-5736-2-11. [DOI] [PMC free article] [PubMed] [Google Scholar]
- 11.Elias WJ, Lipsman N, Ondo WG, Ghanouni P, Kim YG, Lee W, Schwartz M, Hynynen K, Lozano AM, Shah BB, et al. A randomized trial of focused ultrasound thalamotomy for essential tremor. N Engl J Med. 2016;375:730–739. doi: 10.1056/NEJMoa1600159. [DOI] [PubMed] [Google Scholar]
- 12.Monteith S, Sheehan J, Medel R, Wintermark M, Eames M, Snell J, Kassell NF, Elias WJ. Potential intracranial applications of magnetic resonance-guided focused ultrasound surgery. J Neurosurg. 2013;118:215–21. doi: 10.3171/2012.10.JNS12449. [DOI] [PubMed] [Google Scholar]
- 13.Kinoshita M, McDannold N, Jolesz FA, Hynynen K. Noninvasive localized delivery of Herceptin to the mouse brain by MRI-guided focused ultrasound-induced blood-brain barrier disruption. Proc Natl Acad Sci U S A. 2006;103:11719–23. doi: 10.1073/pnas.0604318103. [DOI] [PMC free article] [PubMed] [Google Scholar]
- 14.Legon W, Sato TF, Opitz A, Mueller J, Barbour A, Williams A, Tyler WJ. Transcranial focused ultrasound modulates the activity of primary somatosensory cortex in humans. Nat Neurosci. 2014;17:322–9. doi: 10.1038/nn.3620. [DOI] [PubMed] [Google Scholar]
- 15.Rieke V, Pauly KB. MR thermometry. J Magn Reson Imaging. 2008;27:376–390. doi: 10.1002/jmri.21265. [DOI] [PMC free article] [PubMed] [Google Scholar]
- 16.Lipsman N, Schwartz ML, Huang Y, Lee L, Sankar T, Chapman M, Hynynen K, Lozano AM. MR-guided focused ultrasound thalamotomy for essential tremor: a proof-of-concept study. Lancet Neurol. 2013;12:462–468. doi: 10.1016/S1474-4422(13)70048-6. [DOI] [PubMed] [Google Scholar]
- 17.Köhler MO, Mougenot C, Quesson B, Enholm J, Le Bail B, Laurent C, Moonen CT, Ehnholm GJ. Volumetric HIFU ablation under 3D guidance of rapid MRI thermometry. Med Phys. 2009;36:3521–3535. doi: 10.1118/1.3152112. [DOI] [PubMed] [Google Scholar]
- 18.Todd N, Vyas U, de Bever J, Payne A, Parker DL. Reconstruction of fully three-dimensional high spatial and temporal resolution MR temperature maps for retrospective applications. Magn Reson Med. 2012;67:724–730. doi: 10.1002/mrm.23055. [DOI] [PMC free article] [PubMed] [Google Scholar]
- 19.Marx M, Plata J, Pauly KB. Toward volumetric MR thermometry with the MASTER sequence. IEEE Trans Med Imaging. 2015;34:148–155. doi: 10.1109/TMI.2014.2349912. [DOI] [PMC free article] [PubMed] [Google Scholar]
- 20.Mulkern RV, Panych LP, Hynynen K, Jolesz FA, McDannold NJ. Tissue temperature monitoring with multiple gradient-echo imaging sequences. J Magn Reson Imaging. 1998;8:493–502. doi: 10.1002/jmri.1880080234. [DOI] [PubMed] [Google Scholar]
- 21.Todd N, Diakite M, Payne A, Parker DL. In vivo evaluation of multi-echo hybrid PRF/T1 approach for temperature monitoring during breast MR-guided focused ultrasound surgery treatments. Magn Reson Med. 2014;72:793–799. doi: 10.1002/mrm.24976. [DOI] [PMC free article] [PubMed] [Google Scholar]
- 22.Marx M, Pauly KB. Improved MRI thermometry with multiple-echo spirals. Magn Reson Med. 2016;76:747–756. doi: 10.1002/mrm.25914. [DOI] [PMC free article] [PubMed] [Google Scholar]
- 23.Marx M, Ghanouni P, Pauly KB. Specialized volumetric thermometry for improved guidance of MRgFUS in brain. Magn Reson Med. 2016 doi: 10.1002/mrm.26385. [DOI] [PubMed] [Google Scholar]
- 24.Todd N, Adluru G, Payne A, DiBella EV, Parker D. Temporally constrained reconstruction applied to MRI temperature data. Magn Reson Med. 2009;62:406–419. doi: 10.1002/mrm.22012. [DOI] [PMC free article] [PubMed] [Google Scholar]
- 25.Todd N, Payne A, Parker DL. Model predictive filtering for improved temporal resolution in MRI temperature imaging. Magn Reson Med. 2010;63:1269–1279. doi: 10.1002/mrm.22321. [DOI] [PMC free article] [PubMed] [Google Scholar]
- 26.Roujol S, Ries M, Quesson B, Moonen C, de Senneville BD. Real-time MR-thermometry and dosimetry for interventional guidance on abdominal organs. Magn Reson Med. 2010;63:1080–1087. doi: 10.1002/mrm.22309. [DOI] [PubMed] [Google Scholar]
- 27.Todd N, Prakash J, Odéen H, de Bever J, Payne A, Yalavarthy P, Parker DL. Toward real-time availability of 3D temperature maps created with temporally constrained reconstruction. Magn Reson Med. 2014;71:1394–1404. doi: 10.1002/mrm.24783. [DOI] [PMC free article] [PubMed] [Google Scholar]
- 28.Gaur P, Grissom WA. Accelerated MRI thermometry by direct estimation of temperature from undersampled k-space data. Magn Reson Med. 2015;73:1914–1925. doi: 10.1002/mrm.25327. [DOI] [PMC free article] [PubMed] [Google Scholar]
- 29.Winkelmann S, Schaeffter T, Koehler T, Eggers H, Doessel O. An optimal radial profile order based on the golden ratio for time-resolved MRI. IEEE Trans Med Imaging. 2007;26:68–76. doi: 10.1109/TMI.2006.885337. [DOI] [PubMed] [Google Scholar]
- 30.Gaur P, Partanen A, Werner B, Ghanouni P, Bitton R, Pauly KB, Grissom WA. Correcting heat-induced chemical shift distortions in proton resonance frequency-shift thermometry. Magn Reson Med. 2016;76:172–182. doi: 10.1002/mrm.25899. [DOI] [PMC free article] [PubMed] [Google Scholar]
- 31.McNab JA, Gallichan D, Miller KL. 3D steady-state diffusion-weighted imaging with trajectory using radially batched internal navigator echoes (TURBINE) Magn Reson Med. 2010;63:235–242. doi: 10.1002/mrm.22183. [DOI] [PubMed] [Google Scholar]
- 32.Jonathan SV, Vakil P, Jeong YI, Menon RG, Ansari SA, Carroll TJ. RAZER: A pulse sequence for whole-brain bolus tracking at high frame rates. Magn Reson Med. 2014;71:2127–2138. doi: 10.1002/mrm.24882. [DOI] [PubMed] [Google Scholar]
- 33.Graedel NN, McNab JA, Chiew M, Miller KL. Motion correction for functional MRI with three-dimensional hybrid radial-Cartesian EPI. Magn Reson Med. 2016;13:333–43. doi: 10.1002/mrm.26390. [DOI] [PMC free article] [PubMed] [Google Scholar]
- 34.Shrestha M, Mildner T, Schlumm T, Robertson SH, Möller H. Three-dimensional echo-planar cine imaging of cerebral blood supply using arterial spin labeling. MAGMA. 2016;29:799–810. doi: 10.1007/s10334-016-0565-0. [DOI] [PMC free article] [PubMed] [Google Scholar]
- 35.Stäb D, Bollmann S, Langkammer C, Bredies K, Barth M. Accelerated mapping of magnetic susceptibility using 3D planes-on-a-paddlewheel (POP) EPI at ultra-high field strength. NMR Biomed. 2016 doi: 10.1002/nbm.3620. [DOI] [PubMed] [Google Scholar]
- 36.Pruessmann KP, Weiger M, Börnert P, Boesiger P. Advances in sensitivity encoding with arbitrary k-space trajectories. Magn Reson Med. 2001;46:638–651. doi: 10.1002/mrm.1241. [DOI] [PubMed] [Google Scholar]
- 37.Grissom WA, Rieke V, Holbrook AB, Medan Y, Lustig M, Santos J, McConnell MV, Pauly KB. Hybrid referenceless and multibaseline subtraction MR thermometry for monitoring thermal therapies in moving organs. Med Phys. 2010;37:5014–5026. doi: 10.1118/1.3475943. [DOI] [PMC free article] [PubMed] [Google Scholar]
- 38.Rieke V, Instrella R, Rosenberg J, Grissom W, Werner B, Martin E, Pauly KB. Comparison of temperature processing methods for monitoring focused ultrasound ablation in the brain. J Magn Reson Imaging. 2013;38:1462–1471. doi: 10.1002/jmri.24117. [DOI] [PMC free article] [PubMed] [Google Scholar]
- 39.Jonathan SV, Grissom WA. High-resolution whole-brain MR thermometry with a 3D EPI stack-of-stars pulse sequence; In Proceedings of the 5th International Symposium on Focused Ultrasound; North Bethesda, MD, USA. 2016. p. 8. [Google Scholar]
- 40.Vakil P, Ansari SA, Hurley MC, Bhat H, Batjer HH, Bendok BR, Eddleman CS, Carroll TJ. Magnetization spoiling in radial FLASH contrast-enhanced MR digital subtraction angiography. J Magn Reson Imaging. 2012;36:249–258. doi: 10.1002/jmri.23630. [DOI] [PMC free article] [PubMed] [Google Scholar]
- 41.Schmitt F, Stehling MK, Turner R. Echo-planar imaging: theory technique and application. Berlin, Heidelberg: Springer; 1998. p. 662. [Google Scholar]
- 42.Fessler J, Sutton B. Nonuniform fast fourier transforms using min-max interpolation. IEEE Trans Signal Process. 2003;51:560–574. [Google Scholar]
- 43.Buehrer M, Pruessmann KP, Boesiger P, Kozerke S. Array compression for MRI with large coil arrays. Magn Reson Med. 2007;57:1131–1139. doi: 10.1002/mrm.21237. [DOI] [PubMed] [Google Scholar]
- 44.Smith SM. Fast robust automated brain extraction. Hum Brain Mapp. 2002;17:143–155. doi: 10.1002/hbm.10062. [DOI] [PMC free article] [PubMed] [Google Scholar]
- 45.Griswold MA, Jakob PM, Heidemann RM, Nittka M, Jellus V, Wang J, Kiefer B, Haase A. Generalized autocalibrating partially parallel acquisitions (GRAPPA) Magn Reson Med. 2002;47:1202–1210. doi: 10.1002/mrm.10171. [DOI] [PubMed] [Google Scholar]
- 46.Deshmane A, Blaimer M, Breuer F, Jakob PM, Duerk JL, Seiberlich N, Griswold MA. Self-calibrated trajectory estimation and signal correction method for robust radial imaging using GRAPPA operator gridding. Magn Reson Med. 2016;75:883–896. doi: 10.1002/mrm.25648. [DOI] [PMC free article] [PubMed] [Google Scholar]
- 47.Ianni JD, Grissom WA. Trajectory auto-corrected image reconstruction. Magn Reson Med. 2016;76:757–768. doi: 10.1002/mrm.25916. [DOI] [PMC free article] [PubMed] [Google Scholar]
- 48.Svedin B, Parker D. Multi-echo Pseudo-Golden Angle Stack of Stars Thermometry with High Spatial and Temporal Resolution; In Proceedings of the 24th Annual Meeting of ISMRM; Singapore. 2016. Abstract number 816. [Google Scholar]
- 49.Svedin B, Payne A, Parker D. In vivo evaluation of a multi-echo pseudo-golden angle stack of stars thermometry method; In Proceedings of the 25th Annual Meeting of ISMRM; Honolulu, HI, USA. 2017. Abstract number 5423. [Google Scholar]
Associated Data
This section collects any data citations, data availability statements, or supplementary materials included in this article.
Supplementary Materials
Supporting Video S1: 2DFT and 3D SoS EPI time series temperature maps acquired during focused ultrasound heating of a gel phantom. The top row shows maps from a single 3D SoS EPI slice matching a 2DFT slice taken parallel to the ultrasound beam. A maximal intensity projection volume rendering of the 3D SoS EPI acquisition volume is displayed with temperature overlaid in the bottom row, and is rotated over a range of viewing angles.


