Abstract
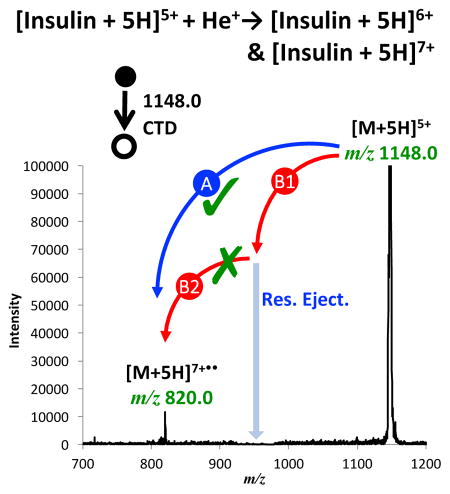
Top-down analysis of protonated insulin cations of charge states of 4+, 5+ or 6+ was performed by exposing the isolated precursor ions to a beam of helium cations with kinetic energy of more than 6 keV, in a technique termed charge transfer dissociation (CTD). The ~100 ms charge transfer reaction resulted in approximately 20% conversion efficiency to other intact charge exchange products (CTnoD), and a range of low abundance fragment ions. To increase backbone and sulfide cleavages, and to provide better structural information than straightforward MS2 CTD, the CTnoD oxidized products were isolated and subjected to collisional activation at the MS3 level. The MS3 CTD/CID reaction effectively broke the disulfide linkages, separated the two chains, and yielded more structurally informative fragment ions within the inter-chain cyclic region. CTD also provided doubly-oxidized intact product ions at the MS2 level, and resonance ejection of the singly-oxidized product ion revealed that the doubly-oxidized product originates directly from the isolated precursor ion and not from consecutive CTD reactions of a singly-oxidized intermediate. MS4 experiments were employed to help identify potential radical cations and diradical cations, but the results were negative or inconclusive. Nonetheless, the two-electron oxidation process is a demonstration of the very large potential energy (>20 eV) available through CTD, and is a notable capability for a 3D ion trap platform.
Graphical Abstract
Introduction
B-cells in Langerhans of the pancreas produces insulin, which not only maintains the blood glucose levels from getting too high or too low, but also regulates the amino acid uptake and inhibits the breakdown of glycogen, protein and fat [1]. Analogous to many polypeptide species, insulin contains multiple disulfide linkages for stabilizing its three-dimensional structure, and these disulfide bonds ensure the correct biological function. The multiple disulfide linkages form intra-chain and inter-chain cyclic structures, the presence of which inhibits the structural analysis of insulin via tandem mass spectrometry approaches. To retrieve the primary sequence information within the inter-chain cyclic regions, certain techniques have been employed to disrupt disulfide linkages.
Mass spectrometry (MS) shows high selectivity and sensitivity, and the capability of performing a variety of experiments, which makes it an appealing technique for analyzing biological molecules [2]. Due to the advent of soft ionization methods such as electrospray ionization (ESI) [3] or matrix-assisted laser desorption ionization (MALDI) [4], biomolecules can be formed intact for the purposes of molecular weight determination. The development of tandem mass spectrometry (MS/MS or MS2) has greatly advanced the application of MS to the structural characterization of biomolecules [5].
Disulfide linkage-containing polypeptides have been extensively examined during the past few decades using various MS/MS techniques, including collision-induced dissociation (CID) [6–9], post-source decay (PSD) [4], electron capture dissociation (ECD) [10–12], electron transfer dissociation (ETD) [9, 13–17], electron induced dissociation (EID) [18], electron detachment dissociation (EDD) [19], infrared multiphoton dissociation (IRMPD) [19] and ultraviolet photodissociation (UVPD) [20–24]. As the most widely used ion activation technique [25], CID makes use of ion/molecule collisions to convert kinetic energy to internal energy for the purpose of fragmenting the target ion. For peptides, CID mainly gives rise to b and y fragment ions from backbone amide bond cleavages. Insulin, at various charge states of 1+, 2+, 3+, 4+ and 5+ has investigated with CID, and the fragmentation efficiency is strongly dependent on the precursor charge state [8]. One particular limitation of CID is that little or limited sequence information within the cyclic regions could be retrieved [8]. Electron-based ion activation methods, like ECD, has shown the capability to cleave disulfide bonds, but ECD exhibited a relatively low dissociation efficiency [26]. Julian and coworkers combined UV activation with ECD to fragment insulin, which broke all three-disulfide bonds of insulin and exhibited a more extensive backbone fragmentation than ECD alone [24]. In other work, Loo and coworkers employed sulfolane as the supercharging reagent in protein solution, and the resulting supercharged protein ions exhibited elevated ECD efficiency and S–S bond dissociation efficiency [27].
Charge transfer dissociation (CTD) using helium is an alternative MS/MS technique developed by the Jackson research group [28], and is very similar in energy and mechanism to metastable atom-activated dissociation (MAD) [29–35]. CTD employs helium cations with kiloelectronvolt kinetic energies to bombard the target peptide cations, which can produce a nearly complete set of a ions from 1+ substance P [28] and also promotes radical ion fragmentation of peptides and oligosaccharides [36, 37]. In the present work, we explore the possibility of integrating CTD into a top-down workflow for small proteins by fragmenting the 4+, 5+ and 6+ charge states of bovine insulin with CTD. Whereas the resulting fragmentation pattern is very similar to ETD fragmentation demonstrated by others, we demonstrate the occurrence of an unexpected one-step, two-electron oxidation pathway, which highlights the unprecedented high energy that is available through CTD. We also characterize the difference between radical fragmentation pathways and even electron pathways for hydrogen deficient and hydrogen rich radical cations.
Experimental
Instrumentation
All experiments were performed on a modified Bruker (BrukerDaltonics, Bremen, Germany) equipped with a saddle field fast ion gun installed on the top of ring electrode [28, 38]. Briefly, a 2-mm hole was drilled in the ring electrode for the permission of helium cations into the trap. The Saddle field fast ion was used as the helium source. The ion source was installed onto a three-dimensional quadrupole ion trap (QIT) mass spectrometer. The instrument modification is described in detail elsewhere [36].
Reagents
Bovine insulin was purchased from Sigma-Aldrich (St. Louis, MO) and used without further purification. The insulin solution was prepared with a final concentration of approximately 20 μM in 49.5/49.5/1 (v/v/v) methanol/water/glacial acetic. Methanol (HPLC-grade) and glacial acetic acid were purchased from Fisher Scientific (Waltham, MA). Water was obtained from an in-house Milli-Q purification system with >18 MΩ salt content.
Methods
Mass spectrometry measurement
All mass spectra were collected in positive mode with an ESI voltage of 4.5 kV, capillary voltage of 8 V, capillary temperature of 250°C, and a heated ESI source temperature of 60°C. The helium trap pressure, as measured in the main vacuum chamber, was 1.2 ×10⁻⁵ mbar. Full mass spectra were collected at different operating m/z ranges depending on the precursor ion. Fragment ions were assigned if they are within ±0.8 mass unit of the corresponding theoretical value, and if they were accompanied by atleast one isotope peak to confirm the charge state via the expected isotope peak spacing.
Collision-induced dissociation measurements
The precursor ion of interest was isolated using a selection window of ±4 Da relative to the selected centroid m/z value. The ion current control (ICC) module was deactivated and the accumulation time (injection time) was typically 1.0 ms. The low mass cutoff (LMCO) was typically set to be approximately ~¼ of the precursor mass. E.g., for 5+ insulin (m/z 1148.0), the LMCO was set to be m/z 300. The CID amplitude was set to be ~0.30 V and “SmartFrag” mode was disabled. A typical CID experiment used 1.5-minutes of averaging spectra.
Charge transfer dissociation measurements
CTD experiments were conducted similarly to CID experiments, except that the QIT injection time was set to be 50 ms. A variable leak-valve was used to control the flow of the helium (1.20 × 10⁻⁵ mbar) through the ion gun. CTD was performed by the introduction of helium cations into the three-dimensional quadrupole ion trap. A waveform generator was synchronized with the period reserved for CID fragmentation. The waveform generator was triggered by a TTL signal from the mass spectrometer, the details of which are provided elsewhere [28]. A typical CTD experiment consists of a 2.5-minute period of product ion accumulation spectra and a 2.0 min-period of background accumulation spectra (i.e. helium beam on but ESI off). The time-averaged background spectrum was subtracted from the time-averaged product ion spectrum. In the MS3 CID experiments, CTD-generated product ions were isolated and subjected to a CID amplitude of 0.25 V at the MS3 level. The follow-up isolation/ion storage experiments (MS4 level) were carried out using a similar procedure. At the MS4 stage, the isolation window was 10 Da and the LMCO was 500.
Resonance Ejection
Resonance ejection experiments were conducted for the investigation of dissociation pathways. The precursor ions of interest were isolated and subjected to helium irradiation at the MS2 level. A particular product ion could then be resonantly ejected during the CTD reaction through the application of a relatively large CID amplitude (~2.5 V) at a frequency that corresponded to the desired intermediate. The experiment was repeated three times, and all the product ion spectra were averaged for final analysis. The experiment was repeated with the CID amplitude set to 0 V to ensure that the factor of scattering losses due to prolonged storage was independent of the factor of resonance ejection.
Results and discussion
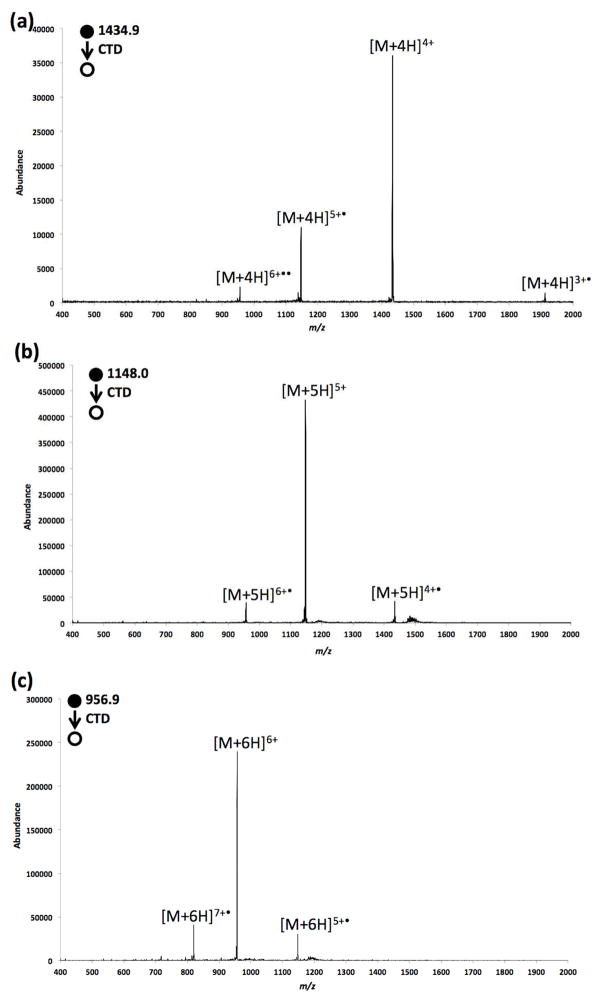
CTD spectra of [insulin+4H]4+, [insulin+5H]5+, and [insulin+6H]6+ are shown in Figure 1. In Figure 1a, when the 4+ insulin precursor ion was subjected to helium cation irradiation, two types of radical cations are generated; [insulin+4H]5+•, the charge-increased or oxidized product ion (CTnoD), with greater than 20% conversion efficiency; and [insulin+4H]3+•, the charge-decreased or reduced product ion (ETnoD) with less than 5% efficiency. The proposed pathway of [insulin+4H]5+• formation is shown in Equation (1):
| (1) |
Figure 1.
CTD spectra of isolated (a) [M+4H]4+, (b) [M+5H]5+ and (c) [M+6H]6+ ions derived from bovine insulin.
Similar charge-increased product ions were also observed in the CTD spectra of insulin 5+ and 6+ charge states. The formations of the two charge-increased species are proposed in Equation (2) and (3).
| (2) |
| (3) |
The presence of charge-reduced product ions indicates that a side channel of ETD-like behavior is occurring. We recently described an attempt to characterize the potential reagent anions [37], which showed that the reagent anions originate from background contamination, are radical anions and are highly unsaturated. The reagent negatives ions appear to comprise a homologous series, which maximizes in abundance around m/z 184–220. The CTD activation of large mass precursor like insulin permitted the LMCO to be raised to m/z 300 to prevent the co-accumulation of the background reagent anions, and thereby reduce the extent of ETD. The benefit of operating with an elevated LMCO is that the ETD pathway is minimized and the oxidized products of insulin are generally more abundant than the charge-reduced product ions, as shown in Figure 1a.
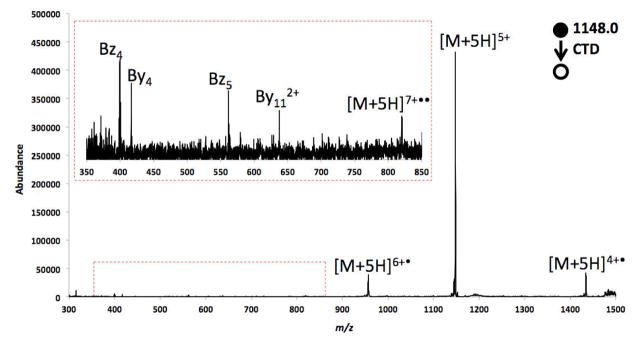
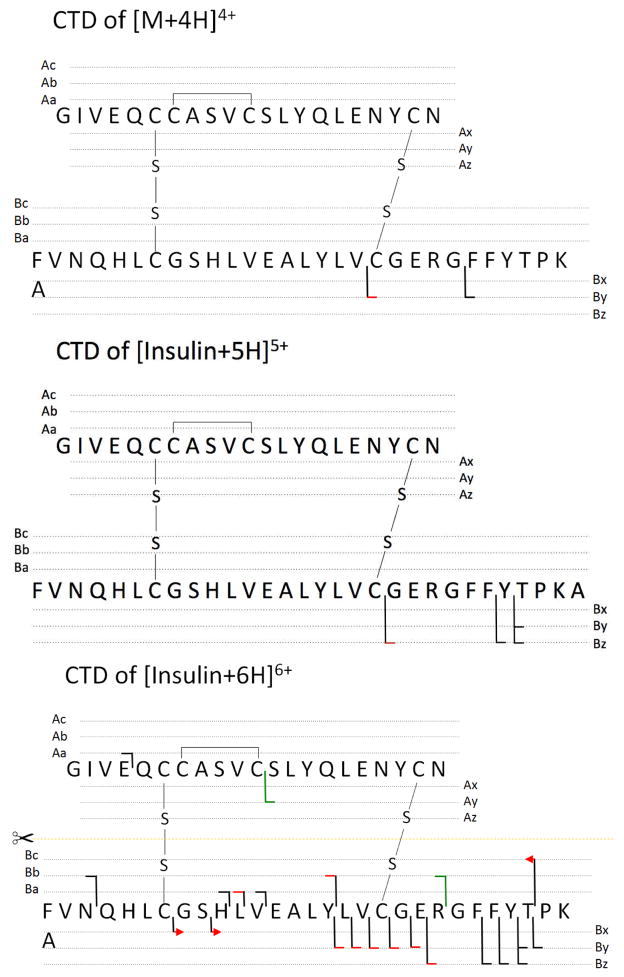
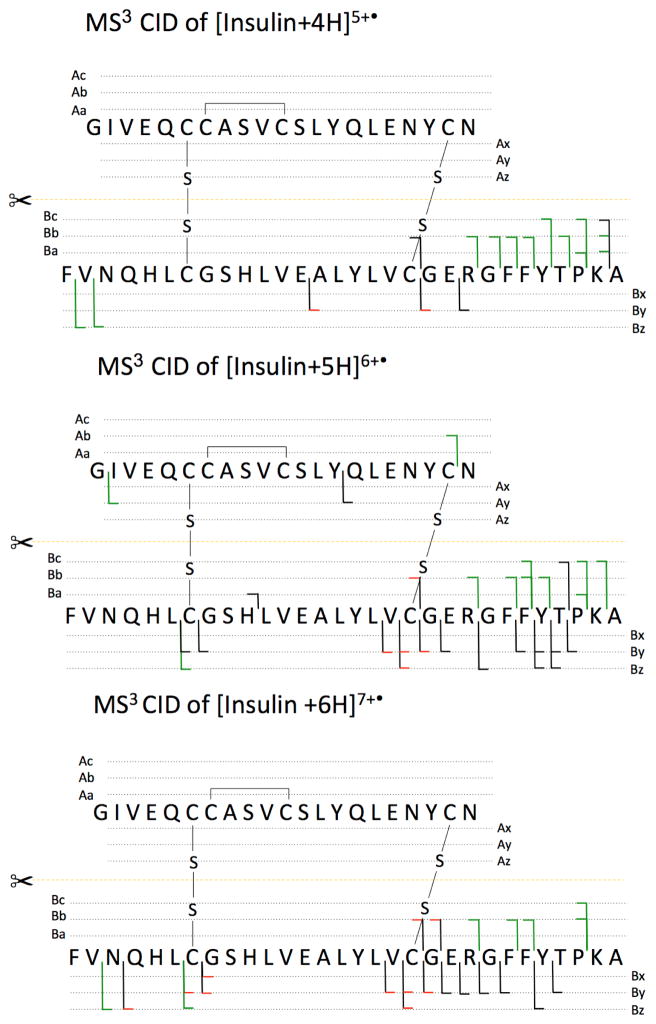
The close-ups of Figure 1a, Figure 1b and Figure 1c are shown in Figure S2, Figure 2 and Figure 3, respectively. The identified fragments are annotated on the protein structure in Scheme 1. As shown in Figure S2, only a few fragments were induced from CTD of 4+ insulin, and these included two low-intensity fragment ions (By6 and By112+) arising from the cleavage on the C-terminus of chain B. No evidence for separation of the two chains was observed in the CTD spectrum of 4+ insulin. One possible cause of the limited number of observed fragmentation products is the limited signal-to-noise (S/N) ratio of the precursor; the 4+ charge state is simply a low abundance charge state and it is difficult to obtain a large precursor ion signal (ESI spectrum of insulin is given in Figure S1).
Figure 2.
CTD spectrum of isolated 5+ insulin.
Figure 3.
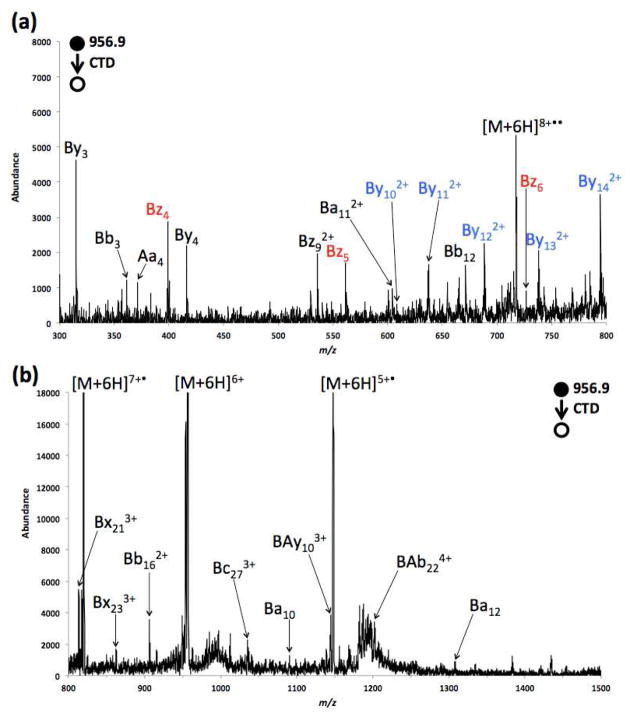
Zoomed in CTD spectra of 6+ insulin ranging from (a) m/z 300–800, and (b) m/z 800–1500.
Scheme 1.
Dissociation channels observed in CTD of insulin at charge states of 4+, 5+ and 6+. Key for peptide sequencing: black line, product ions observed in charge state 1+; red line, product ionsed observed in charge state 2+; red line with arrow, product ions observed in charge state 3+; fragment ion with another chain attached are marked with a green line. The same color-coding system was used throughout this study.
Explicit radicals are not labeled on fragment ions (i.e. z ions) because the 3D ion trap does not have the mass accuracy or resolving power to make confident assignments about the exact masses of the different fragment ions. Many fragments, such as z ions and a+1 ions, are most likely radical [2].
Compared with the results from 4+ and 5+ insulin, CTD of 6+ insulin produced many more fragment ions, as shown in Figure 3. In contrast to CID [7], ETD [14] and ECD [10], CTD of 6+ insulin produced a set of contiguous z ions; i.e. Bz4, Bz5 and Bz6 (in red font). Similar to the CTD results of 5+ insulin, these fragments arise from the cleavage of C-terminus of chain B and outside the inter-chain cyclic region. One fragmentation product of chain A was observed (Aa4), which originates from the cleavage of the N-terminus of chain A: again, outside the cyclic region.
A set of doubly charged contiguous y ions from chain B; i.e. By102+, By112+, By122+, By132+ and By142+ (blue font), was also observed from the 6+ precursor, which are rarely observed in other MS/MS experiments. Fragmentation in these region appears rather unique to CTD, since most techniques (CID [7, 8], ETD [14], ECD/AI ECD [24]) struggle to induce fragmentation in this region. The By102+ and By112+ fragments are be formed from the cleavage of C-terminus of chain B, outside the inter-chain cyclic region, but the formation of By122+, By132+ and By142+ requires breakage of both inter-chain disulfide linkages in addition to the backbone cleavage. Similarly, the ions Ba10, Ba112+ and Ba12 also require the cleavage of both disulfide linkages. Additionally, this set of internal-fragment ions are also distinguishes CTD from the other techniques, despite the otherwise remarkable similarity between CTD and ETD [14] for exocyclic cleavages. All the above observations indicate that CTD can directly cleave backbone and disulfide linkages in a single activation step, and is thereby capable of providing some primary sequence information within the cyclic regions.
The above CTD results have also shown a dependence of CTD behavior on the charge state of the precursor ions. The dependence of CTD behavior upon low precursor charge states (1+, 2+ and 3+) of smaller peptides has been studied in our previous work [37]. In this study, as the precursor charge state increases from 4+ to 6+, an increase in the number of fragment ions was observed. This means more bonds and a greater variety of bonds were cleaved at higher precursor charge states, which is consistent with previous studies using ETD [14]. However, unlike ETD, CTD is not expected to become more efficient or more exothermic as the charge state of the precursor increases. In fact, one would expect the efficiency and efficacy of cation-cation reactions in CTD to decrease as the charge sate of the precursor ion increases. It therefore seems possible that the improvement in product ions observed through CTD of the 6+ precursor could in fact be due to unwanted ETD side reactions. Another possibility is that the increase in charge state of the 6+ precursor enhances the extent of protein unfolding, thus making the protein more susceptible to fragmentation when interacting with helium cations.
The backbone cleavages preferentially occur near the C-terminus of chain B—which is consistent with the ECD and ETD work of others [8, 10, 14, 24]—and in regions close to aromatic residues, like tyrosine, which also has been noted by others [26]. Compared to ETD, CTD does not produce as many fragment ions near the N-terminus of chain B for 6+ insulin precursor. ETD excels in retrieving primary sequence information outside the cyclic regions, but only occasionally provides backbone information within the cyclic regions [14, 26]. In CID experiments of 5+ insulin [6, 8], all the cleavages occur in regions external to the disulfide bonds and no structurally informative fragments were obtained from within the cyclic regions. To increase the sequence coverage and probe the fragmentation mechanism, we therefore used supplemental collisional activation to fragment the primary product ions that underwent oxidation without dissociation; i.e. the CTnoD product ions.
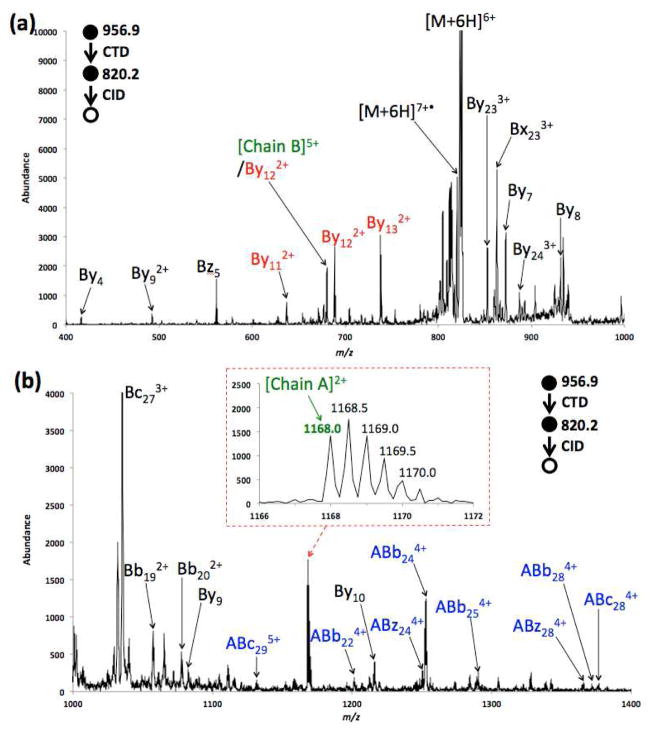
Figure 4 shows the MS3 CID spectrum of the CTnoD product ion [Insulin+6H]7+• derived from CTD of [Insulin+6H]6+. The observed fragments are also shown in Scheme 2. The MS3 CID spectrum is dominated by a wide range of y ions derived from the cleavage of chain B and the separation of chain A. In the low mass range (m/z 400–1000), one set of doubly charged contiguous y ions were observed, namely By112+, By122+ and By132+ (in red font). In the high mass range (m/z 1000–1400), fragment ions originating from the cleavages of chain B with the entire chain A attached (i.e. ABb224+, ABb244+, ABc284+ and ABz244+ in blue font) were observed.
Figure 4.
MS3 CID spectrum of [Insulin+6H]7+• ranging from (a) m/z 400–1000, and (b) m/z 1000–1400.
Scheme 2.
Dissociation channels observed in (a) MS3 CID of [Insulin+4H]5+• derived from CTD [Insulin +4H]4+, (b) MS3 CID of [Insulin+5H]6+• derived from CTD [Insulin+5H]5+ and (c) MS3 CID of [Insulin +6H]7+• derived from CTD [Insulin+6H]6+.
Figure 4a shows a fragment ion at m/z 680.2, corresponding in mass to the 5+ Chain B product ion ([chain B])5+, The complementary 2+ Chain A product ion shows up at m/z 1168.0 ([Chain A]2+, inset in Figure 4b, green font). The [Chain A]2+ fragment is rarely observed in regular CID experiments [8], but it is more often observed in radical activation methods [24]. As shown in the fragment map for MS3 CTD/CID (the bottom panel in Scheme 2), the formation of [Chain A]2+ requires the cleavage of both disulfide bonds. One mechanism for the cleavage of two disulfide bonds is proposed in Scheme 3. It is also reasonable to assume that the disulfide bond(s) cleaves after the amino acid backbone cleavage through previously described hydrogen or radical transfers [10, 24]. Cleavage of two inter-chain disulfide bonds was also observed in MS3 CTD/CID experiments of [Insulin+4H]5+• and [Insulin+5H]6+•, as shown in Scheme 3.
Scheme 3.
Proposed mechanism for the cleavage of S-S bonds.
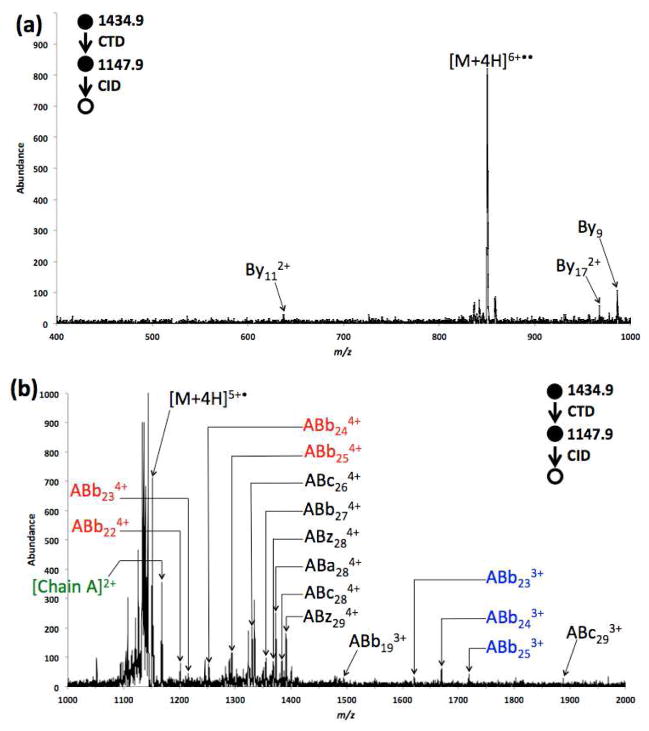
The CID spectrum of the CTnoD product [Insulin+4H]5+• derived from CTD of [Insulin+4H]4+ is shown in Figure 5. In the low mass range (m/z 400–1000), only three low-abundance fragments were generated. In the high mass range (m/z 1000–1400), more fragment ions with higher abundances were produced. Most of the fragments were in the 4+ charge state, originating from the cleavage of the B-chain, outside the cyclic regions, with the A-chain still attached. A few 5+ fragment ions were observed (Figure S4, supporting information), including (ABb29-NH3)5+ and (ABa29-NH3)5+, and a dominant ammonia loss from an intact insulin ion, (Insulin-NH3)5+, which is rarely observed in common MS/MS experiments. Two contiguous ion sets (ABb224+, ABb234+, ABb244+ and ABb254+ (in red font)) and (ABb233+, ABb243+ and ABb253+ (in blue font)) were also observed.
Figure 5.
MS3 CID spectrum of [Insulin+4H]5+• ranging from (a) m/z 400–1000 and (b) m/z 1000–2000.
To examine the congested area in Figure 5, a narrow region of the spectrum (m/z 1110–1180) is expanded in Figure S4. Analogous to MS3 CTD/CID experiment of [Insulin+6H]7+•, a complementary chain adduct ion pair—[Chain A]2+ and [Chain B]3+—was also observed for [Insulin+4H]5+•. It is noteworthy that intact Chain A is always formed in the 2+ charge state, regardless of the precursor charge sate undergoing CTD. Moreover, the sum of the charge states of the two individual chain adduct ions equals that of the precursor insulin adduct ion. The distribution of product ion charge states agrees closely with the results from CID reaction of gold-cationized insulin [7]. In the gold-adducted insulin studies, McLuckey and coworkers also observed complementary chain adduct pairs ((B-chain)4+/(A-chain)1+ and (B-chain)3+/(A-chain)2+) in their MS3 ETD/CID experiment of [insulin+5H]5+/[insulin+6H]5+• [14]. They reasoned that the radical nature of [M+6H]5+• could account for the insulin chain separation in this MS3 experiments [14]. The analogous charge-state split of precursor ions—asymmetric pattern—has also been widely reported in low-energy CID experiments of other protein complex ions [39, 40].
To determine whether the individual chain adduct ions ([Chain A]2+ and [Chain B]3+) are radical species or even-electron species, each of them was isolated at MS4-level and stored in the ion trap for 200 ms to react with background oxygen (Figure S5 and S6, supporting information). It has reported that when the radical species are stored in the electrodynamic ion trap at room temperature, they often react with residual oxygen. The addition of O or O2 to distonic radical cations has been observed in ETD [41], fs-LID [42], He-MAD [43], and He-CTD [37]. However, oxygen-attachment was not observed for either [Chain A]2+ or [Chain B]3+, indicating that the two types of individual chain adduct ions are more likely to be even-electron species, or that the radical resides on the sulfur atoms and does not undergo the typical oxygen addition. The theoretical mass to charge ratio of monoisotopic [Chain A + 2H]2+ is 1169.995. This theoretical mass contrasts with the lightest of the measured isotope cluster of the A2+ ions, which appears at m/z 1168.0 in Figure 4b. The A2+ ion must therefore be hydrogen deficient by two hydrogens (2H• or H2). The 2 Da loss mechanism from chain A is not known at this time.
The fragmentation behavior of the individual chain adduct ions have been well-documented in literature. For example, Zubarev and coworkers observed doubly charged peptide monomers due to the cleavage of an S-S bond in UVPD experiments [20]. In similar work, Wongkongkathepa et al [24] showed that ESI-generated 6+ insulin could be mass-selected and irradiated by 266 nm UV laser to provide the individual Chain A/B fragments. McLafferty and coworkers have reported singly charged peptide monomers corresponding to the breakage of an S-S bond in ECD experiments [10].
Different from ETD/ECD, which are dominated by charge-reduction and hydrogen rich radical cations, CTD is dominated by charge increased and hydrogen deficient radical cations, with a smaller contribution of charge-decreased products [37]. Given the previous discussions on the charge-increased product [Insulin+4H]5+•, MS3 CID spectrum of the charge-decreased product [Insulin+6H]5+• derived from CTD of [Insulin+6H]6+ was collected as well (Figure S7). Analogous to MS3 CID experiment for charge-increased species ([Insulin+4H]5+•), complementary chain adduct ion pair—[Chain A]2+ and [Chain B]3+—was also observed from CID of the charge-reduced species ([Insulin+6H]5+•). This observation is consistent with the work of McLuckey and coworkers’ publication [14], which involved ETD as the source for generating of [Insulin+6H]5+•. The consistency indicates a robust similarity between the radical intermediates that seems independent of a hydrogen transfer mechanism.
The CTD-generated [Insulin+5H]6+• was also isolated and subjected to collisional activation. The resulting MS3 CID spectrum (Figure S3) provided greater fragmentation efficiency and better signal-to-noise (S/N) ratio than [Insulin+4H]5+•. CID of [Insulin+5H]6+• produced more y ions outside the cyclic regions on the C-terminus of chain B. Consistent with the above CID results of the CTnoD products, CID of [Insulin+5H]6+• also produced individual chain adduct ion pair: [Chain A]2+ and [Chain B]4+.
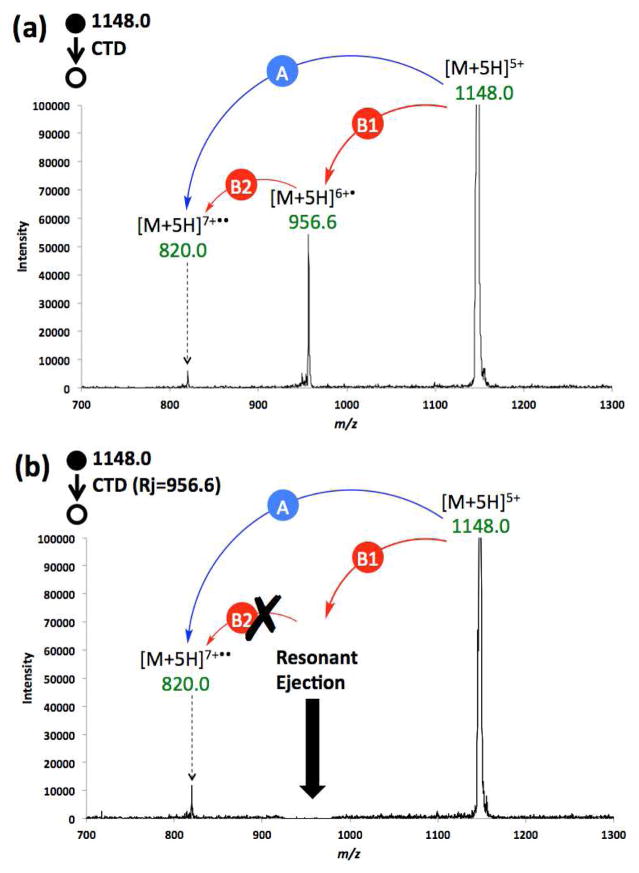
Figure 6 shows an expanded region of the same spectrum in Figure 1b for CTD of the precursor [M+5H]5, but with concurrent resonant ejection on the primary product (Figure 6a), and possible intermediate, [M+5H]6+• (Figure 6b). This resonance ejection experiment was conducted to investigate the mechanism of formation of the doubly ionized species [M+5H]7+••, which can form via two possible pathways: (1) directly from the precursor ion (Pathway A) via a one step, two electron oxidation mechanism; or (2) through two consecutive reactions (Pathway B) involving the generation of an intermediate ([M+5H]6+•), from which the product ion [M+5H]7+•• is formed from a second helium cation.
Figure 6.
(a) CTD spectrum of 5+ insulin, (b) CTD spectrum of 5+ insulin, with resonance ejection on the possible intermediate [M+5H]6+•.
| (4) |
| (5) |
Figure 6a shows a regular CTD spectrum of the [M+5H]5+, in which both [M+5H] 6+• and [M+5H]7+•• were present. In Figure 6b, the first-generation product ion, and possible intermediate, [M+5H]6+• was resonantly ejected during CTD. Figure 6b clearly shows that even in the presence of simultaneous ejection of [M+5H]6+•, the product ion [M+5H]7+•• is still readily observable. Quantitation of the peak heights using three sets of alternating spectra of CTD with and without resonance ejection (supplemental Figure S6) showed no significant decrease in the product ion abundance. These results clearly demonstrate that the formation of [M+5H]7+•• is not affected by the immediate removal of [M+5H]6+• and that [M+5H]7+•• is therefore a direct product of the two-electron oxidation pathway provided pathway A (eqn. 4).
To confirm the result, a similar experiment was repeated using the [M+6H]6+ precursor and resonantly ejecting the [M+6H]7+• product ion (Figure S8, supplemental material). The relevant reactions in this case:
| (6) |
| (7) |
Consistent with the previous result, when [M+6H]7+• was resonantly ejected during CTD of [M+6H]6+, the intensity of two-electron oxidation product [M+6H]8+•• was also unaffected by the removal of the potential intermediate (Figure S8). These resonance ejection experiments verify that the doubly ionized ion is formed directly from the protonated precursor ion via a one-step two-electron process. The changes in the peak intensities in Figure 6 and Figure S8 are statistically verified in the supporting information (Table S1, Table S2 and Figure S9).
The ability to perform a one-step removal of two electrons (double ionization) has been reported once before by Zubarev and coworkers in their electron ionization dissociation (EID) experiments [44] in an FT-ICR. Zubarev et al were able to produce doubly ionized species, [M+nH](n+2)+, by bombarding peptide cations ([M+nH]n+, n≥1) with ≥ 40 eV electrons. However, these species from 1+ and 2+ precursors were harder to discern in the FT-ICR than ≥ 3+ precursors because of their overlap with the third and second parasitic harmonics of the precursors. To our knowledge, such high-energy activation (≥ 20 eV) barriers have only been reported in the high-energy EID experiments on a FT-ICR platform, which makes it all the more unusual to replicate the capability on a low-cost QIT mass spectrometer.
To further probe the behavior of the doubly ionized species, two follow-up experiments were conducted. Firstly, [insulin+5H]7+•• (or [insulin+6H]8+••) generated from CTD of [insulin+5H]5+ (or [insulin+6H]6+) was isolated at the MS3 level and confined in the ion trap for an extra 200 ms to see if it would react with residual oxygen in a manner that distonic radical cations are prone to do. The isolation spectra are shown in Figure S10a and S11a, respectively, and show the successful mass-selection at MS3 level. However, with the addition of a 200 ms reaction of [insulin+5H]7+•• or [insulin+6H]8+•• with residual oxygen, neither charge state resulted in any oxygen attachment. However, the absence of oxygen attachment does not exclude the possibility of diradical [insulin+5H]7+•• and [insulin+6H]8+•• because there is a possibility that their structure/configuration somehow prevents them from reacting with residual oxygen in the ion trap.
Secondly, [insulin+5H]7+•• was mass-selected in the same way as shown in Figure S10a. Instead of ion storage, [insulin+5H]7+•• was fragmented with a CID amplitude of 0.3 V at MS3 level (Figure S12). Seven fragment ions were observed, most of which originate from the cleavage of B-chain. Only one fragment ion originates from the cleavage of A-chain. For comparison purposes, the CID spectrum of ESI-generated [insulin+7H]7+ was collected as well (Figure S13). Thirteen B-chain fragment ions were observed, among which a contiguous ion set (By3, By4, By5) was generated. Similar to the MS3 CTD/CID spectrum, only one A-chain fragment ion was observed. The fragment map comparison of the above experiments is shown in Scheme S1. Unfortunately, the signal to noise ratio for MS3 CID of the doubly ionized species ([insulin+5H]7+••) was too poor to determine whether or not the fragmentation pattern is significantly different than that of [insulin+6H]7+•. Although the ability to perform a one-step two-electron oxidation reaction in the gas phase does not appear to be beneficial for the analysis of insulin or disulfide-linked peptides, there will no doubt be other applications that could benefit from such a capability.
Conclusions
ESI-generated insulin cations (at charge states of 4+, 5+ and 6+) were subjected to helium-cation irradiation, producing both charge-increased species and charge-decreased species. These species are accompanied by a few fragment ions, the number and relative abundances of which are highly dependent on the precursor charge state. 6+ insulin produced the maximum number of fragment ions, most of which originates from the cleavages of B-chain outside the cyclic regions defined by the disulfide linkages. The charge-increased product ions from CTD process were further mass-selected and subjected to CID reaction at MS3 level. This approach effectively broke disulfide linkages, showing the capability of producing more fragment ions than a single CTD experiment. Resonance ejection experiments were conducted during CTD experiments to prevent consecutive CTD reactions. Instead of the commonly observed one-electron oxidation pathways, an interesting one-step two-electron oxidation pathway for the formation of [M+nH](n+2)+•• was revealed, which has an activation barrier of at least 20 eV. The di-radical nature of the doubly oxidized product could not be confirmed through reaction with residual oxygen or by CID. The above results, along with the low-cost instrument platform, indicate that CTD is an intriguing high-energy fragmentation method for the structural interrogation of gas-phase biomolecules.
Supplementary Material
Figure S1. CTD spectrum of insulin 4+ ranging from (a) m/z 400–1000, and (b) m/z 1000–2000.
Figure S2. ESI spectrum of insulin.
Figure S3. MS3 CID (amplitude = 0.25) spectrum of [Insulin+5H]6+• ranging from (a) m/z 300–1000 and (b) m/z 1000–1500.
Figure S4. MS3 CID of [insulin+4H]5+• derived from CTD of [insulin+4H]4+.
Figure S5. (a) Isolation spectrum of [Chain A]2+ at MS4 level, following MS3 CID of [M+4H]5+• derived from MS2 CTD of [M+4H]4+. (b) The same condition as (a) except an extra ion storage time of 200 ms. No adducts of O or O2 are observed.
Figure S6. (a) Isolation spectrum of [Chain B]2+ at MS4 level, following MS3 CID of [M+4H]5+• derived from MS2 CTD of [M+4H]4+. (b) The same condition as (a) except an extra ion storage time of 200 ms. No adducts of O or O2 are observed.
Figure S7. MS3 CID spectrum of [insulin+6H]5+• from (a) m/z 400 – 1000. (b) m/z 1000 – 2000 (CID amplitude = 0.3 V).
Figure S8. (a) CTD spectrum of insulin 6+, (b) the same experiment with simultaneous resonance ejection on[M+6H]7+• during CTD. The statistical calculations are given in supporting information Table S1.
Figure S9. The averaged intensity of [insulin+5H]7+•• with error bar. The blue dot: regular CTD experiment; orange dot: CTD experiment with resonant ejection of possible intermediate [insulin+5H]6+•.
Figure S10. (a) Isolation spectrum of [insulin+5H]7+•• at MS3 level. (b) 200 ms ion storage of [insulin+5H]7+•• following isolation at MS3 level. No adducts of O or O2 are observed.
Figure S11. (a) Isolation spectrum of [insulin+6H]8+•• at MS3 level. (b) 200 ms ion storage of [insulin+6H]8+•• following isolation at MS3 level. No adducts of O or O2 are observed.
Figure S12. MS3 CID spectrum of [insulin+5H]7+•• derived from CTD of [insulin+5H]5+ (CID amplitude = 0.30 V).
Figure S13. Zoomed-in CID spectrum of [insulin+7H]7+ from (a) m/z 300 – 1000. (b) m/z 1000 – 1400 (CID amplitude = 0.3 V).
Scheme S1. Fragment map of (a) MS3 CID of [insulin+5H]7+••, (b) CID of [insulin+7H]7+.
Table S1. Intensities and relevant calculations of fragment ions at m/z 820.0, m/z 956.6 and m/z 1148.0, during CTD of [insulin+5H]5+.
Table S2. Intensities and relevant calculations of fragment ions at 820.0, m/z 956.6 and m/z 1148.0, during CTD of [insulin+5H]5+ with resonance ejection on m/z 856.6 [Insulin +5H]6+•.
Acknowledgments
The authors acknowledge financial support form the National Institutes of Health (NIH) (1R01GM114494-01). The opinions, findings, and conclusions or recommendations expressed in this publication are those of the author(s) and do not necessarily reflect the views of NIH.
References
- 1.Zhu SY, Russ HA, Wang XJ, Zhang ML, Ma TH, Xu T, Tang SB, Hebrok M, Ding S. Human pancreatic beta-like cells converted from fibroblasts. Nature Comm. 2016;7 doi: 10.1038/ncomms10080. [DOI] [PMC free article] [PubMed] [Google Scholar]
- 2.Zhurov KO, Fornelli L, Wodrich MD, Laskay UA, Tsybin YO. Principles of electron capture and transfer dissociation mass spectrometry applied to peptide and protein structure analysis. Chemical Society Reviews. 2013;42:5014–5030. doi: 10.1039/c3cs35477f. [DOI] [PubMed] [Google Scholar]
- 3.Pulfer M, Murphy RC. Electrospray mass spectrometry of phospholipids. Mass Spectrom Rev. 2003;22:332–364. doi: 10.1002/mas.10061. [DOI] [PubMed] [Google Scholar]
- 4.Jones MD, Patterson SD, Lu HS. Determination of disulfide bonds in highly bridged disulfide-linked peptides by matrix-assisted laser desorption/ionization mass spectrometry with postsource decay. Anal Chem. 1998;70:136–143. doi: 10.1021/ac9707693. [DOI] [PubMed] [Google Scholar]
- 5.Kalcic CL, Reid GE, Lozovoy VV, Dantus M. Mechanism elucidation for nonstochastic femtosecond laser-induced ionization/dissociation: From amino acids to peptides. J Phys Chem A. 2012;116:2764–2774. doi: 10.1021/jp208421d. [DOI] [PubMed] [Google Scholar]
- 6.Stephenson JL, Cargile BJ, McLuckey SA. Ion trap collisional activation of disulfide linkage intact and reduced multiply protonated polypeptides. Rapid Commun Mass Spectrom. 1999;13:2040–2048. doi: 10.1002/(SICI)1097-0231(19991030)13:20<2040::AID-RCM754>3.0.CO;2-W. [DOI] [PubMed] [Google Scholar]
- 7.Mentinova M, McLuckey SA. Cleavage of multiple disulfide bonds in insulin via gold cationization and collision-induced dissociation. Int J Mass Spectrom. 2011;308:133–136. doi: 10.1016/j.ijms.2011.08.013. [DOI] [PMC free article] [PubMed] [Google Scholar]
- 8.Wells JM, Stephenson JL, McLuckey SA. Charge dependence of protonated insulin decompositions. Int J Mass Spectrom. 2000;203:A1–A9. [Google Scholar]
- 9.Chrisman PA, McLuckey SA. Dissociations of disulfide-linked gaseous polypeptide/protein anions: Ion chemistry with implications for protein identification and characterization. J Proteome Res. 2002;1:549–557. doi: 10.1021/pr025561z. [DOI] [PubMed] [Google Scholar]
- 10.Zubarev RA, Kruger NA, Fridriksson EK, Lewis MA, Horn DM, Carpenter BK, McLafferty FW. Electron capture dissociation of gaseous multiply-charged proteins is favored at disulfide bonds and other sites of high hydrogen atom affinity. J Am Chem Soc. 1999;121:2857–2862. [Google Scholar]
- 11.Kocher T, Engstrom A, Zubarev RA. Fragmentation of peptides in maldi in-source decay mediated by hydrogen radicals. Anal Chem. 2005;77:172–177. doi: 10.1021/ac0489115. [DOI] [PubMed] [Google Scholar]
- 12.Li HL, O’Connor PB. Electron capture dissociation of disulfide, sulfur-selenium, and diselenide bound peptides. J Am Soc Mass Spectrom. 2012;23:2001–2010. doi: 10.1007/s13361-012-0473-0. [DOI] [PubMed] [Google Scholar]
- 13.Gunawardena HP, Gorenstein L, Erickson DE, Xia Y, McLuckey SA. Electron transfer dissociation of multiply protonated and fixed charge disulfide linked polypeptides. Int J Mass Spectrom. 2007;265:130–138. [Google Scholar]
- 14.Liu J, Gunawardena HP, Huang TY, McLuckey SA. Charge-dependent dissociation of insulin cations via ion/ion electron transfer. Int J Mass Spectrom. 2008;276:160–170. [Google Scholar]
- 15.Chrisman PA, Pitteri SJ, Hogan JM, McLuckey SA. So2- electron transfer ion/ion reactions with disulfide linked polypeptide ions. J Am Soc Mass Spectrom. 2005;16:1020–1030. doi: 10.1016/j.jasms.2005.02.010. [DOI] [PMC free article] [PubMed] [Google Scholar]
- 16.Cole SR, Ma XX, Zhang XR, Xia Y. Electron transfer dissociation (etd) of peptides containing intrachain disulfide bonds. J Am Soc Mass Spectrom. 2012;23:310–320. doi: 10.1007/s13361-011-0300-z. [DOI] [PubMed] [Google Scholar]
- 17.Mentinova M, Han HL, McLuckey SA. Dissociation of disulfide-intact somatostatin ions: The roles of ion type and dissociation method. Rapid Commun Mass Spectrom. 2009;23:2647–2655. doi: 10.1002/rcm.4172. [DOI] [PMC free article] [PubMed] [Google Scholar]
- 18.Lioe H, O’Hair RAJ. Comparison of collision-induced dissociation and electron-induced dissociation of singly protonated aromatic amino acids, cystine and related simple peptides using a hybrid linear ion trap-FT-ICR mass spectrometer. Anal Bioanal Chem. 2007;389:1429–1437. doi: 10.1007/s00216-007-1535-1. [DOI] [PubMed] [Google Scholar]
- 19.Kalli A, Hakansson K. Preferential cleavage of s-s and c-s bonds in electron detachment dissociation and infrared multiphoton dissociation of disulfide-linked peptide anions. Int J Mass Spectrom. 2007;263:71–81. [Google Scholar]
- 20.Fung YME, Kjeldsen F, Silivra OA, Chan TWD, Zubarev RA. Facile disulfide bond cleavage in gaseous peptide and protein cations by ultraviolet photodissociation at 157 nm. Angew Chem. 2005;44:6399–6403. doi: 10.1002/anie.200501533. [DOI] [PubMed] [Google Scholar]
- 21.Agarwal A, Diedrich JK, Julian RR. Direct elucidation of disulfide bond partners using ultraviolet photodissociation mass spectrometry. Anal Chem. 2011;83:6455–6458. doi: 10.1021/ac201650v. [DOI] [PubMed] [Google Scholar]
- 22.Stinson CA, Xia Y. Radical induced disulfide bond cleavage within peptides via ultraviolet irradiation of an electrospray plume. Analyst. 2013;138:2840–2846. doi: 10.1039/c3an00303e. [DOI] [PubMed] [Google Scholar]
- 23.Soorkia S, Dehon C, Kumar SS, Pedrazzani M, Frantzen E, Lucas B, Barat M, Fayeton JA, Jouvet C. UV photofragmentation dynamics of protonated cystine: Disulfide bond rupture. J Phys Chem Lett. 2014;5:1110–1116. doi: 10.1021/jz500158j. [DOI] [PubMed] [Google Scholar]
- 24.Wongkongkathep P, Li HL, Zhang X, Loo RRO, Julian RR, Loo JA. Enhancing protein disulfide bond cleavage by UV excitation and electron capture dissociation for top-down mass spectrometry. Int J Mass Spectrom. 2015;390:137–145. doi: 10.1016/j.ijms.2015.07.008. [DOI] [PMC free article] [PubMed] [Google Scholar]
- 25.Wells JM, McLuckey SA. Collision-induced dissociation (CID) of peptides and proteins. Method Enzymol. 2005;402:148–185. doi: 10.1016/S0076-6879(05)02005-7. [DOI] [PubMed] [Google Scholar]
- 26.Ganisl B, Breuker K. Does electron capture dissociation cleave protein disulfide bonds? Chemistryopen. 2012;1:260–268. doi: 10.1002/open.201200038. [DOI] [PMC free article] [PubMed] [Google Scholar]
- 27.Zhang J, Loo RRO, Loo JA. Increasing fragmentation of disulfide-bonded proteins for top-down mass spectrometry by supercharging. Int J Mass Spectrom. 2015;377:546–556. doi: 10.1016/j.ijms.2014.07.047. [DOI] [PMC free article] [PubMed] [Google Scholar]
- 28.Hoffmann WD, Jackson GP. Charge transfer dissociation (CTD) mass spectrometry of peptide cations using kiloelectronvolt helium cations. J Am Soc Mass Spectrom. 2014;25:1939–1943. doi: 10.1007/s13361-014-0989-6. [DOI] [PubMed] [Google Scholar]
- 29.Misharin AS, Silivra OA, Kjeldsen F, Zubarev RA. Dissociation of peptide ions by fast atom bombardment in a quadrupole ion trap. Rapid Commun Mass Spectrom. 2005;19:2163–2171. doi: 10.1002/rcm.2038. [DOI] [PubMed] [Google Scholar]
- 30.Cook SL, Collin OL, Jackson GP. Metastable atom-activated dissociation mass spectrometry: Leucine/isoleucine differentiation and ring cleavage of proline residues. J Mass Spectrom. 2009;44:1211–1223. doi: 10.1002/jms.1598. [DOI] [PubMed] [Google Scholar]
- 31.Berkout VD. Fragmentation of singly protonated peptides via interaction with metastable rare gas atoms. Anal Chem. 2009;81:725–731. doi: 10.1021/ac802214e. [DOI] [PubMed] [Google Scholar]
- 32.Berkout VD, Doroshenko VM. Fragmentation of phosphorylated and singly charged peptide ions via interaction with metastable atoms. Int J Mass Spectrom. 2008;278:150–157. doi: 10.1016/j.ijms.2008.04.019. [DOI] [PMC free article] [PubMed] [Google Scholar]
- 33.Berkout VD. Fragmentation of protonated peptide ions via interaction with metastable atoms. Anal Chem. 2006;78:3055–3061. doi: 10.1021/ac060069a. [DOI] [PubMed] [Google Scholar]
- 34.Cook SL, Jackson GP. Characterization of tyrosine nitration and cysteine nitrosylation modifications by metastable atom-activation dissociation mass spectrometry. J Am Soc Mass Spectrom. 2011;22:221–232. doi: 10.1007/s13361-010-0041-4. [DOI] [PubMed] [Google Scholar]
- 35.Cook SL, Jackson GP. Metastable atom-activated dissociation mass spectrometry of phosphorylated and sulfonated peptides in negative ion mode. J Am Soc Mass Spectrom. 2011;22:1088–1099. doi: 10.1007/s13361-011-0123-y. [DOI] [PubMed] [Google Scholar]
- 36.Ropartz D, Li PF, Fanuel M, Giuliani A, Rogniaux H, Jackson GP. Charge transfer dissociation of complex oligosaccharides: Comparison with collision-induced dissociation and extreme ultraviolet dissociative photoionization. J Am Soc Mass Spectrom. 2016;27:1614–1619. doi: 10.1007/s13361-016-1453-6. [DOI] [PubMed] [Google Scholar]
- 37.Li P, Jackson GP. Charge transfer dissociation (CTD) mass spectrometry of peptide cations: Study of charge state effects and side-chain losses. J Am Soc Mass Spectrom. 2017:1–11. doi: 10.1007/s13361-016-1574-y. [DOI] [PubMed] [Google Scholar]
- 38.Cook SL, Collin OL, Jackson GP. Metastable atom-activated dissociation mass spectrometry: Leucine/isoleucine differentiation and ring cleavage of proline residues. J Mass Spectrom. 2009;44:1211–1223. doi: 10.1002/jms.1598. [DOI] [PubMed] [Google Scholar]
- 39.Wysocki VH, Joyce KE, Jones CM, Beardsley RL. Surface-induced dissociation of small molecules, peptides, and non-covalent protein complexes. J Am Soc Mass Spectr. 2008;19:190–208. doi: 10.1016/j.jasms.2007.11.005. [DOI] [PMC free article] [PubMed] [Google Scholar]
- 40.Zhou MW, Wysocki VH. Surface induced dissociation: Dissecting noncovalent protein complexes in the gas phase. Accounts Chem Res. 2014;47:1010–1018. doi: 10.1021/ar400223t. [DOI] [PubMed] [Google Scholar]
- 41.Xia Y, Chrisman PA, Pitteri SJ, Erickson DE, McLuckey SA. Ion/molecule reactions of cation radicals formed from protonated polypeptides via gas-phase ion/ion electron transfer. J Am Chem Soc. 2006;128:11792–11798. doi: 10.1021/ja063248i. [DOI] [PubMed] [Google Scholar]
- 42.Smith SA, Kalcic CL, Safran KA, Stemmer PM, Dantus M, Reid GE. Enhanced characterization of singly protonated phosphopeptide ions by femtosecond laser-induced ionization/dissociation tandem mass spectrometry (fs-lid-MS/MS) J Am Soc Mass Spectr. 2010;21:2031–2040. doi: 10.1016/j.jasms.2010.08.016. [DOI] [PubMed] [Google Scholar]
- 43.Li P, Hoffmann WD, Jackson GP. Multistage mass spectrometry of phospholipids using collision-induced dissociation (CID) and metastable atom-activated dissociation (MAD) Int J Mass Spectrom. 2016;403:1–7. doi: 10.1016/j.ijms.2016.02.010. [DOI] [PMC free article] [PubMed] [Google Scholar]
- 44.Fung YM, Adams CM, Zubarev RA. Electron ionization dissociation of singly and multiply charged peptides. J Am Chem Soc. 2009;131:9977–9985. doi: 10.1021/ja8087407. [DOI] [PubMed] [Google Scholar]
Associated Data
This section collects any data citations, data availability statements, or supplementary materials included in this article.
Supplementary Materials
Figure S1. CTD spectrum of insulin 4+ ranging from (a) m/z 400–1000, and (b) m/z 1000–2000.
Figure S2. ESI spectrum of insulin.
Figure S3. MS3 CID (amplitude = 0.25) spectrum of [Insulin+5H]6+• ranging from (a) m/z 300–1000 and (b) m/z 1000–1500.
Figure S4. MS3 CID of [insulin+4H]5+• derived from CTD of [insulin+4H]4+.
Figure S5. (a) Isolation spectrum of [Chain A]2+ at MS4 level, following MS3 CID of [M+4H]5+• derived from MS2 CTD of [M+4H]4+. (b) The same condition as (a) except an extra ion storage time of 200 ms. No adducts of O or O2 are observed.
Figure S6. (a) Isolation spectrum of [Chain B]2+ at MS4 level, following MS3 CID of [M+4H]5+• derived from MS2 CTD of [M+4H]4+. (b) The same condition as (a) except an extra ion storage time of 200 ms. No adducts of O or O2 are observed.
Figure S7. MS3 CID spectrum of [insulin+6H]5+• from (a) m/z 400 – 1000. (b) m/z 1000 – 2000 (CID amplitude = 0.3 V).
Figure S8. (a) CTD spectrum of insulin 6+, (b) the same experiment with simultaneous resonance ejection on[M+6H]7+• during CTD. The statistical calculations are given in supporting information Table S1.
Figure S9. The averaged intensity of [insulin+5H]7+•• with error bar. The blue dot: regular CTD experiment; orange dot: CTD experiment with resonant ejection of possible intermediate [insulin+5H]6+•.
Figure S10. (a) Isolation spectrum of [insulin+5H]7+•• at MS3 level. (b) 200 ms ion storage of [insulin+5H]7+•• following isolation at MS3 level. No adducts of O or O2 are observed.
Figure S11. (a) Isolation spectrum of [insulin+6H]8+•• at MS3 level. (b) 200 ms ion storage of [insulin+6H]8+•• following isolation at MS3 level. No adducts of O or O2 are observed.
Figure S12. MS3 CID spectrum of [insulin+5H]7+•• derived from CTD of [insulin+5H]5+ (CID amplitude = 0.30 V).
Figure S13. Zoomed-in CID spectrum of [insulin+7H]7+ from (a) m/z 300 – 1000. (b) m/z 1000 – 1400 (CID amplitude = 0.3 V).
Scheme S1. Fragment map of (a) MS3 CID of [insulin+5H]7+••, (b) CID of [insulin+7H]7+.
Table S1. Intensities and relevant calculations of fragment ions at m/z 820.0, m/z 956.6 and m/z 1148.0, during CTD of [insulin+5H]5+.
Table S2. Intensities and relevant calculations of fragment ions at 820.0, m/z 956.6 and m/z 1148.0, during CTD of [insulin+5H]5+ with resonance ejection on m/z 856.6 [Insulin +5H]6+•.


