

Abstract
Autism spectrum disorder (ASD) is a complex neurodevelopmental disorder with a strong genetic basis. Yet, only a small fraction of potentially causal genes—about 65 genes out of an estimated several hundred—are known with strong genetic evidence from sequencing studies. We developed a complementary machine-learning approach based on a human brain-specific gene network to present a genome-wide prediction of autism risk genes, including hundreds of candidates for which there is minimal or no prior genetic evidence. Our approach was validated in a large independent case–control sequencing study. Leveraging these genomewide predictions and the brain-specific network, we demonstrated that the large set of ASD genes converges on a smaller number of key pathways and developmental stages of the brain. Finally, we identified likely pathogenic genes within frequent autism-associated copy-number variants and proposed genes and pathways that are likely mediators of ASD across multiple copy-number variants. All predictions and functional insights are available at http://asd.princeton.edu.
Complex human diseases such as autism are driven by a multitude of genetic variants across the genome that manifest as a range of developmental and functional perturbations, often in specific tissues and cell types1,2. Sequencing-based discovery efforts3–8 have produced valuable catalogs of genetic variants that point toward potential causal autism genes. In particular, recent large exome sequencing studies of autism simplex families as well as case–control cohorts have combined the evidence from both de novo and transmitted loss-of-function mutations to implicate around 65 genes in autism risk9. However, this represents only a fraction of the estimated 400–1,000 genes likely involved in autism susceptibility10,11. To unravel a more comprehensive genetic basis of autism and identify the dysregulated cellular and developmental functions of the brain underlying the disease, we need approaches that leverage previously implicated genes in the context of brain-specific biology to discover the full complement of autism risk genes.
Molecular interaction networks are effective summaries of cellular processes and thus powerful computational tools for investigating disease genes complementary to genetic studies. Prior network-based analyses that focused on autism12–20 demonstrate the promise of functional genomics approaches. These methods, however, are limited by the underlying networks, which are built based either on gene coexpression in a single developmental context or on protein physical interactions that lack tissue-specificity and remain incompletely known in humans. Further, previous studies have focused on known risk genes or genes with strong prior genetic evidence of ASD association, thereby limiting the potential for discovering the full spectrum of disease genes.
We addressed these challenges by developing an evidence-weighted machine learning approach that utilizes a brain-specific functional interaction network. The brain-specific network integrates thousands of genomics experiments to create a genome-wide probabilistic graph representing how genes function together in pathways in the brain, or, conceptually, a molecular-level functional map of the brain21. The evidence-weighted disease-gene classifier described here learns the connectivity patterns of known ASD-associated genes in this brain network and then uses these data-driven patterns specific to ASD-associated genes to predict the level of potential ASD association for every gene in the genome. Using this approach, we provided predictions of ASD risk genes, including candidate genes that have minimal or no prior genetic evidence. Since the initial predictions were made, many of these candidate genes have been validated by sequencing studies as bona fide ASD-associated genes. Through integrated analysis of the network and our top predictions, we identified developmental stages implicated in ASD, characterized frequent autism-associated copy-number variants (CNVs) and found functional modules potentially dysregulated in the brains of people with autism. The genome-wide complement of autism candidate genes produced in this study can be used to systematically prioritize genes for resequencing, to guide the analysis of whole genome sequencing results and to accelerate discovery of the full genetic spectrum underlying ASD, which is needed to refine genetic diagnosis and develop treatments.
RESULTS
We used a recently developed21 human brain-specific functional interaction network to predict ASD candidate genes across the genome and then used these predictions to systematically characterize the developmental and functional features of the molecular phenotype of autism (Fig. 1). Our predictions provide researchers with a diverse set of ASD candidate genes in the context of the underlying brain-specific network, thus enabling further understanding of autism genetics.
Figure 1.
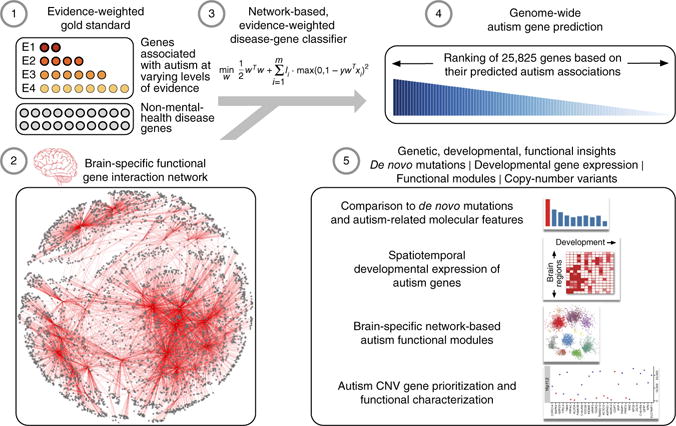
Genome-wide prediction of autism-associated genes. Our ASD-gene predictions are based on a machine learning approach that (1) uses a gold standard of known disease genes, those linked to autism with varying levels of evidence (E1–E4) as positives and other genes linked to non-mental-health diseases as negatives, in the context of (2) a human brain-specific functional interaction network to (3) build an evidence-weighted, network-based classifier capturing autism-specific gene interaction patterns and (4) predict the probability of autism association of each gene across the genome. We demonstrated the accuracy and utility of our genome-wide complement of autism-associated genes by (5) validating these predictions with de novo autism-associated mutations from an independent sequencing study, elucidating the spatiotemporal developmental gene-expression patterns of top-ranked autism-associated genes, laying out the landscape of autism-associated brain-specific functional modules (network clusters) and prioritizing candidate causal genes within large intervals of recurrent autism-associated copy-number variants.
Genome-wide prediction of autism risk genes
We constructed a gene-interaction network model containing predicted functional relationships for all pairs within 25,825 genes in the human genome in the context of specific human tissues, including the brain21. The brain-specific network uses a Bayesian method that extracts and integrates brain-specific functional signals from thousands of gene expression, protein–protein interaction and regulatory-sequence data sets (Online Methods).
We developed an evidence-weighted, network-based machine-learning method that uses this brain-specific network to systematically discover new candidate ASD risk genes across the genome. We first curated 594 genes linked with autism from a number of publicly available databases before 2014, ranging from high-confidence genetic associations (for example, SFARI Gene, http://gene.sfari.org) to automatically text-mined ASD-gene co-occurrences in published abstracts (for example, Gene2Mesh, http://gene2mesh.ncibi.org/). We grouped these genes into four evidence levels (E) based on the strength of evidence associating them with ASD (Supplementary Table 1). Using these genes along with their evidence levels as positive gold-standard examples and genes annotated to non-mental-health diseases as negative examples, we trained an evidence-weighted support vector machine classifier using the connectivity of these gold-standard genes to all the genes in the human brain-specific network as features (Fig. 1 and Online Methods). The classifier first identifies network patterns that differentiate known ASD-related genes (taking into account the level of ‘trust’ in each gene’s association with autism) from other disease genes. It then identifies new ASD candidates as those genes whose interaction patterns in the network highly resemble those of known ASD-related genes (Supplementary Fig. 1 and Supplementary Table 2). This approach produces a comprehensive, robust genome-wide ranked list of autism candidate genes (Supplementary Table 3 and Supplementary Fig. 2). To improve the interpretability of these ASD risk gene predictions, we also estimated probabilities and permutation-based P-values (and corresponding false discovery rate Q-values) for each gene (Supplementary Fig. 3 and Online Methods).
Evaluating only held-out high-confidence (E1) genes through five-fold cross-validation, we found that our approach was accurate (area under the receiver–operator curve (AUC) = 0.80, Wilcoxon rank-sum test, P = 1 × 10⁻⁶; Fig. 2a). Moreover, this evidence-weighted classifier, trained using genes in evidence levels E1–E4, significantly outperforms an unweighted classifier trained using only high-confidence E1 genes (AUC = 0.73, P = 2 × 10⁻⁴), a weighted classifier trained using only E1 and E2 (AUC = 0.76, P = 2.7 × 10⁻⁵), and a weighted classifier trained using E1 and E2 supplemented with random genes that match E3 and E4 in annotation, expression, and gene-length characteristics (AUC = 0.74, P = 1 × 10⁻⁴). This comparison unequivocally establishes that including lower-confidence genes (E3 and E4) in an evidence-weighted framework helps in significantly improving performance (Fig. 2a). Thus, although individual genes in these lower-confidence sets (E3 and E4) are not validated (a substantial fraction may not be found to be associated with ASD), as a unit they still contain informative signals that our computational approach effectively leverages to improve ASD risk gene prediction.
Figure 2.
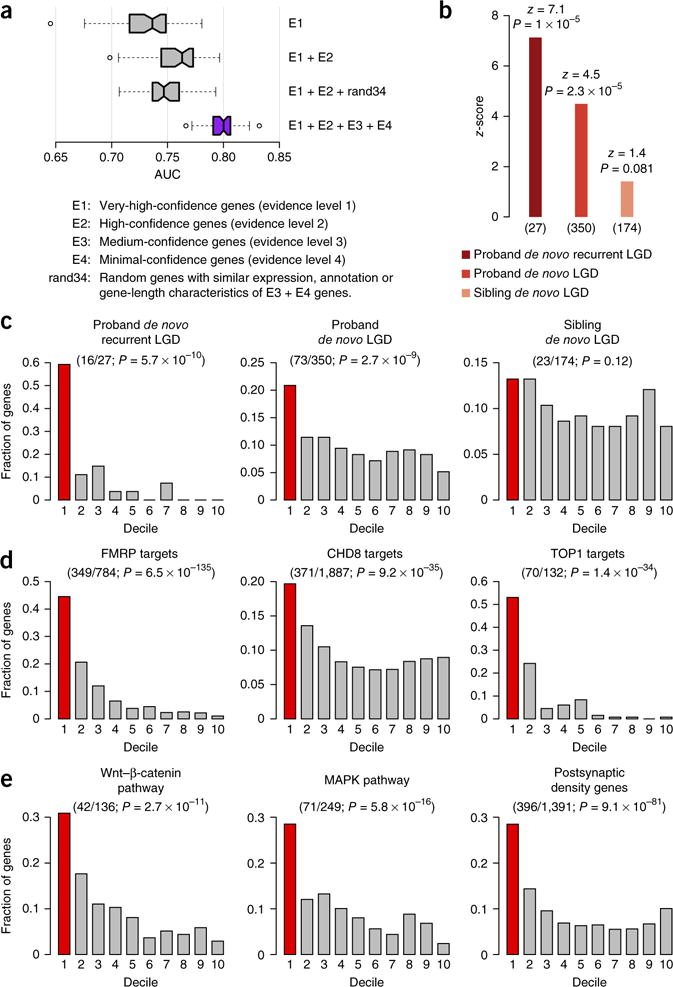
Evaluation of autism-associated gene predictions. (a) Performance of autism-associated gene prediction with different training gold standards. Each boxplot corresponds to the distribution of the AUC obtained from 50 evaluations (10× five-fold cross-validation; ends and center line: 25th, 50th and 75th percentiles of AUC, respectively; notches: 95% confidence interval around the median; whiskers: 1.5× interquartile range above and below the 25th and 75th percentiles; dots: outliers). Evidence-weighted classifier (purple) significantly outperforms all the other classifiers (Wilcoxon rank-sum test, U ≥ 2,399, P ≤ 1 × 10⁻¹⁴). (b) Rank-based enrichment of three gene sets from an independent sequencing study7 toward the top of our genome-wide ASD gene-ranking (summarized as z-scores; number of genes (n) given below; Online Methods). Enrichment P-values atop each bar were calculated using a permutation test (Online Methods). (c–e) Evaluation of the overlap of mutation and functional gene sets within the first decile (top 10%) of our predictions (one-sided binomial test). Fractions of genes in the gene set (y axis) that occurred within each decile of the genome-wide ranking (x axis; first decile colored red; number of genes in top decile/total and enrichment P-value in parentheses). (c) Decile enrichments of mutation data (used in b) were consistent with the trend observed in rank-based tests (in b). (d) Experimentally determined targets of the major ASD-associated regulatory proteins FMRP, CHD8 and TOP1 were significantly enriched among the top-decile predictions. (e) Members of major ASD-associated pathways and complexes (Wnt signaling, MAPK signaling, and the postsynaptic density complex) showed similar significant enrichments.
In addition to computational evaluation by cross-validation, we performed a systematic empirical evaluation based on results from an external exome-sequencing study of 2,517 families7. We focused on de novo likely-gene-disrupting (LGD; also known as loss-of-function) mutations identified in these families with one child with autism (proband), and, in most cases, an unaffected sibling (Supplementary Table 4). Genes harboring LGD mutations in probands were significantly enriched toward the top of our ranking (permutation test, P = 2.3 × 10⁻⁵; Online Methods); this enrichment was even more pronounced for targets of recurrent proband LGDs (mutations found more than once among children with autism), which are highly likely to be true autism-associated genes (P = 1 × 10⁻⁵). In contrast, enrichment was absent for genes with LGD mutations in unaffected siblings (P = 0.081), showing that our predictions specifically rank LGDs related to autism over those potentially unrelated to the disease (Fig. 2b). For further analysis, we focused on the top decile of predicted ASD risk genes (median false discovery rate < 0.025), which closely reflected the above trend: these ~2,500 genes were significantly enriched for LGDs in probands (binomial test P = 2.7 × 10⁻⁹; Fig. 2c and Online Methods), but not in unaffected siblings (P = 0.12). The enrichment was even more striking for recurrent proband LGDs (P = 5.7 × 10⁻¹⁰), with about 60% of these present in the top decile of our predictions. Notably, prediction for each gene is made through cross-validation where any potential information about that gene’s known connection to autism (its presence in E1–E4) was ‘hidden’ from the method. In fact, the trends observed in this analysis held even when the evaluation was strictly limited only to ‘novel’ genes not used in our training set that were observed in families whose data were still unpublished at the time of our analysis (Supplementary Fig. 4) or when tested on genes identified in a study independent of the Simons Simplex Collection8 (P = 4.12 × 10⁻⁶). These trends were not biased by long, brain-expressed genes (Supplementary Table 3 and Online Methods). In addition, in contrast to prior network-based methods, our approach is able to identify new candidate genes with no prior genetic link to ASD (Supplementary Fig. 5) while maintaining accuracy (Supplementary Fig. 6).
Our top-ranked first-decile predictions included a significant number of experimentally identified targets of major ASD-associated regulators (FMRP (ref. 22), TOP1 (ref. 23) and CHD8 (ref. 24)), as well as members of the major pathways implicated in autism (Wnt-β-catenin4,19, MAPK25 and post-synaptic density26; Fig. 2d,e). Furthermore, we found that interaction partners of brain-expressed isoforms of known ASD-associated genes identified in an independent, high-throughput protein interaction assay27 were also enriched in the first decile of our ranking (binomial test P = 1.96 × 10⁻⁵). Our top-ranked genes were specific to autism, exhibiting an expected overlap with genetically similar disorders (such as intellectual disability and schizophrenia), while being distinct from genes associated with other unrelated neuronal diseases (such as Alzheimer’s and Parkinson’s diseases; Supplementary Fig. 7). Further, in agreement with recent findings28, genes we predicted to be highly linked to ASD tended to be more evolutionarily constrained than all the other genes (permutation test P = 1 × 10⁻⁶; Supplementary Fig. 8 and Online Methods).
Examining individual top-ranked genes, our predictions contained a number of genes with prior ASD associations that were not used as part of our positive training set (Supplementary Table 3). Our chief contribution, however, is the prediction of several new candidate genes with minimal or no prior genetic evidence linking them to autism. Interestingly, many of these candidate genes are within large CNV intervals reported in autism cases, implying their potential role in the pathogenicity of those CNVs (Supplementary Table 3). These genes are prime targets for follow-up with experimental verification and genetic validation. Taken together, these rigorous evaluations based on several large, independent, experimentally derived data sets, along with evidence from published literature for individual genes, demonstrated that our genome-wide predictions captured a major molecular signature of autism. Our predictions can therefore be used for systematic analyses to gain further insights into autism genetics and pathogenesis.
Autism-linked genetic changes in fetal brain development
One of the underlying features of autism is altered brain development. Identifying the precise developmental stages and regions that are affected by the genetic changes underlying autism is crucial in unraveling the disease mechanism. Here, we used our genome-wide ASD gene predictions in concert with large-scale spatiotemporal gene-expression data of the developing human brain29 to identify regions and stages most pertinent to autism. Previous computational studies have used these data to construct coexpression networks16,30 by pooling multiple regions or developmental stages to obtain a minimum number of samples for coexpression analysis. Our approach leverages the comprehensive set of ASD candidate genes and thus allows analysis of individual regions and time points within these data in the context of autism. We proceeded by calculating gene expression signatures specific to each spatiotemporal window and estimating the enrichment of these signatures among our predicted autism risk genes (using a carefully controlled permutation test) to identify when and where predicted ASD genes are specifically active (Fig. 3, Supplementary Table 5, Supplementary Fig. 9 and Online Methods).
Figure 3.
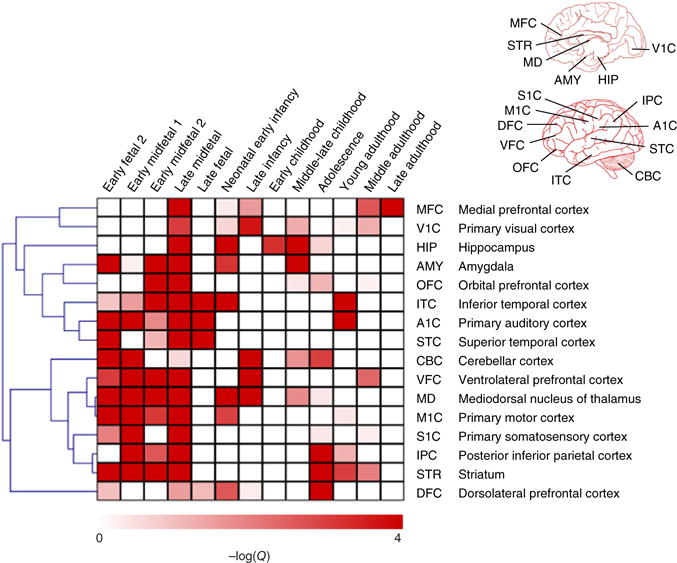
ASD-associated genetic changes in the spatiotemporal development of the brain. The heat map shows the enrichment of spatiotemporal gene expression signatures toward the top of the genome-wide ranking of ASD genes. The 16 brain regions and 13 developmental stages considered label the rows and columns, respectively. The regions are further marked on illustrations of the human brain at the top right. Each cell (row, column) in the heat map corresponds to a spatiotemporal signature: a set of genes highly expressed specifically in that region (row) at that developmental stage (column). The intensity of the color in each cell (scale below) represents the log-transformed significance of ASD-association of that signature. A rank-based scoring followed by a permutation test was used to calculate P-values, which were then converted to Q-values to account for multiple hypothesis testing (Online Methods). The heat map shows a striking prenatal signal suggesting a major effect of ASD-associated mutations on fetal brain development.
Our analysis identified a clear developmental pattern—a prenatal signal from the early, mid and late fetal stages—indicating that autism-associated genetic changes affect the development of the fetal prefrontal, temporal and cerebellar cortex. This finding is largely consistent with previous studies16,18,30,31, as well as recent findings on the possible role of callosal projection neurons17 and on the neuropathology of autism brain32. Spatially, on the other hand, we observed that the activity of ASD candidate genes was widely distributed across regions during early brain development, displaying a broad distribution that underscores the heterogeneity of the disorder. This pattern is consistent both with the lack of a single, highly reproducible neuroanatomical correlate of autism33, and with evidence that autism may be a disorder of general neural processing that manifests in many regions, including visual, auditory, motor and somatosensory cortices34.
Performing this analysis using our genome-wide ASD candidate genes not only aided in revealing high-level spatiotemporal patterns relevant to ASD but also enabled us to localize hundreds of new candidate genes to specific brain regions that have been previously linked to the etiology of autism, such as the cerebellum35 and striatum36. A substantial body of literature35 implicates the cerebellum in the development of the disorder, both in mouse models and in humans, and our results highlight both fetal and early postnatal time points when disrupted gene expression in the cerebellum may contribute to autism risk. In addition, the striatum was identified here as a key locus of autism pathology throughout fetal development, a finding of particular relevance to repetitive behaviors as explored in mouse models that have both construct and face validity36. In addition to known ASD-linked regions, we observed a new molecular signal in the mediodorsal nucleus of the thalamus in early fetal and midfetal brain development that is consistent with reduced functional connectivity of this region in autism as suggested by functional MRI37. Our analysis provides a method for choosing specific regions at relevant developmental stages for experimental verification of new ASD candidate genes at the highest spatiotemporal resolution allowed by the expression data.
Brain-specific functional modules disrupted in ASD
In concert with studying the developmental aspects of autism, a detailed understanding of the underlying effects of autism-associated genetic changes on cellular functions and pathways will result in a more complete picture of the molecular basis of ASD. Typical pathway analysis of known ASD-associated genes falls short of this goal, having only the ability to highlight functionally annotated genes while providing little information about the hundreds of uncharacterized genes, let alone how all these genes and associated pathways are functionally interconnected in the brain. To address this challenge, first, we defined an ASD-associated gene network as the human brain-specific functional network underlying the top decile of our predicted ASD-associated genes. Genes that functionally cluster together in the cell tend to have common local neighbors in such networks38. Based on this idea, we used a community-finding algorithm to find clusters of ASD candidates that share local network neighborhoods (defined by shared k-nearest-neighbors; Online Methods). This strategy results in clustering the ASD network into distinct and substantially cohesive functional modules predicted by our approach to be affected by ASD-associated genetic changes (Fig. 4 and Supplementary Fig. 10).
Figure 4.
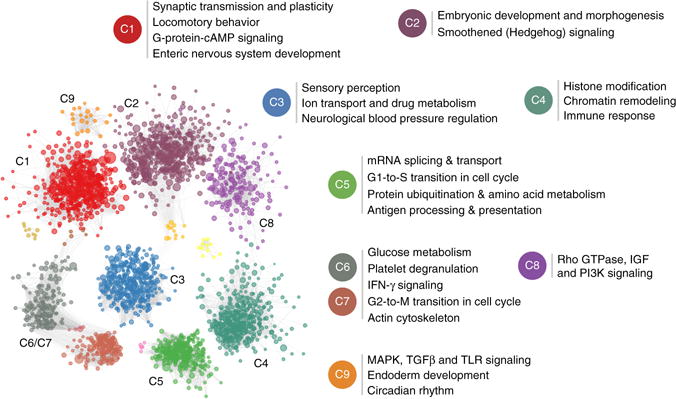
Autism-associated brain-specific functional modules. The network of brain-specific functional interactions among the top 2,500 ASD-associated genes were clustered using a shared-nearest-neighbor–based community-finding algorithm (Online Methods) to elucidate several modules of genes (left). Nine of the clusters that contained 10 or more genes, labeled C1 through C9, were tested for functional enrichment using genes annotated to Gene Ontology biological process terms. Representative processes and pathways enriched within each cluster are presented here alongside the cluster label. Since C6 and C7 shared a number of strong links across the clusters, they were merged before calculating functional enrichment. The enriched functions provide a landscape of cellular functions potentially dysregulated by ASD-associated mutations.
The primary contribution of this analysis is a systematic way of associating individual previously functionally uncharacterized genes, several of which are new ASD candidates (with minimal or no prior evidence), with specific processes and phenotypes that might underlie autism etiology (Fig. 4 and Supplementary Table 6). These include cellular functions (for example, synaptic transmission and neuronal function8,12,25,39, classified as cluster (C) 1), signaling pathways (for example, canonical Wnt4,19 (C2) and gamma interferon40 (C6 and C7)) and fundamental cell biological processes (for example, histone modification and chromatin remodeling7,8 (C4) and cell cycle regulation (C5)) that have been repeatedly implicated in autism. The clusters delineated here also connect genes with key autism-associated phenotypes. For example, genes involved in enteric nervous system development (C1) might underlie the gastrointestinal symptoms common and persistent in children with autism41. Similarly, hypersensitivity to a range of stimuli is a well-established aspect of the autism phenotype42, and the genes identified in C3 include those involved in a whole assortment of perceptions (for example, chemical stimuli, sound, light, smell, pain and temperature). Also noteworthy given the strong association of sleep dysregulation with autism43 is circadian rhythm, captured in C9.
These findings suggest functional roles for genes associated with ASD pathogenesis and provide a framework for better understanding the genes that underlie the emergence of important and often poorly understood phenotypes in animal models. Approximately 20% of the genes within each cluster are completely uncharacterized (lack any annotation to specific processes or pathways in the Gene Ontology), and our analysis suggests specific functional roles for these genes. For example, DIP2C (genome-wide ASD rank #180) and RSBN1 (#85) were the top-ranked uncharacterized genes in C8 and C4, respectively, that are also specifically expressed during early fetal development. The grouping of DIP2C in C8, its fetal gene expression and the identification of a de novo LGD mutation in DIP2C in a proband in the Simons Simplex Collection6 together link DIP2C to autism through the Rho and insulin-like growth factor receptor pathways. Likewise, RSBN1 was tightly linked to chromatin remodeling and histone modification genes in C4. Its mouse homolog exhibits a punctate nuclear location44, consistent with a nuclear function for the protein. These and many other uncharacterized genes (Supplementary Table 6) are candidates for experimental follow-up in specific functional contexts to characterize the cellular dysregulation in autism.
Identifying candidate genes within recurrent ASD-associated CNVs
CNVs are important risk factors for autism. Yet, identifying which among the genes in these chromosomal intervals are pathogenic remains challenging. Our genome-wide prediction enabled us to systematically prioritize genes within CNVs and reveal candidates for experimental verification. We applied this approach to eight of the most common autism-associated CNVs—16p11.2, 15q11-13, 15q13.3, 1q21.1, 22q11, 7q11.23, 17q12 and 3q29—and found that many of the genes within these CNVs ranked in the first decile of our genome-wide ASD-gene ranking had previous genetic or functional evidence linking them to autism (Fig. 5, Supplementary Table 7 and Supplementary Fig. 11). Our method also implicated new ASD candidates within these CNVs, which, based on the above trend, are strong candidates for further experimental follow-up, particularly those candidates that belong to pathways previously implicated in the downstream effects of the CNVs. For example, a recent report suggests that changes in copy number at the 16p11.2 locus, the most widely studied and one of the most common CNVs linked to autism45, may affect RhoA signaling and dynamics of the actin cytoskeleton46. One of our top-ranked genes in 16p11.2, PPP4C (ranked third within that interval), is known to regulate Rho GTPases and levels of filamentous actin47, suggesting a mechanism whereby haploinsufficiency for PPP4C might contribute to the phenotypes associated with 16p11.2 deletion. Another potential link between 16p11.2 and ASD is the top-decile transcription factor MAZ (ranked fourth within the interval; see the Discussion section). Strikingly, 10 of the 23 top-predicted (first decile) genes across the eight CNVs, including MAZ, were significantly highly expressed in the mediodorsal nucleus of the thalamus during early midfetal development, a spatiotemporal window that we associated with autism in this study (Fisher’s exact test for enrichment among genes in the expression signature specific to the mediodorsal nucleus of the thalamus at early midfetal stage, P < 1.2 × 10⁻⁹).
Figure 5.
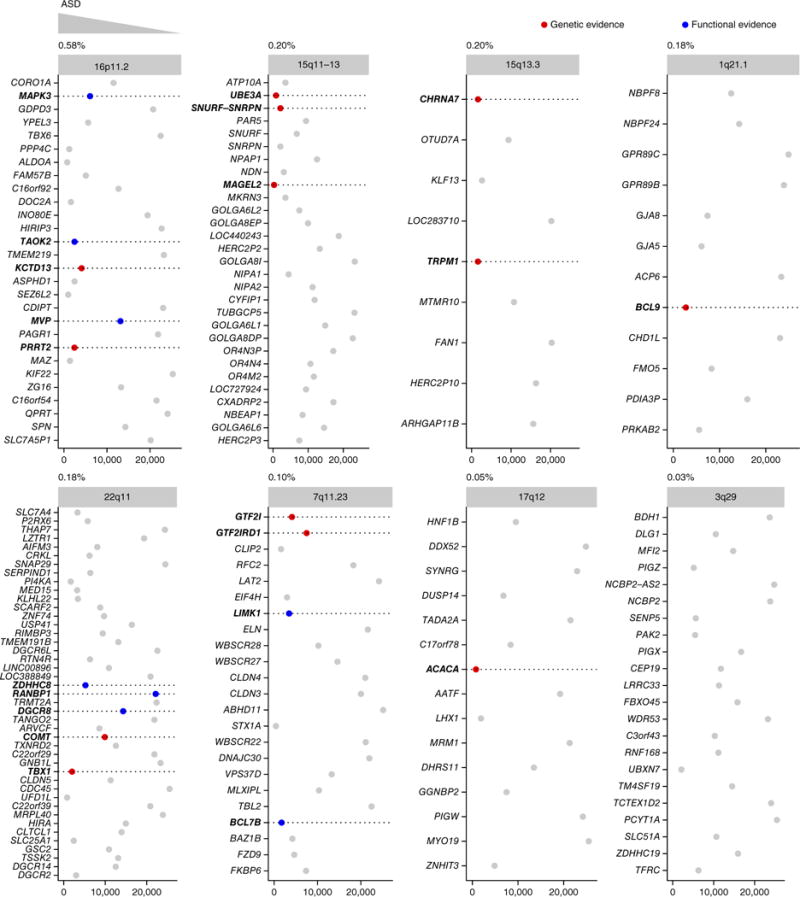
Prioritization of genes within eight recurrent ASD-associated CNVs. Each plot corresponds to one of the eight CNVs ordered based on their observed frequency in persons with ASD50 (given above each plot). The plots show the genes in each CNV interval in their genomic order (y axis) and each gene’s ASD-association rank in our genome-wide predictions (x axis) from top (low) ranks on the left to bottom (high) ranks on the right. The points corresponding to the genes are colored based on whether there exists previously known (direct) genetic (red) or (indirect) functional (blue) links between the genes and autism, independently curated by an ASD expert. The detailed rankings and evidence for CNV genes are in Supplementary Table 7. The dashed lines are visual aids to read the gene names (in bold) of the colored points. Across CNVs, genes with independent genetic evidence (red) and those with functional evidence (blue) are more likely to be ranked near the top of our genome-wide predictions (toward the left of each plot) than other genes for which there is no such evidence (gray).
With multiple CNVs and multiple candidates within each, a further challenge is identifying how they converge on similar cellular functions that might be dysregulated, leading to autism. Here we attempted to shed light on this mechanism by leveraging the top-ranked genes within the CNVs and the brain-specific network to identify pathways that may be disrupted by multiple ASD-associated CNVs. We hypothesized that genes involved in these disrupted pathways (referred to as ‘intermediate genes’) would be critical bridges between ASD candidate genes within CNVs and the major autism phenotype genes within the brain functional network. We identified such intermediate genes as key nodes along the shortest paths in the brain network specifically linking the predicted ASD candidates within each CNV to the 19 high-confidence (E1) autism-associated genes that represent the core molecular etiology of autism (Supplementary Fig. 12 and Online Methods). We then outlined the biological processes enriched in these intermediate genes that were also mentioned in connection with autism in the literature (Online Methods). Through this analysis, we were able to propose, in a data-driven way, genes and processes that likely underlie the cellular functions that CNVs impinge on to contribute to the autism phenotype (Fig. 6). Multiple previous studies support our findings (Supplementary Table 8). The full set of intermediate genes and enriched processes (Supplementary Table 8) thus provide a rich resource for experimental follow-up studies.
Figure 6.
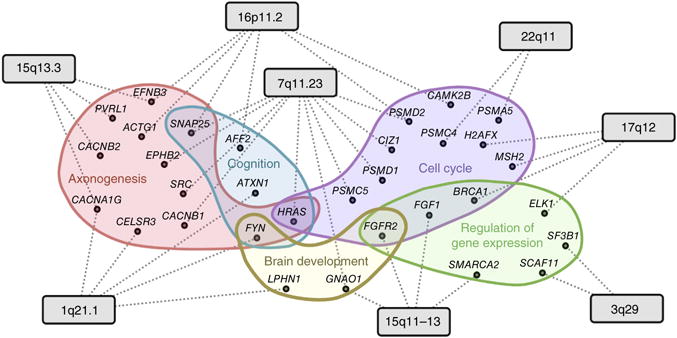
Convergence of cellular functions disrupted by multiple CNVs identified through key intermediate genes in the brain network. The network diagram illustrates intermediate genes linking the eight CNVs (gray rectangles) to the molecular phenotype of ASD. The dotted lines represent high-confidence functional links in the brain that mediate the linkage of top CNV genes to ASD genes; these linkages go through key intermediate genes (black circles; Online Methods). Enrichment analysis groups the intermediate genes into a small number of autism-related processes (illustrated as colored clouds). For visual clarity, only representative examples of processes associated with at least two CNVs are included. The functions of these intermediate genes illustrate the hypothesis that multiple CNVs might disrupt a core group of ASD-related biological processes and pathways.
A web interface for exploring autism-associated gene predictions
We have developed a dynamic web interface, hosted at http://asd.princeton.edu/, that provides interactive access to all autism gene predictions from this study along with the results from subsequent analyses, including spatiotemporal brain signatures, functional modules and prioritized CNVs. Using this interface, autism researchers can explore the results from this study not just as ranked genes, but also in the context of the genes’ relationships in the human brain-specific network. The interface allows gene-based search, dynamic network visualization and the ability to export results (Supplementary Fig. 13). We will continue to update this web server regularly in the future. As an example, we have made available a new set of accurate predictions (AUC = 0.89; http://asd.princeton.edu/v2) by training the classifier on an updated version of the SFARI gene database that includes all the results from the 2014 study7. The new predictions (v2) are overall quite consistent with the one used throughout this study (v1), with a correlation coefficient of 0.93 between the genome-wide rankings and 83.3% of top decile genes consistent between v1 and v2 (Supplementary Fig. 14).
DISCUSSION
The genetic heterogeneity underlying ASD is daunting, with multiple modes of inheritance, a sizeable contribution from de novo events, and hundreds of both rare and common variants likely contributing to the disease. These challenges are further compounded by diverse clinical phenotypes and limited sample sizes. As a result, it is unlikely that all risk genes would be identified by sequencing studies and statistical association alone. Sequencing screens mainly identify mutations with large effect sizes, and quantitative association studies rely on relatively high mutation frequencies, causing both study types to miss gene variants with modest frequencies and effect sizes, as well as epistatic effects that could underlie the ASD phenotype.
In this study, we presented a powerful, computational approach to facilitate genome-wide ASD gene discovery. We recently built an integrative gene network that serves as a robust scaffold of brain-specific gene interactions and cellular functions21. Here, we took advantage of this brain-specific network to provide a ranking of all genes in the human genome by their potential pathogenic involvement in ASD (Fig. 1). The validity of this comprehensive complement of genes is attested to by an independent exome sequencing study published after our initial analyses were completed (and, therefore, not included in our training sets), with the strong autism candidates from the study (recurrent de novo LGD mutations) ranking near the top of our prioritized list (Fig. 2). Traditional disease-gene prediction methods48 use only genes with the highest confidence or all genes irrespective of the evidence linking them to disease. Our evidence-weighted method can incorporate and detect ASD-related signals among a large number of genes with various levels of confidence of autism-association identified from single or multiple experimental and/or sequencing efforts to make more accurate predictions (Fig. 2a). Because the method is highly generalizable, it can be readily applied to the study of many other complex diseases.
In addition to prioritizing hundreds of new ASD candidate genes, we used the underlying network to link individual ASD genes to perturbed cellular functions and higher-level phenotypes (such as brain development, sensory perception and circadian rhythm), thus aiming to bridge the genotype–phenotype gap in autism. In fact, our genomewide prediction ranks LGD genes in Simons Simplex Collection probands with lower nonverbal IQ (<100) significantly higher than LGD genes in probands with higher nonverbal IQ (100; one-sided Wilcoxon rank-sum test, P = 6.7 × 10⁻³). Similarly, LGD genes highly ranked by our method are also associated with severe, restricted repetitive behavior49 (one-sided permutation test P = 0.042). Using a combination of our whole-genome ranking of ASD candidate genes and spatiotemporal gene expression data of the human brain29, we have gained insights into specific stages in human brain development that might be critically affected by mutations in autism-associated genes. (The functional and developmental contexts of our top-decile predictions are shown in Supplementary Table 9.) Furthermore, this analysis demonstrated how biomedical researchers can use our genome-wide ASD candidate gene predictions as a framework for analyzing their data from high- or low-throughput assays, allowing high-resolution study of autism genetics in the functional and physiological contexts of their interest (Supplementary Fig. 15).
Finally, we used the genome-wide predictions to prioritize potentially ‘causal’ genes within large regions of autism-associated CNVs and to illustrate how genes from different CNVs converged onto a set of common genes and pathways that could mediate the cellular perturbations associated with autism. This analysis provided experimentally testable hypotheses for further research into the molecular mechanisms underlying the connection to ASD for the most common ASD-associated CNVs. For example, one of the top-ranked ASD candidate genes in 16p11.2 is the gene encoding the transcription factor MAZ (ranked fourth in the 16p11.2 interval), which had not been previously characterized in the context of autism. On the genome-scale, computationally predicted targets of MAZ (genes with MAZ’s DNA-binding motif in their upstream sequences; Online Methods) are statistically over-represented in our ASD-associated gene predictions (P < 2.2 × 10⁻¹⁶) and are involved in the regulation of neuron differentiation and axonogenesis. MAZ and its predicted targets also show specific spatiotemporal expression in the early midfetal stage of development in the primary motor cortex (Fig. 3), a stage demonstrated to be relevant to autism30. Together these observations lead to a specific hypothesis: the disruption of normal MAZ function (or one of its targets) in the primary motor cortex at the early midfetal developmental stage may lead to the autism phenotype by perturbing the transcription of neuronal differentiation and neurodevelopmental genes.
All the genome-wide predictions, ASD-associated brain developmental stages, functional modules and prioritized CNVs from this study, as well as their brain network contexts, are available to the biomedical community at http://asd.princeton.edu. Researchers can explore the top predicted candidate genes and processes as well as any genes they are specifically interested in (such as genes found in sequencing or GWAS studies) in the context of our network and generate new sets of related genes or processes. The top-ranked genes identified here, especially the many previously uncharacterized genes, have the potential to speed up gene discovery and spur further focused experimental studies that can lead to better objective genetic biomarkers for early diagnosis of ASD. Our predictions can specifically help guide the analysis of whole exome or genome sequencing results by prioritizing the genes harboring missense mutations or nearby noncoding variants that should be followed up by downstream experimental investigation. We expect that these genes and associated pathways, along with their brain-specific functional contexts, will help identify potential therapeutic targets that can make intervention more impactful.
METHODS
Methods and any associated references are available in the online version of the paper.
ONLINE METHODS
Sources of known autism-associated genes
Several databases contained information about a number of autism-associated genes. Each resource, however, gathered data from sources with different levels of evidence, ranging from recurrent mutations in patients with autism to nebulous links gleaned from text-mining thousands of PubMed abstracts. In an effort to be comprehensive in putting together our initial picture of autism genetics, we collected genes linked to autism from all these sources (up to December 2013) and classified them into four evidence levels, each associated with an evidence-weight that was commensurate with the quality of the evidence (Supplementary Table 1). For example, genes from categories 1 and 2 in SFARI51 found by statistically significant rare variant associations or nominally significant (but replicated) common variant associations, as well as genes from OMIM52 (a total of 19 genes) were designated as evidence-level 1 (E1) and given a weight of 1.00. Thirty-one candidate genes with two lines of literature evidence annotated to category 3 in SFARI were designated as evidence level 2 (E2) and given a weight of 0.50. Databases HUGE53 and GAD54 together record 413 genes identified based on genetic association studies, which were designated as evidence level 3 (E3). 131 genes inferred purely based on text-mining PubMed abstracts from the Gene2MeSH (http://gene2mesh.ncibi.org/) and DGA55 databases, as well as those assigned with minimal-evidence (to category 4) in SFARI were designated as evidence level 4 (E4). Genes in levels 3 and 4 were given a weight of 0.25. Each gene was uniquely assigned to the highest evidence level. In total, we curated 594 autism-associated genes with evidence weights ranging from 0.25 to 1.
Human brain-specific functional interaction network
The brain-specific functional network was built by integrating thousands of large-scale genomic data using a regularized Bayesian approach21 (Supplementary Fig. 13). We first trained a naive Bayesian classifier specifically for the brain using curated brain-specific knowledge, reflecting what we currently know based on high-quality low-throughput experiments exploring which genes are specifically expressed in the brain and participate in the same biological processes/pathways. The Bayesian model that underlies our integration includes a class node indicating the presence or absence of a functional relationship between a pair of genes that is conditioned on hundreds of other nodes, one for each data set. The contribution of each data set is estimated in the model based on how relevant and accurate it is in reflecting how cellular pathways function in the brain. Since the assumption of conditional independence required for the naive Bayes classifier is violated for the large-scale genomics data sets, we incorporated regularization by calculating the mutual information between data sets and down-weighting similar data sets accordingly. Finally, the naive Bayes functional-relationship posterior probability for each gene pair is calculated proportionally to the product of the weighted likelihoods. We used this model, now trained on brain-specific knowledge, to make genome-wide predictions by estimating the probability of brain-specific functional interactions between all pairs of genes (25,825 genes represented in at least one data set). The predicted posterior probabilities were scaled based on the assumption that the prior probability of a functional relationship is 0.01. The final network of functional relationships reflects how likely each pair of genes in the genome is to participate in the same pathway in the brain.
We have shown that multiple genes associated with a particular disease often tend to have similar patterns of connectivity in a relevant tissue-specific functional network21. We use this notion (further described below) to discover autism-associated genes in the context of the brain-specific gene network.
Learning and cross-validation of the network-based classifier
We used a machine learning approach to predict autism-association genes. Our approach had two steps: (i) Building a statistical model that captured the connectivity patterns of known autism-associated genes in the brain-specific network, and (ii) using this model to subsequently predict whether each of the other ‘unknown/ unlabeled’ genes in the network looks like an autism-associated gene based on its connectivity in the network. We trained an evidence-weighted linear support vector machine (SVM) classifier using the gold standard of known autism-associated genes (along with their weights) as positives and 1,189 genes associated with non-mental-health diseases (from OMIM, with weights equal to 1) as negatives. The brain-specific interaction probabilities of each gene to all the genes in the brain network were used as features. Given the network features (xi) and a positive/negative label (yi) for all the m training genes, the linear SVM solves the following optimization problem56:
where li is a penalty parameter specific to each gene that influences how costly it is to misclassify that gene. By setting li equal to the evidence-weight of the labeled gene (where negatives have li of 1), we ensured that our model rarely misclassi-fies high-confidence genes while giving certain latitude in correctly classifying low-confidence genes.
To evaluate this approach, we employed a stringent five-fold cross-validation scheme: in each fold, we trained a model on 4/5 of the labeled (positive and negative) genes and evaluated the model on only high-confidence (E1) positives (and all negatives) in the remaining 1/5 of the labeled genes. The model with weights equal to 1.00, 0.50, 0.25 and 0.25 for E1, E2, E3, and E4 genes had an AUC of 0.80. Taking model variance into account by repeating the five-fold cross-validation 50 times, we demonstrated that this model performs significantly better than one trained only using high-confidence genes (weights 1, 0, 0, 0; AUC = 0.73; P < 2.2 × 10⁻¹⁶, two-sided Wilcoxon rank-sum test; weights 1, 1, 0, 0; AUC = 0.76; P < 2.4 × 10⁻¹⁵) and significantly better than one trained with real E1–E2 supplemented with random genes simultaneously matched with E3–E4 for gene length, brain expression and neuronal gene ontology (AUC = 0.74, P < 2.2 × 10⁻¹⁶). Therefore, we used the evidence-weighted model to make further predictions.
Genome-wide prediction using evidence-weighted network classifier
We coupled whole-genome prediction with five-fold cross-validation. A prediction for each labeled gene (positive/negative) was recorded only from the fold that did not include the gene for training, which ensured that the model relies only on the gene’s network-based similarity to other genes instead of its own prior evidence. A prediction for an unlabeled gene is recorded as the average of predictions from the five folds. Each prediction corresponds to the distance of the gene from the hyperplane that separates positive genes from negative genes, and these distances are used to rank all the genes in the genome. For interpretability, the distances are also converted to probabilities using isotonic regression (see below). This produces a genome-wide ranking of 25,825 genes based on their predicted level of association with autism.
Evaluation of autism-associated gene ranking on independent de novo mutations
De novo mutations from exome-sequencing study
The Simons Simplex Collection57 (SSC) contains more than 2,500 families, each of which has a single child with ASD (a proband). Most of these families have at least one unaffected sibling. A recent study used whole exome sequencing of the SSC to identify de novo LGD mutations in children with autism and their unaffected siblings7. 350 and 174 genes were targets of LGD mutations in probands and unaffected siblings, respectively. Among the 350 LGD genes in probands, 27 were observed in more than one proband (recurrent LGD), indicating that these are very likely to be true autism-associated genes. We used these sets of genes—proband recurrent LGD (27), proband LGD (350) and sibling LGD (174)—to benchmark our genome-wide autism-associated gene ranking. When testing each LGD set, we used 462 genes containing synonymous mutations in unaffected siblings (sibling SYN) as a control. Further, to account for potential biases in exome sequencing coverage, when defining a genomic background, we removed the 8,054 genes in which no rare variants from reference were reliably detected anywhere within genic boundaries.
Preliminary de novo mutation data on 682 SSC families were published in three separate reports in 2012 (refs. 3,4,6). Since it was likely that some of these data were represented in our training set of autism-associated genes, we created an ‘unpublished’ evaluation data set from SSC which was released after our prediction. This data set was created from the new SSC families in the 2014 study7 (i.e., 1,835 families after removing the previously published 682 from the total of 2,517 families), which underwent whole exome sequencing to identify de novo LGD mutations in children with autism and their unaffected siblings. We used this unpublished set of mutations to re-test the significance of our findings derived based on the entire SSC cohort (Supplementary Fig. 4).
We also obtained the 107 likely ASD-associated genes from a study independent of the SSC8 and used this set to evaluate our predictions.
Decile enrichment test
After removing SSC genes without rare variants from the autism-associated gene prediction rankings, the remaining genome-wide gene ranking was divided into deciles. For a given set of LGD genes, we used the binomial test to assess whether a larger fraction of the LGD genes occurred in the first decile when compared to the expected fraction based on the occurrence of sibling SYN genes. Reassuringly, sibling SYN genes were roughly apportioned 10% to each decile, indicating that it is a good control set.
Rank-based enrichment test
To demonstrate robustness of our evaluation to specific rank cutoffs (as our decile enrichment test assesses genes above a 10% rank cutoff), we also formulated a rank-based test. This test takes the entire genome-wide ranking and assesses the set of LGD genes for a skewed distribution toward the top of the ranking relative to the control set. First, based on the genome-wide autism-association ranking, we calculated an exponential score si for each gene i based on its autism-associated rank rank(i) as follows:
Here N is the total number of genes equal to 25,825, and b was set to 100. The score si ranges between 1 for the top-ranked gene dropping exponentially to 0 for the lowest ranked gene. The rank-based test then proceeds in three steps: (i) calculate the observed difference (dobs) between the mean rank-based score of the test LGD gene set (for example, proband LGD) and the control gene set (sibling SYN); (ii) shuffle the gene labels in the test and control gene sets 100,000 times and, each time, record the difference between mean(test) and mean(control) (dpermut); (iii) calculate a P-value for dobs equal to the fraction of permuted differences dpermut that were equal to or greater than dobs; and calculate an effect size for dobs as a z-score:
where μ and σ are the mean and s.d. of the distribution of dpermut values.
Evaluation controlling for gene length
Genes linked to ASD are known to be longer in size than genomic background23. To test if our genome-wide ranking is driven by prioritizing long genes, we repeated our LGD evaluation while controlling for gene length. We sorted all genes by their length, divided the genes into bins of 500 genes (of very similar lengths), randomized ASD ranks of genes within each bin, and calculated the top-decile enrichment of LGD-target genes. A P-value is calculated by repeating this procedure 10,000 times and calculating the fraction of times the permuted top-decile enrichment P-value is less than or equal to the observed P-value.
Evaluation controlling for bias in brain-/neural-functional annotations
To demonstrate that brain and/or neural genes are not biasing our results, we evaluated our predictions on whether they could prioritize proband LGD genes within a non-neural-annotated gene set. We created this set by including proband LGD genes that are neither annotated to neural or brain-related functions in Gene Ontology nor part of our training gold standard. Fisher’s exact test was then used to calculate significance.
Evolutionary constraint of ASD-associated genes
Evolutionary constraint estimates of genes were obtained from two different studies58,59, one providing a quantitative (RVIS) score for each gene, and the other providing a single set of 1,003 constrained genes. The Wilcoxon rank-sum test was used to assess the difference between the RVIS scores for genes in our top-decile compared to the rest of the ranking, and Fisher’s exact test was used to calculate the enrichment of the constrained gene set in our top decile. We also evaluated both sets using a rank-based permutation test that does not involve any rank cutoffs. For the RVIS score, a test statistic equal to the Spearman correlation coefficient between genes ranked by our method and by RVIS scores was calculated; a P-value for this statistic was estimated by permuting the ASD candidate gene ranking one million (1,000,000) times and calculating the fraction of times the permuted correlation was less than or equal to the observed one. For the constrained genes, a test statistic equal to the mean rank-based scores (si) of genes in the set was calculated; a P-value for this statistic was then estimated by permuting ASD gene ranks one million times and calculating the fraction of times the permuted statistic was greater than or equal to the observed one.
Developmental expression of autism-associated genes in the brain
Defining spatiotemporal expression signatures
The spatiotemporal developmental gene-expression data for the human brain was obtained from Brainspan29. Raw data from this study were downloaded from NCBI GEO60 accession code GSE25219. CEL files were background corrected, normalized, and summarized using RMA61 based on a custom CDF62, and expression levels for each gene were averaged across replicates. Further analysis was restricted to 13 stages from early fetal (10–13 weeks postconception) to late adulthood (≥60 years) that contained expression data for all 16 brain regions. We first established a gene-expression signature for each of the 208 spatiotemporal windows (combination of 16 regions and 13 stages) specific to that window with respect to other stages as well as other regions. For example, a signature for the striatum (region) at the late midfetal stage was calculated in three steps.
- For each gene i, two modified z-scores were calculated by comparing , the gene’s expression in that region (striatum) and stage (late-midfetal), to the distribution of its expression values across all regions at late-midfetal stage (to get ) and across all stages of striatum (to get ).
where and , respectively, are the median expression levels of gene i across all regions at late-midfetal stage and all stages of striatum; and are the corresponding median absolute deviations (MAD). Since median and MAD are stable measures of central tendency and variance of a distribution without being influenced by outliers, scaling using these measures aids in identifying expression values that are particularly high. - These two z-scores were then combined into a meta z-score that tends to be high when the expression of the gene deviates substantially from its nominal expression along both the spatial and temporal axes.
Finally, the set of genes with were used as the gene-expression signature (of late midfetal striatum, in this example).
We employed this procedure to compute a signature for all 208 combinations of regions and stages.
Rank-based enrichment test of spatiotemporal signatures
This test was very similar to the rank-based test detailed above. For each signature, a test statistic equal to the mean exponential rank-based autism-association scores (si, described above) of genes in that signature was calculated. Mean scores based on random signatures of the same size sampled from the union of all genes in all signatures were then used to set up an empirical distribution. A P-value for the signature was ultimately calculated as the fraction of permuted mean scores that were equal to or greater than the observed mean score for the real signature. We carried out this test for all 208 region-stage combinations and corrected for multiple tests using the Benjamini–Hochberg correction63 to get Q-values.
Clustering the autism-associated brain network
In order to identify autism-associated functional modules in the brain, we created a subset of the brain-specific functional network containing the top 2,500 autism-associated genes from our genome-wide ranking and all the edges between them. Then, we used an approach based on shared k-nearest-neighbors (SKNN) and the Louvain community-finding algorithm64 to cluster the network into distinct modules of tightly connected genes. The SKNN-based strategy has the advantages of alleviating the effect of high-degree genes and accentuating local network structure by connecting genes that are likely to be functionally clustered together. Given a graph G with V nodes (genes) and E edges, with each edge between genes i and j associated with a weight pij, this technique proceeds as follows: (i) calculate a new weight for the edge between each pair of nodes i and j that is equal to the number of k nearest neighbors (based on the original weights pij) shared by i and j; (ii) choose the top 5% of the edges based on the new edge weights, and apply a graph clustering algorithm. This approach has two key desirable characteristics: (i) choosing the highest k values instead of all edges deemphasizes high-degree ‘hub’ nodes and brings equal attention to highly specific edges between low-degree nodes; and (ii) emphasizing local network-structure by connecting nodes that share a number of local neighbors automatically links genes that are highly likely to be part of the same cluster. We used a k of 50 to obtain the shared-nearest-neighbor autism-associated brain network and used the Louvain algorithm to cluster this network into distinct modules. We confirmed that the node membership and cluster sizes are robust by testing a range of values for k from 10 to 100. To stabilize clustering across different runs of the Louvain algorithm, we ran the algorithm 100 times and calculated cluster comembership scores for each pair of genes that was equal to the fraction of times (out of 100) the pair was assigned to the same cluster. These comembership scores were used to layout the network in Figure 4 (using Cytoscape65), which represents all clusters that contained at least 10 genes, defined by a comembership score ≥ 0.9. We confirmed the statistical significance of this score using a permutation test, randomizing the k-nearest neighbors of each node in the network of top ASD-associated genes and redoing the clustering procedure (Supplementary Fig. 10).
One-sided Fisher’s exact tests were used to find GO biological processes66 enriched in each cluster. Benjamini–Hochberg corrections were used to correct for multiple tests, and GO terms with Q ≤ 0.1 were deemed significant. The entire table of enriched GO terms is provided in Supplementary Table 6.
Prioritizing genes in autism-associated CNVs
We selected the eight most statistically significant and frequent autism-associated CNVs50 and obtained the genes in the intervals from UCSC67. An expert independently annotated genes in each interval with genetic or functional evidence for association with autism from existing literature. Genetic evidence refers to direct genetic evidence implicating a gene in autism or a related disorder (for example, schizophrenia or epilepsy). Functional evidence refers to the annotation of a gene to a function, process or pathway involved in autism, but without direct genetic evidence.
Identification of CNV-specific intermediate genes
The goal here was to identify key genes and the related cellular functions that may be deregulated by each CNV by tracing a biomolecular path from the CNV to the molecular phenotype of autism. We first marked the most autism-associated genes in each CNV as those within the top 10% of our genome-wide autism-associated gene ranking. Then, we defined the 19 E1 (high-confidence) genes as the core genes representing the molecular phenotype of autism. Taking advantage of the underlying brain-specific network, for each CNV, we calculated the betweenness centrality (BC) of each network gene as the fraction of shortest paths from the top-ranked CNV genes to the core autism-associated genes that also pass through that gene. The brain network was prefiltered to contain only around top 1% of its edges, and path length was calculated as the reciprocal of the functional linkage score. Genes with high BC are molecular mediators between the CNV and autism. We identified genes with high BCs that were also specific to a given CNV (with T total genes and t top-ranked genes) by keeping the core autism-associated genes constant and repeating the BC calculation for random set of t genes from random genomic intervals with T genes. Finally, a permutation-based P-value was computed for each network gene as the fraction of times that gene’s BC with random intervals was equal to or greater than the gene’s BC with the real CNV (n = 100,000). Upon Benjamini-Hochberg correction for testing the BC of thousands of genes, those with Q ≤ 0.1 were identified as mediator genes specific to the given CNV.
Text mining for autism-associated processes
We queried all available PubMed abstracts from 2000 to May 2015 for (autism OR ASD OR autistic), and retrieved these autism-associated abstracts. GO biological processes terms were mapped to each abstract using simple text search, and a given term was considered associated with autism if it was found in at least two abstracts.
Functional impact of multiple CNVs
The next goal was to use the CNV-specific mediator genes to determine cellular functions that are likely deregulated by multiple CNVs. For this, we used Fisher’s exact test to find sets of genes annotated to autism-associated GO biological processes that overlapped significantly with the CNV-specific mediator gene set. Processes and pathways that were significantly associated (Q ≤ 0.05) with two or more CNVs and annotated to at least two mediator genes were analyzed further and were summarized to general terms based on gene overlap, term description and their relationships in the ontology.
Identification of MAZ targets
Computationally predicted targets were generated by using FIMO68 to map the binding site of MAZ (obtained from HOCOMOCO69) to the 1,000-bp upstream regions of all the genes in the genome. 2,446 genes with matches of at Q ≤ 0.01 were selected as potential targets of MAZ. Enrichment analysis for MAZ targets against the autism-associated gene predictions was applied using one-sided Fisher’s exact test against the top 2,500 ranked gene predictions (top decile).
ASD webserver
The web interface is implemented using the D3 library70 for visualization, which enables use on any modern web browser without plugin installation.
Probability estimates for predicted autism-related genes
We estimated prior probabilities for several biological pathways and gene sets known to be enriched for autism-associated genes by calculating the fraction of genes with de novo LGD mutations occurring in quad family probands over all de novo LGDs. These pathways and sets include CHD8 targets, chromatin remodeling genes, FMRP targets, MAPK pathway genes, post-synaptic density genes, TOP1 targets and Wnt-β-catenin pathway genes.
To improve interpretability for our autism-associated gene predictions, we calibrated the SVM scores using isotonic regression. Isotonic regression, or monotonic regression, minimizes the same condition as a least-squares regression while imposing a monotonicity constraint (i.e., if gene A has a higher rank in original predictions than gene B, isotonic regression enforces that the fitted probability estimate for gene A will also be higher than that of gene B), and it has been previously shown to have more power when sufficient data is available71. The response variable (probability of a gene being autism-related) was estimated based on the gene’s enrichment among the SSC proband LGDs. To prevent overfitting in our probability estimation, we used ten-fold cross validation to find the ‘knots’ for the regression results of each held-out fold. We fit an isotonic regression curve through all knots, with Hermite spline interpolation between knots, and provide the resulting estimated probabilities on the web interface.
Permutation-based P-values and Q-values for our genome-wide predictions
In order to improve the interpretability of our genome-wide ranking, we calculated a permutation-based P-value and a corresponding Q-value for each gene (Supplementary Table 3), and provide these in our ASD web-server. We permuted labels of gold standards and retrained the model 1,000 times. P-values were calculated as the probability of the gene being predicted to be as extreme as it is (considering both ‘highly ASD-associated’ and ‘highly non-ASD associated’, n = 1,000), and were corrected to Q-values by the Benjamini–Hochberg method63.
Webserver updates
We will keep the ASD gene predictions on our web server updated for the community. As the set of annotated ASD candidate genes increases, we will retrain our model with the most up-to-date ASD candidate gene collection. As of this writing (July 2016) we have retrained our model with the entire collection of known ASD genes up to October 2015 (with the same gene evidence weighting criteria), and those predictions are available at http://asd.princeton.edu/v2.
Code availability
Software to perform disease-gene prediction using the brain-specific network with user-defined gold standards is available at http://asd.princeton.edu. Additional software used to build the brain-specific network is available at http://libsleipnir.bitbucket.org.
Data availability
All data supporting the findings of this study are available within the article, its supplementary information files, and at http://asd.princeton.edu. Additional information about data sets used to build the brain-specific network is available at http://giant.princeton.edu.
Supplementary Material
Acknowledgments
We are grateful to all of the families at the participating Simons Simplex Collection (SSC) sites, as well as the SSC principal investigators. We thank all members of the Troyanskaya lab for valuable discussions. We thank J. Spiro and other members of the Simons Foundation for constant feedback on the work and manuscript. This work was primarily supported by US National Institutes of Health (NIH) grants R01 GM071966 and R01 HG005998 to O.G.T. V.Y. was supported in part by US NIH grant T32 HG003284. This work was supported in part by US NIH grant P50 GM071508. O.G.T. is a senior fellow of the Genetic Networks program of the Canadian Institute for Advanced Research (CIFAR).
Footnotes
Note: Any Supplementary Information and Source Data files are available in the online version of the paper.
AUTHOR CONTRIBUTIONS
A.K., R.Z., A.L. and O.G.T. conceived and designed the research. A.K. and R.Z. performed computational analyses with contributions from A.L., V.Y., A.K.W. and C.L.T. N.V. provided data. A.T. developed the web interface with contributions from A.K.W., A.K. and R.Z. A.K., R.Z., A.L., A.P. and O.G.T. wrote the manuscript with inputs from V.Y. and C.L.T., and all authors contributed to revisions. A.K. and R.Z. are co-first authors and are listed alphabetically.
COMPETING FINANCIAL INTERESTS
The authors declare no competing financial interests.
A Supplementary Methods checklist is available.
References
- 1.Winter EE, Goodstadt L, Ponting CP. Elevated rates of protein secretion, evolution, and disease among tissue-specific genes. Genome Res. 2004;14:54–61. doi: 10.1101/gr.1924004. [DOI] [PMC free article] [PubMed] [Google Scholar]
- 2.Goh KI, et al. The human disease network. Proc Natl Acad Sci USA. 2007;104:8685–8690. doi: 10.1073/pnas.0701361104. [DOI] [PMC free article] [PubMed] [Google Scholar]
- 3.Sanders SJ, et al. De novo mutations revealed by whole-exome sequencing are strongly associated with autism. Nature. 2012;485:237–241. doi: 10.1038/nature10945. [DOI] [PMC free article] [PubMed] [Google Scholar]
- 4.O’Roak BJ, et al. Sporadic autism exomes reveal a highly interconnected protein network of de novo mutations. Nature. 2012;485:246–250. doi: 10.1038/nature10989. [DOI] [PMC free article] [PubMed] [Google Scholar]
- 5.Neale BM, et al. Patterns and rates of exonic de novo mutations in autism spectrum disorders. Nature. 2012;485:242–245. doi: 10.1038/nature11011. [DOI] [PMC free article] [PubMed] [Google Scholar]
- 6.Iossifov I, et al. De novo gene disruptions in children on the autistic spectrum. Neuron. 2012;74:285–299. doi: 10.1016/j.neuron.2012.04.009. [DOI] [PMC free article] [PubMed] [Google Scholar]
- 7.Iossifov I, et al. The contribution of de novo coding mutations to autism spectrum disorder. Nature. 2014;515:216–221. doi: 10.1038/nature13908. [DOI] [PMC free article] [PubMed] [Google Scholar]
- 8.De Rubeis S, et al. Synaptic, transcriptional and chromatin genes disrupted in autism. Nature. 2014;515:209–215. doi: 10.1038/nature13772. [DOI] [PMC free article] [PubMed] [Google Scholar]
- 9.Sanders SJ, et al. Insights into autism spectrum disorder genomic architecture and biology from 71 risk loci. Neuron. 2015;87:1215–1233. doi: 10.1016/j.neuron.2015.09.016. [DOI] [PMC free article] [PubMed] [Google Scholar]
- 10.Ronemus M, Iossifov I, Levy D, Wigler M. The role of de novo mutations in the genetics of autism spectrum disorders. Nat Rev Genet. 2014;15:133–141. doi: 10.1038/nrg3585. [DOI] [PubMed] [Google Scholar]
- 11.He X, et al. Integrated model of de novo and inherited genetic variants yields greater power to identify risk genes. PLoS Genet. 2013;9:e1003671. doi: 10.1371/journal.pgen.1003671. [DOI] [PMC free article] [PubMed] [Google Scholar]
- 12.Gilman SR, et al. Rare de novo variants associated with autism implicate a large functional network of genes involved in formation and function of synapses. Neuron. 2011;70:898–907. doi: 10.1016/j.neuron.2011.05.021. [DOI] [PMC free article] [PubMed] [Google Scholar]
- 13.Lee TLL, Raygada MJ, Rennert OM. Integrative gene network analysis provides novel regulatory relationships, genetic contributions and susceptible targets in autism spectrum disorders. Gene. 2012;496:88–96. doi: 10.1016/j.gene.2012.01.020. [DOI] [PMC free article] [PubMed] [Google Scholar]
- 14.Kou Y, Betancur C, Xu H, Buxbaum JD, Ma’ayan A. Network- and attribute-based classifiers can prioritize genes and pathways for autism spectrum disorders and intellectual disability. Am J Med Genet C Semin Med Genet. 2012;160C:130–142. doi: 10.1002/ajmg.c.31330. [DOI] [PMC free article] [PubMed] [Google Scholar]
- 15.Ben-David E, Shifman S. Combined analysis of exome sequencing points toward a major role for transcription regulation during brain development in autism. Mol Psychiatry. 2013;18:1054–1056. doi: 10.1038/mp.2012.148. [DOI] [PubMed] [Google Scholar]
- 16.Parikshak NN, et al. Integrative functional genomic analyses implicate specific molecular pathways and circuits in autism. Cell. 2013;155:1008–1021. doi: 10.1016/j.cell.2013.10.031. [DOI] [PMC free article] [PubMed] [Google Scholar]
- 17.Li J, et al. Integrated systems analysis reveals a molecular network underlying autism spectrum disorders. Mol Syst Biol. 2014;10:774. doi: 10.15252/msb.20145487. [DOI] [PMC free article] [PubMed] [Google Scholar]
- 18.Chang J, Gilman SR, Chiang AH, Sanders SJ, Vitkup D. Genotype to phenotype relationships in autism spectrum disorders. Nat Neurosci. 2015;18:191–198. doi: 10.1038/nn.3907. [DOI] [PMC free article] [PubMed] [Google Scholar]
- 19.Hormozdiari F, Penn O, Borenstein E, Eichler EE. The discovery of integrated gene networks for autism and related disorders. Genome Res. 2015;25:142–154. doi: 10.1101/gr.178855.114. [DOI] [PMC free article] [PubMed] [Google Scholar]
- 20.Liu L, Lei J, Roeder K. Network assisted analysis to reveal the genetic basis of autism. Ann Appl Stat. 2015;9:1571–1600. doi: 10.1214/15-AOAS844. [DOI] [PMC free article] [PubMed] [Google Scholar]
- 21.Greene CS, et al. Understanding multicellular function and disease with human tissue-specific networks. Nat Genet. 2015;47:569–576. doi: 10.1038/ng.3259. [DOI] [PMC free article] [PubMed] [Google Scholar]
- 22.Darnell JC, et al. FMRP stalls ribosomal translocation on mRNAs linked to synaptic function and autism. Cell. 2011;146:247–261. doi: 10.1016/j.cell.2011.06.013. [DOI] [PMC free article] [PubMed] [Google Scholar]
- 23.King IF, et al. Topoisomerases facilitate transcription of long genes linked to autism. Nature. 2013;501:58–62. doi: 10.1038/nature12504. [DOI] [PMC free article] [PubMed] [Google Scholar]
- 24.Cotney J, et al. The autism-associated chromatin modifier CHD8 regulates other autism risk genes during human neurodevelopment. Nat Commun. 2015;6:6404. doi: 10.1038/ncomms7404. [DOI] [PMC free article] [PubMed] [Google Scholar]
- 25.Pinto D, et al. Convergence of genes and cellular pathways dysregulated in autism spectrum disorders. Am J Hum Genet. 2014;94:677–694. doi: 10.1016/j.ajhg.2014.03.018. [DOI] [PMC free article] [PubMed] [Google Scholar]
- 26.Bayes A, et al. Characterization of the proteome, diseases and evolution of the human postsynaptic density. Nat Neurosci. 2011;14:19–21. doi: 10.1038/nn.2719. [DOI] [PMC free article] [PubMed] [Google Scholar]
- 27.Corominas R, et al. Protein interaction network of alternatively spliced isoforms from brain links genetic risk factors for autism. Nat Commun. 2014;5:3650. doi: 10.1038/ncomms4650. [DOI] [PMC free article] [PubMed] [Google Scholar]
- 28.Iossifov I, et al. Low load for disruptive mutations in autism genes and their biased transmission. Proc Natl Acad Sci USA. 2015;112:E5600–E5607. doi: 10.1073/pnas.1516376112. [DOI] [PMC free article] [PubMed] [Google Scholar]
- 29.Kang HJ, et al. Spatio-temporal transcriptome of the human brain. Nature. 2011;478:483–489. doi: 10.1038/nature10523. [DOI] [PMC free article] [PubMed] [Google Scholar]
- 30.Willsey AJ, et al. Coexpression networks implicate human midfetal deep cortical projection neurons in the pathogenesis of autism. Cell. 2013;155:997–1007. doi: 10.1016/j.cell.2013.10.020. [DOI] [PMC free article] [PubMed] [Google Scholar]
- 31.Uddin M, et al. Brain-expressed exons under purifying selection are enriched for de novo mutations in autism spectrum disorder. Nat Genet. 2014;46:742–747. doi: 10.1038/ng.2980. [DOI] [PubMed] [Google Scholar]
- 32.Stoner R, et al. Patches of disorganization in the neocortex of children with autism. N Engl J Med. 2014;370:1209–1219. doi: 10.1056/NEJMoa1307491. [DOI] [PMC free article] [PubMed] [Google Scholar]
- 33.Haar S, Berman S, Behrmann M, Dinstein I. Anatomical abnormalities in autism? Cereb Cortex. 2016;4:1440–1452. doi: 10.1093/cercor/bhu242. [DOI] [PubMed] [Google Scholar]
- 34.Dinstein I, Heeger DJ, Behrmann M. Neural variability: friend or foe? Trends Cogn Sci. 2015;19:322–328. doi: 10.1016/j.tics.2015.04.005. [DOI] [PubMed] [Google Scholar]
- 35.Wang SSH, Kloth AD, Badura A. The cerebellum, sensitive periods, and autism. Neuron. 2014;83:518–532. doi: 10.1016/j.neuron.2014.07.016. [DOI] [PMC free article] [PubMed] [Google Scholar]
- 36.Peça J, et al. Shank3 mutant mice display autistic-like behaviours and striatal dysfunction. Nature. 2011;472:437–442. doi: 10.1038/nature09965. [DOI] [PMC free article] [PubMed] [Google Scholar]
- 37.Di Martino A, et al. The autism brain imaging data exchange: towards a large-scale evaluation of the intrinsic brain architecture in autism. Mol Psychiatry. 2014;19:659–667. doi: 10.1038/mp.2013.78. [DOI] [PMC free article] [PubMed] [Google Scholar]
- 38.Goldberg DS, Roth FP. Assessing experimentally derived interactions in a small world. Proc Natl Acad Sci USA. 2003;100:4372–4376. doi: 10.1073/pnas.0735871100. [DOI] [PMC free article] [PubMed] [Google Scholar]
- 39.Voineagu I, et al. Transcriptomic analysis of autistic brain reveals convergent molecular pathology. Nature. 2011;474:380–384. doi: 10.1038/nature10110. [DOI] [PMC free article] [PubMed] [Google Scholar]
- 40.Masi A, et al. Cytokine aberrations in autism spectrum disorder: a systematic review and meta-analysis. Mol Psychiatry. 2015;20:440–446. doi: 10.1038/mp.2014.59. [DOI] [PubMed] [Google Scholar]
- 41.Bresnahan M, et al. Association of maternal report of infant and toddler gastrointestinal symptoms with autism: evidence from a prospective birth cohort. JAMA Psychiatry. 2015;72:466–474. doi: 10.1001/jamapsychiatry.2014.3034. [DOI] [PMC free article] [PubMed] [Google Scholar]
- 42.Hazen EP, Stornelli JL, O’Rourke JA, Koesterer K, McDougle CJ. Sensory symptoms in autism spectrum disorders. Harv Rev Psychiatry. 2014;22:112–124. doi: 10.1097/01.HRP.0000445143.08773.58. [DOI] [PubMed] [Google Scholar]
- 43.Cohen S, Conduit R, Lockley SW, Rajaratnam SM, Cornish KM. The relationship between sleep and behavior in autism spectrum disorder (ASD): a review. J Neurodev Disord. 2014;6:44. doi: 10.1186/1866-1955-6-44. [DOI] [PMC free article] [PubMed] [Google Scholar]
- 44.Takahashi T, et al. Rosbin: a novel homeobox-like protein gene expressed exclusively in round spermatids. Biol Reprod. 2004;70:1485–1492. doi: 10.1095/biolreprod.103.026096. [DOI] [PubMed] [Google Scholar]
- 45.Weiss LA, et al. Association between microdeletion and microduplication at 16p11.2 and autism. N Engl J Med. 2008;358:667–675. doi: 10.1056/NEJMoa075974. [DOI] [PubMed] [Google Scholar]
- 46.Lin GN, et al. Spatiotemporal 16p11.2 protein network implicates cortical late mid-fetal brain development and KCTD13-Cul3-RhoA pathway in psychiatric diseases. Neuron. 2015;85:742–754. doi: 10.1016/j.neuron.2015.01.010. [DOI] [PMC free article] [PubMed] [Google Scholar]
- 47.Martin-Granados C, Philp A, Oxenham SK, Prescott AR, Cohen PTW. Depletion of protein phosphatase 4 in human cells reveals essential roles in centrosome maturation, cell migration and the regulation of Rho GTPases. Int J Biochem Cell Biol. 2008;40:2315–2332. doi: 10.1016/j.biocel.2008.03.021. [DOI] [PubMed] [Google Scholar]
- 48.Vanunu O, Magger O, Ruppin I, Shlomi T, Sharan R. Associating genes and protein complexes with disease via network propagation. PLoS Comput Biol. 2010;6:e1000641. doi: 10.1371/journal.pcbi.1000641. [DOI] [PMC free article] [PubMed] [Google Scholar]
- 49.Hus V, Gotham K, Lord C. Standardizing ADOS domain scores: separating severity of social affect and restricted and repetitive behaviors. J Autism Dev Disord. 2014;44:2400–2412. doi: 10.1007/s10803-012-1719-1. [DOI] [PMC free article] [PubMed] [Google Scholar]
- 50.Moreno-De-Luca D, et al. Using large clinical data sets to infer pathogenicity for rare copy number variants in autism cohorts. Mol Psychiatry. 2013;18:1090–1095. doi: 10.1038/mp.2012.138. [DOI] [PMC free article] [PubMed] [Google Scholar]
- 51.Abrahams BS, et al. SFARI Gene 2.0: a community-driven knowledgebase for the autism spectrum disorders (ASDs) Mol Autism. 2013;4:36. doi: 10.1186/2040-2392-4-36. [DOI] [PMC free article] [PubMed] [Google Scholar]
- 52.Hamosh A, Scott AF, Amberger JS, Bocchini CA, McKusick VA. Online Mendelian Inheritance in Man (OMIM), a knowledgebase of human genes and genetic disorders. Nucleic Acids Res. 2005;33:D514–D517. doi: 10.1093/nar/gki033. [DOI] [PMC free article] [PubMed] [Google Scholar]
- 53.Yu W, Gwinn M, Clyne M, Yesupriya A, Khoury MJ. A navigator for human genome epidemiology. Nat Genet. 2008;40:124–125. doi: 10.1038/ng0208-124. [DOI] [PubMed] [Google Scholar]
- 54.Becker KG, Barnes KC, Bright TJ, Wang SA. The genetic association database. Nat Genet. 2004;36:431–432. doi: 10.1038/ng0504-431. [DOI] [PubMed] [Google Scholar]
- 55.Peng K, et al. The Disease and Gene Annotations (DGA): an annotation resource for human disease. Nucleic Acids Res. 2013;41:D553–D560. doi: 10.1093/nar/gks1244. [DOI] [PMC free article] [PubMed] [Google Scholar]
- 56.Fan R, Wang X, Lin C. LIBLINEAR: a library for large linear classification. J Machine Learning Res. 2008;9:1871–1874. [Google Scholar]
- 57.Fischbach GD, Lord C. The Simons Simplex Collection: a resource for identification of autism genetic risk factors. Neuron. 2010;68:192–195. doi: 10.1016/j.neuron.2010.10.006. [DOI] [PubMed] [Google Scholar]
- 58.Petrovski S, Wang Q, Heinzen EL, Allen AS, Goldstein DB. Genic intolerance to functional variation and the interpretation of personal genomes. PLoS Genet. 2013;9:e1003709. doi: 10.1371/journal.pgen.1003709. [DOI] [PMC free article] [PubMed] [Google Scholar]
- 59.Samocha KE, et al. A framework for the interpretation of de novo mutation in human disease. Nat Genet. 2014;46:944–950. doi: 10.1038/ng.3050. [DOI] [PMC free article] [PubMed] [Google Scholar]
- 60.Barrett T, et al. NCBI GEO: archive for functional genomics data sets–update. Nucleic Acids Res. 2013;41:D991–D995. doi: 10.1093/nar/gks1193. [DOI] [PMC free article] [PubMed] [Google Scholar]
- 61.Bolstad BM, Irizarry RA, Astrand M, Speed TP. A comparison of normalization methods for high density oligonucleotide array data based on variance and bias. Bioinformatics. 2003;19:185–193. doi: 10.1093/bioinformatics/19.2.185. [DOI] [PubMed] [Google Scholar]
- 62.Dai M, et al. Evolving gene/transcript definitions significantly alter the interpretation of GeneChip data. Nucleic Acids Res. 2005;33:e175. doi: 10.1093/nar/gni179. [DOI] [PMC free article] [PubMed] [Google Scholar]
- 63.Benjamini Y, Hochberg Y. Controlling the false discovery rate: a practical and powerful approach to multiple testing. J R Stat Soc B. 1995;57:289–300. [Google Scholar]
- 64.Blondel VD, Guillaume JL, Lambiotte R, Lefebvre E. Fast unfolding of communities in large networks. J Stat Mech Theory Exp. 2008;2008:P10008. [Google Scholar]
- 65.Shannon P, et al. Cytoscape: a software environment for integrated models of biomolecular interaction networks. Genome Res. 2003;13:2498–2504. doi: 10.1101/gr.1239303. [DOI] [PMC free article] [PubMed] [Google Scholar]
- 66.Gene Ontology Consortium. The Gene Ontology: enhancements for 2011. Nucleic Acids Res. 2012;40:D559–D564. doi: 10.1093/nar/gkr1028. [DOI] [PMC free article] [PubMed] [Google Scholar]
- 67.Kent WJ, et al. The human genome browser at UCSC. Genome Res. 2002;12:996–1006. doi: 10.1101/gr.229102. [DOI] [PMC free article] [PubMed] [Google Scholar]
- 68.Grant CE, Bailey TL, Noble WS. FIMO: scanning for occurrences of a given motif. Bioinformatics. 2011;27:1017–1018. doi: 10.1093/bioinformatics/btr064. [DOI] [PMC free article] [PubMed] [Google Scholar]
- 69.Kulakovskiy IV, et al. HOCOMOCO: a comprehensive collection of human transcription factor binding sites models. Nucleic Acids Res. 2013;41:D195–D202. doi: 10.1093/nar/gks1089. [DOI] [PMC free article] [PubMed] [Google Scholar]
- 70.Bostock M, Ogievetsky V, Heer J. D3: data-driven documents. IEEE Trans Vis Comput Graph. 2011;17:2301–2309. doi: 10.1109/TVCG.2011.185. [DOI] [PubMed] [Google Scholar]
- 71.Niculescu-Mizil A, Caruana R. Proc 22nd Internat Conf Machine Learning. ACM Press; 2005. Predicting good probabilities with supervised learning; pp. 625–632. [Google Scholar]
Associated Data
This section collects any data citations, data availability statements, or supplementary materials included in this article.
Supplementary Materials
Data Availability Statement
All data supporting the findings of this study are available within the article, its supplementary information files, and at http://asd.princeton.edu. Additional information about data sets used to build the brain-specific network is available at http://giant.princeton.edu.