

Abstract
Context:
Chronic periodontitis (CP) and diabetes mellitus are associated with increased oxidative damage to DNA with formation of 8-hydroxydeoxyguanosine (8-OHdG). The aim of this study was to evaluate the change in gingival crevicular fluid (GCF) levels of 8-OHdG and glycosylated hemoglobin (HbA1c) by 3 months after scaling and root planing (SRP), in CP patients with and without Type II diabetes mellitus.
Settings and Design:
Sixteen patients with CP, 16 patients with CP and Type II diabetes mellitus (CP-D), and 16 systemically healthy individuals with clinically healthy periodontium who served as controls were included in the study.
Materials and Methods:
The clinical parameters (plaque index [PI], probing depth [PD], clinical attachment level [CAL], and bleeding on probing [BOP%]), HbA1c levels, and GCF 8-OHdG levels were measured at baseline. All the patients except controls were treated with SRP followed by evaluation of the above-mentioned clinical and biochemical parameters after 3 months.
Statistical Analysis Used:
Statistical analysis was performed using paired t-test, independent t-test, and Mann–Whitney U-test.
Results:
After SRP, CP-D group showed a greater reduction in PI, PD, BOP%, and greater gain in CAL when compared to CP patients (P < 0.05). Levels of 8-OHdG and HbA1c in CP-D patients also showed a greater reduction, 3 months after SRP when compared to CP patients (P < 0.05).
Conclusions:
GCF 8-OHdG levels, HbA1c levels, and clinical parameters were reduced significantly in CP and CP-D patients, with maximum reduction achieved in CP-D patients 3 months after SRP.
Keywords: 8-hydroxydeoxyguanosine, chronic periodontitis, gingival crevicular fluid, glycosylated hemoglobin, scaling and root planning, Type II diabetes mellitus
INTRODUCTION
Chronic periodontitis (CP) refers to inflammation within the supporting tissues of the teeth leading to progressive attachment loss and bone loss.[1] The disease progression depends on interaction between the host and dental plaque. Host cells respond to dental plaque laden with microbes by both cellular and humoral defense mechanisms. In response to plaque, polymorphonuclear neutrophils produce increased amount of free radicals which can damage cell membranes and associated biomolecules.[2] Free radical-mediated chain reactions lead to peroxidation of polyunsaturated fatty acids present in biological membranes.
The highly reactive products of lipid peroxidation interact with proteins, RNA, and DNA.[3] 8-hydroxydeoxyguanosine (8-OHdG), a common product of oxidative DNA damage, has been shown to increase in body fluids and tissues of humans in various chronic diseases and also with increase in age and in obesity.[4] It is excreted in the oral fluids as a result of oxidative DNA damage in CP.[5] Type II diabetes mellitus is characterized by variable degrees of insulin resistance, impaired insulin secretion, and increased glucose production.[6] Production of reactive oxygen species and lipid peroxidation are increased in diabetic patients with poor glycemic control.[7]
Poorly controlled Type II diabetes mellitus patients demonstrated more oxidative DNA damage, with increase in 8-OHdG levels in oral fluids.[8] As oxidative damage had been implicated in Type II diabetes mellitus as well as periodontitis, we conducted a study to evaluate the effect of scaling and root planing on gingival crevicular fluid (GCF) 8-OHdG levels and glycosylated hemoglobin of CP patients with and without Type II Diabetes Mellitus.
Study design and patient selection
This study was conducted in the Department of Periodontics and Oral Implantology. Forty-eight patients with an age limit of 25–60 years were recruited for the study. The study population included 16 patients with CP, 16 patients with CP and Type II diabetes mellitus (CP-D), and 16 systemically healthy individuals with clinically healthy periodontium served as controls. All the patients except healthy controls were treated with full-mouth scaling and root planing followed by evaluation after 3 months. This clinical study followed the principles in the Declaration of Helsinki. The study was approved by the Institutional Review Board and Ethical Committee. Informed consent was obtained from each patient before enrolling them in the study.
MATERIALS AND METHODS
The subjects involved in this study had to satisfy the following criteria: control group: probing depth (PD) <4 mm, no bleeding on probing, no clinical attachment loss, and no systemic disease; CP patients: PD ≥5 mm, clinical attachment loss, radiographic evidence of alveolar bone loss; CP-D patients: PD ≥5 mm, clinical attachment loss and radiographic evidence of alveolar bone loss and under medication for Type II Diabetes Mellitus. Patients with a history of antibiotics, antioxidants, and anti-inflammatory drug intake for the past 3 months, who had undergone any form of periodontal therapy in past 6 months, history of smoking and alcohol consumption, pregnant and lactating women were excluded from the study.
On every examination, clinical parameters such as plaque index (PI), conventional PD, clinical attachment level (CAL), and bleeding on probing (BOP%) were scored.[9,10,11,12] The radiographic evidence of bone loss was determined if the distance from cementoenamel junction to the alveolar crest was >2 mm.[13] Glycosylated hemoglobin (HbA1c) levels were estimated in CP and CP-D patients using venous blood samples obtained from them.
Gingival crevicular fluid collection for 8-hydroxydeoxyguanosine estimation
GCF samples were obtained using microcapillary pipettes in the morning following an overnight fast of 8 h, during which patients were requested not to drink (except water) or eat.[14] GCF sample was collected from a site with maximum attachment loss for CP and CP-D groups and from a nondiseased site in healthy individuals.[15] After isolating the site with cotton rolls, plaque along with the supragingival calculus was removed using area-specific Gracey curette and cotton gauze, to avoid contamination and blocking of microcapillary pipette by plaque. The sulcular areas were gently air-dried. A color-coded, calibrated (1–10 μl) volumetric microcapillary pipette (Sigma-Aldrich co, St. Louis, USA)™ was placed at the entrance of the gingival crevice until a standardized volume of 2 μl of GCF was collected. The GCF samples which were contaminated with blood or saliva and air bubbles were discarded and fresh samples were collected. Each microcapillary pipette containing GCF was wrapped in aluminum foil and was placed inside separate sterile tubes and stored at −80°C in an ultralow-temperature freezer (Hera freeze −86°C basic upright freezers, Thermo Fisher Scientific India Pvt. td, Mumbai, India), until further analysis of 8-OHdG by ELISA.[16]
ELISA analysis for Gingival crevicular fluid samples
On the day of ELISA analysis, the GCF samples stored at −80°C were thawed to room temperature. The ELISA buffer was added to the NSB and B0 wells. The samples and the standards were added to the wells. One microliter of the GCF sample was transferred to 49 μl of ELISA buffer which was provided with the DNA/RNA Oxidative Damage ELISA kit (Cayman Chemical),™ by passing the plunger through the microcapillary pipettes. Wells of plates precoated with polyclonal antimouse IgG antibodies were used. The wells were designated as blank, NSB (nonspecific binding), B0 (maximum binding), TA (total activity) or standard (S1–S8), and samples. 8-OHdG AChE tracer (8-OHdG acetyl cholinesterase conjugate) was added to the wells except the blank and TA. Monoclonal antibody was added to appropriate wells except the blank, TA, and NSB wells. The plate was covered with an adhesive strip and incubated for 18 h at 4°C after mixing. Each well was aspirated and washed five times using an autowasher. After washing, 8-OHdG AChE tracer was added to the TA wells and Ellman's reagent (5,5’-dithiobis-[2-nitrobenzoic acid]) which contains the substrate to AChE, was added to each well, and the wells were placed at room temperature for 120 min. Finally, the optical densities were read at 405 nm by a microplate reader. Corrected B0 (B0 – NSB) was determined using the optical densities and calculated %B/B0 for each standard and samples. The samples were compared with the standards. The concentrations of 8-OHdG were expressed as picograms per milliliter (pg/ml).
Scaling and root planing
After collecting GCF, full-mouth scaling and root planing procedures were carried out under local anesthesia (2% lignocaine plus 1:80,000 adrenaline) with ultrasonic scaler (EMS SCALER) and Gracey curettes (Hu-Friedy) on the same day in CP and CP-D patients. Oral hygiene instructions were given to the patients and they were instructed to use 0.2% chlorhexidine mouthwash twice daily for 2 weeks. No analgesics were prescribed.
After 3 months, patients were reexamined to observe any changes in the clinical parameters. Estimation of HbA1c was also repeated in CP and CP-D groups. GCF samples were also collected from the same sites to observe any changes in the biochemical parameter that was measured earlier.
Statistical analysis
The sample size was calculated using the formula,
n = 2 × t2 × s2/d2
Where “n” is the minimum sample size required.
t = theoretical value of t distribution with 95% confidence.
s = pooled standard deviation equal from previous study.[16]
d = minimum expected difference in 8-OHdG levels between healthy and CP group from previous study.[16]
Fifteen is the minimum sample size in each group. Statistical analysis was performed using paired t-test, independent t-test, and Mann–Whitney U-test. The levels of 8-OHdG and clinical parameters (PI, PD, CAL, and BOP) in healthy, CP, and CP-D groups were analyzed at baseline and compared. At the recall visit, 3 months after scaling and root planing, the same comparison was performed for CP and CP-D groups. The levels of HbA1c were recorded and compared for CP and CP-D groups at baseline and after 3 months.
RESULTS
The mean age of the healthy controls, CP, and CP-D patients were 28.25 ± 3.907, 44.75 ± 9.989, and 48.812 ± 7.747 years, respectively [Table 1]. PI of healthy controls, CP, and CP-D patients were 0.287 ± 0.2486, 1.286 ± 0.4861, and 1.669 ± 0.375 at baseline and after SRP it significantly reduced to 0.825 ± 0.279 and 1.033 ± 0.264 in CP and CP-D groups, respectively (P < 0.05) [Table 2]. CP-D patients (0.635 ± 0.322) had a statistically significantly (P < 0.05) higher plaque score reduction when compared to CP group (0.460 ± 0.408) [Table 3 and Figure 1], with percentage difference being 7.8532 ± 26.5225 [Table 4]. The mean PD of healthy controls, CP, and CP-D patients were 2.000 ± 0.625 mm, 3.283 ± 0.554 mm, and 3.526 ± 0.625 mm, respectively, at baseline. Following SRP, the scores were reduced to 2.665 ± 0.581 mm and 2.816 ± 0.433 mm in CP and CP-D groups, respectively, which was statistically significant (P < 0.05) [Table 2]. CP-D group (0.710 ± 0.349 mm) had a statistically significant (P < 0.05) PD reduction when compared to CP group (0.617 ± 0.337 mm) [Table 3 and Figure 2], with percentage difference being 0.6428 ± 9.21722 [Table 4]. The CAL was recorded for all participants at baseline and after SRP in CP and CP-D groups, respectively. At baseline, the mean CAL of healthy controls, CP, and CP-D patients was 0.0 mm, 4.108 ± 0.955 mm, and 4.921 ± 0.881 mm, respectively. Following SRP, a significant gain in CAL was obtained in CP group (3.417 ± 1.0119 mm) and CP-D group (4.031 ± 0.878 mm) which was statistically significant (P < 0.05) [Table 2]. CP-D group (0.890 ± 0.334 mm) had a statistically significant (P < 0.05) CAL gain [Table 3] when compared to CP group (0.690 ± 0.475 mm) [Figure 3], with percentage difference being 1.2172 ± 9.40124 [Table 4]. The mean BOP% of Groups I, II, and III were 0, 65.171 ± 24.192, and 80.221% ± 15.722%, respectively, at baseline. Following SRP, BOP% in CP and CP-D groups were reduced to 39.644 ± 14.868% and 53.771 ± 12.515%, respectively, which was statistically significant (P < 0.05) [Table 2]. CP-D group (26.357 ± 11.264%) had a statistically significant (P < 0.05) reduction in BOP% when compared to CP group (25.526 ± 18.639%) [Table 3 and Figure 4], with percentage difference being 3.3956 ± 12.60363 [Table 4]. At baseline, the mean HbA1c levels of CP and CP-D groups were 5.475% ± 0.201% and 7.837% ± 1.405%, respectively [Table 2]. At the posttreatment visit, the values of HbA1c in CP and CP-D were reduced to 5.446 ± 0.1833% (P > 0.05) and 7.468% ± 0.864%, respectively, which was statistically significant (P < 0.05) [Table 2]. The reduction of HbA1c levels was greater and statistically significant in CP-D group (0.368 ± 1.0011%) when compared to CP group (0.0125 ± 0.233%) (P < 0.05) [Table 3 and Figure 5], with percentage difference being 3.5739 ± 6.22280 [Table 4]. At baseline, the mean 8-OHdG levels were 103.912 ± 88.577 pg/ml, 943.735 ± 606.725 pg/ml and 1639.856 ± 793.462 pg/ml for controls, CP, and CP-D groups, respectively [Table. 2]. Following SRP, 8-OHdG in CP and CP-D groups was reduced to 478.941 ± 317.809 pg/ml (P < 0.05) and 646.42 ± 313.808 pg/ml (P < 0.05), respectively, which was statistically significant [Table 2 and Figure 6]. The reduction being statistically higher (P < 0.05) in CP-D patients (993.436 ± 855.439 pg/ml) when compared to CP patients (464.793 ± 450.660 pg/ml) [Table 3 and Figure 6], with the percentage difference in reduction being 6.5002 ± 24.18549 [Table 4].
Table 1.
Mean age group of control, chronic periodontitis, and chronic periodontitis and type II diabetes mellitus patients
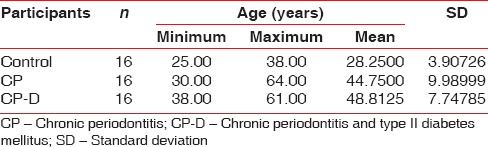
Table 2.
Comparison of control, chronic periodontitis, and chronic periodontitis and type II diabetes mellitus groups
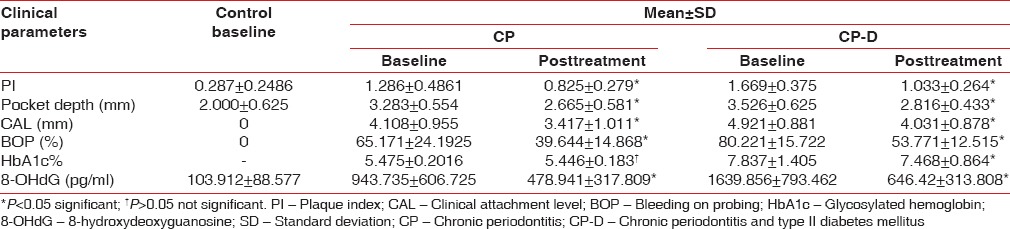
Table 3.
Mean reduction in all parameters at 3 months in chronic periodontitis and chronic periodontitis and type II diabetes mellitus group
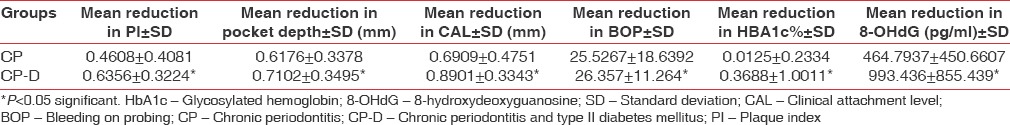
Figure 1.
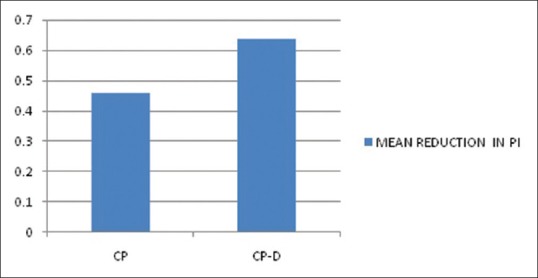
Mean reduction in plaque index
Table 4.
Intergroup difference in percentage reduction of parameters from baseline to 3rd month
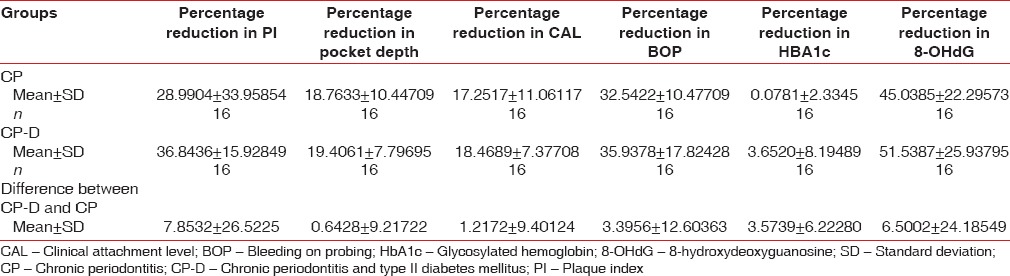
Figure 2.
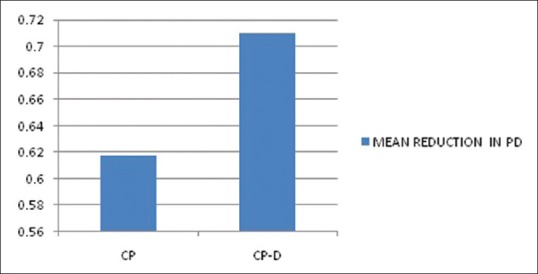
Mean reduction in probing depth
Figure 3.
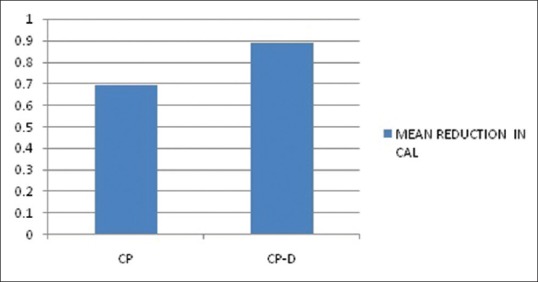
Mean reduction in clinical attachment level
Figure 4.
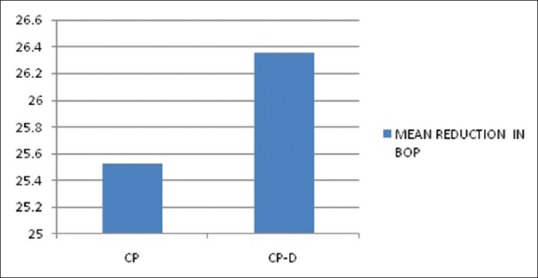
Mean reduction in bleeding on probing
Figure 5.
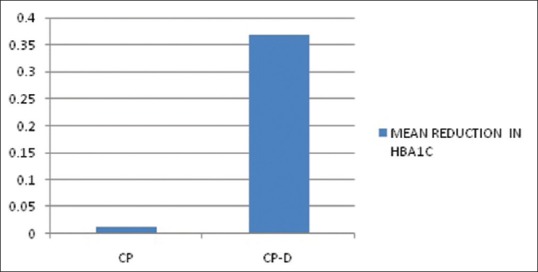
Mean reduction in glycosylated hemoglobin
Figure 6.
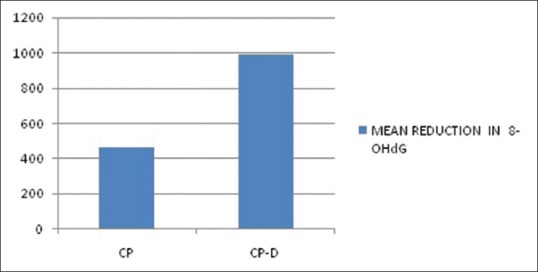
Mean reduction in 8-hydroxy-deoxyguanosine
DISCUSSION
Higher levels of 8-OHdG were detected in saliva and GCF of periodontitis patients.[5,15,16,17,18,19,20,21,22] Type II diabetes mellitus patients also displayed higher levels of 8-OHdG in various body fluids.[8,23,24,25] As none of the studies analyzed its level in GCF, we investigated the effect of SRP on GCF levels of 8-OHdG in CP patients with Type II diabetes mellitus.
In our study, all the clinical parameters and biochemical parameters such as 8-OHdG and HbA1c at baseline were significantly high in CP-D group followed by CP group with controls having the lowest level. Three months after SRP, the levels of 8-OHdG were reduced significantly in CP and CP-D groups (P < 0.05). Takane et al.[15] showed a significant reduction of 2.76 ng/ml in 8-OHdG levels of CP patients, 2–6 months after SRP. Dede et al.[16] also showed a significant reduction of 360 pg/ml in 8-OHdG levels of CP patients 3 months after SRP. Hendek et al.[22] also showed a significant reduction of 0.03 ng/ml in 8-OHdG levels of CP patients, 3 months after SRP. Chandra et al.[26] showed a significant reduction of 4.82 ng/ml in 8-OHdG levels of CP patients, 3 months after SRP. In this study, the reduction in 8-OHdG levels was significantly higher in CP-D group when compared to CP group (P < 0.05), with percentage difference being 6.5002% ± 24.1854%. HbA1c was estimated in CP and CP-D groups at baseline as well as 3 months after SRP. The results of our study showed a 0.3688 ± 1.0011% reduction in mean HbA1c levels in the CP-D group. Stewart et al.[27] also showed a significant reduction of 1.7% in mean HbA1c levels, 18 months after SRP in Americans. In a study by Kiran et al.[28] on Turkish population, a significant reduction of 0.8% in mean HbA1c levels was achieved, 3 months following SRP. Singh et al.[29] showed a significant reduction of 0.6% in mean HbA1c levels, 3 months after SRP in Indians. Koromantzos et al.[30] reported a significant reduction of 0.73% in mean HbA1c levels, 6 months after SRP in Greeks. In a randomized controlled trial by Moeintaghavi et al.[31] in Iranian population, a significant reduction of 0.74% in mean HbA1c levels was reported, 3 months after SRP. Acharya et al.[32] showed a significant reduction of 1.88% in mean HbA1c levels, 6 months after SRP in Indian population. Altamash et al.[33] also showed a significant reduction of 0.3% in mean HbA1c levels, 3 months after SRP. Reduction in HbA1c was observed in both CP and CP-D groups, with significant reduction occurring in CP-D group (P < 0.05) when compared to CP group, with percentage difference being 3.5739% ± 6.2228% in our study. Nishikawa et al.[24] demonstrated a reduction in serum 8-OHdG levels in Type II diabetic patients with good glycemic control. Karima et al.[34] demonstrated high oxidative stress in patients with poor glycemic control and reported a significant correlation between glycemic control (HbA1c levels) and the severity of periodontitis in diabetic patients reiterating the fact that enhanced oxidative stress and increased inflammation exacerbate both diseases.
In our study, with a significant decrease in clinical parameters and HbA1c, 8-OHdG levels also reduced significantly in the CP-D group when compared to CP group (P < 0.05). Improvement in glycemic status was seen 3 months after SRP which can be attributed to the reduction in inflammatory and oxidative stress after SRP. Reduction in HbA1c values in CP-D and CP patients was associated with a good improvement in periodontal status. This supports the fact that, with efficient control of inflammation and glycemic status, the damage caused by oxidative stress can be reduced. This is evident by the significant reduction of 8-OHdG levels in GCF of CP-D when compared to CP patients. This study thus supports the bi-directional relationship between glycemic status and periodontal status in diabetic patients.[35]
As this study was conducted in a single center with limited number of samples, multicentered longitudinal studies with large sample size are required to substantiate these results.
CONCLUSIONS
Within the limitations of this study, it can be concluded that the levels of 8-OHdG and the clinical parameters at baseline were higher in CP-D patients when compared to CP patients. Healthy controls had the least 8-OHdG levels and clinical parameters. Post-SRP, all the clinical parameters, 8-OHdG levels, and HbA1C levels were reduced significantly in both CP-D and CP patients, with maximum reduction being in CP-D patients.
8-OHdG can be used as a marker in GCF of CP-D patients, as we can measure the cumulative oxidative damage of Type-II diabetes as well as CP.
Financial support and sponsorship
Nil.
Conflicts of interest
There are no conflicts of interest.
REFERENCES
- 1.Flemmig TF. Periodontitis. Ann Periodontol. 1999;4:32–8. doi: 10.1902/annals.1999.4.1.32. [DOI] [PubMed] [Google Scholar]
- 2.Battino M, Bullon P, Wilson M, Newman H. Oxidative injury and inflammatory periodontal diseases: The challenge of anti-oxidants to free radicals and reactive oxygen species. Crit Rev Oral Biol Med. 1999;10:458–76. doi: 10.1177/10454411990100040301. [DOI] [PubMed] [Google Scholar]
- 3.Vaca CE, Harms-Ringdahl M. Interaction of lipid peroxidation products with nuclear macromolecules. Biochim Biophys Acta. 1989;1001:35–43. doi: 10.1016/0005-2760(89)90304-4. [DOI] [PubMed] [Google Scholar]
- 4.Kasai H. Analysis of a form of oxidative DNA damage, 8-hydroxy-2’-deoxyguanosine, as a marker of cellular oxidative stress during carcinogenesis. Mutat Res. 1997;387:147–63. doi: 10.1016/s1383-5742(97)00035-5. [DOI] [PubMed] [Google Scholar]
- 5.Sawamoto Y, Sugano N, Tanaka H, Ito K. Detection of periodontopathic bacteria and an oxidative stress marker in saliva from periodontitis patients. Oral Microbiol Immunol. 2005;20:216–20. doi: 10.1111/j.1399-302X.2005.00215.x. [DOI] [PubMed] [Google Scholar]
- 6.Powers AC. Diabetes Mellitus. In: Braunwald E, Fauci AS, Kasper DL, Hauser SL, Longo DL, Jameson JL, editors. Harrison's Internal Medicine. 15th ed. New York: Tata McGraw-Hill; 2001. pp. 2109–35. [Google Scholar]
- 7.Kitahara M, Eyre HJ, Lynch RE, Rallison ML, Hill HR. Metabolic activity of diabetic monocytes. Diabetes. 1980;29:251–6. doi: 10.2337/diab.29.4.251. [DOI] [PubMed] [Google Scholar]
- 8.Su H, Velly AM, Salah MH, Benarroch M, Trifiro M, Schipper HM, et al. Altered redox homeostasis in human diabetes saliva. J Oral Pathol Med. 2012;41:235–41. doi: 10.1111/j.1600-0714.2011.01092.x. [DOI] [PubMed] [Google Scholar]
- 9.Silness J, Loe H. Periodontal disease in pregnancy. II. Correlation between oral hygiene and periodontal condition. Acta Odontol Scand. 1964;22:121–35. doi: 10.3109/00016356408993968. [DOI] [PubMed] [Google Scholar]
- 10.Hill EG, Slate EH, Wiegand RE, Grossi SG, Salinas CF. Study design for calibration of clinical examiners measuring periodontal parameters. J Periodontol. 2006;77:1129–41. doi: 10.1902/jop.2006.050395. [DOI] [PubMed] [Google Scholar]
- 11.Pihlstrom BL. Measurement of attachment level in clinical trials: Probing methods. J Periodontol. 1992;63:1072–7. doi: 10.1902/jop.1992.63.12s.1072. [DOI] [PubMed] [Google Scholar]
- 12.Mombelli A, van Oosten MA, Schurch E, Jr, Land NP. The microbiota associated with successful or failing osseointegrated titanium implants. Oral Microbiol Immunol. 1987;2:145–51. doi: 10.1111/j.1399-302x.1987.tb00298.x. [DOI] [PubMed] [Google Scholar]
- 13.Källestål C, Matsson L. Criteria for assessment of interproximal bone loss on bite-wing radiographs in adolescents. J Clin Periodontol. 1989;16:300–4. doi: 10.1111/j.1600-051x.1989.tb01659.x. [DOI] [PubMed] [Google Scholar]
- 14.Kaslick RS, Chasens AI, Weinstein D, Waldman R. Ultra micro method for the collection of gingival fluid and quantitative analysis of its sodium content. J Dent Res. 1968;47:1192. doi: 10.1177/00220345680470063801. [DOI] [PubMed] [Google Scholar]
- 15.Takane M, Sugano N, Ezawa T, Uchiyama T, Ito K. A marker of oxidative stress in saliva: Association with periodontally-involved teeth of a hopeless prognosis. J Oral Sci. 2005;47:53–7. doi: 10.2334/josnusd.47.53. [DOI] [PubMed] [Google Scholar]
- 16.Dede FÖ, Ozden FO, Avcı B. 8-hydroxy-deoxyguanosine levels in gingival crevicular fluid and saliva in patients with chronic periodontitis after initial periodontal treatment. J Periodontol. 2013;84:821–8. doi: 10.1902/jop.2012.120195. [DOI] [PubMed] [Google Scholar]
- 17.Takane M, Sugano N, Iwasaki H, Iwano Y, Shimizu N, Ito K, et al. New biomarker evidence of oxidative DNA damage in whole saliva from clinically healthy and periodontally diseased individuals. J Periodontol. 2002;73:551–4. doi: 10.1902/jop.2002.73.5.551. [DOI] [PubMed] [Google Scholar]
- 18.Sugano N, Yokoyama K, Oshikawa M, Kumagai K, Takane M, Tanaka H, et al. Detection of Streptococcus anginosus and 8-hydroxydeoxyguanosine in saliva. J Oral Sci. 2003;45:181–4. doi: 10.2334/josnusd.45.181. [DOI] [PubMed] [Google Scholar]
- 19.Badea V, Balaban D, Amariei C, Nuca C, Bucur L. Salivary 8-hidroxy-2-deoxy guanosine as oxidative stress biomarker for the diagnosis of periodontal disease. Farmacia. 2010;58:600–10. [Google Scholar]
- 20.Kurgan Ş, Önder C, Altıngöz SM, Baǧış N, Uyanık M, Serdar MA, et al. High sensitivity detection of salivary 8-hydroxy deoxyguanosine levels in patients with chronic periodontitis. J Periodontal Res. 2015;50:766–74. doi: 10.1111/jre.12263. [DOI] [PubMed] [Google Scholar]
- 21.Arunachalam R, Reshma AP, Rajeev V, Kurra SB, Prince MR, Syam N. Salivary 8-Hydroxydeoxyguanosine – A valuable indicator for oxidative DNA damage in periodontal disease. Saudi J Dent Res. 2015;6:15–20. [Google Scholar]
- 22.Hendek MK, Erdemir EO, Kisa U, Ozcan G. Effect of initial periodontal therapy on oxidative stress markers in gingival crevicular fluid, saliva, and serum in smokers and non-smokers with chronic periodontitis. J Periodontol. 2015;86:273–82. doi: 10.1902/jop.2014.140338. [DOI] [PubMed] [Google Scholar]
- 23.Hinokio Y, Suzuki S, Hirai M, Chiba M, Hirai A, Toyota T, et al. Oxidative DNA damage in diabetes mellitus: Its association with diabetic complications. Diabetologia. 1999;42:995–8. doi: 10.1007/s001250051258. [DOI] [PubMed] [Google Scholar]
- 24.Nishikawa T, Sasahara T, Kiritoshi S, Sonoda K, Senokuchi T, Matsuo T, et al. Evaluation of urinary 8-hydroxydeoxy-guanosine as a novel biomarker of macrovascular complications in type 2 diabetes. Diabetes Care. 2003;26:1507–12. doi: 10.2337/diacare.26.5.1507. [DOI] [PubMed] [Google Scholar]
- 25.Pan HZ, Chang D, Feng LG, Xu FJ, Kuang HY, Lu MJ, et al. Oxidative damage to DNA and its relationship with diabetic complications. Biomed Environ Sci. 2007;20:160–3. [PubMed] [Google Scholar]
- 26.Chandra RV, Srinivas G, Reddy AA, Reddy BH, Reddy C, Nagarajan S, et al. Locally delivered antioxidant gel as an adjunct to nonsurgical therapy improves measures of oxidative stress and periodontal disease. J Periodontal Implant Sci. 2013;43:121–9. doi: 10.5051/jpis.2013.43.3.121. [DOI] [PMC free article] [PubMed] [Google Scholar]
- 27.Stewart JE, Wager KA, Friedlander AH, Zadeh HH. The effect of periodontal treatment on glycemic control in patients with type 2 diabetes mellitus. J Clin Periodontol. 2001;28:306–10. doi: 10.1034/j.1600-051x.2001.028004306.x. [DOI] [PubMed] [Google Scholar]
- 28.Kiran M, Arpak N, Unsal E, Erdoǧan MF. The effect of improved periodontal health on metabolic control in type 2 diabetes mellitus. J Clin Periodontol. 2005;32:266–72. doi: 10.1111/j.1600-051X.2005.00658.x. [DOI] [PubMed] [Google Scholar]
- 29.Singh S, Kumar V, Kumar S, Subbappa A. The effect of periodontal therapy on the improvement of glycemic control in patients with type 2 diabetes mellitus: A randomized controlled clinical trial. Int J Diabetes Dev Ctries. 2008;28:38–44. doi: 10.4103/0973-3930.43097. [DOI] [PMC free article] [PubMed] [Google Scholar]
- 30.Koromantzos PA, Makrilakis K, Dereka X, Katsilambros N, Vrotsos IA, Madianos PN, et al. A randomized, controlled trial on the effect of non-surgical periodontal therapy in patients with type 2 diabetes. Part I: Effect on periodontal status and glycemic control. J Clin Periodontol. 2011;38:142–7. doi: 10.1111/j.1600-051X.2010.01652.x. [DOI] [PubMed] [Google Scholar]
- 31.Moeintaghavi A, Arab HR, Bozorgnia Y, Kianoush K, Alizadeh M. Non-surgical periodontal therapy affects metabolic control in diabetics: A randomized controlled clinical trial. Aust Dent J. 2012;57:31–7. doi: 10.1111/j.1834-7819.2011.01652.x. [DOI] [PubMed] [Google Scholar]
- 32.Acharya AB, Thakur S, Muddapur MV. Effect of scaling and root planing on serum interleukin-10 levels and glycemic control in chronic periodontitis and type 2 diabetes mellitus. J Indian Soc Periodontol. 2015;19:188–93. doi: 10.4103/0972-124X.148644. [DOI] [PMC free article] [PubMed] [Google Scholar]
- 33.Altamash M, Klinge B, Engström PE. Periodontal treatment and HbA1c levels in subjects with diabetes mellitus. J Oral Rehabil. 2016;43:31–8. doi: 10.1111/joor.12339. [DOI] [PubMed] [Google Scholar]
- 34.Karima M, Kantarci A, Ohira T, Hasturk H, Jones VL, Nam BH, et al. Enhanced superoxide release and elevated protein kinase C activity in neutrophils from diabetic patients: Association with periodontitis. J Leukoc Biol. 2005;78:862–70. doi: 10.1189/jlb.1004583. [DOI] [PMC free article] [PubMed] [Google Scholar]
- 35.Grossi SG, Genco RJ. Periodontal disease and diabetes mellitus: A two-way relationship. Ann Periodontol. 1998;3:51–61. doi: 10.1902/annals.1998.3.1.51. [DOI] [PubMed] [Google Scholar]