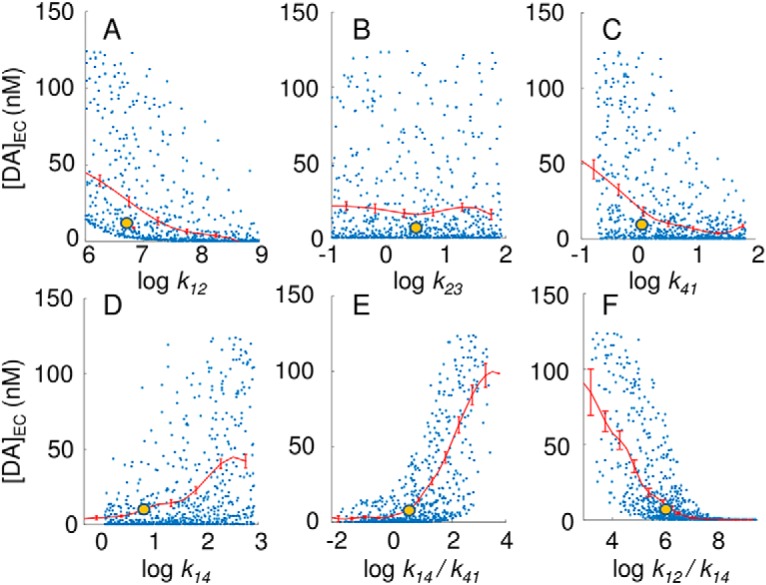
Figure 4.

Results from global sensitivity analysis performed for kinetic parameters representing DAT conformational dynamics. Yellow dots represent the default parameters used in the present study, and blue dots show the results obtained by using as input random combinations of the parameters (k12, k23, k34, k41 and k14) and their ratios. Results for k34, which are very similar to those for k23, are not shown. The red curves indicate the mean values and the standard error for successive bins of width 0.5. The Spearman correlation coefficients are –0.71, 0.01, –0.01, –0.44, 0.44, 0.63, and –0.48, in the six respective panels.
