

Abstract
Patterns of biodiversity and endemism are important and form the foundation for biogeography and conservation studies. Hormaphidinae is an aphid group mainly distributed in the Sino-Japanese, Oriental, and Nearctic zoogeographic realms. To infer the areas of endemism of Hormaphidinae aphids in the Sino-Japanese and Oriental realms, we employed a geographical distribution dataset covering all 225 species in subfamily Hormaphidinae. In total, 1,245 distribution occurrence records for all species were analyzed in addition to the number of species in a certain grid cell to calculate species richness. Two methods (parsimony analysis of endemicity (PAE) and the use of an optimization criterion—NDM/VNDM) using a total of 6 grid sizes were applied to detect possible areas of endemism and to assess the probable effects of the 2 different methods and 6 grid sizes on the results of the patterns of the areas of endemism. The results revealed that islands presented most of the areas with high species richness and endemic species, particularly Japan, Taiwan Island, Java Island, the Malaysian Peninsula, southeast Himalaya, and the Hengduan Mountains. Most of these areas of endemism were located on islands or a peninsula. Islands were therefore shown to play an essential role in facilitating the formation of high species richness and endemism. Different grid sizes directly determined the regions of the areas of endemism, with small grid sizes tending to detect small and discrete areas of endemism and large grid sizes identifying continuous areas of endemism. In terms of the two methods, NDM/VNDM was found to identify more areas of endemism than PAE.
Keywords: biogeography, endemism area, Hormaphidinae, island biogeography, species richness
Understanding patterns of geographical distribution and species diversity are crucial for identifying areas of endemism, which are the core components of historical biogeography and conservation (Huang et al. 2008). These patterns have been shown to be affected by taxa simultaneously with historical events. Much effort has been made to define areas of endemism; therefore, several methodologies have been developed for the precise identification of endemism.
Areas of endemism are defined as areas delimited by the congruent distribution of two or more species of restricted range (Morrone 1994). Three methods have been mainly used to identify areas of endemism: biotic analysis (BA; Hausdorf and Hennig 2003), endemicity analysis (EA; Szumik et al. 2002; Szumik and Goloboff 2004) and parsimony analysis of endemicity (PAE; Morrone 1994), which can be classified into 2 kinds of core methodologies: those concerning species patterns and geographical patterns (Szumik et al. 2002; Casagranda et al. 2012). BA involves species pattern, identifying clusters of species with overlapping distributions to identify the presence or absence of obvious spatial patterns. The other two methods are used to detect geographical patterns, defining groups of geographical units with similar species compositions. These 2 methodologies are frequently used in biogeographical studies, especially in the study of endemism (Casagranda et al. 2012).
PAE is derived from phylogenetic algorithms to score the presence or absence of each species in every cell of a grid. This approach in counting endemic species has several conceptual and practical problems: 1) a shortage of principles used to define endemic species, and 2) the entire area is not searched, only the areas filtered by the use of parsimony analysis. Therefore, NDM/VNDM was created by Szumik et al. (2002) by applying an optimality criterion. This program assigns an endemicity index to each species present within a given area represented by a set of cells, and the sum of the endemicity indices represents the endemicity index of the area, measuring the degree of congruence. Endemicity in this program is defined by how the species are distributed in the area—whether they are uniformly distributed in a particular study area or absent in several cells of the study area. Therefore, 2 factors are used to determine an area of endemism, the number of species in an area and whether a specific species is distributed only in that area.
The subfamily Hormaphidinae (Insecta: Hemiptera: Aphididae) contains 3 tribes, Cerataphidini, Hormaphidini, and Nipponaphidini, which possess interesting intrinsic biological features, such as a complex life cycle (for instance, heteroecy meaning host alternation from primary host to secondary host within a life cycle, Kennedy and Stroyan 1959), gall-inducing characteristics (Foster and Northcott 1994; Wool 2004), and social behaviors (Aoki 1987; Stern and Foster 1996; Pike and Foster 2004). Seasonally obligate host alternation, also known as heteroecy, occurs regularly between the primary host plants, where sexual reproduction occurs, and the secondary host plants, which serve as the habitat of the parthenogenetic generations (Blackman and Eastop 2000; Ghosh 1988; Moran 1988). Strong host specificity occurs in the Hormaphidinae; different tribes have distinct primary host plants. Similar to other phytophagous insects, the Hormaphidinae distribution area is strictly restricted by the distribution of their host plants. Cerataphidini and Nipponaphidini are found in the subtropical regions of eastern and southeastern Asia Chen et al. 2014, strictly corresponding with the distribution patterns of their host plants, with only a few species distribution areas straddling the equator. However, Hormaphidini presents the typical discontinuous distribution pattern in eastern North America, Western Europe, and eastern Asia (Heie 1980; Ghosh 1988; von Dohlen et al. 2002).
Hormaphidinae species are mostly distributed in the Chinese, Japanese, Oriental, and Indo-Malayan regions, nested within the Oriental and Sino-Japanese realms, according to the update of Wallace's zoogeographic regions of the world (Holt et al. 2013). All of these regions have experienced complex geographic and climatic changes, and these changes have helped to construct the diversity patterns. The uplift of the Qinghai–Tibet Plateau (QTP) was driven by the collision of the Indian with the Eurasian plate, beginning 50 Ma. Since then, at least 4 extensive uplifts have occurred over 4 periods: 25–17, 15–13, 8–7, and 3.5–1.6 Ma (Wen et al. 2014; Pisano et al. 2015). All these tectonic movements caused zonal climate pattern changes, and all of these factors triggered and facilitated biotic speciation and diversification, causing this region to harbor exceptional species richness and a high level of endemism. The Indo-Malayan region, comprising more than 20,000 islands, is the most geographically complex region. The geography of this region has changed considerably over the past 50 Ma, and more recently, during the Pleistocene, the rise and fall of the sea level submerged and exposed these islands, connecting them with one another or to the mainland, creating larger areas of land. Complex histories such as ancient vicariance events occurring 50 Ma until the present and dispersal caused by sea level changes gave rise to a diverse and highly endemic biota, similar to the situation of the Tibetan region (Lohman et al. 2011).
This study aims to unveil diversity distribution patterns and areas of endemism using two different methods: PAE using hierarchical theory and NDM/VNDM. We addressed the following questions: 1) what is the species richness pattern of the Hormaphidinae in the main distribution region? 2) where are the areas of endemism located and what species help to form these areas, also known as endemic species? and 3) why are most areas of endemism located in areas with high species richness?
Materials and Methods
Study areas
The study areas include the Sino-Japanese and Oriental realms and part of the Indo-Australian archipelago. All three areas are important biogeographic regions, containing more than 7 biodiversity hotspots (Mulch and Chamberlain 2006; Matuszak et al. 2015). Four hotspots are at least partly included in the Indo-Australian archipelago: southern Indo-Burma, the Philippines, Sundaland and Wallacea, and three hotspots are included in East Asia: Himalaya, the northern part of the Indo-Burma hotspot, and the Hengduan Mountains. In addition, the Japanese biodiversity hotspot is also in the region of the study area Myers et al. 2000. All these areas have been considered to have suffered geological and climatic changes. The Himalaya region has experienced a series of geological events: the collision of India and Eurasia, the uplift of the QTP far above sea level, and the uplift of the higher mountains of Himalaya from 20 to 10 Ma until the present (Mulch and Chamberlain 2006; Lippert et al. 2014; Favre et al. 2015). The Indo-Australian archipelago area went through ancient vicariance events to form remarkable patterns of the distribution of higher taxa, and fluctuations in the sea level may have formed the land regions of Sundaland and Wallacea more recently (Lohman et al. 2011).
Species distribution data collection
Subfamily Hormaphidinae includes 45 genera, 225 species of which are distributed across all of Eurasia to the south Indo-Australian archipelago and range from North America to Brazil in the New World. In this study, we collected distribution records for all Hormaphidinae species across the globe, but due to sparse occurrences in the Palearctic, Nearctic, and Neotropical regions, 225 species with 1,245 Hormaphidinae distribution records located in the Sino-Japanese and Oriental realms were used for analysis. Most of the species distribution data, especially most from Mainland China, were extracted from the sample dataset compiled by our group when sampling across the whole of China over the past decade. Additionally, we obtained occurrence data for the Hormaphidinae from published and unpublished faunas, checklists, datasets, and journal articles. In addition, several popular online biodiversity and aphid datasets were exhaustively searched, including the Global Biodiversity Information Facility (http://www.gbif.org/) and Aphids on the World’s Plants: An Online Identification and Information Guide (http://www.aphidsonworldsplants.info).
Most of the occurrence records were logged with either precise coordinates or a detailed location address. The locations of the records without precise geographical coordinates or only containing the concise administration sample unit areas were standardized using Google Earth Pro (Google Earth Pro 7.1.5.1557) by identifying the detailed locations and coordinates under the WGS84 coordinate system, which was used in all of the analyses of this study. Ambiguous occurrence locations for which only the countries, states, or provinces of distribution were recorded were removed, and the locations of county- or prefecture-level occurrences without precise coordinates were represented by the capital or the location of the central administration.
Mapping species richness
We choose a 1° grid to subdivide the study area to map the species richness pattern, and the number of species in every grid cell was counted. To decrease the effect of area in each grid cell, WGS84 (World Geodetic System 84) and the Behrmann equal area cylindrical projection were chosen. Incomplete grid cells located along coasts or borders are usually excluded from such analyses to eliminate the effect of area on the species richness (Tang et al. 2012). However, in the study, there were too many incomplete grid cells due to the presence of several large islands in the study area, so the incomplete grid cells were not removed from the analysis of species richness to show the detailed distribution of the Hormaphidinae.
Determining areas of endemism
Here, two methods were applied to analyze the areas of endemism: the heuristic algorithm of NDM/VNDM and the PAE. Although these two methods have been compared in many studies, and it seems that the NDM/VNDM performs better than the PAE for several kinds of diversity datasets, especially for overlapping and disjoint patterns (Casagranda et al. 2012), the two methods can be used together to confirm the results.
PAE was conducted to identify areas of endemism following the approach used by Huang et al. (2008), who distinguished areas of endemism for the aphids of the QTP and the Himalaya (Huang et al. 2008). Two grid sizes of 2° (Supplementary Table A) and 3° were chosen to perform the analysis, as PAE may be sensitive to the scale of the grid size (Morrone 1994; Morrone and Escalante 2002). Multiple taxa levels (generic and species-level distribution data) have been used in PAE in several studies (Cracraft 1991; Glasby and Alvarez 1999); therefore, we conducted all of the analyses at only the species level and at multiple taxa levels and found that the latter pattern was not useful in identifying areas of endemism. This may result from the less diverse data pattern of the distribution of Hormaphidinae.
A matrix was constructed for each grid size, and one hypothetical outgroup with all 0 values was added to the matrix to act as the root when generating trees (Morrone 1994; Morrone and Escalante 2002). The PAE was conducted with PAUP 4.0a147 (Swofford 2003). The main parameters applied in the analysis were set maxtrees = 1,000, set criterion = parsimony, and bootstrap replicates = 1,000. Although bootstrapping is required in PAE to choose appropriate clades (Huang et al. 2008), we also used bootstrapping with 1,000 replicates to estimate the validity of the area of endemism. Given the quantity of the species and the cells used in the analysis, we also conducted 2,000 and 5,000 bootstrap replicates for the 2° grid size. As a result, the outcomes with the different numbers of replicates were consistent. The bootstrap replicates did not have much effect on the bootstrap value of the area of endemism. The 50% majority consensus tree of the parsimonious trees was obtained from the PAE results, and the areas with a high bootstrap value (branches with a 50% or greater bootstrap value) and that strictly contained 2 or more species were thought to be areas of endemism.
NDM/VNDM version 3.0 was developed by Szumik and Goloboff (2004), and the methods implemented were based on Szumik’s 2 articles published in 2002 and 2004 (Szumik et al. 2002; Szumik and Goloboff 2004). This method considers both the locations of taxa in space and spatial information regarding the delimitation of areas as the components in the analysis.
The analysis of the Hormaphidinae dataset was conducted using cells of different sizes, with the latitude and longitude of 1° × 1°, 2° × 2°, 3° × 3°, and 4° × 4°. Although several studies have suggested that 1° cells are prone to fragmenting the distribution area (Huang et al. 2008; Aagesen et al. 2009), given the intrinsic diversity of the dataset, 1° cells were included to determine the areas of endemism. The NDM/VNDM analysis was conducted using the default settings of the software, except subsets were defined as overlapping when 50% of the species were unique and the species with a score larger than 0.4 were labeled endemic species. The search was repeated 100 times. The consensus areas of endemism were computed as a strict consensus, using a cut-off of 100% similarity in species.
The outcomes of the different grid areas analyzed by NDM/VNDM software were imported into the software QGIS to transform the TXT format into a shapefile, which was then used to plot the map of the areas of endemism and for other geographical displays using ARCGIS 10.2.2 (ESRI, Redlands, CA, USA).
Results
Mapping species richness and endemism
Hormaphidinae is mainly distributed in Asia, Europe, and the Americas, and Hormaphidini has a disjoint distribution between Asia and North America. All the highest levels of species richness of Hormaphidinae in the study area are located on islands or in montane areas on the mainland (Figure 1). The areas with the highest species richness of Hormaphidinae are situated on several islands: Taiwan Island, Japan, and Java. On the mainland, southeast Himalaya has the highest number of species. The 3 tribes of Hormaphidinae display different distribution patterns.
Figure 1.
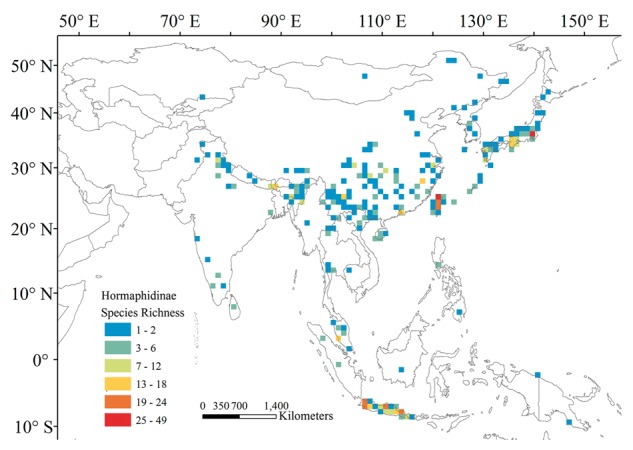
Species richness pattern of Hormaphidinae aphids under the 1° grid size.
Via the NDM/VNDM approach, all four chosen grid sizes analyzed in this study identified different numbers of areas of endemism. The NDM/VNDM program applied to the 1° grid size distinguished 10 areas of endemism, but due to noncontiguousness and overlapping, 9 consensus areas of endemism were found. The analysis using the 2° grid size produced 10 areas of endemism and the same number of consensus areas of endemism. The 3° grid size yielded 9 areas of endemism and 9 consensus areas. Finally, the 4° grid size resulted in 14 areas of endemism and 13 consensus areas, which covered most of the study area. Therefore, the overlapping areas of endemism identified by these 4 grid sizes helped to identify the generalized areas of endemism for the Hormaphidinae: Japan, Taiwan, Java, and the middle part of the Malaysian Peninsula (MP) (Figure 2). All areas of endemism were located on an island or a peninsula. More detailed results are compiled in Table 1 and the Supplementary Material.
Figure 2.

Overlap map of the consensus endemism areas detected by NDM/VNDM analysis of grids. The diagonal grids represent the consensus endemism areas detected by the 4° grid, light gray grids represent the 3° endemism areas, dark gray represent the 2° areas, and black squares represent the 1° areas.
Table 1.
Summary of the consensus areas of the subfamily Hormaphidinae analyzed by NDM/VNDM
| Consensus areas | Endemism species (score) | No. of cell | Maximum score | Grid size |
|---|---|---|---|---|
| 1 | Lithoaphis shiiae (0.625); Monzenia globuli (0.565); Nipponaphis distyliicola (0.625); Sinonipponaphis monzeni (0.688); Thoracaphis kashifoliae (0.706) | 9 | 3.208600 | 1 |
| 2 | Aleurodaphis ligulariae (0.750); L. shiiae (0.475); M. globuli (0.435); Neothoracaphis querciphaga (0.792); N. distyliicola (0.528) | 6 | 2.979227 | 1 |
| 3 | Nipponaphis manoji (1.000); Tuberaphis indica (1.000); Sinonipponaphis holboelliae (1.000) | 2 | 3.000000 | 1 |
| 4 | Aleurodaphis ligulariae (0.682); Metanipponaphis rotunda (0.636); N. querciphaga (0.850) | 5 | 2.168182 | 1 |
| 5 | Tuberaphis viscisucta (1.000); Neohormaphis quercisucta (1.000) | 2 | 2.000000 | 1 |
| 6 | Lithoaphis shiiae (0.958); M. globuli (0.800); N. distyliicola (0.846) | 6 | 2.604487 | 1 |
| 7 | Parathoracaphis gooti (0.875); Parathoracaphis kayashimai (0.875); Thoracaphis flava (0.875) | 4 | 2.625000 | 1 |
| 8 | Astegopteryx ficicola (1.000); Astegopteryx liukueinensis (1.000); Cerataphis formosana (1.000); Chaitoregma tattakana suishana (1.000); Lithoaphis lithocarpi (1.000); Neothoracaphis tarakoensis (1.000); Reticulaphis mirabilis (1.000); Reticulaphis septica (1.000) | 2 | 8.000000 | 1 |
| 9 | Tuberaphis scurrulae (0.700); Pseudoregma pendleburyi (0.857); Mesothoracaphis rappardi (0.750); | 7 | 2.307143 | 1 |
| 10 | Tuberaphis styraci (0.600); Ceratovacuna cerbera (0.750); L. shiiae (0.467); M. globuli (0.433) N. querciphaga (0.467); N. distyliicola (0.542) | 4 | 3.258333 | 2 |
| 11 | Tuberaphis styraci (0.625); C. cerbera (0.833); M. globuli (0.423); N. distyliicola (0.550) | 3 | 2.431410 | 2 |
| 12 | Tuberaphis styraci (0.583); C. cerbera (0.700); L. shiiae (0.471); M. globuli (0.441); N. querciphaga (0.471); N. distyliicola (0.536); T. kashifoliae (0.500) | 5 | 3.701401 | 2 |
| 13 | Ceratoglyphina phragmitidisucta (0.875); Nipponaphis minensis (0.636); Ceratovacuna similindica (0.875); Neonipponaphis pustulosis (0.875) | 4 | 3.261364 | 2 |
| 14 | Astegopteryx pallida (0.667); Astegopteryx rappardi (0.583); Pseudoregma montana (0.781) | 8 | 2.031250 | 2 |
| 15 | Ceratovacuna oplismeni (0.423); Ceratovacuna subtropicana (0.833); Chaitoregma aderuensis (0.917) | 3 | 2.173077 | 2 |
| 16 | Astegopteryx glandulosa (0.667); T. scurrulae (0.643); P. pendleburyi (0.643) | 5 | 7.225108 | 2 |
| Distylaphis foliorum (0.750); M. rappardi (0.750); Neohormaphis calva (0.800); Nipponaphis brevipilosa (0.800); Schizoneuraphis longisetosa (0.700); Sinonipponaphis hispida (0.773); Thoracaphis arboris (0.700) | ||||
| 17 | Parathoracaphis gooti (0.875); P. kayashimai (0.875); T. flava (0.875) | 4 | 2.625000 | 2 |
| 18 | Aleurodaphis ligulariae (0.676); L. shiiae (0.694); M. rotunda (0.611); M. globuli (0.667); Neothoracaphis glaucae (0.438); N. querciphaga (0.694); N. distyliicola (0.719); Nipponaphis litseae (0.462); Quadrartus yoshinomiyai (0.719); T. kashifoliae (0.688); Thoracaphis linderae (0.477) | 8 | 6.844448 | 2 |
| 19 | Tuberaphis styraci (0.800); C. cerbera (0.700); N. querciphaga (0.531) | 5 | 2.031250 | 2 |
| 20 | Nipponaphis machilicola (0.643); Monzenia ihai (0.714); N. litseae (0.611); Nipponaphis loochooensis (0.714) | 7 | 2.682540 | 3 |
| 21 | Astegopteryx pallida (0.786); A. rappardi (0.786); Astegopteryx singaporensis (0.714); P. montana (0.786) | 7 | 3.071429 | 3 |
| 22 | Astegopteryx pallida (0.571); A. rappardi (0.571); P. montana (0.900); Pseudoregma nicolaiae (0.700) | 5 | 2.742857 | 3 |
| 23 | Astegopteryx glandulosa (0.500); Tuberaphis macrosoleni (0.750); T. scurrulae (0.500); P. pendleburyi (0.583); M. rappardi (0.500); N. calva (0.875); N. brevipilosa (0.875); S. hispida (0.875) | 4 | 5.458333 | 3 |
| 24 | Ceratoglyphina styracicola (1.000); Quernaphis tuberculata (1.000) | 2 | 2.000000 | 3 |
| 25 | Aleurodaphis impatientis (0.700); A. ligulariae (0.700); Euthoracaphis umbellulariae (0.700); L. shiiae (0.900); M. rotunda (0.700); M. globuli (0.900); N. glaucae (0.500); N. querciphaga (0.700); N. distyliicola (0.800); N. litseae (0.444); T. kashifoliae (0.700); T. linderae (0.500) | 5 | 8.244444 | 3 |
| 26 | Cerataphis jamuritsu (1.000); Ceratovacuna longifila (1.000) | 2 | 2.000000 | 3 |
| 27 | Astegopteryx glandulosa (0.800); T. scurrulae (0.800); P. pendleburyi (0.900); D. foliorum (0.700); M. rappardi (0.800); N. calva (0.800); N. brevipilosa (0.800); S. hispida (0.800) | 5 | 6.400000 | 3 |
| 28 | Monzenia ihai (1.000); N. loochooensis (1.000) | 3 | 2.000000 | 3 |
| 29 | Cerataphis jamuritsu (0.750-0.833); C. longifila (0.875-1.000); C. oplismeni (0.500-0.875); C. subtropicana (0.750-0.833); C. aderuensis (0.750-0.833) | 4 | 4.000000 | 4 |
| 30 | Aleurodaphis ligulariae (0.833); T. styraci (0.833); L. shiiae (0.833); M. rotunda (0.833); M. globuli (0.833); N. glaucae (0.500); N. querciphaga (1.000); N. distyliicola (0.833); T. linderae (0.500) | 3 | 7.000000 | 4 |
| 31 | Ceratovacuna silvestrii (0.765); C. tattakana (0.684); Pseudoregma alexanderi (0.737) | 17 | 2.185759 | 4 |
| 32 | Aleurodaphis mikaniae (0.559); Dermaphis japonensis (0.692); Neothoracaphis yanonis (0.676); Parathoracaphis setigera (0.692) | 13 | 2.619910 | 4 |
| 33 | Aleurodaphis ligulariae (0.750); T. styraci (0.750); L. shiiae (0.750); M. rotunda (0.750); M. globuli (0.750); N. glaucae (0.500); N. querciphaga (0.875); N. distyliicola (0.750); T. kashifoliae (0.750); T. linderae (0.500) | 4 | 7.125000 | 4 |
| 34 | Astegopteryx pallida (0.900); A. rappardi (0.900); A. singaporensis (0.800); P. montana (0.800) | 5 | 3.400000 | 4 |
| 35 | Ceratovacuna perglandulosa (0.438); Ceratovacuna spinulosa (0.750); Schizoneuraphis himalayensis (0.750); Schizoneuraphis querciphaga (0.750) | 4 | 2.687500 | 4 |
| 36 | Astegopteryx basalis (0.917); Astegopteryx rhapidis (0.500); Cerataphis brasiliensis (0.625); Cerataphis vandermeermohri (0.750) | 6 | 2.791667 | 4 |
| 37 | Astegopteryx bambucifoliae (0.636); Neothoracaphis quercicola (0.500); Reticulaphis inflata (0.722); Sinonipponaphis formosana (0.778) | 9 | 2.636364 | 4 |
| 38 | Astegopteryx glandulosa (1.000); T. scurrulae (1.000); P. pendleburyi (0.833); D. foliorum (0.833); M. rappardi (1.000); N. calva (0.833); N. brevipilosa (0.833); S. hispida (0.833) | 3 | 7.166667 | 4 |
| 39 | Aleurodaphis ligulariae (0.667); E. umbellulariae (0.667); L. shiiae (0.667); M. rotunda (0.667); Metathoracaphis isensis (0.667); M. globuli (0.667); M. ihai (0.500); N. glaucae (0.750); N. querciphaga (0.750); N. distyliicola (0.667); N. litseae (0.833); N. loochooensis (0.500); T. kashifoliae (0.667); T. linderae (0.750) | 6 | 9.416667 | 4 |
| 40 | Aleurodaphis mikaniae (0.400); D. japonensis (0.708); Neothoracaphis saramaoensis (0.708); N. yanonis (0.583); P. setigera (0.708) | 12 | 3.108333 | 4 |
| 41 | Ceratovacuna japonica (0.889); Tuberaphis coreana (0.722); Allothoracaphis piyananensis (0.722) | 9 | 2.333333 | 4 |
Notes: Table lists the all consensus areas of the Hormaphidinae, the endemism species and their respective score, number of composition cell for each area, the maximum score (sum of each endemism species score), and the grid size.
In addition to the areas of endemism found by the NDM/VNDM analysis, the PAE found several areas of endemism at both the 2° (Figure 3A) and 3° (Figure 3B) grid sizes, and the 2 cell sizes resulted in different areas of endemism. The 2° grid size resulted in only 3 areas of endemism, which were all also covered by the results of the NDM/VNDM analysis. The first was located in the middle of Japan, containing 3 cells; the second was Taiwan Island, with a bootstrap value of 0.86; and the last was a set of 3 disjoint cells located on Java Island. The PAE conducted with the 2° grid size did not identify any areas of endemism on the mainland, corresponding with the results of the NDM/VNDM analysis. The grid size of 3° resulted in 6 endemic areas. Two areas were detected in Japan within the same area in the middle of Honshu detected at the 2° grid size; 1 area was located in the north of Honshu, and this area could be combined with the other area in Japan due to their proximity in terms of geographical distance and their similar environmental conditions, although the PAE did not combine the 2 areas into a single area. Another similar result was that the PAE combined the partial cells in Java and 1 cell on the MP into a single area of endemism. In addition to these 2 areas identified at the 2° grid size, the PAE with the 3° grid size detected 3 areas on the Asian mainland, in the southeast of the QTP, with 2 cells situated in Hunan Province and two cells covering land in the Zhejiang and Jiangsu Provinces.
Figure 3.

Results of endemism areas detected by PAE using 2 different grid sizes: (A) 2° and (B) 3°. The cells of the same color in each picture represent the same area of endemism. The percentage beside each area of endemism indicates the bootstrap value.
Taiwan island
Taiwan island was detected at all grid sizes and using both methods as an area of endemism, containing the consensus areas 8, 15, 24, and 26 (Table 1; Supplementary Figures A, B, C). Consensus areas 8 and 15 were singled out by the NDM/VNDM analysis at the 1° and 2° grid sizes, respectively, and the 2 other areas were identified at the 3° grid size (areas 24 and 26). The consensus areas identified at all grid sizes overlap, although the endemic species defining each area differ. The species Ceratovacuna oplismeni, Ceratovacuna subtropicana, and Chaitoregma aderuensis define consensus area 15 at the 2° grid size; one consensus area (area 24) detected at the 3° grid size is supported by Ceratoglyphina styracicola and Quernaphis tuberculata; and the other found at same grid size (area 26) is supported by Cerataphis jamuritsu and Ceratovacuna longifila. At the 1° grid size, 8 species support one consensus area, and these are Astegopteryx ficicola, Astegopteryx liukueinensis, Cerataphis formosana, Chaitoregma tattakana suishana, Lithoaphis lithocarpi, Neothoracaphis tarakoensis, Reticulaphis mirabilis, and Reticulaphis septica.
Although Taiwan Island was detected as an area of endemism at all grid sizes, the different grid sizes noted different local areas. The 1° grid size located a consensus area in the north of Taiwan, whereas the 2° grid size identified all of Taiwan and the northeast islands. Two consensus areas detected by the 3° grid size are discontinuous. Except for the part located in Taiwan, area 24 still includes the area located in the middle of Honshu, Japan, while area 26 contains an area of the inlet of the Zhujiang River including Hong Kong.
The continuous consensus areas detected at the 1° and 2° grid sizes obtained scores of 8.00 (area 8) and 2.17 (area 15). The discontinuous consensus areas containing both Taiwan and Hong Kong or the middle part of Honshu obtained scores of 2.00 (areas 24 and 26).
The Japan region
The NDM/VNDM analysis identified 4 consensus areas for the 1° grid size in Japan (areas 1, 2, 4, and 6). In sum, 3 of the 4 areas identified by the 1° grid size are discontinuous, but all sets of consensus endemism areas were located in Honshu, Japan. In addition, 5 consensus areas were found by the 2° grid (areas 10, 11, 12, 18, and 19). The 3° grid identified 4 consensus areas associated with Japan (areas 20, 24, 25, and 28) because the discontinuous area 24 spanned across Taiwan and Honshu, Japan.
At the 1° grid size, 2 endemic species, Aleurodaphis ligulariae and Neothoracaphis querciphaga, support both areas 2 and 4, and 3 endemic species, Lithoaphis shiiae, Monzenia globuli, and Nipponaphis distyliicola, support areas 1, 2, and 6. At the grid size of 2°, Tuberaphis styraci and Ceratovacuna cerbera support areas 10, 11, 12, and 19; L. shiiae supports areas 10, 12, and 18; M. globuli and N. distyliicola support areas 10, 11, 12, and 18; N. querciphaga supports areas 10, 12, 18, and 19; and Thoracaphis kashifoliae supports areas 12 and 18.
Of all the consensus areas located in Japan, area 25, which was generated by the grid size of 3°, gained the highest score of 8.24, covering most area of Honshu, Shikoku, and Kyushu. Area 18 obtained a score of 6.84 and contains Honshu and Kyushu. Both of these areas contain many endemic species.
Java island
Java was determined to be an area of endemism at all grid sizes. In this area, only 1 consensus area was detected at the grid size of 1° (area 9, score = 2.31), 2 areas were detected at the grid size of 2° (area 14, score = 2.03; area 16, score = 7.23), and 4 areas were detected at the grid size of 3° (areas 21, 22, 23, and 27) (Table 1; pictures 21, 22, 23 and 27 in Supplementary Figure C).
The endemic species Tuberaphis scurrulae, Pseudoregma pendleburyi, and Mesothoracaphis rappardi support area 9; Astegopteryx pallida, Astegopteryx rappardi, and Pseudoregma montana support areas 14 and 10; and additional species support area 16 at the grid size of 2°.
The Malaysian Peninsula
Interestingly, a consensus area of endemism was found by the NDM/VNDM analysis at all grid sizes in the middle of the MP, for example, consensus area 7 was found at the 1° grid size (Table 1; picture 7 in Supplementary Figure A), areas 14 and 17 (overlapped with area 7) were detected at the 2° grid size (Table 1; pictures 14, 17 in Supplementary Figure B), and areas 21 and 22 were identified at the 3° grid size (Table 1; pictures 21, 22 in Supplemental Figure C). Although areas 21 and 22 were discontinuous, 1 part of the discontinuous area was located on the MP. The species supporting the continuous areas (areas 7 and 17) were the same for the grid sizes of 1° and 2°: Parathoracaphis gooti, P. kayashimai, and Thoracaphis flava, and their scores were 2.03 and 2.63, respectively. The discontinuous consensus areas of endemism shared several supporting species at each grid size. Area 14 was supported by 3 endemic species: A. pallida (0.667), A. rappardi (0.583), and P. montana (0.781); in addition to these species, there was 1 more species for both areas 21 and 22. Four species, A. pallida (0.786), A. rappardi (0.786), Astegopteryx singaporensis (0.714), and P. montana (0.786), supported area 21, and A. pallida (0.571), A. rappardi (0.571), P. montana (0.900), and Pseudoregma nicolaiae (0.700) supported area 22. The MP area contained parts of the 4 northern states of West Malaysia, which include 2 great mountain ranges, the Titiwangsa and Bintang Mountains, and 2 main rivers.
The Sikkim area
One area of endemism was detected by both methods at small grid sizes in Sikkim state, India, located in the south Himalaya. NDM/VNDM identified an area of endemism occurring mostly in Sikkim at the cell size of 1°, but PAE distinguished an area of endemism occurring partly in Sikkim and partly in Assam, India, and Bangladesh at the cell size of 2°. This area of endemism is supported by 3 species, Nipponaphis manoji (1.000), Tuberaphis indica (1.000), and Sinonipponaphis holboelliae (1.000). In addition to the Sikkim area, 1 area of endemism was detected only by NDM/VNDM at the grid size of 1°. This area was supported by 2 endemic species, Tuberaphis viscisucta (1.000) and Neohormaphis quercisucta (1.000). Both of these areas were located in mountain areas with high species richness.
Discussion
Investigating species richness distribution patterns and identifying areas of endemism is essential and fundamental to biogeographical studies, which is a prerequisite for biodiversity conservation (Huang et al. 2008).
Species richness and endemism areas of the Hormaphidinae
Four areas of endemism of Hormaphidinae species were identified by the NDM/VNDM analysis. All the areas were insular: Taiwan Island, Honshu in Japan, Java Island, and the MP. In addition, these 4 areas have high species richness and are also global biodiversity hotspots (Myers et al. 2000). Although all of the areas of endemism were congruent with the species richness hotspots, all of the species richness hotspots were not in concordance with the areas of endemism. This was also found in other studies (Thomas and Mallorie 1985; Berg and Tjernberg 1996; Jetz et al. 2004), and different mechanisms could be responsible for the geographical patterns of biodiversity, especially in the case of species richness and endemism.
In general, endemism is thought to be a result of the conservation of refugia from past extinctions or high rates speciation (Orme et al. 2005). This might explain why no large areas of endemism were found on Mainland Asia despite the high species richness as well as the conflicting results among the different grid sizes. In the cases of the southeast QTP and the middle of the Yunnan Province, high species richness was discovered, but only fragmented areas of endemism were identified in these areas.
Islands conserve the most areas of endemism and endemic species
Islands are usually regarded as centers of speciation, providing restricted ranges, and show high levels of endemism (Whittaker and Fernández-Palacios 2007). For Hormaphidinae, all of the consensus areas of endemism detected at all grid sizes no matter whether NDM/VNDM or PAE was used were identified on islands. Likewise, most of the islands with high species richness were identified as areas of endemism, except for Hainan Island. Furthermore, no overlapping areas of endemism were found using either method on the East Asia Mainland, except for several scattered and small areas recognized at only 1 grid size by the NDM/VNDM analysis (only 1°) or with low probability (<50%) with PAE.
Explanations for why islands contain so many endemic species and conserve more areas of endemism than the mainland could be that 1) islands are commonly geographically isolated far from the mainland, which usually contains high species richness, and the lack of interchange between the island and mainland biota leads to a high level of endemism on the separated islands; 2) the islands formed very recently from volcanism, terrane movements, or climate fluctuations, as is the case of the Canary Islands and Hawaii, which may act as the foundation for rapid adaptive radiation, which could result in new endemic taxa (Schluter 2000); and 3) these oceanic islands are located in the ocean, which acts as a climatic buffer to resist the mass extinctions caused by historical climatic changes that occurred on the mainland and may therefore harbor paleoendemic lineages (Cronk 1997). Therefore, their intrinsic features, the conservation of relatively paleoendemic taxa and rapid diversification through adaptive radiation contribute to high levels of insular endemism (Kier et al. 2009).
In Southeast Asia, dispersal, rather than vicariance, may be the predominant factor explaining distributions spanning more than one landmass (Lohman et al. 2011). Java Island shows a similar floristic diversity to that of Sumatra and the MP but distinct from that of Borneo; this may reflect the fact that there may be a drier corridor running from Mainland Southeast Asia through the MP and Sumatra to Java, connecting with Wallacea (Bird et al. 2005; Cannon et al. 2009; Hall 2009), and this could be the dispersal route for the Hormaphidinae and other insects distributed in this area but originating in East Asia (Condamine et al. 2013). Furthermore, the endemism in Java might result from its specific biotic and climatic conditions. This island is a geological part of the Sunda Shelf, but based on its climate and floristic composition, Java is similar to both the Sunda Shelf and Wallacea. The Island of Java experiences only slight seasonal climate change in the western areas to strongly seasonal changes in the eastern areas. Only the southwest part resembles the Sunda Shelf, having an ever-wet climate. Furthermore, the climate of Java could favor plant species growing in either ever-wet or dry habitats, and the dry area is much larger than that with the ever-wet climate (van Welzen et al. 2011); this diverse flora may help conserve the areas of endemism for Hormaphidinae on the island of Java.
The effects of cell size and the attribution of distribution data on the results
It has been reported that the properties of distributional data, such as the distribution data shape, extension, sampling gap bias, and sample size, could affect the identification of biogeographic patterns (Hortal et al. 2007; Casagranda et al. 2009). Of course, it is still very difficult to resolve all the mechanisms of how real species data attribution determines the patterns of endemism because the patterns of the true distributions of species contain too many variables to interpret (Casagranda et al. 2012). However, the cell size (the grid size) could be the easiest means to control and discuss the effects of the intrinsic properties.
The use of a grid is the fundamental and unavoidable means to divide a given study area into small cells, or in other words, to help convert point data of actual species occurrences to ranges in some explicit way, and the cell sets are the basic component of the areas of endemism in both the NDM/VNDM and PAE methodologies. Therefore, without any doubt, the grid size may directly influence the results (Szumik and Goloboff 2004; Casagranda et al. 2009). For example, applying a small grid size tends to divide the area into small and discontinuous areas, leading to the same types of areas of endemism, and a large grid size results in large and ambiguous areas with abundant endemic species (Szumik et al. 2002).
The results of our study corresponded with the aforementioned. The 4° grid size identified the largest area of endemism, covering all the overlapping areas of endemism on the mainland and islands, but almost half of the area of China was determined to be an area of endemism, which could be large and conflicts with common sense. The 2° and 3° grid sizes gave the same results for the consensus endemism areas, which could be more reasonable and have relatively more practicality. Unexpectedly, the 1° cells identified several endemic areas located in Tibet and Yunnan Province that were not identified at any of the other grid sizes. Except for the 4° grid size, the other 3 grid sizes generated a similar number of consensus endemism areas, which conflicts with the conclusion that smaller grid sizes tend to identify fewer areas of endemism (Szumik et al. 2002; Szumik and Goloboff 2004; Szumik et al. 2012). On the other hand, the larger cell size tended to generate disjoint areas of endemism, which is similar to previous results (Szumik et al. 2002; Szumik and Goloboff 2004). This dilemma may result from three reasons: 1) Dataset attribution. The ideal distribution dataset for the species studied has been proposed to be evenly distributed. In fact, the conclusion that smaller grid sizes generate fewer and more disjoint areas of endemism was first conceptualized from the theoretical dataset and was partly confirmed by theoretical and realistic distribution data (Casagranda et al. 2012). 2) Differing appropriate grid sizes for the mainland and islands as a result of their different configurations and heterogeneity in species distributions. In general, the mainland has a larger area and lower species heterogeneity, so the evenness of the distribution data is relatively high compared with that of islands. Thus, large grid sizes are suitable for the mainland, and several areas of endemism were found at the grid sizes of 3° and 4°; a small grid size could generate the same results, as in the case of the grid sizes of 2° and 3° on the mainland. However, islands could easily be detected at all grid sizes, with large grid sizes generating areas of endemism with an area outside the island as a whole, while the small grid size generated several overlapping areas of endemism across the island. 3) The elevation gradient effect. Two areas of endemism were discovered at the 1° grid size, and both of these areas were located in mountain areas, one in the Himalaya Mountains and the other in the Gao Li Gong mountains. This could be due to the high diversity in certain small montane areas, which is similar to that found for rodents in South America (Prado et al. 2014).
Assessing sampling effort and bias
Collector’s curves have been considered as a good way to evaluate the quality of species data collection (Moline and Linder 2006; Sánchez-Fernández et al. 2008). The curves present the expected accumulated number of species encountered as a function of the number of collections. The slope of the collector’s curve determines the rate of species accumulation based on a certain sampling effort, and this could be used to detect potential under-collection (Sánchez-Fernández et al. 2008). The log-transformed number of collections was plotted against the log-transformed number of species of per grid cell, and cells in which potential under-collection occurred will be located in the area under the regression line.
For Hormaphidinae species richness and endemism, all cells that contained an equal number of species records and collections were located in the under-collection areas, although the adjusted R2 = 0.9746 (Figure 4). This unevenness in sampling may result in a biased description of the biodiversity pattern (Dennis and Shreeve 2003). In the 2° grid analyzed by NDM/VNDM, no such under-collection cell was found on Taiwan Island, but under-collection cells were located on the edge of other areas of endemism. In addition, we found that all areas of endemism overlapped with the high species richness areas, and this indicated that we could not exclude the possibility that the areas of endemism for Hormaphidinae may result from some areas being more well-sampled than others.
Figure 4.
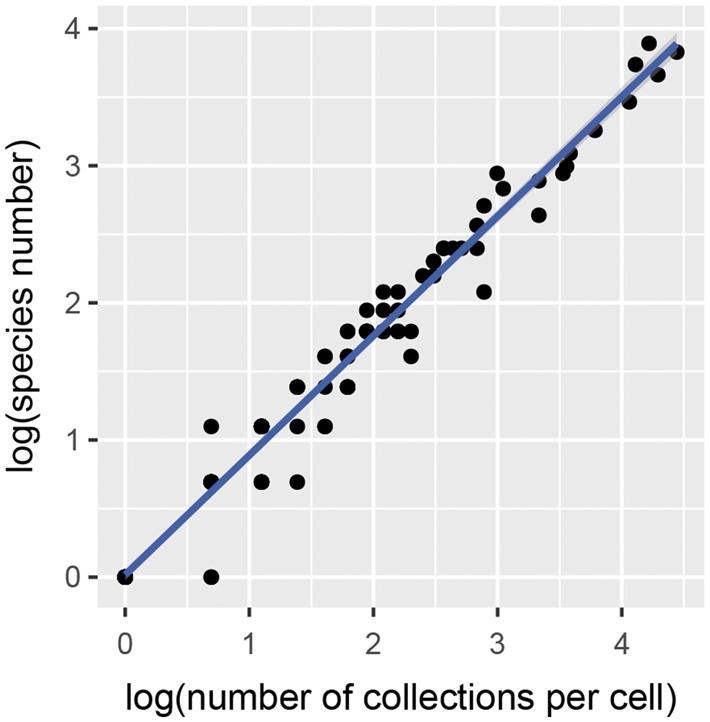
Species accumulation curves in grid 1°.
The usage of grids and biases in the methods could cause problems, and different methods gave biased results (Carine et al. 2009; DaSilva et al. 2015). Therefore, two different methods and several cell sizes were applied to concordantly detect complete areas of endemism (Deo and DeSalle 2006). Further, the sampling density could affect the area of endemism results. More areas of endemism have been found in well-sampled regions, and no areas were detected in sparse regions (Casagranda et al. 2009). This result occurred in our study, as well. NDM/VNDM with small grids identified most areas of endemism in the well-sampled region (Supplementary Figure A), especially in the 2 mountain areas mentioned in the above paragraph, where high species richness occurs. In addition, the large grid size distinguished areas of endemism across all of South China, which was sparsely sampled. Although different gird sizes were applied to minimize this problem, the congruent results on islands indicated that further studies involving more sampling can solve this problem.
The discrepancy between the PAE and NDM/VNDM results
Both PAE and the NDM/VNDM analysis are 2 common and widely used methodologies to calculate areas of endemism in biogeography, but the effects of these 2 methods on the results when utilizing real distribution occurrence data are poorly explored at the continental scale in the field of biogeography (Moline and Linder 2006; Casagranda et al. 2009; Casazza and Minuto 2009). In addition, it has been said that the NDM/VNDM analysis performs better than the PAE in identifying several kinds of areas of endemism, especially for overlapping and the disjoint patterns. This was confirmed by our study.
The NDM/VNDM method detected many more areas of endemism, although most of the cell sets were generally analogous except for 1 or 2 distinct cells. The optimality criterion was liable to report redundancy, and this could identify areas with similar spatial structure and/or species composition (Aagesen et al. 2009). In our study, this was highlighted in Japan. At the grid size of 2°, 10 areas of endemism were identified, 5 of which were located in Japan, and all 5 overlapped in the middle of Honshu, Japan. However, compared with the similarity in geographical structure, the species composition was more diverse.
Supplementary Material
Acknowledgments
We are grateful to all specimen collectors for collecting species information. In addition, we thank Pablo Goloboff, who is the author of the software NDM/VNDM for his help in using the software, and anonymous referees for their insightful comments and suggestions.
Funding
This work was supported by the National Natural Sciences Foundation of China [Nos. 31430078 and 31402000].
Supplementary Material
Supplementary material can be found at https://academic.oup.com/cz.
References
- Aagesen L, Szumik CA, Zuloaga FO, Morrone O, 2009. Quantitative biogeography in the South America highlands-recognizing the Altoandina, Puna and Prepuna through the study of Poaceae. Cladistics 25:295–310. [DOI] [PubMed] [Google Scholar]
- Aoki S, 1987. Evolution of sterile soldiers in aphids In: Itô Y, Brown JL, Kikkawa J, editors. Animal Societies: Theories and Facts. Tokyo: Japan Scientific Societies Press, 53–65. [Google Scholar]
- Berg Å, Tjernberg M, 1996. Common and rare Swedish vertebrates: distribution and habitat preferences. Biodivers Conserv 5:101–128. [Google Scholar]
- Bird MI, Taylor D, Hunt C, 2005. Palaeoenvironments of insular Southeast Asia during the Last Glacial Period: a savanna corridor in Sundaland? Quat Sci Rev 24:2228–2242. [Google Scholar]
- Blackman RL, Eastop VF, 2000. Aphids on the World's Crops: An Identification and Information Guide . 2nd edn. Chichester: John Wiley & Sons, Ltd. [Google Scholar]
- Cannon CH, Morley RJ, Bush AB, 2009. The current refugial rainforests of Sundaland are unrepresentative of their biogeographic past and highly vulnerable to disturbance. PNAS 106:11188–11193. [DOI] [PMC free article] [PubMed] [Google Scholar]
- Carine MA, Humphries CJ, Guma IR, Reyes-Betancort JA, Guerra AS, 2009. Areas and algorithms: evaluating numerical approaches for the delimitation of areas of endemism in the Canary Islands archipelago. J Biogeogr 36:593–611. [Google Scholar]
- Casagranda MD, Taher L, Szumik CA, 2009. Endemismo a diferentes escalas espaciales: un ejemplo con Carabidae (Coleoptera: Insecta) de América del Sur austral. Rev Chil Hist Nat 82:17–42. [Google Scholar]
- Casagranda MD, Taher L, Szumik CA, 2012. Endemicity analysis, parsimony and biotic elements: a formal comparison using hypothetical distributions. Cladistics 28:645–654. [DOI] [PubMed] [Google Scholar]
- Casazza G, Minuto L, 2009. A critical evaluation of different methods for the determination of areas of endemism and biotic elements: an Alpine study. J Biogeogr 36:2056–2065. [Google Scholar]
- Chen J, Jiang LY, Qiao GX, 2014. A total‐evidence phylogenetic analysis of Hormaphidinae (Hemiptera: Aphididae), with comments on the evolution of galls. Cladistics 30:26–66. [DOI] [PubMed] [Google Scholar]
- Condamine FL, Toussaint EF, Cotton AM, Genson GS, Sperling FA. et al. , 2013. Fine‐scale biogeographical and temporal diversification processes of peacock swallowtails (Papilio subgenus Achillides) in the Indo‐Australian Archipelago. Cladistics 29:88–111. [DOI] [PubMed] [Google Scholar]
- Cracraft J, 1991. Patterns of diversification within continental biotas: hierarchical congruence among the areas of endemism of Australian vertebrates. Aust Syst Bot 4:211–227. [Google Scholar]
- Cronk QCB, 1997. Islands: stability, diversity, conservation. Biodivers Conserv 6:477–493. [Google Scholar]
- DaSilva MB, Pinto-da-Rocha R, DeSouza AM, 2015. A protocol for the delimitation of areas of endemism and the historical regionalization of the Brazilian Atlantic Rain Forest using harvestmen distribution data. Cladistics 31:692–705. [DOI] [PubMed] [Google Scholar]
- Dennis RLH, Shreeve TG, 2003. Gains and losses of French butterflies: test of predictions, under-recording and regional extinction from data in a new atlas. Biol Cons 110:131–139. [Google Scholar]
- Deo AJ, DeSalle R, 2006. Nested areas of endemism analysis. J Biogeogr 33:1511–1526. [Google Scholar]
- Favre A, Packert M, Pauls SU, Jahnig SC, Uhl D. et al. , 2015. The role of the uplift of the Qinghai-Tibetan Plateau for the evolution of Tibetan biotas. Biol Rev Cambridge Philosophic Soc 90:236–253. [DOI] [PubMed] [Google Scholar]
- Foster W, Northcott P, 1994. Galls and the evolution of social behaviour in aphids In: Williams MAJ, editor. Plant Galls: Organisms, Interactions, Populations. Oxford: Clarendon Press, 161–182. [Google Scholar]
- Ghosh A, 1988. The Fauna of India and the Adjacent Countries.Homoptera, Aphidoidea, Part IV. Phloeomyzinae, Anoeciinae and Hormaphidinae. Calcutta: Technical and General Press. [Google Scholar]
- Glasby CJ, Alvarez B, 1999. Distribution patterns and biogeographic analysis of Austral Polychaeta (Annelida). J Biogeogr 26:507–533. [Google Scholar]
- Hall R, 2009. Southeast Asia's changing palaeogeography. Blumea 54:148–161. [Google Scholar]
- Hausdorf B, Hennig C, 2003. Biotic element analysis in biogeography. Syst Biol 52:717–723. [DOI] [PubMed] [Google Scholar]
- Heie OE, 1980. The Aphidoidea (Hemiptera) of Fennoscandia and Denmark. 1, General Part The Families Mindaridae, Hormaphididae, Thelaxidae, Anoeciidae, and Pemphigidae. Fauna Entomologica Scandinavica 9. Klampenborg: Scandinavian Science Press. [Google Scholar]
- Holt BG, Lessard JP, Borregaard MK, Fritz SA, Araújo MB. et al. , 2013. An Update of Wallace’s Zoogeographic Regions of the World. Science 339:74–78. [DOI] [PubMed] [Google Scholar]
- Hortal J, Lobo JM, Jiménez VA, 2007. Limitations of biodiversity databases: case study on seed-plant diversity in Tenerife, Canary Islands. Conserv Biol 21:853–863. [DOI] [PubMed] [Google Scholar]
- Huang XL, Lei FM, Qiao GX, 2008. Areas of endemism and patterns of diversity for aphids of the Qinghai-Tibetan Plateau and the Himalayas. J Biogeogr 35:230–240. [Google Scholar]
- Jetz W, Rahbek C, Colwell RK, 2004. The coincidence of rarity and richness and the potential signature of history in centres of endemism. Ecol Lett 7:1180–1191. [Google Scholar]
- Kennedy JS, Stroyan HLG, 1959. Biology of aphids. Annu Rev Entomol 4:139–160. [Google Scholar]
- Kier G, Kreft H, Lee TM, Jetz W, Ibisch PL. et al. , 2009. A global assessment of endemism and species richness across island and mainland regions. PNAS 106:9322–9327. [DOI] [PMC free article] [PubMed] [Google Scholar]
- Lippert PC, van Hinsbergen DJJ, Dupont-Nivet G, 2014. Early Cretaceous to present latitude of the central proto-Tibetan Plateau: a paleomagnetic synthesis with implications for Cenozoic tectonics, paleogeography, and climate of Asia. Geol Soc Spec Pap 507:1–21. [Google Scholar]
- Lohman DJ, de Bruyn M, Page T, von Rintelen K, Hal R. et al. , 2011. Biogeography of the Indo-Australian Archipelago. Annu Rev Ecol Evol S 42:205–226. [Google Scholar]
- Matuszak S, Muellner-Riehl AN, Sun H, Favre A, 2015. Dispersal routes between biodiversity hotspots in Asia: the case of the mountain genus Tripterospermum (Gentianinae, Gentianaceae) and its close relatives. J Biogeogr 43:580–590. [Google Scholar]
- Moline PM, Linder HP, 2006. Input data, analytical methods and biogeography of Elegia (Restionaceae). J Biogeogr 33:47–62. [Google Scholar]
- Moran NA, 1988. The evolution of host-plant alternation in aphids: evidence for specialization as a dead end. Am Nat 132:681–706. [Google Scholar]
- Morrone JJ, 1994. On the identification of areas of endemism. Syst Biol 43:438–441. [Google Scholar]
- Morrone JJ, Escalante T, 2002. Parsimony analysis of endemicity (PAE) of Mexican terrestrial mammals at different area units: when size matters. J Biogeogr 29:1095–1104. [Google Scholar]
- Mulch A, Chamberlain CP, 2006. Earth science: the rise and growth of Tibet. Nature 439:670–671. [DOI] [PubMed] [Google Scholar]
- Myers N, Mittermeier RA, Mittermeier CG, da Fonseca GAB, Kent J, 2000. Biodiversity hotspots for conservation priorities. Nature 403:853–858. [DOI] [PubMed] [Google Scholar]
- Orme CDL, Davies RG, Burgess M, Eigenbrod F, Pickup N. et al. , 2005. Global hotspots of species richness are not congruent with endemism or threat. Nature 436:1016–1019. [DOI] [PubMed] [Google Scholar]
- Pike N, Foster W, 2004. Fortress repair in the social aphid species Pemphigus spyrothecae. Anim Behav 67:909–914. [Google Scholar]
- Pisano J, Condamine FL, Lebedev V, Bannikova A, Quéré JP. et al. , 2015. Out of Himalaya: the impact of past Asian environmental changes on the evolutionary and biogeographical history of Dipodoidea (Rodentia). J Biogeogr 42:856–870. [Google Scholar]
- Prado JR, Brennand PG, Godoy LP, Libardi GS, Abreu‐Júnior EF. et al. , 2014. Species richness and areas of endemism of oryzomyine rodents (Cricetidae, Sigmodontinae) in South America: an NDM/VNDM approach. J Biogeogr 42:540–551. [Google Scholar]
- Sánchez-Fernández D, Lobo JM, Abellán P, Ribera I, Millán A, 2008. Bias in freshwater biodiversity sampling: the case of Iberian water beetles. Divers Distrib 14:754–762. [Google Scholar]
- Schluter D, 2000. The Ecology of Adaptive Radiation. New York: Oxford University Press. [Google Scholar]
- Stern DL, Foster WA, 1996. The evolution of soldiers in aphids. Biol Rev Cambridge Philosophic Soc 71:27–79. [DOI] [PubMed] [Google Scholar]
- Swofford DL, 2003. PAUP*: phylogenetic analysis using parsimony. Version 4.0 b10. Massachusetts: Sinauer Associates, Sunderland.
- Szumik CA, Aagesen L, Casagranda D, Arzamendia V, Baldo D. et al. , 2012. Detecting areas of endemism with a taxonomically diverse data set: plants, mammals, reptiles, amphibians, birds, and insects from Argentina. Cladistics 28:317–329. [DOI] [PubMed] [Google Scholar]
- Szumik CA, Cuezzo F, Goloboff PA, Chalup AE, 2002. An optimality criterion to determine areas of endemism. Syst Biol 51:806–816. [DOI] [PubMed] [Google Scholar]
- Szumik CA, Goloboff PA, 2004. Areas of endemism: an improved optimality criterion. Syst Biol 53:968–977. [DOI] [PubMed] [Google Scholar]
- Tang ZY, Fang JY, Chi XL, Feng JM, Liu YN. et al. , 2012. Patterns of plant beta-diversity along elevational and latitudinal gradients in mountain forests of China. Ecography 35:1083–1091. [Google Scholar]
- Thomas C, Mallorie H, 1985. Rarity, species richness and conservation: butterflies of the Atlas Mountains in Morocco. Biol Conserv 33:95–117. [Google Scholar]
- van Welzen PC, Parnell JAN, Slik JWF, 2011. Wallace's Line and plant distributions: two or three phytogeographical areas and where to group Java? Biol J Linn Soc 103:531–545. [Google Scholar]
- von Dohlen CD, Kurosu U, Aoki S, 2002. Phylogenetics and evolution of the eastern Asian - eastern North American disjunct aphid tribe, Hormaphidini (Hemiptera: Aphididae). Mol Phylogenet Evol 23:257–267. [DOI] [PubMed] [Google Scholar]
- Wen J, Zhang J, Nie ZL, Zhong Y, Sun H, 2014. Evolutionary diversifications of plants on the Qinghai-Tibetan Plateau. Front Genet 5:1–16. [DOI] [PMC free article] [PubMed] [Google Scholar]
- Whittaker RJ, Fernández-Palacios JM, 2007. Island Biogeography: Ecology, Evolution, and Conservation. New York: Oxford University Press. [Google Scholar]
- Wool D, 2004. Galling aphids: specialization, biological complexity, and variation. Annu Rev Entomol 49:175–192. [DOI] [PubMed] [Google Scholar]
Associated Data
This section collects any data citations, data availability statements, or supplementary materials included in this article.