Abstract
Regulatory T cells (Treg cells) play a pivotal role in the establishment and maintenance of immunological self-tolerance and homeostasis1,2. Transcriptional programming of regulatory mechanisms facilitates Treg cell functional activation in the prevention of diverse types of inflammatory responses3,4. How Treg cells orchestrate their homeostasis and interplay with environmental signals remains poorly understood. Here we show that liver kinase B1 (LKB1) programs proper metabolic and functional fitness of Treg cells in the control of immune tolerance and homeostasis. Mice with Treg-specific deletion of LKB1 developed a fatal inflammatory disease characterized by excessive TH2-dominant responses. LKB1 deficiency disrupted Treg cell survival and mitochondrial fitness and metabolism, but also induced aberrant expression of immune regulatory molecules including the negative co-receptor PD-1, and TNF receptor (TNRF) superfamily proteins GITR and OX40. Unexpectedly, LKB1 function in Treg cells was independent of conventional AMPK signaling or the mTORC1-HIF-1α axis, but contributed to the activation of β-catenin signaling for the proper control of PD-1 and TNFR proteins. Blockade of PD-1 activity reinvigorated the suppressive capability of LKB1-deficient Treg cells in the repression of TH2 responses and the interplay with thymic stromal lymphopoietin (TSLP)-primed dendritic cells (DCs). Thus, Treg cells employ LKB1 signaling to coordinate their metabolic and immunological homeostasis and to prevent apoptotic and functional exhaustion, thereby orchestrating the balance between immunity and tolerance.
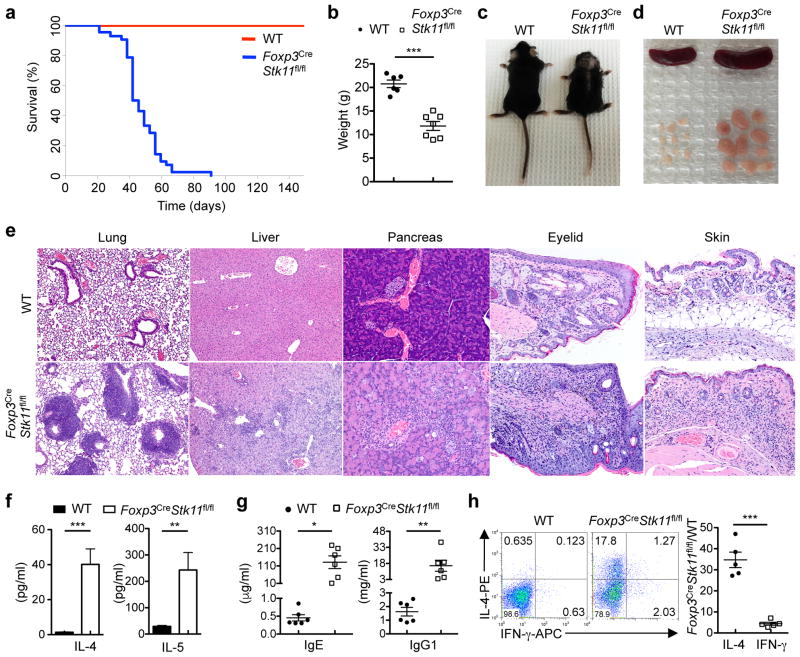
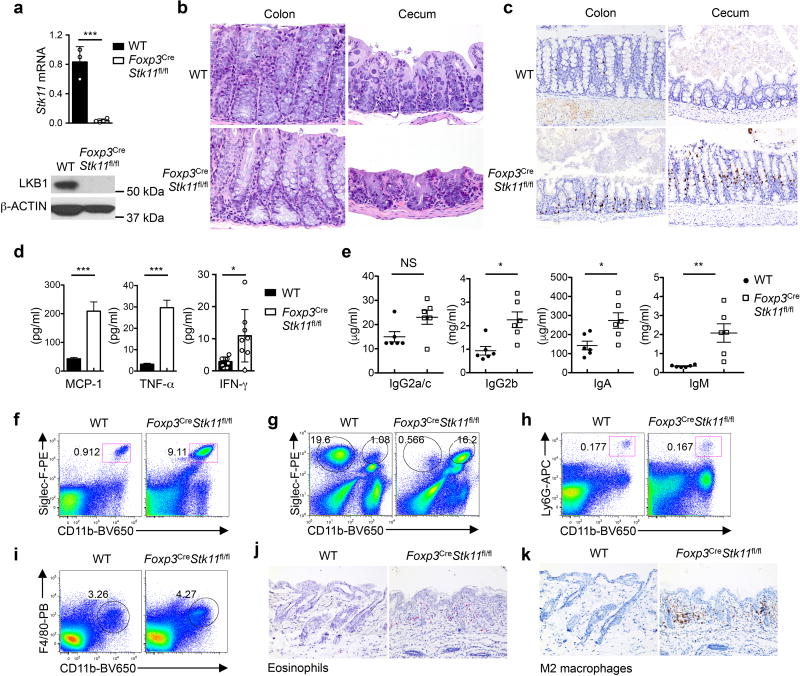
The tumor suppressor liver kinase B1 (LKB1, encoded by Stk11) is a bioenergetic sensor that controls cell metabolism and growth5. To define the role of LKB1 in Treg cells, we crossed mice with loxP-flanked Stk11 alleles (Stk11fl/fl) with Foxp3YFP-Cre (Foxp3Cre) mice6 to specifically delete Stk11 in Treg cells (designated Foxp3CreStk11fl/fl) (Extended Data Fig. 1a). Compared with Foxp3Cre controls (designated as WT), Foxp3CreStk11fl/fl mice had a significantly shorter lifespan (Fig. 1a) and lower body weight (Fig. 1b), and manifested a reduced body size, skin ulceration and crusting of ears and eyelids (Fig. 1c). Moreover, the mutant mice had splenomegaly and lymphadenopathy (Fig. 1d) and infiltration of immune cells in multiple organs (Fig. 1e). Interestingly, despite largely normal morphology of the colon and cecum in Foxp3CreStk11fl/fl mice (Extended Data Fig. 1b), these organs had notable accumulation of interepithelial mucosal mast cells (ieMMCs)7 (Extended Data Fig. 1c). The development of a fatal inflammatory disease in Foxp3CreStk11fl/fl mice suggests a crucial role of LKB1 in Treg cells.
Figure 1. Foxp3CreStk11fl/fl mice spontaneously develop a TH2-dominant inflammatory disease.
a, Survival curve of WT (n = 10) and Foxp3CreStk11fl/fl mice (n = 42; P < 0.0001). b, Gross body weight of WT (n = 6) and Foxp3CreStk11fl/fl mice (n = 7). c, Representative images of WT and Foxp3CreStk11fl/fl mice. d, e, Representative images of the spleen and peripheral lymph nodes (d) or hematoxylin and eosin staining of the lung (original magnification, ×10), liver (×10), pancreas (×20), eyelid (×40) and skin (×20) (e). f, Quantification of serum IL-4 and IL-5 from WT and Foxp3CreStk11fl/fl mice (n = 11 each group). g, Quantification of serum IgE and IgG1 from WT and Foxp3CreStk11fl/fl mice (n = 6 each group). h, Expression of IL-4 and IFN-γ in CD4+ T cells from young mice (approximately 16 days old). Right, fold changes of IL-4- or IFN-γ-producing CD4+ T cells from Foxp3CreStk11fl/fl mice versus WT counterparts (n = 5 each group). Data are representative of one (a), two (b–g) or at least three (h) independent experiments. Data are mean ± s.e.m. P values are determined by Logrank test (a), or two-tailed Student’s t-test (b, f–h). *P < 0.05, **P < 0.005, ***P < 0.0005. Numbers in quadrants indicate percentage of cells.
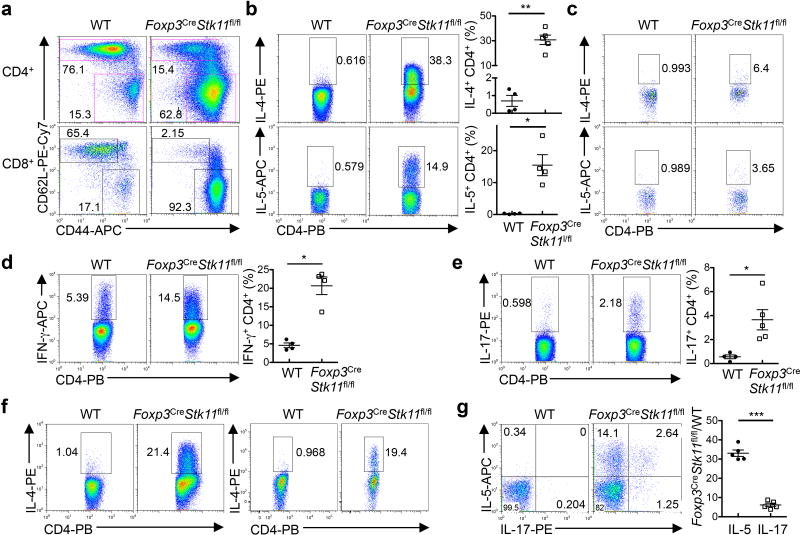
Among serum cytokines, IL-4 and IL-5 were markedly elevated in Foxp3CreStk11fl/fl mice (Fig. 1f). MCP-1, TNF-α and IFN-γ were also increased (Extended Data Fig. 1d). The titers of serum IgE and IgG1 (Fig. 1g) were much higher in Foxp3CreStk11fl/fl mice than controls, while IgG2a/c, IgG2b, IgA and IgM levels were modestly upregulated (Extended Data Fig. 1e). Moreover, Foxp3CreStk11fl/fl mice had an increased frequency of eosinophils in the spleen and lung (Extended Data Fig. 1f, g), but normal populations of splenic neutrophils and macrophages (Extended Data Fig. 1h, i). Histological analysis revealed markedly increased eosinophils and Ym1+ M2 macrophages in the skin of Foxp3CreStk11fl/fl mice (Extended Data Fig. 1j, k). Compared to WT controls, T cells in Foxp3CreStk11fl/fl mice showed the memory/effector phenotype (CD44hiCD62Llo) (Extended Data Fig. 2a), with a large number of CD4+ T cells, including Treg cells, expressing the TH2 cytokines IL-4 and IL-5 (Extended Data Fig. 2b, c). IFN-γ and IL-17 expression was also elevated, but to a lesser extent (Extended Data Fig. 2d, e). Moreover, CD4+ T cells from the lung and colonic lamina propria of Foxp3CreStk11fl/fl mice upregulated IL-4 (Extended Data Fig. 2f). These abnormal type 2 immune responses were observed even in CD4+ T cells from young Foxp3CreStk11fl/fl mice (Fig. 1h and Extended Data Fig. 2g), while Foxp3CreStk11fl/+ mice showed normal immune homeostasis (data not shown). These results reveal an excessive TH2-dominant inflammatory disorder in Foxp3CreStk11fl/fl mice.
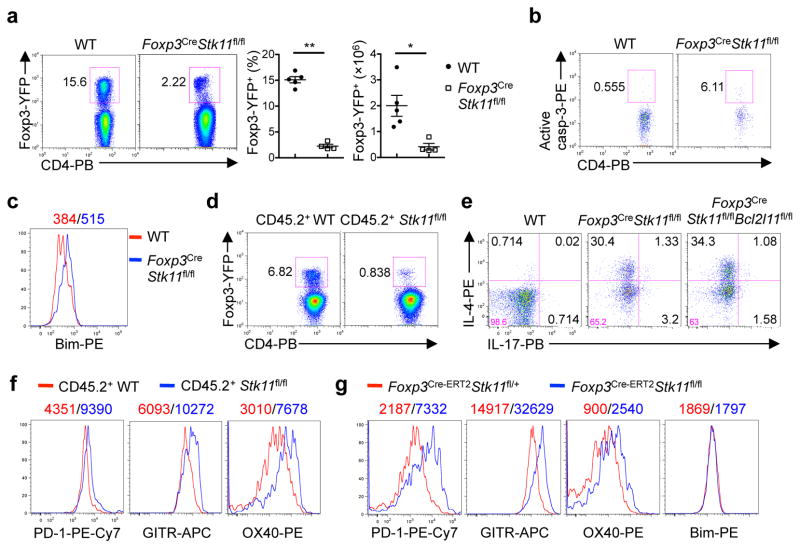
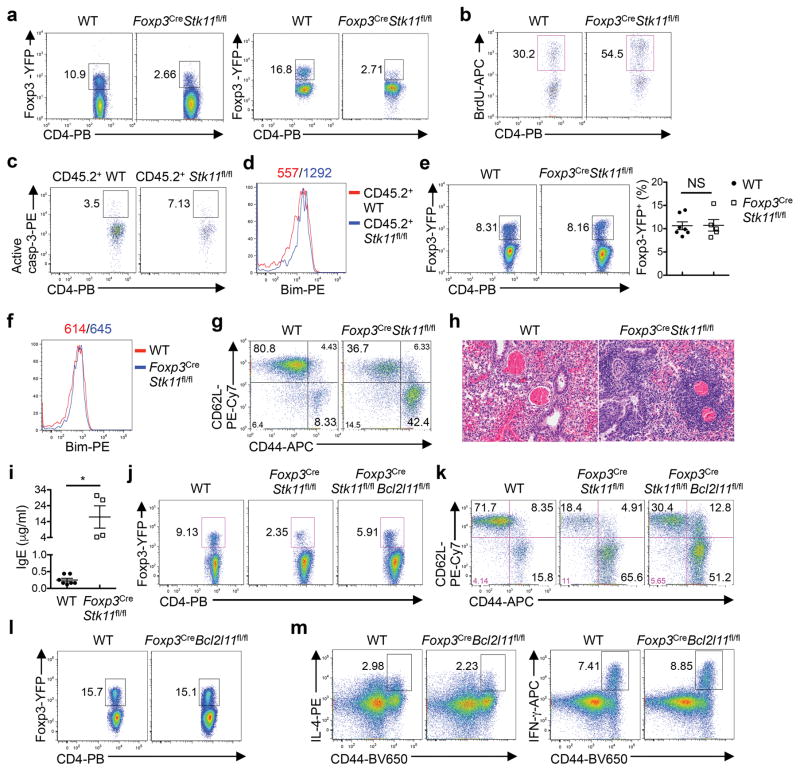
The Treg cell compartment was reduced in percentage and cellularity in Foxp3Cre-Stk11fl/fl mice (Fig. 2a and Extended Data Fig. 3a). LKB1-deficient Treg cells showed elevated 5-bromodeoxyuridine (BrdU) incorporation (Extended Data Fig. 3b), but also higher levels of caspase-3 activity (Fig. 2b) and expression of Bim (Fig. 2c). The survival defects were observed in LKB1-deficient Treg cells from the mixed bone marrow (BM) chimeras (Fig. 2d and Extended Data Fig. 3c, d), indicating cell-intrinsic effects. Interestingly, Foxp3CreStk11fl/fl mice at 2 weeks old had a largely normal proportion of Treg cells (Extended Data Fig. 3e) with normal expression of Bim (Extended Data Fig. 3f). Nonetheless, activation of T cells, infiltrations of immune cells into the lung, and elevation of serum IgE were appreciable in these mice (Extended Data Fig. 3g–i). Depletion of Bim (encoded by Bcl2l11) in LKB1-deficient Treg cells substantially restored Treg cell cellularity (Extended Data Fig. 3j), but Foxp3CreStk11fl/flBcl2l11fl/fl mice still had elevated frequencies of CD44hiCD62Llo (Extended Data Fig. 3k) and IL-4-producing CD4+ T cells (Fig. 2e), compared with WT or Foxp3CreBcl2l11fl/fl mice (Extended Data Fig. 3l, m). These results identify important roles of LKB1 in mediating both Treg cell survival and function.
Figure 2. LKB1 controls Treg cell survival and expression of selective co-receptors PD-1, GITR and OX40.
a, Treg cells from WT and Foxp3CreStk11fl/fl mice. Right, proportion and number of Treg cells (WT n = 5; Foxp3CreStk11fl/fl n = 4). b, c, Caspase-3 activity (b) and Bim expression (c) in Treg cells. d, Donor WT and Foxp3CreStk11fl/fl Treg cells from mixed BM chimeras. e, IL-4- and IL-17-producing CD4+ T cells from the indicated mice. f, PD-1, GITR and OX40 expression on Treg cells in d. g, PD-1, GITR, OX40, and Bim expression in WT Treg cells and Treg cells with acute deletion of LKB1. Data are representative of at least three (a–g) independent experiments. Data are mean ± s.e.m. P values are determined by Mann-Whitney test (a, cell proportion) or two-tailed Student’s t-test (a, cell number). *P < 0.05, **P < 0.005. Numbers above graphs indicate the mean fluorescence intensity; numbers in quadrants or gates indicate percentage of cells.
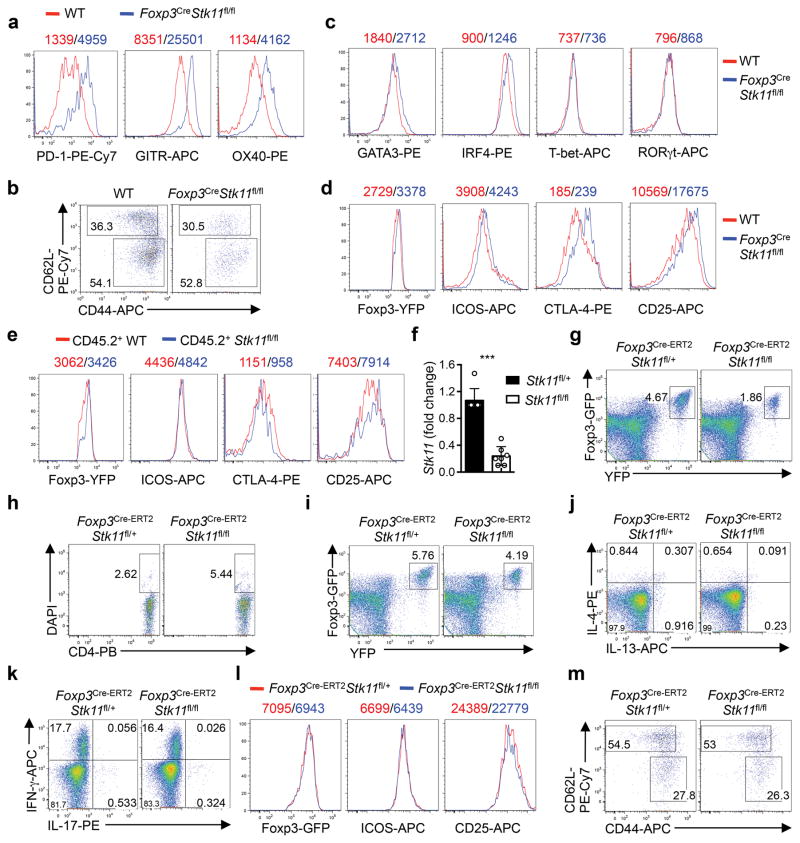
The regulatory function is closely associated with signature molecules expressed by Treg cells1,2. The negative co-receptor PD-1 and TNFR superfamily proteins GITR and OX40 were markedly elevated on LKB1-deficient Treg cells from Foxp3CreStk11fl/fl mice (Extended Data Fig. 4a) and mixed BM chimeras (Fig. 2f), indicating cell-autonomous effects. In contrast, WT and LKB1-deficient Treg cells had largely comparable or slightly altered expression of CD62L, CD44 (Extended Data Fig. 4b), GATA3, IRF4, T-bet, RORγt (Extended Data Fig. 4c), Foxp3, ICOS, CTLA-4, and CD25 (Extended Data Fig. 4d, e). The co-receptors PD-1, GITR and OX40 have been implicated in the control of Treg cell function and generation8–13. To examine whether LKB1 directly regulates these Treg signatures in mature Treg cells, we generated Foxp3GFP-Cre-ERT2Stk11fl/flRosa26YFP mice (designated Foxp3Cre-ERT2Stk11fl/fl mice) to delete Stk11 in Treg cells upon tamoxifen treatment14 (Extended Data Fig. 4f). Longer duration of LKB1 loss dimished Treg cells (Extended Data Fig. 4g), associated with increased cell death (Extended Data Fig. 4h), while Treg cells with acute deletion of LKB1 maintained intact homeostasis (Extended Data Fig. 4i) and Bim expression (Fig. 2g). In this setting of inflammation-free environment (Extended Data Fig. 4j, k), loss of LKB1 upregulated PD-1, GITR and OX40 (Fig. 2g), without affecting Foxp3, ICOS and CD25 (Extended Data Fig. 4l) or the distribution of resting and activated Treg subsets (Extended Data Fig. 4m). Collectively, LKB1 acts in a cell-autonomous and direct manner to suppress a select group of Treg signature molecules.
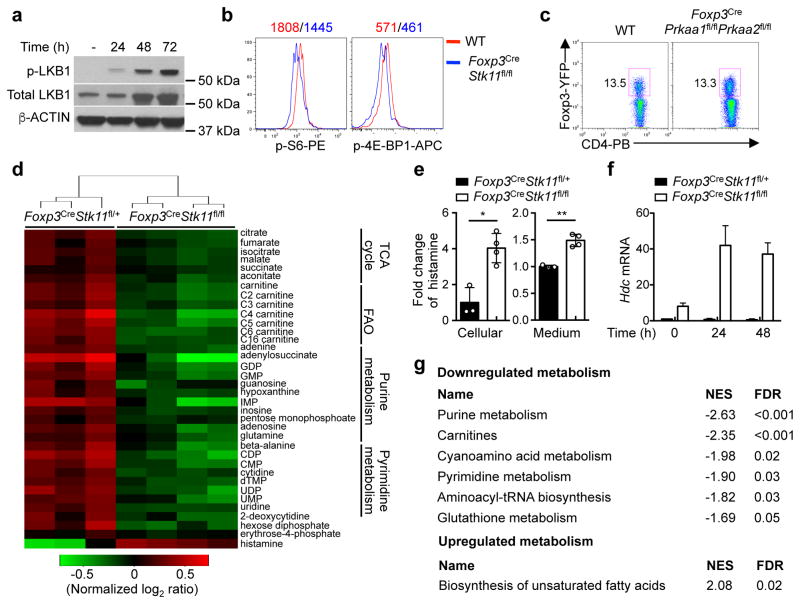
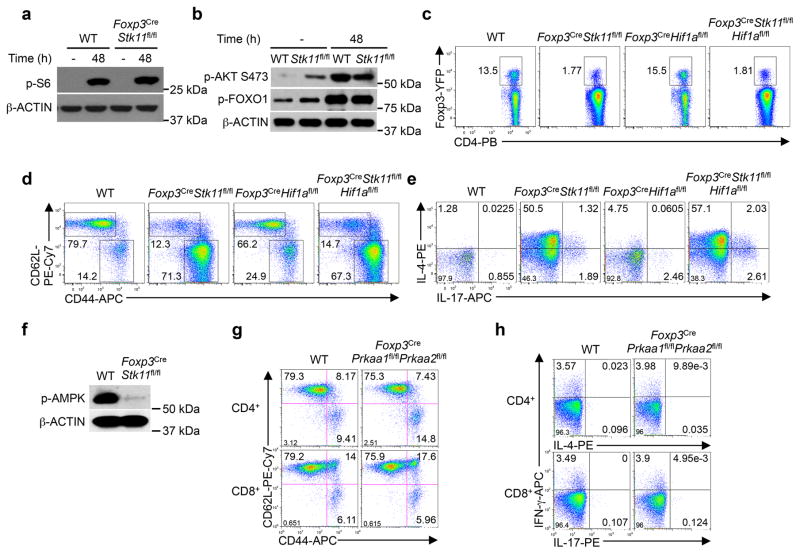
Continuous T cell receptor (TCR) signaling fuels Treg cell function in maintaining immune tolerance15,16. Stimulation of Treg cells with anti-CD3 and anti-CD28 (α-CD3-CD28) resulted in LKB1 phosphorylation and modestly increased LKB1 expression (Fig. 3a). mTORC1 and HIF-1α are important effector pathways aberrantly upregulated in LKB1-deficient cancer cells and conventional T cells17,18. Unexpectedly, Foxp3CreStk11fl/fl Treg cells had slightly reduced mTORC1 activity under steady state (Fig. 3b) and largely normal phosphorylation of S6, AKT (S473) and FOXO1 upon α-CD3-CD28 stimulation (Extended Data Fig. 5a, b). Additionally, depletion of HIF-1α in LKB1-deficient Treg cells failed to rescue the defective Treg cell homeostasis or the inflammatory disorder (Extended Data Fig. 5c–e). 5′AMP-activated protein kinase (AMPK) is a well-documented substrate of LKB15, the activation of which was lost in LKB1-deficient Treg cells (Extended Data Fig. 5f). Nonetheless, deletion of AMPKα1 and AMPKα2 in Treg cells did not affect Treg cell proportion or immmune homeostasis (Fig. 3c and Extended Data Fig. 5g, h). Altogether, LKB1 is activated by TCR signaling in Treg cells but functions independently of mTORC1-HIF-1α axis and AMPK signaling.
Figure 3. LKB1 regulates Treg cell metabolism through connecting immune signals and mitochondrial function.
a, Phosphorylation and expression of LKB1 in resting and activated Treg cells. b, Phosphorylation of S6 and 4E-BP1 in resting Treg cells. c, Treg cells from WT and Foxp3CrePrkaa1fl/flPrkaa2fl/fl mice. d, Heat maps of differentially expressed intracellular metabolites and unsupervised hierarchical clustering (Foxp3CreStk11fl/+ n = 3; Foxp3CreStk11fl/fl n = 4). e, Relative abundance of histamine in the cells and culture medium in d (Foxp3CreStk11fl/+ n = 3; Foxp3CreStk11fl/fl n = 4). f, Hdc mRNA in resting and activated Treg cells. g, Metabolite set enrichment of the downregulated and upregulated metabolic pathways in Foxp3CreStk11fl/fl Treg cells (false discovery rate, FDR, ≤ 0.05). NES, normalized enrichment score. Data are representative of two (a–c), one (d, e, g) or three (f) independent experiments. Data are mean ± s.e.m. P values are determined by two-tailed Student’s t-test (e). *P < 0.01, **P < 0.001. Numbers above graphs indicate the mean fluorescence intensity; numbers in gates indicate percentage of cells. For gel source data, see Supplementary Figure 1.
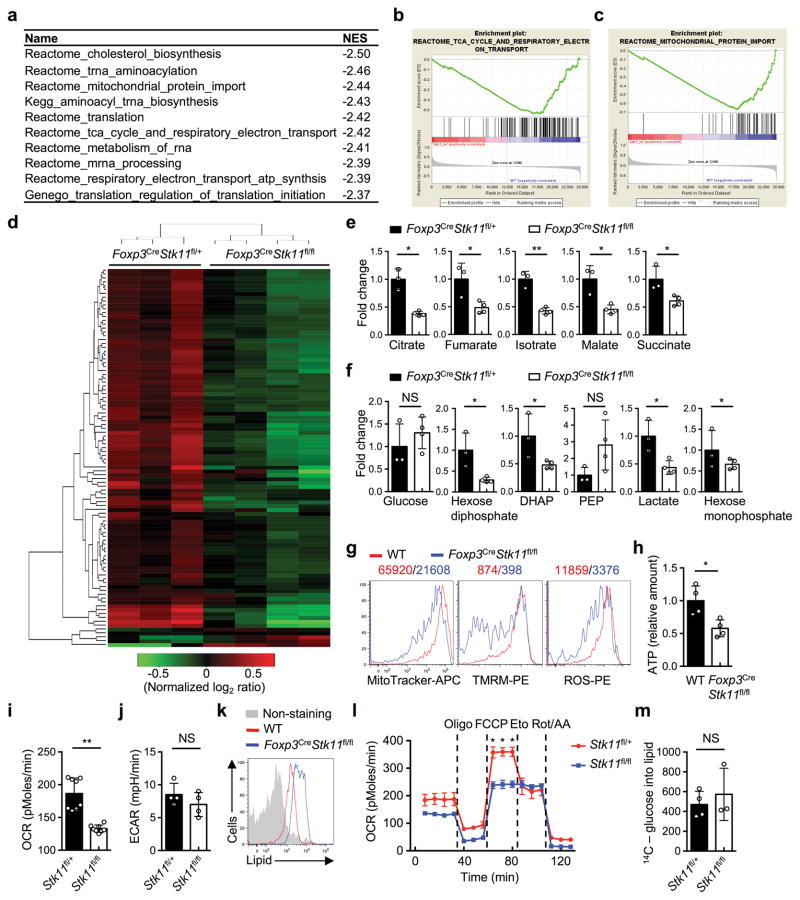
In the transcriptome of WT and LKB1-deficient Treg cells from the mixed BM chimeras, gene set enrichment analysis (GSEA) showed that LKB1 deficiency impaired gene expression implicated in multiple metabolic pathways (Extended Data Fig. 6a), including tricarboxylic acid (TCA) cycle and mitochondrial protein import (Extended Data Fig. 6b, c). Unbiased metabolomic profiling in activated Foxp3CreStk11fl/fl Treg cells (Extended Data Fig. 6d and Extended Data Table 1) revealed a profound reduction of metabolic intermediates associated with mitochondrial function including TCA cycle and fatty acid β-oxidation (FAO), as well as those in purine and pyrimidine metabolism, while metabolites in glycolysis were not uniformly altered (Fig. 3d and Extended Data Fig. 6e, f). Interestingly, histamine was increased in LKB-deficient Treg cells (Fig. 3e). Histidine decarboxylase (HDC), an enzyme to convert histidine to histamine, was increased in LKB1-deficient Treg cells (Fig. 3f). As histamine has been implicated in suppressing Treg cell function19, an increased production of histamine in LKB-deficient Treg cells could contribute to their defects in an autocrine manner. Metabolite set enrichment analysis indicated that LKB1 deficiency in Treg cells downregulated multiple metabolic programs, but upregulated the pathway for biosynthesis of unsaturated fatty acids (Fig. 3g). LKB1-deficient Treg cells had defective mitochondrial fitness, indicated by reduced mitochondrial mass, mitochondrial membrane potential, and reactive oxygen species (ROS) (Extended Data Fig. 6g), associated with diminished intracellular ATP (Extended Data Fig. 6h). LKB1 deletion reduced oxygen consumption rate (OCR) (Extended Data Fig. 6i) without significantly affecting extracellular acidification rate (ECAR) (Extended Data Fig. 6j), further supporting impaired mitochondrial function. Furthermore, LKB1-deficient Treg cells showed a notable accumulation of lipids (Extended Data Fig. 6k), associated with defective FAO (Extended Data Fig. 6l) but normal lipogenesis (Extended Data Fig. 6m). Therefore, LKB1 orchestrates proper metabolic rewiring and mitochondrial function in Treg cells.
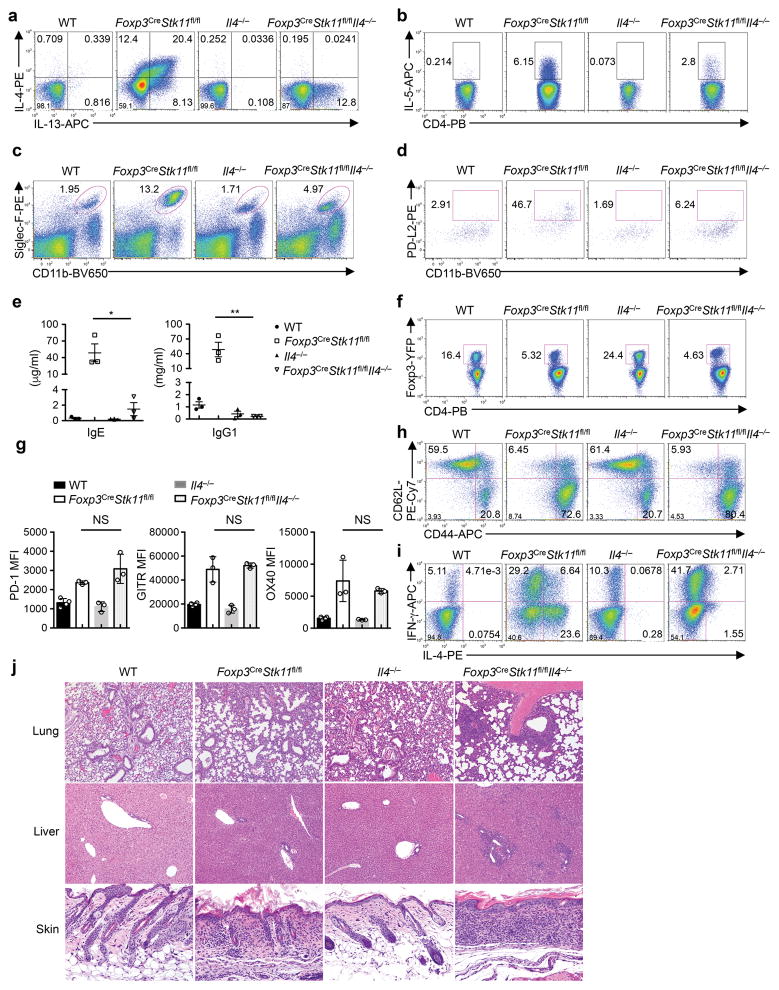
We next explored the cellular processes underlying excessive TH2 responses in Foxp3CreStk11fl/fl mice. Deletion of IL-4 partly rescued TH2 responses in Foxp3CreStk11fl/fl mice, as indicated by partially mitigated proportions of IL-13- and IL-5-producing CD4+ T cells, accumulation of eosinophils and PD-L2+ DCs that are associated with TH2 responses20, and production of serum IgE and IgG1 (Extended Data Fig. 7a–e). However, Treg cell compartment remained defective in Foxp3CreStk11fl/flIl4−/− mice, as indicated by a reduced Treg proportion (Extended Data Fig. 7f) and aberrant PD-1, GITR and OX40 expression (Extended Data Fig. 7g). Moreover, these mice had increased proportions of CD44hiCD62Llo memory/effector cells and IFN-γ-producing CD4+ T cells and extensive inflammation in various organs (Extended Data Fig. 7h–j). Collectively, these results indicate that IL-4 contributes to amplifying TH2 responses in Foxp3CreStk11fl/fl mice, but is not responsible for the failures in immune tolerance.
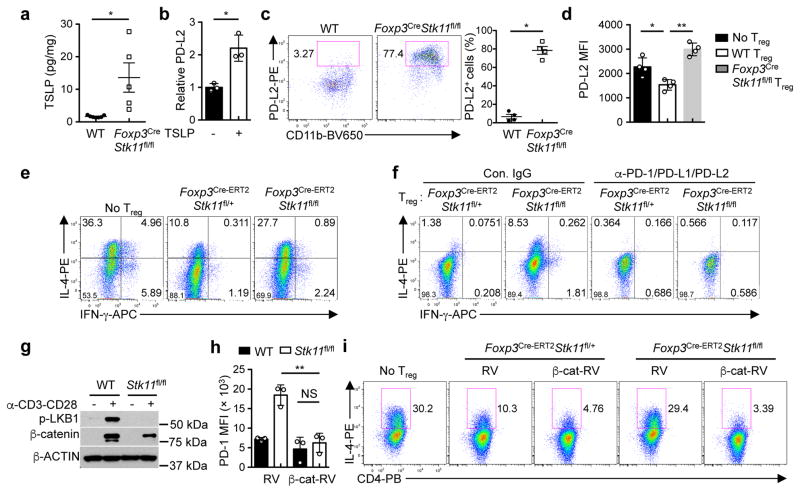
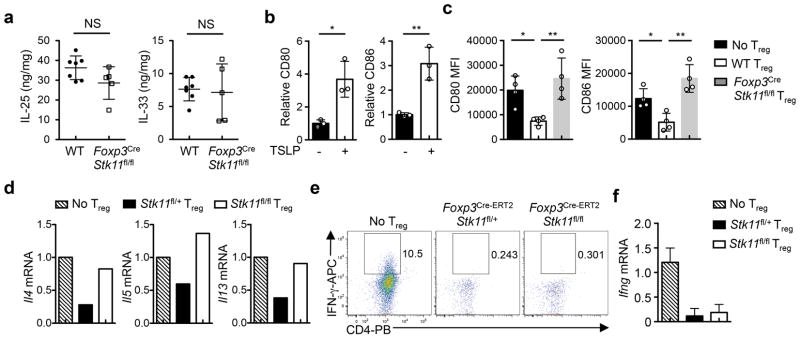
Thymic stromal lymphopoietin (TSLP), a key cytokine produced by epithelial cells, polarizes DCs to drive allergic inflammation21. Foxp3CreStk11fl/fl mice had elevated production of TSLP in the lung (Fig. 4a), but normal expression of IL-25 and IL-33 (Extended Data Fig. 8a). TSLP upregulated expression of PD-L220 (Fig. 4b), CD80 and CD86 on DCs (Extended Data Fig. 8b). DCs from Foxp3CreStk11fl/fl mice had aberrant upregulation of PD-L2 (Fig. 4c), suggesting that LKB1-deficient Treg cells fail to control maturation of PD-L2+ DCs. In support of this notion, WT Treg cells inhibited the induction of PD-L2, CD80 and CD86 on DCs primed with TSLP (TSLP-DCs), whereas LKB1-deficient Treg cells did not (Fig. 4d and Extended Data Fig. 8c). Furthermore, TSLP-DCs polarized the differentiation of naïve CD4+ T cells into TH2 cells, which was effectively suppressed by WT but not LKB1-deficient Treg cells (Fig. 4e and Extended Data Fig. 8d). In contrast, LKB1-sufficient and -deficient Treg cells were equally capable of suppressing TH1 cell differentiation driven by LPS-primed DCs (Extended Data Fig. 8e, f). Therefore, Treg cells require LKB1 to repress maturation of TSLP-DCs and subsequent induction of TH2 responses.
Figure 4. LKB1-β-catenin axis enforces Treg-mediated suppression of TH2 responses through the control of PD-1 expression.
a, Production of TSLP in the lung (WT n = 7; Foxp3CreStk11fl/fl n = 5). b, Fold change of PD-L2 expression on DCs with or without TSLP stimulation (n = 3 each group). c, CD11b+PD-L2+ DCs from WT and Foxp3CreStk11fl/fl mice. Right, proportion of PD-L2+ DCs (n = 4 each group). d, Mean fluorescence intensity (MFI) of PD-L2 expression on DCs (with TSLP) cultured alone, or together with WT or Foxp3CreStk11fl/fl Treg cells (n = 4 each group). e, Expression of IL-4 and IFN-γ in CD4+ T cells cocultured with TSLP-DCs alone, or together with Foxp3Cre-ERT2Stk11fl/+ or Foxp3Cre-ERT2Stk11fl/fl Treg cells. f, Expression of IL-4 and IFN-γ in CD4+ T cells cocultured with TSLP-DCs and Foxp3Cre-ERT2Stk11fl/+ or Foxp3Cre-ERT2Stk11fl/fl Treg cells in the presence of control IgG or indicated blocking antibodies. g, Phosphorylation of LKB1 and expression of β-catenin in resting and activated Treg cells. h, MFI of PD-1 expression on Treg cells transduced with control retrovirus (RV) or mutant β-catenin-expressing retrovirus (β-cat-RV) (n = 3 each group). i, Expression of IL-4 in CD4+ T cells cocultured with TSLP-DCs, or together with RV- or β-cat-RV-transduced Treg cells. Data are representative of at least two (a–i) independent experiments. Data are mean ± s.e.m. P values are determined by two-tailed Student’s t-test (a, b), Mann-Whitney test (c) or one-way ANOVA (d, h). NS, not significant; *P < 0.05, **P < 0.005. Numbers in quadrants or gates indicate percentage of cells.
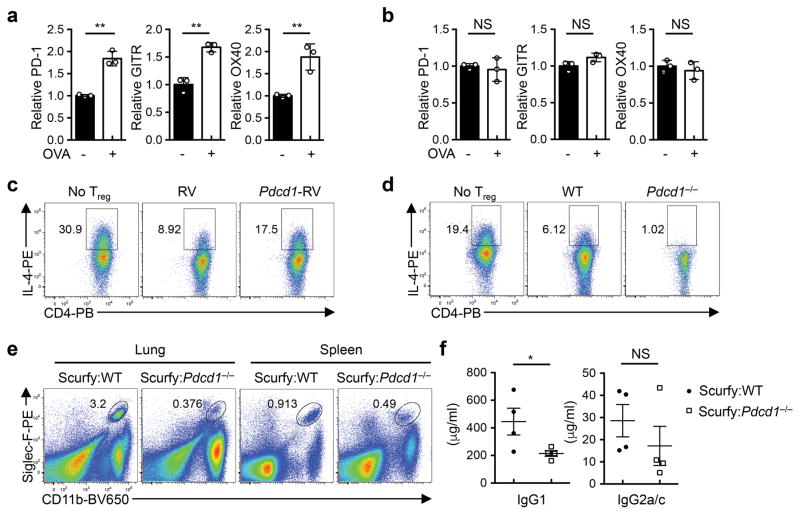
To test the physiological relevance of LKB1-mediated regulatory mechanisms in TH2 responses, we examined the expression of PD-1, GITR and OX40 on Treg cells from mice challenged with ovalbumin (OVA)-induced allergic airway inflammation. OVA inhalation elicited the expression of these factors on Treg cells in the lung (Extended Data Fig. 9a), but not those in the spleen (Extended Data Fig. 9b). Given the unique and potent roles of PD-1 in T cells for immune modulation and therapy22, we hypothesized that aberrant induction of PD-1 on LKB1-deficient Treg cells disrupts their function in suppressing TH2 responses. We tested this hypothesis using gain- and loss-of-function approaches. First, ectopic expression of PD-1 impaired the capability of Treg cells in suppressing TH2 cell differentiation (Extended Data Fig. 9c). Second, PD-1 deficiency promoted Treg-mediated suppression of TH2 responses (Extended Data Fig. 9d). Third, to examine the function of PD-1-deficient Treg cells in vivo, we generated mixed BM chimeras using BM cells from Treg-deficient Scurfy mice, together with those from WT or Pdcd1−/− mice. Scurfy:Pdcd1−/− chimeras had reduced proportion of lung and spleen eosinophils (Extended Data Fig. 9e) and concentration of serum IgG1 (Extended Data Fig. 9f), but normal concentration of IgG2a/c (Extended Data Fig. 9f). Finally, blocking PD-1 and its ligands largely reversed the defect of LKB1-deficient Treg cells in suppressing TH2 cell differentiation (Fig. 4f). Therefore, LKB1 restrains PD-1 expression as an important mechanism to ensure the functional integrity of Treg cells in repressing TH2 responses.
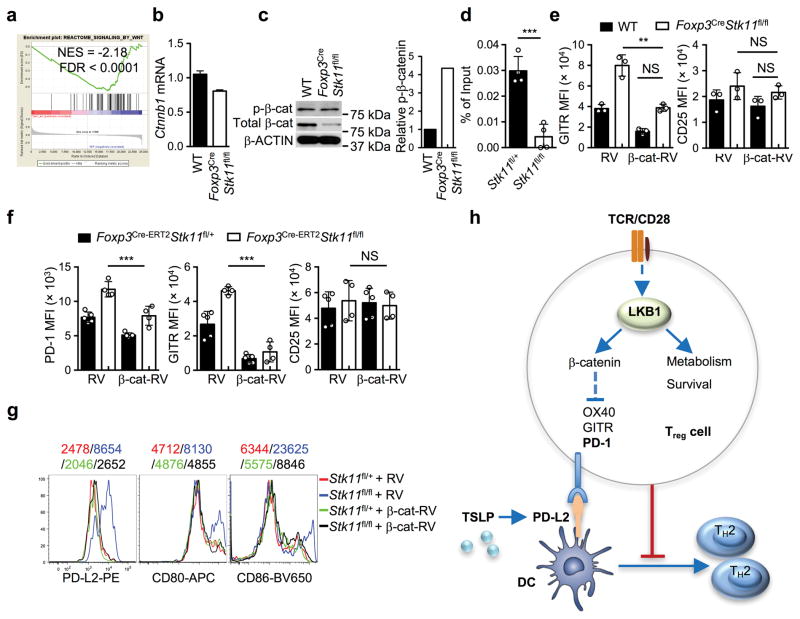
How does LKB1 regulate PD-1 and other Treg signature molecules? Wnt signaling, which is implicated in TH2-mediated inflammation23 and Treg cell survival and function24,25, was significantly underrepresented in gene sets from LKB1-deficient Treg cells (Extended Data Fig. 10a). Activated WT Treg cells upregulated the expression of β-catenin, a key mediator of Wnt signaling, while the induction was attenuated in LKB1-deficient Treg cells (Fig. 4g). Aside from the modestly reduced β-catenin (Ctnnb1) mRNA (Extended Data Fig. 10b), LKB1-deficient Treg cells had increased phosphorylation of β-catenin that mediates its degradation (Extended Data Fig. 10c). Moreover, β-catenin bound to a T-cell factor 3 (TCF3) motif in the Pdcd1 locus in WT Treg cells, but this binding was lost in LKB1-deficient Treg cells (Extended Data Fig. 10d). Expression of constitutively active β-catenin by retrovirus (β-cat-RV) restored the aberrant expression of PD-1 and GITR on LKB1-deficient Treg cells (Fig. 4h and Extended Data Fig. 10e), but did not affect CD25 expression (Extended Data Fig. 10e) or survival of Treg cells (data not shown). Similar rescue effects were observed in β-catenin-expressing Treg cells after acute deletion of LKB1 (Extended Data Fig. 10f). Moreover, β-cat-RV substantially rectified the defects of LKB1-deficient Treg cells in suppressing DC expression of PD-L2, CD80 and CD86 (Extended Data Fig. 10g) and TH2 cell differentiation polarized by TSLP-DCs (Fig. 4i). Collectively, these results indicate an important role of the LKB1-β-catenin axis in the control of TH2 responses through modulating PD-1 and Treg cell signature molecules.
Emerging studies highlight the importance of metabolic reprogramming in immune cell activation and differentiation26, but how metabolism and immune function are integrated and especially homeostatic control mechanisms remain poorly defined. Here we identify LKB1 as a crucial checkpoint to maintain Treg cell survival and function through coordinating metabolic and functional fitness of Treg cells (Extended Data Fig. 10h). LKB1 connects immunological signals and cellular metabolism especially mitochondrion-related functions. Furthermore, LKB1 curtails the aberrant induction of PD-1, GITR and OX40 in a β-catenin dependent manner, and blockade of PD-1 signaling reinvigorates the ability of LKB1-deficient Treg cells in the repression of TH2 responses. PD-1 upregulation and metabolic alteration have long been observed in exhausted CD8+ T cells27, and increasing eveidence reveals the interplay between immune checkpoints and cell metabolism28–30. Our results suggest that Treg cells not only exist at a resting or activated state1, but could also undergo functional exhaustion. Given the constitutive expression of the epithelial cytokine TSLP and the ensuing stimulation of DCs at the environmental interface, Treg cells require LKB1 to actively maintain their metabolic and immunological homoeostasis, the loss of which results in the apoptotic and functional exhaustion of Treg cells. Our findings point to a previously unrecognized mechanism enforcing homeostatic control of Treg cells, and provide a framework to further understand integration of metabolic signaling and lymphocyte fate and state.
Methods
Mice
C57BL/6, CD45.1+, Stk11fl/fl, Bcl2l11fl/fl, Hif1afl/fl, Prkaa1fl/fl, Prkaa2fl/fl, Rag1−/−, Il4−/−, Pdcd1−/−, and ROSA26YFP reporter (a loxP-site-flanked STOP cassette followed by the YFP-encoding sequence inserted into the ROSA26 locus) mice were purchased from the Jackson Laboratory. Foxp3YFP-Cre and Foxp3Cre-ERT2 mice were gifts from A. Rudensky6,14. Foxp3CreStk11fl/fl mice were used at 3–5 weeks old unless otherwise noted, with the age and gender-matched WT mice containing the Foxp3Cre allele as controls. Other mice were used at 8–10 weeks old unless otherwise noted. BM chimeras were generated by transferring 1 × 10⁷ T cell-depleted BM cells into sub-lethally irradiated (5.5 Gy) Rag1−/− mice, followed by reconstitution for at least 2 months. For tamoxifen administration, mice were injected intraperitoneally with tamoxifen (2 mg per mouse) in corn oil every other day for 6 times, and then analyzed 6–7 days after the last injection (unless otherwise noted). All mice were kept in a specific pathogen-free facility in the Animal Resource Center at St. Jude Children’s Research Hospital, and animal protocols were approved by the Institutional Animal Care and Use Committee.
Flow cytometry
For analysis of surface markers, cells were stained in PBS containing 2% (wt/vol) BSA, with anti-CD4 (RM4-5), anti-CD8α (53–6.7), anti-TCRβ (H57-597), anti-CD25 (PC61.5), anti-CD44 (1M7), anti-CD62L (MEL-14), anti-CD45.1 (A20), anti-CD45.2 (104), anti-ICOS (C398.4A), anti-GITR (DTA-1), anti-OX40 (OX-86), anti-PD-1 (J43), anti-MHC-II (M5/114.15.2), anti-CD11b (M1/70), anti-PD-L2 (122), anti-CD11c (N418), anti-Ly6G (RB6-8C5; all from eBioscience), anti-Siglec-F (E50-2440; BD Biosciences), and anti-F4/80 (BM8; BioLegend). Intracellular Foxp3 (FJK-16s), GATA3 (TWAJ), IRF4 (3E4), RORγt (AFKJS-9), IFN-γ (XMG1.2), IL-4 (11B11), IL-5 (TRFK5), IL-13 (eBio13A), IL-17 (17B7; all from eBioscience); T-bet (4B10), CTLA-4 (UC10-4B9; BioLegend), and Bim (C34C5; Cell Signaling Technology) were analyzed by flow cytometry according to the manufacturer’s instructions. For detection of phosphorylated signaling proteins, lymphocytes were rested in complete medium for 1 h. They were fixed with Phosflow Lyse/Fix buffer, followed by permeabilization with Phosflow Perm buffer III (BD Biosciences) and staining with antibodies to S6 phosphorylated at Ser 235 and Ser 236 (D57.2.2E; Cell Signaling Technology), 4E-BP1 phosphorylated at Thr 37 and Thr 46 (236B4; Cell Signaling Technology). For intracellular cytokine staining, T cells were stimulated for 4 h with PMA plus ionomycin in the presence of monensin before being stained according to the manufacturer’s instructions (eBioscience). BrdU and active caspase-3 staining was performed according to the manufacturer’s instruction (BD Biosciences). For measurement of mitochondrial mass, potential and ROS, Treg cells were incubated for 30 min at 37°C with 10 nM MitoTracker Deep Red (Life Technologies), 20 nM TMRM (tetramethyl rhodamine, methyl ester; ImmunoChemistry Technologies) or 5 μM MitoSOX Red (Life Technologies), before staining surface markers. Neutral lipid droplets in Treg cells were stained with HCS LipidTOX™ Deep Red Neutral Lipid Stain according to the manufacturer’s instruction (ThermoFisher Scientific). Flow cytometry data were acquired on LSRII or LSR Fortessa (BD Biosciences) and analyzed using Flowjo software (Tree Star).
Cell purification and culture
Naïve CD4+ T cells (CD4+CD62L+CD44loCD25−) and splenic DCs (Lin−CD11c+MHC-II+) from C57BL/6 mice and Treg cells (CD4+YFP+) from WT and Foxp3CreStk11fl/fl mice were sorted on a MoFlow (Beckman-Coulter) or Reflection (i-Cyt). Naïve CD4+ T cells, DCs, and Treg cells were cultured in Click’s medium (plus β-mercaptoethanol) supplemented with 10% (vol/vol) FBS and 1% (vol/vol) penicillin-streptomycin. For cell activation, Treg cells were activated with plate-coated anti-CD3 (5 μg/ml; 2C11; Bio X Cell) and anti-CD28 (5 μg/ml; 37.51; Bio X Cell) for the indicated time points. For T cell differentiation in vitro, splenic DCs from C57BL/6 mice were stimulated with TSLP31 (10 ng/ml) or LPS (50 ng/ml) for 18 h, and then washed with HBSS containing 2% FBS twice before coculturing with naïve CD4+ T cells and Treg cells in the presence of 1 μg/ml CD3 antibody for additional 5 days. To block PD-1 signaling, control IgG (30 μg/ml) or mixture of blocking antibodies against PD-1 (10 μg/ml; J43; eBioscience), PD-L1 (10 μg/ml; MIH5; eBioscience), and PD-L2 (10 μg/ml; TY25; eBioscience) were added. At the end of culture, viable cells were purified using Ficoll and stimulated for 4 h with PMA plus ionomycin in the presence of monensin before intracellular staining of cytokines. Constitutively active β-catenin constructs32 were generated by PCR and cloned into the mouse stem cell virus retroviral vector. Retroviral packaging and transduction were performed as described previously33.
RNA and immunoblot analysis
Real-time PCR analysis was performed with probe sets Stk11 (Mm00488473_g1), Hdc (Mm00456104_m1), Ctnnb1 (Mm00483039_m1), and Actb (Mm00607939_s1) (all from ThermoFisher Scientific). Immunoblots were performed and quantified as described previously34, using the following antibodies: phospho-LKB1 (Ser428; C67A3), LKB1 (D60C5), β-catenin (D10A8), phospho-β-catenin (Ser33/37/Thr41), phospho-S6 (Ser235/236; D57.2.2E), phospho-AKT (Ser473; D9E), phospho-FOXO1 (Ser256), phospho-AMPK (Thr172) (all from Cell Signaling Technology), and β-ACTIN (Sigma).
Metabolomics analysis
Treg cells from Foxp3CreStk11fl/+ and Foxp3CreStk11fl/fl mice (approximately 16 days old) were activated with plate-coated anti-CD3 (5 μg/ml) and anti-CD28 (5 μg/ml) for 48 h, followed by extensive wash with PBS. Metabolites were extracted from cell pellets and culture medium using 80% methanol containing 0.05 ng/μl inosine-15N4 and 0.05 ng/μl thymine-d4 as internal standards (Cambridge Isotope Laboratories, Inc., Tewksbury MA). The samples were centrifuged (10 min, 9,000 × g, 4ºC) and the supernatants were collected. Three liquid chromatography tandem mass spectrometry (LC-MS) profile metabolites. Negative ion, targeted profiling of polar metabolites was performed using an ACQUITY UPLC (Waters Corp, Milford MA) coupled to a 5500 QTRAP triple quadrupole mass spectrometer (AB SCIEX, Framingham MA). Extracts (10 μl) were injected directly onto a 150 × 2.0 mm Luna NH2 column (Phenomenex, Torrance CA). The column was eluted at a flow rate of 400 μl/min with initial conditions of 10% mobile phase A (20 mM ammonium acetate and 20 mM ammonium hydroxide (Sigma-Aldrich) in water (VWR)) and 90% mobile phase B (10 mM ammonium hydroxide in 75:25 v/v acetonitrile/methanol (VWR)) followed by a 10 min linear gradient to 100% mobile phase A. The ion spray voltage was -4.5 kV and the source temperature was 500°C. Positive ionization mode profiling of polar metabolites was performed using a Nexera X2 U-HPLC (Shimadzu, Marlborough, MA)-Q Exactive Orbitrap (Thermo Fisher Scientific; Waltham, MA) LC-MS system. The 80% methanol extracts (100 μl) were dried using a nitrogen evaporator (TurboVap LV; Biotage) and then resuspended in 10 μl of water and 90 μl of 74.9:24.9:0.2 vol/vol/vol acetonitrile/methanol/formic acid containing stable isotope-labeled internal standards (valine-d8, Isotec; and phenylalanine-d8, Cambridge Isotope Laboratories; Andover, MA). The samples were centrifuged (10 min, 9,000 × g, 4°C) and the supernatants were injected directly onto a 150 × 2 mm Atlantis HILIC column (Waters; Milford, MA). The column was eluted isocratically at a flow rate of 250 μl/min with 5% mobile phase A (10 mM ammonium formate and 0.1% formic acid in water) for 1 min followed by a linear gradient to 40% mobile phase B (acetonitrile with 0.1% formic acid) over 10 min. The electrospray ionization voltage was 3.5 kV and data were acquired using full scan analysis over m/z 70–800 at 70,000 resolution. Reversed-phase C18 chromatography/negative ion mode MS analyses of free fatty acids and bile acids were conducted using an LC-MS system comprised of a Shimadzu Nexera X2 U-HPLC (Shimadzu Corp.; Marlborough, MA) coupled to a Q Exactive hybrid quadrupole orbitrap mass spectrometer (Thermo Fisher Scientific; Waltham, MA). Medium (30 μl) was extracted using 90 μl of methanol containing PGE2-d4 (Cayman Chemical Co.; Ann Arbor, MI) and centrifuged (10 min, 9,000 × g, 4°C) and the cell extracts were analyzed directly. The samples were injected onto a 150 × 2.1 mm ACQUITY BEH C18 column (Waters; Milford, MA). The column was eluted isocratically at a flow rate of 450 μl/min with 80% mobile phase A (0.01% formic acid in water) for 3 min followed by a linear gradient to 100% mobile phase B (acetonitrile with 0.01% acetic acid) over 12 min. MS analyses were carried out in the negative ion mode using electrospray ionization, full scan MS acquisition over 70–850 m/z, and a resolution setting of 70,000. Metabolite identities were confirmed using authentic reference standards. Other MS settings were: spray voltage −3.5 kV, capillary temperature 320°C, and heater temperature 300°C. LC-MS data were processed and visually inspected using MultiQuant 2.1 (SCIEX; Framingham, MA) and TraceFinder 3.1 software (Thermo Fisher Scientific; Waltham, MA). Metabolite set enrichment analysis was performed as described previously35.
Metabolic assays
Treg cells were stimulated with plate-bound α-CD3-CD28 for 48 h. To measure de novo lipid synthesis, D-[1-14C] glucose (Perkin Elmer) was added to the cells for the final 8 h of culture. Cells were lysed in 0.5% Triton X-100, and the lipid fraction was extracted by addition of chloroform and methanol (2:1 v/v) with vortexing, followed by addition of water with vortexing. After centrifugation, the lipid-containing phase was obtained and 14C incorporation was measured with a Beckman LS6500 scintillation counter. OCR and ECAR were measured in XF media (non-buffered DMEM containing 5 mM glucose, 2 mM L-glutamine and 1 mM sodium pyruvate), under basal conditions and in response to 1 μM oligomycin, 2 μM fluoro-carbonyl cyanide phenylhydrazone (FCCP), 200 μM Etomoxir (Eto) and 1 μM Rotenone/antimycin A (Rot/AA) using the XF-24 Extracellular Flux Analyzer (Seahorse Bioscience). Intracellular levels of ATP in Treg cells were measured using luminescent ATP detection assay kit (Abcam).
Gene expression profiling
RNA samples from donor-derived Treg cells from CD45.1+:WT and CD45.1+:Foxp3CreStk11fl/fl mixed BM chimeras (n = 5 each group) were analyzed using the Mouse Gene 2.0 ST Signals array. Differentially expressed transcripts were identified by ANOVA (Partek Genomics Suit 6.5), and the Benjamini-Hochberg method was used to estimate the false discovery rate (FDR). Gene set enrichment analysis (GSEA) was performed as described previously36. The microarray data have been deposited in the Gene Expression Omnibus under accession number GSE83088.
Serum antibodies
Immunoglobulin subclasses were measured with kits from Alpha Diagnostic International (5110) and Millipore (MGAMMAG-300K), respectively36.
OVA-induced allergic airway inflammation
Mice were sensitized with mixture of OVA (50 μg/ml per mouse) and alum adjuvant (1:2 dilution) injected intraperitoneally (100 μl per mouse), followed by the second sensitization 12 days later. Eight days after the second sensitization, mice were intranasally challenged with OVA for 4 consecutive days. At 18 h after the last challenge, lymphocytes were isolated from the spleen and lung and analyzed by flow cytometry.
Chromatin immunoprecipitation (ChIP)
ChIP methodology was performed as described37,38. Briefly, cells were cross-linked for 40 min using 12.5 μM ethylene glycol-bis(succinimidyl succinate) (ThermoFisherScientific), followed by the addition of formaldehyde (1% final concentration) and incubation for additional 20 min. After the reactions were quenched with glycine, cell pellets were lysed in cell lysis buffer (25 mM HEPES pH 7.8, 1.5 mM MgCl2, 10 mM KCl, 0.3% NP-40 and 1 mM DTT) containing a protease inhibitor tablet (Roche) for 10 min on ice. Nuclei were pelleted and lysed in nuclear lysis buffer (50 mM HEPES, pH 7.9, 140 mM NaCl, 1 mM EDTA, 1% Triton X-100, 0.1% Na-deoxycholate, 0.2% SDS) containing a protease inhibitor tablet for 10 min on ice, prior to sonication into 500 bp pieces using a Diagenode Bioruptor. Sheared chromatin was cleared of debris and incubated with IgG (Santa Cruz) or anti-β-catenin antibody (Cell Signaling; 1:50) and blocker (Active Motif) rotating overnight at 4ºC. Chromatin immunoprecipitation and subsequent DNA purification were performed using the ChIP-IT High Sensitivity Kit (Active Motif) per manufacturer’s instructions. Realtime PCRs were performed using the primers spanning the TCF3 motif in the Pdcd1 locus (http://rstats.immgen.org/Chromatin/chromatin.html): F-GGAAACAGGCACCAAGACAT, R-CTACTCAATCCGTGGGAGGA, and negative control primer sets (Active Motif #71011). Data analysis was performed using the ‘Percent Input’ normalization method.
Statistical analysis
P values were calculated by Mann-Whitney test, two-tailed unpaired Student’s t test, one-way ANOVA or two-way ANOVA as indicated using GraphPad Prism, unless otherwise noted. Statistical analysis of mouse survival and respective P values were determined using the Logrank test. P < 0.05 was considered as significant. All error bars represent the s.e.m.
Data availability
The microarray data that support the findings of this study have been deposited in the Gene Expression Omnibus under accession number GSE83088.
Extended Data
Extended Data Figure 1. Disrupted immune homeostasis in Foxp3CreStk11fl/fl mice.
a, Expression of Stk11 mRNA and LKB1 protein in CD4+YFP+ T cells (Treg cells) from WT and Foxp3CreStk11fl/fl mice. b, Representative images of hematoxylin and eosin staining of colon (original magnification, ×20) and cecum (×10) from WT and Foxp3CreStk11fl/fl mice. c, Representative images of MCPT1 (mast cell protease 1) staining of colon (original magnification, ×20) and cecum (×20) from WT and Foxp3CreStk11fl/fl mice. MCPT1 (brown) labels the interepithelial mucosal mast cells (ieMMCs). d, Quantification of serum MCP-1 (WT n = 10; Foxp3CreStk11fl/fl n = 12), TNF-α (WT n = 11; Foxp3CreStk11fl/fl n = 12) and IFN-γ (WT n = 9; Foxp3CreStk11fl/fl n = 8). e, Quantification of IgG2a/c, IgG2b, IgA and IgM in the serum from WT and Foxp3CreStk11fl/fl mice (n = 6 each group). f, g, Flow cytometry of eosinophils (CD11b+Siglec-F+) in the spleen (f) and lung (g), and alveolar macrophages (CD11b−Siglec-F+) in the lung (g) from WT and Foxp3CreStk11fl/fl mice. h, i, Flow cytometry of neutrophils (CD11b+Ly6G+, h) and macrophages (CD11b+F4/80+, i) in the spleen from WT and Foxp3CreStk11fl/fl mice. j, k, Representative images of MBP (major basic protein, pink, which labels eosinophils) (j) and YM1 (brown, which labels M2 macrophages) (k) staining of skin (×20) from WT and Foxp3CreStk11fl/fl mice. Data are representative of two (a–c, j, k), one (d, e) or at least three (f–i) independent experiments. Data are mean ± s.e.m. P values are determined by two-tailed Student’s t-test (d, e). NS, not significant; *P < 0.05, **P < 0.005, ***P < 0.0005. Numbers in gates indicate percentage of cells.
Extended Data Figure 2. Excessive T cell activation and TH2-dominant inflammatory responses in Foxp3CreStk11fl/fl mice.
a, Expression of CD62L and CD44 on CD4+ and CD8+ T cells in the spleen from WT and Foxp3CreStk11fl/fl mice. b, Flow cytometry and quantification of IL-4- and IL-5-producing CD4+ T cells in the spleen from WT and Foxp3CreStk11fl/fl mice (approximately 4–5 weeks old) after in vitro stimulation for 4 h. c, Flow cytometry of IL-4- and IL-5-producing Treg cells in the spleen from WT and Foxp3CreStk11fl/fl mice. d, e, Flow cytometry and quantification of IFN-γ-(d) and IL-17-producing (e) CD4+ T cells in the spleen from the mice in (b). f, Flow cytometry of IL-4-producing CD4+ T cells in the lung (left panel) and colon (right panel) from WT and Foxp3CreStk11fl/fl mice. g, Expression of IL-5 and IL-17 in CD4+ T cells in the spleen from young WT and Foxp3CreStk11fl/fl mice (approximately 16 days old). Right, fold changes of IL-5- or IL-17-producing CD4+ T cells from Foxp3CreStk11fl/fl versus WT counterparts (n = 5 each group). Data are representative of at least three (a–g) independent experiments. Data are mean ± s.e.m. P values are determined by Mann-Whitney test (b, d, e) or two-tailed Student’s t-test (g). *P < 0.05, **P < 0.005, ***P < 0.0005. Numbers in quadrants or gates indicate percentage of cells.
Extended Data Figure 3. LKB1 regulates Treg cell homeostasis and function.
a, Flow cytometry of Treg cells in the lung (left panel) and colon (right panel) from WT and Foxp3CreStk11fl/fl mice. b, BrdU incorporation in splenic Treg cells from WT and Foxp3CreStk11fl/fl mice at 16 h after injection of BrdU. c, d, Expression of active caspase-3 (c) and Bim (d) in CD45.2+ Treg cells from CD45.1+:WT and CD45.1+:Foxp3CreStk11fl/fl mixed BM chimeras. e, Flow cytometry of splenic Treg cells from young WT and Foxp3CreStk11fl/fl mice (approximately 16 days old). Right, proportions of Treg cells (WT n = 7; Foxp3CreStk11fl/fl n = 5). f, g, Expression of Bim (f), and CD62L and CD44 (g) in splenic CD4+ T cells from young WT and Foxp3CreStk11fl/fl mice (approximately 16 days old). h, i, Representative images of hematoxylin and eosin staining of the lung (h) and measurement of IgE in the serum (i) from young WT and Foxp3CreStk11fl/fl mice (approximately 16 days old). j, Flow cytometry of splenic Treg cells from WT, Foxp3CreStk11fl/fl and Foxp3CreStk11fl/flBcl2l11fl/fl mice. k, Expression of CD62L and CD44 on CD4+ T cells from WT, Foxp3CreStk11fl/fl and Foxp3CreStk11fl/flBcl2l11fl/fl mice. l, Flow cytometry of splenic Treg cells from WT and Foxp3CreBcl2l11fl/fl mice. m, Expression of IL-4 and IFN-γ in CD4+ T cells from WT and Foxp3CreBcl2l11fl/fl mice after in vitro stimulation for 4 h. Data are representative of at least three (a–d) or two (e–m) independent experiments. Data are mean ± s.e.m. P values are determined by Mann-Whitney test (e) or two-tailed Student’s t-test (i). NS, not significant; *P < 0.01. Numbers above graphs indicate the mean fluorescence intensity; numbers in quadrants or gates indicate percentage of cells.
Extended Data Figure 4. LKB1 regulates the expression of distinct Treg signature molecules.
a, Comparison of PD-1, GITR and OX40 expression on Treg cells from WT and Foxp3CreStk11fl/fl mice. b, Flow cytometry of resting (CD62LhiCD44low) and activated (CD62LlowCD44hi) Treg cells in the spleen from WT and Foxp3CreStk11fl/fl mice. c, Comparison of GATA3, IRF4, T-bet and RORγt in Treg cells from WT and Foxp3CreStk11fl/fl mice. d, Comparison of Foxp3, ICOS, CTLA-4 and CD25 expression in Treg cells from WT and Foxp3CreStk11fl/fl mice. e, Comparison of Foxp3, ICOS, CTLA-4 and CD25 expression in CD45.2+ WT and CD45.2+ Foxp3CreStk11fl/fl Treg cells from mixed BM chimeras. f, Expression of Stk11 mRNA in CD4+Foxp3-GFP+YFP+ T cells from Foxp3Cre-ERT2Stk11fl/+ and Foxp3Cre-ERT2Stk11fl/fl mice. g, Flow cytometry of Foxp3-GFP+YFP+ Treg cells from Foxp3Cre-ERT2Stk11fl/+ and Foxp3Cre-ERT2Stk11fl/fl mice at day 20 after the last tamoxifen administration. h, Proportion of DAPI+ Foxp3-GFP+YFP+ Treg cells in (g). i, Flow cytometry of Foxp3-GFP+YFP+ Treg cells from Foxp3Cre-ERT2Stk11fl/+ and Foxp3Cre-ERT2Stk11fl/fl mice at day 6 after the last tamoxifen administration. j, k, Expression of IL-4 versus IL-13 (j) and IFN-γ versus IL-17 (k) in CD4+ T cells from Foxp3Cre-ERT2Stk11fl/+ and Foxp3Cre-ERT2Stk11fl/fl mice after in vitro stimulation for 4 h. l, Comparison of Foxp3-GFP, ICOS and CD25 expression on Foxp3-GFP+YFP+ Treg cells from Foxp3Cre-ERT2Stk11fl/+ and Foxp3Cre-ERT2Stk11fl/fl mice. m, Flow cytometry of resting (CD62LhiCD44low) and activated (CD62LlowCD44hi) Treg cells in the spleen from Foxp3Cre-ERT2Stk11fl/+ and Foxp3Cre-ERT2Stk11fl/fl mice. Data are representative of at least three (a–i, l, m) or two (j, k) independent experiments. Data are mean ± s.e.m. P values are determined by two-tailed Student’s t-test (f). ***P < 0.0001. Numbers above graphs indicate the mean fluorescence intensity; numbers in quadrants or gates indicate percentage of cells.
Extended Data Figure 5. LKB1 regulates Treg cell function independently of mTOR-HIF-1α axis and AMPK signaling.
a, b, Phosphorylation of S6 (a), and phosphorylation of AKT S473 and FOXO1 (b) in WT and Foxp3CreStk11fl/fl Treg cells stimulated with or without α-CD3-CD28 for 48 h. c, Flow cytometry of splenic Treg cells from WT, Foxp3CreStk11fl/fl, Foxp3CreHif1afl/fl and Foxp3CreStk11fl/flHif1afl/fl mice. d, Expression of CD62L and CD44 on CD4+ T cells from the mice in (c). e, Expression of IL-4 and IL-17 in CD4+ T cells from the mice in (c) after in vitro stimulation for 4 h. f, Phosphorylation of AMPK in WT and LKB1-deficient Treg cells stimulated with α-CD3-CD28 for 48 h. g, Expression of CD62L and CD44 on CD4+ (upper) and CD8+ T cells (lower) from WT and Foxp3CrePrkaa1fl/flPrkaa2fl/fl mice. h, Expression of IFN-γ, IL-4 and IL-17 in CD4+ (upper) and CD8+ T cells (lower) from WT and Foxp3CrePrkaa1fl/flPrkaa2fl/fl mice after in vitro stimulation for 4 h. Data are representative of two (a–f) or three (g, h) independent experiments. Numbers in quadrants or gates indicate percentage of cells.
Extended Data Figure 6. LKB1-dependent gene expresison and metabolic programs in Treg cells.
a, Gene set enrichment analysis (GSEA) of transcriptional profiles in WT and Foxp3CreStk11fl/fl Treg cells from mixed BM chimeras (n = 5 each group). The list of top 10 gene sets downregulated in Foxp3CreStk11fl/fl Treg cells were shown. NES, normalized enrichment score. b, c, The gene sets of TCA cycle and respiratory electron transport (b) and mitochondrial protein import (c) were enriched among the top 10 downregulated pathways in Foxp3CreStk11fl/fl Treg cells. d, Heat maps showing relative abundance of metabolites differentially expressed and unsupervised hierarchical clustering. e, f, Relative abundance of metabolites implicated in TCA cycle (e) or glycolytic pathways (f) in Foxp3CreStk11fl/+ and Foxp3CreStk11fl/fl Treg cells. DHAP: glyceraldehyde 3P; PEP: phosphoenolpyruvic acid. g, Comparison of mitochondrial mass, TMRM (indicative of mitochondrial membrane potential) and ROS production in WT and LKB1-deficient Treg cells. h, Relative amount of intracellular ATP in WT and LKB1-deficient Treg cells. i, j, Oxygen consumption rate (OCR) (i) and extracellular acidification rate (ECAR) (j) of activated Foxp3-GFP+YFP+ Treg cells from Foxp3Cre-ERT2Stk11fl/+ and Foxp3Cre-ERT2Stk11fl/fl mice. k, Comparison of lipid droplets in WT and LKB1-deficient Treg cells. l, OCR of activated Foxp3-GFP+YFP+ Treg cells responding to the treatment of inhibitors Oligomycin (Oligo), FCCP, etomoxir (Eto) and Rotenone/antimycin A (Rot/AA). m, De novo lipid biosynthesis of Foxp3-GFP+YFP+ Treg cells stimulated with α-CD3-CD28 for 48 h. Data are representative of one (a–c; n = 5 mice each group; d–f; Foxp3CreStk11fl/+ n = 3, Foxp3CreStk11fl/fl n = 4) or two (g–m) independent experiments. Data are mean ± s.e.m. P values are determined by two-tailed Student’s t-test (e, f, h–j, m) or two-way ANOVA (l). NS, not significant; *P < 0.05, **P < 0.005. Numbers above graphs indicate the mean fluorescence intensity.
Extended Data Figure 7. Deletion of IL-4 partially rescues dysregulated type 2 immune responses, but not Treg cell function or overall immune homeostasis.
a, b, Expression of IL-4 and IL-13 (a) and IL-5 (b) in splenic CD4+ T cells from WT, Foxp3CreStk11fl/fl, Il4−/− and Foxp3CreStk11fl/flIl4−/− mice after in vitro stimulation for 4 h. c, d, Flow cytometry of eosinophils (CD11b+Siglec-F+) (c) and CD11b+PD-L2+ DCs (gated on CD11c+MHC-II+) (d) in the spleen from the mice in (a). e, Quantification of IgE and IgG1 in the serum from the mice in (a, n = 3 each group). f, Flow cytometry of splenic Treg cells from the mice in (a). g, Mean fluorescence intensity (MFI) of PD-1, GITR and OX40 expression on Treg cells from the mice in (a). h, Expression of CD62L and CD44 on splenic CD4+ T cells from the mice in (a). i, Expression of IFN-γ and IL-4 in splenic CD4+ T cells from the mice in (a) after in vitro stimulation for 4 h. j, Representative images of hematoxylin and eosin staining of the lung (original magnification, ×10), liver (×10) and skin (×20) from the mice in (a). Data are representative of at least three (a–d, f, h, i) or two (e, g, j) independent experiments. Data are mean ± s.e.m. P values are determined by one-way ANOVA (e, g). NS, not significant; *P < 0.05, **P < 0.005. Numbers in quadrants or gates indicate percentage of cells.
Extended Data Figure 8. Defects of LKB1-deficient Treg cells in suppressing DC maturation and TH2 cell differentiation.
a, Production of IL-25 and IL-33 in the homogenate of the lung from WT and Foxp3CreStk11fl/fl mice, normalized by the weight of the lung (WT, n = 7; Foxp3CreStk11fl/fl, n = 5). b, Fold change of CD80 and CD86 expression on splenic DCs from C57BL/6 mice stimulated with TSLP for 18 h. c, Mean fluorescence intensity (MFI) of CD80 and CD86 expression on DCs (with or without TSLP) cultured alone, or together with WT or Foxp3CreStk11fl/fl Treg cells for 48 h. d, Naïve CD4+ T cells were cocultured with TSLP-DCs alone, or together with Treg cells from Foxp3Cre-ERT2Stk11fl/+ or Foxp3Cre-ERT2Stk11fl/fl mice (after tamoxifen treatment) for 5 days, and expression of Il4, Il5 and Il13 mRNA in cocultured CD4+ T cells was measured after restimulation with α-CD3 for 5 h. e, f, Naïve CD4+ T cells were cocultured with LPS-primed DCs alone, or together with Treg cells from Foxp3Cre-ERT2Stk11fl/+ or Foxp3Cre-ERT2Stk11fl/fl mice (after tamoxifen treatment) for 5 days, followed by analyses of IFN-γ expression after in vitro stimulation for 4 h (e), and Ifng mRNA expression after restimulation with α-CD3 for 5 h (f). Data are representative of two (a, d–f) or three (b, c) independent experiments. Data are mean ± s.e.m. P values are determined by two-tailed Student’s t-test (a, b) or one-way ANOVA (c). NS, not significant; *P < 0.05, **P < 0.005. Numbers in gates indicate percentage of cells.
Extended Data Figure 9. Appropriate control of PD-1 expression is important for Treg cells in suppressing TH2 immune responses.
a, b, Fold change of PD-1, GITR and OX40 expression on lung Treg cells (a), or splenic Treg cells (b) from OVA-sensitized C57BL/6 mice with or without OVA inhalation challenge. c, Expression of IL-4 in CD4+ T cells cocultured with TSLP-DCs, or together with Treg cells transduced with control retrovirus (RV) or PD-1-expressing retrovirus (Pdcd1-RV). d, Expression of IL-4 in CD4+ T cells cocultured with TSLP-DCs, or together with WT or PD-1-deficient Treg cells. e, Flow cytometry of eosinophils (CD11b+Siglec-F+) in the lung and spleen from Rag1−/− mice reconstituted with Scurfy:WT or Scurfy:Pdcd1−/− BM cells. f, Concentration of IgG1 and IgG2a/c in the serum from the mice in (e). Data are representative of two (a–f) independent experiments. Data are mean ± s.e.m. P values are determined by two-tailed Student’s t-test (a, b, f). NS, not significant; *P < 0.05, **P < 0.005. Numbers in gates indicate percentage of cells.
Extended Data Figure 10. Treg cells require the LKB1-β-catenin axis to enforce their functional fitness in maintaining immune homeostasis.
a, GSEA reveals the significant enrichment of the Wnt signaling gene set among the downregulated pathways in LKB1-deficient Treg cells. b, Relative expression of Ctnnb1 mRNA in activated WT and LKB1-deficient Treg cells. c, Expression of total and phosphorylated β-catenin in activated WT and LKB1-deficient Treg cells. Right, relative phosphorylation of β-catenin normalized by total β-catenin. d, ChIP and realtime PCR analysis of β-catenin-bound DNA of the Pdcd1 locus from activated Foxp3Cre-ERT2Stk11fl/+ and Foxp3Cre-ERT2Stk11fl/fl Treg cells (following in vivo tamoxifen treatment). e, Mean fluorescence intensity (MFI) of GITR and CD25 expression on WT and Foxp3CreStk11fl/fl Treg cells transduced with control retrovirus (RV) or mutant β-catenin-expressing retrovirus (β-cat-RV). f, MFI of PD-1, GITR and CD25 expression on Foxp3Cre-ERT2Stk11fl/+ and Foxp3Cre-ERT2Stk11fl/fl Treg cells (following in vivo tamoxifen treatment) transduced with control RV or β-cat-RV. g, Expression of PD-L2, CD80 and CD86 on DCs cocultured with WT or LKB1-deficient Treg cells transduced with RV or β-cat-RV. Numbers above graphs indicate the MFI. Data are representative of one (a) or two (b–g) independent experiments. Data are mean ± s.e.m. P values are determined by two-tailed Student’s t-test (d) or two-way ANOVA (e, f). NS, not significant; **P < 0.005, ***P < 0.0005. h, Schematics of LKB1 signaling in the regulation of Treg cell function and immune homeostasis. LKB1 signaling in Treg cells establishes metabolic and homeostatic fitness required for preventing undesired immune responses through selectively controlling the expression of inhibitory regulators, including PD-1, GITR and OX40. Consequently, uncontrolled expression of PD-1 and possible other receptors impairs the capability of Treg cells in suppressing TH2 immune responses triggered by TSLP-induced PD-L2+ DCs. Although not depicted here, IL-4 contributes to the induction of PD-L2 on DCs and the amplification of TH2-mediated immunopathology.
Supplementary Material
Acknowledgments
The authors acknowledge A. Rudensky for Foxp3YFP-Cre and Foxp3Cre-ERT2 mice, Y. Wang for editing of the manuscript, Y. Dhungana and Y. Li for advice on bioinformatics analyses, and St. Jude Immunology FACS core facility for cell sorting. This work was supported by NIH AI105887, AI101407, CA176624 and NS064599, and American Asthma Foundation (to H.C.).
Footnotes
Author Contributions. K.Y. designed and performed experiments, and wrote the manuscript; B.D. and S.S. contributed to cellular experiments; G.N. performed microarray analysis; P.V. performed histological analysis; J.A., C.C. and C.W. contributed to metabolomics analysis; S.R., L.L. and A.K. contributed to molecular experiments; H.C. designed experiments, contributed to writing the manuscript, and provided overall direction.
The authors declare no competing financial interests.
References
- 1.Liston A, Gray DH. Homeostatic control of regulatory T cell diversity. Nat Rev Immunol. 2014;14:154–165. doi: 10.1038/nri3605. [DOI] [PubMed] [Google Scholar]
- 2.Sakaguchi S, Yamaguchi T, Nomura T, Ono M. Regulatory T cells and immune tolerance. Cell. 2008;133:775–787. doi: 10.1016/j.cell.2008.05.009. [DOI] [PubMed] [Google Scholar]
- 3.van der Veeken J, Arvey A, Rudensky A. Transcriptional control of regulatory T-cell differentiation. Cold Spring Harb Symp Quant Biol. 2013;78:215–222. doi: 10.1101/sqb.2013.78.020289. [DOI] [PubMed] [Google Scholar]
- 4.Panduro M, Benoist C, Mathis D. Tissue Tregs. Annu Rev Immunol. 2016;34:609–633. doi: 10.1146/annurev-immunol-032712-095948. [DOI] [PMC free article] [PubMed] [Google Scholar]
- 5.Shackelford DB, Shaw RJ. The LKB1-AMPK pathway: metabolism and growth control in tumour suppression. Nat Rev Cancer. 2009;9:563–575. doi: 10.1038/nrc2676. [DOI] [PMC free article] [PubMed] [Google Scholar]
- 6.Rubtsov YP, et al. Regulatory T cell-derived interleukin-10 limits inflammation at environmental interfaces. Immunity. 2008;28:546–558. doi: 10.1016/j.immuni.2008.02.017. [DOI] [PubMed] [Google Scholar]
- 7.Reber LL, Sibilano R, Mukai K, Galli SJ. Potential effector and immunoregulatory functions of mast cells in mucosal immunity. Mucosal Immunol. 2015;8:444–463. doi: 10.1038/mi.2014.131. [DOI] [PMC free article] [PubMed] [Google Scholar]
- 8.Shimizu J, Yamazaki S, Takahashi T, Ishida Y, Sakaguchi S. Stimulation of CD25(+)CD4(+) regulatory T cells through GITR breaks immunological self-tolerance. Nat Immunol. 2002;3:135–142. doi: 10.1038/ni759. [DOI] [PubMed] [Google Scholar]
- 9.Vu MD, et al. OX40 costimulation turns off Foxp3+ Tregs. Blood. 2007;110:2501–2510. doi: 10.1182/blood-2007-01-070748. [DOI] [PMC free article] [PubMed] [Google Scholar]
- 10.Sage PT, Francisco LM, Carman CV, Sharpe AH. The receptor PD-1 controls follicular regulatory T cells in the lymph nodes and blood. Nat Immunol. 2013;14:152–161. doi: 10.1038/ni.2496. [DOI] [PMC free article] [PubMed] [Google Scholar]
- 11.Mahmud SA, et al. Costimulation via the tumor-necrosis factor receptor superfamily couples TCR signal strength to the thymic differentiation of regulatory T cells. Nat Immunol. 2014;15:473–481. doi: 10.1038/ni.2849. [DOI] [PMC free article] [PubMed] [Google Scholar]
- 12.Valzasina B, et al. Triggering of OX40 (CD134) on CD4(+)CD25+ T cells blocks their inhibitory activity: a novel regulatory role for OX40 and its comparison with GITR. Blood. 2005;105:2845–2851. doi: 10.1182/blood-2004-07-2959. [DOI] [PubMed] [Google Scholar]
- 13.Franceschini D, et al. PD-L1 negatively regulates CD4+CD25+Foxp3+ Tregs by limiting STAT-5 phosphorylation in patients chronically infected with HCV. J Clin Invest. 2009;119:551–564. doi: 10.1172/JCI36604. [DOI] [PMC free article] [PubMed] [Google Scholar]
- 14.Rubtsov YP, et al. Stability of the regulatory T cell lineage in vivo. Science. 2010;329:1667–1671. doi: 10.1126/science.1191996. [DOI] [PMC free article] [PubMed] [Google Scholar]
- 15.Levine AG, Arvey A, Jin W, Rudensky AY. Continuous requirement for the TCR in regulatory T cell function. Nat Immunol. 2014;15:1070–1078. doi: 10.1038/ni.3004. [DOI] [PMC free article] [PubMed] [Google Scholar]
- 16.Vahl JC, et al. Continuous T cell receptor signals maintain a functional regulatory T cell pool. Immunity. 2014;41:722–736. doi: 10.1016/j.immuni.2014.10.012. [DOI] [PubMed] [Google Scholar]
- 17.MacIver NJ, et al. The liver kinase B1 is a central regulator of T cell development, activation, and metabolism. J Immunol. 2011;187:4187–4198. doi: 10.4049/jimmunol.1100367. [DOI] [PMC free article] [PubMed] [Google Scholar]
- 18.Faubert B, et al. Loss of the tumor suppressor LKB1 promotes metabolic reprogramming of cancer cells via HIF-1alpha. Proc Natl Acad Sci U S A. 2014;111:2554–2559. doi: 10.1073/pnas.1312570111. [DOI] [PMC free article] [PubMed] [Google Scholar]
- 19.Tamaka K, Seike M, Hagiwara T, Sato A, Ohtsu H. Histamine suppresses regulatory T cells mediated by TGF-beta in murine chronic allergic contact dermatitis. Exp Dermatol. 2015;24:280–284. doi: 10.1111/exd.12644. [DOI] [PubMed] [Google Scholar]
- 20.Gao Y, et al. Control of T helper 2 responses by transcription factor IRF4-dependent dendritic cells. Immunity. 2013;39:722–732. doi: 10.1016/j.immuni.2013.08.028. [DOI] [PMC free article] [PubMed] [Google Scholar]
- 21.Zhou B, et al. Thymic stromal lymphopoietin as a key initiator of allergic airway inflammation in mice. Nat Immunol. 2005;6:1047–1053. doi: 10.1038/ni1247. [DOI] [PubMed] [Google Scholar]
- 22.Okazaki T, Chikuma S, Iwai Y, Fagarasan S, Honjo T. A rheostat for immune responses: the unique properties of PD-1 and their advantages for clinical application. Nat Immunol. 2013;14:1212–1218. doi: 10.1038/ni.2762. [DOI] [PubMed] [Google Scholar]
- 23.Chae WJ, et al. The Wnt Antagonist Dickkopf-1 Promotes Pathological Type 2 Cell-Mediated Inflammation. Immunity. 2016;44:246–258. doi: 10.1016/j.immuni.2016.01.008. [DOI] [PMC free article] [PubMed] [Google Scholar]
- 24.Ding Y, Shen S, Lino AC, Curotto de Lafaille MA, Lafaille JJ. Beta-catenin stabilization extends regulatory T cell survival and induces anergy in nonregulatory T cells. Nat Med. 2008;14:162–169. doi: 10.1038/nm1707. [DOI] [PubMed] [Google Scholar]
- 25.Ulges A, et al. Protein kinase CK2 enables regulatory T cells to suppress excessive TH2 responses in vivo. Nat Immunol. 2015;16:267–275. doi: 10.1038/ni.3083. [DOI] [PubMed] [Google Scholar]
- 26.Pearce EL, Pearce EJ. Metabolic pathways in immune cell activation and quiescence. Immunity. 2013;38:633–643. doi: 10.1016/j.immuni.2013.04.005. [DOI] [PMC free article] [PubMed] [Google Scholar]
- 27.Wherry EJ, et al. Molecular signature of CD8+ T cell exhaustion during chronic viral infection. Immunity. 2007;27:670–684. doi: 10.1016/j.immuni.2007.09.006. [DOI] [PubMed] [Google Scholar]
- 28.Patsoukis N, et al. PD-1 alters T-cell metabolic reprogramming by inhibiting glycolysis and promoting lipolysis and fatty acid oxidation. Nat Commun. 2015;6:6692. doi: 10.1038/ncomms7692. [DOI] [PMC free article] [PubMed] [Google Scholar]
- 29.Bengsch B, et al. Bioenergetic Insufficiencies Due to Metabolic Alterations Regulated by the Inhibitory Receptor PD-1 Are an Early Driver of CD8(+) T Cell Exhaustion. Immunity. 2016;45:358–373. doi: 10.1016/j.immuni.2016.07.008. [DOI] [PMC free article] [PubMed] [Google Scholar]
- 30.Chang CH, et al. Metabolic Competition in the Tumor Microenvironment Is a Driver of Cancer Progression. Cell. 2015;162:1229–1241. doi: 10.1016/j.cell.2015.08.016. [DOI] [PMC free article] [PubMed] [Google Scholar]
- 31.Ito T, et al. TSLP-activated dendritic cells induce an inflammatory T helper type 2 cell response through OX40 ligand. J Exp Med. 2005;202:1213–1223. doi: 10.1084/jem.20051135. [DOI] [PMC free article] [PubMed] [Google Scholar]
- 32.Rosenbluh J, et al. beta-Catenin-driven cancers require a YAP1 transcriptional complex for survival and tumorigenesis. Cell. 2012;151:1457–1473. doi: 10.1016/j.cell.2012.11.026. [DOI] [PMC free article] [PubMed] [Google Scholar]
- 33.Liu G, Yang K, Burns S, Shrestha S, Chi H. The S1P(1)-mTOR axis directs the reciprocal differentiation of T(H)1 and T(reg) cells. Nat Immunol. 2010;11:1047–1056. doi: 10.1038/ni.1939. [DOI] [PMC free article] [PubMed] [Google Scholar]
- 34.Zeng H, et al. mTORC1 couples immune signals and metabolic programming to establish T(reg)-cell function. Nature. 2013;499:485–490. doi: 10.1038/nature12297. [DOI] [PMC free article] [PubMed] [Google Scholar]
- 35.Consortium, S. T. D. et al. Sequence variants in SLC16A11 are a common risk factor for type 2 diabetes in Mexico. Nature. 2014;506:97–101. doi: 10.1038/nature12828. [DOI] [PMC free article] [PubMed] [Google Scholar]
- 36.Shrestha S, et al. Treg cells require the phosphatase PTEN to restrain TH1 and TFH cell responses. Nat Immunol. 2015;16:178–187. doi: 10.1038/ni.3076. [DOI] [PMC free article] [PubMed] [Google Scholar]
- 37.Schuijers J, Mokry M, Hatzis P, Cuppen E, Clevers H. Wnt-induced transcriptional activation is exclusively mediated by TCF/LEF. EMBO J. 2014;33:146–156. doi: 10.1002/embj.201385358. [DOI] [PMC free article] [PubMed] [Google Scholar]
- 38.Zheng Y. ChIP-on-chip for FoxP3. Methods Mol Biol. 2011;707:71–82. doi: 10.1007/978-1-61737-979-6_6. [DOI] [PubMed] [Google Scholar]
Associated Data
This section collects any data citations, data availability statements, or supplementary materials included in this article.
Supplementary Materials
Data Availability Statement
The microarray data that support the findings of this study have been deposited in the Gene Expression Omnibus under accession number GSE83088.


