Abstract
Background: An electroencephalogram (EEG) is an accepted method in neurophysiology with a wide application. Different types of brain rhythms indicate that simultaneous activity of the brain cortex neurons depend on the person’s mental state.
Method: we have focus on reviewing the existing literature pertaining to changes of the brain’s bioelectrical activity that recorded from the scalp in different conditions such as cognition and some mental disorders.
Result: The frequency of brain waves may indicate sleep, consciousness, cognition, and some mental disorders. Slow brain waves are seen in some conditions such as sleep, coma, brain death, depression, autism, brain tumors, obsessive–compulsive disorder (OCD), attention deficit hyperactivity disorder (ADHD), and encephalitis, while rapid waves are generally reported in conditions such as epilepsy, anxiety, posttraumatic stress disorder (PTSD), and drug abuse.
Conclusion: Increase in the EEG rhythm is a marker of high brain activity that leads to high degrees of consciousness, while slow waves are suggestive of less brain activity. The pattern of EEG rhythm can be an indicator of some mental disorders, too.
Keywords: Electroencephalogram, Cognition, Consciousness, Mental Disorders, Brain activity
↑ What is “already known” in this topic:
Brain bioelectrical activities are studied by means of physiological and pathological phenomena e.g. sleep, awareness and epilepsy for a long time. The uses of this procedure are being extended to include psychological disorders.
→ What this article adds:
Variations in brain bioelectrical activity in different neural disorders can show the complexity of human nervous system besides its diagnostic functions. This will open a new window to neuroscience researches.
Introduction
Historical Background of the Study
EEG was first recorded by a British physician, Richard Caton, in 1875. He recorded the brain’s electrical impulses in rabbits and monkeys. After that, some researchers published the results of recording the brain’s electrical impulses in other mammals. In 1929, Hans Berger, a German physiologist and psychiatrist, reported the electrical activity of the human brain during sleep. Ten years later, EEG recordings were used to report the first aspects of epileptic attacks (2, 3).
Maintenance of EEG
The brain’s electrical charge is maintained through ion exchange along the membrane of billions of neurons resulting in electrical potentials. Thus, an EEG is the summation of the activity of billions of neurons laid close to each other. It seems that EEG is produced by pyramidal cells of the brain cortex (3).
Fig. 1.
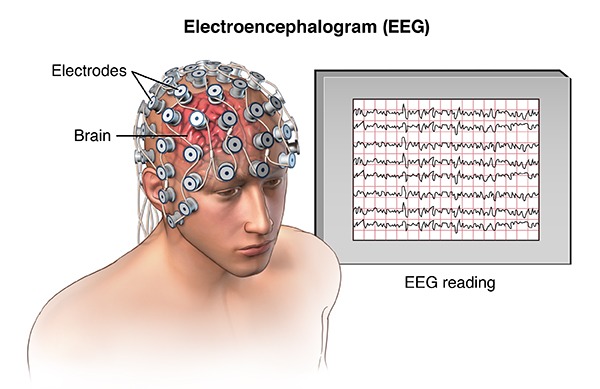
A Scheme of recording the brain’s bioelectrical waves (1)
Brain waves can be categorized into 4 main groups (Fig. 2) based on their frequency (3, 7) that is related to different states of the brain activity such as wakefulness or different sleep stages. These categories are as follow:
Fig. 2.
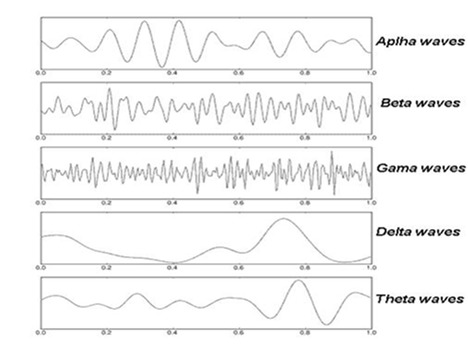
The frequency of recordable human brain waves (6)
- Beta rhythm (13-35 Hz): This wave is related to consciousness, brain activities, and motor behaviors. This wave is recorded when the eyes are open.
- Alpha rhythm (7-13 Hz): This wave was among the first rhythmic waves documented and named by Hans Berger. It originates from occipital lobes during wakeful relaxation, but has higher amplitude on the dominant side.
- Theta rhythm (4-7 Hz): This rhythm is recorded during low brain activities, sleep, or drowsiness.
- Delta rhythm (0-4 Hz): This wave is recorded during very low activities of the brain and deep sleep.
Moreover, 2 other waves can also be identified (Table 1):
Table 1 . Cerebral Functions Related to Different EEG Frequencies (8, 9) .
| Band | Frequency (Hz) | Location | Normally | Pathologically |
| Delta | < 4 | Frontally in adults, posteriorly in children; high-amplitude waves |
• Adult slow-wave sleep • In babies • Has been found during some continuous- attention tasks |
• Subcortical lesions • Diffuse lesions • Metabolic encephalopathy hydrocephalus • Deep midline lesions |
| Theta | 4 – 7 | Found in locations not related to task at hand |
• Higher in young children • Drowsiness in adults and teens • Idling • Associated with inhibition of elicited responses (has been found to spike in situations where a person is actively trying to repress a response or action). |
• Focal subcortical lesions • metabolic encephalopathy • Deep midline disorders • Some instances of hydrocephalus |
| Alpha | 8 – 15 | Posterior regions of the head, both sides, higher in amplitude on dominant side. Central sites (c3-c4) at rest |
• Relaxed/reflecting • Closing the eyes • Also associated with inhibition control, seemingly with the purpose of timing inhibitory activity in different locations across the brain. |
• Coma |
| Beta | 16 – 31 | Both sides, Symmetrical Distribution, most evident frontally; low-amplitude waves |
• Range span: active calm -> intense -
> stressed -> mild obsessive • Active thinking, focus, hi alert, anxious |
• Benzodiazepines • Dup15q syndrome |
| Gam ma | 32 + | Somatosensory cortex |
• Displays during cross-modal sensory
processing (perception that combines 2
different senses such as sound and
sight) • Also, it is shown during short-term memory matching of recognized objects, sounds, or tactile sensations |
• A decrease in gamma-band activity may be associated with cognitive decline, especially when related to the theta band; however, this has not been proven for use as a clinical diagnostic measurement |
| Mu | 8 – 12 | Sensorimotor cortex | • Shows rest-state motor neurons. | • Mu suppression could indicate that motor mirror neurons are working. Deficits in Mu suppression, and thus in mirror neurons, might play a role in autism. |
- Gamma wave (30-100 Hz): It seems that this wave is produced by different populations of neurons together in a neural network of certain motor or cognitive function.
- Mu rhythm (8-13 Hz): This wave overlaps the alpha wave and is a reflection of mirror neurons activity (5, 10, 11).
In addition, EEG recordings are different depending on the state and condition of the person; for example, an increase in the theta wave is observed in the stage I of NREM sleep, while stage II is defined by sleep spindles or sigma bands (12-14 Hz) in a background of 3-6 Hz. The presence of the delta frequency in stages III and IV of the sleep identifies these stages as slow wave sleep (3, 11, 12). EEG during REM sleep is similar to EEG during wakefulness. It seems that EEG changes with age because slow waves are dominant in newborns and children, while rapid waves are seen in adults as a result of brain maturity (3).
Because low-voltage high-frequency brain waves are not easily detected from the scalp, electrocorticography (ECoG) can be used to record these signals. Other methods of recording the brain’s electrical activity include subdural electroencephalography (sd EEG) and intracranial electroencephalography (ic EEG) that are employed in certain circumstances.
There are 2 methods of EEG recording:
- Recording the average of the EEG activity that is time-locked to a stimulus (visual, auditory, or somatosensory), known as evoked potentials (EPs).
- Recording the average of the EEG responses time-locked to more complexes processing of the stimuli known as event-related potentials (ERPs). This technique is one of the most famous techniques in cognitive science, cognitive psychology, and psychophysiological research (2, 13, 14).
Table 1. Cerebral Functions Related to Different EEG Frequencies (8, 9)
Self-Awareness and EEG
The frequency of the EEG rhythms can be used as a scale to detect the levels of consciousness and some mental disorders in such a way that different levels of self-awareness including the levels of under-arousal (sleep, dream, hypnosis, wakefulness, over-arousal), and content of consciousness such as visual imagination, speech pattern, thinking. All the above-mentioned are related to specific neural networks in cortical areas. The interaction of the person with the surrounding environment leads to mental arousal known as “general activation of mind”. Therefore, it could be stated that mental arousal is a routine, comprehensive, and basic characteristic of the mental status. The level of wakefulness and consciousness can be shown through the frequency of brain’s electrical activity; therefore, high levels of consciousness are recorded as rapid waves, especially the beta rhythm, while slow waves (theta and delta) can be recorded during sleep and low brain activity (Fig. 3).
Fig. 3.
Changes of the brain waves in different levels of consciousness (15)
Psychological Disorders and EEG
Mental states can affect the EEG recorded from different parts of the brain. For example, it has been reported that brain waves of right frontal lobe are related to negative feelings, while these waves in the left frontal lobe are related to positive feelings (18, 19, 16). Asymmetry of the cortical electrical activity may indicate depression or probability of its development. Studies have shown that the activity of the right frontal cortex is higher than the left frontal cortex in depressed individuals; in other words, the activity of the left frontal cortex is decreased in these patients (16). There seems to be a relationship between the severity of depression and the level of EEG abnormality in patients with major depressive disorder (MDD) (Fig. 4). Although changes in the brain’s electrical activity are seen throughout the cortex in MDD, lack of symmetry between the hemispheres in the frontal, parietal, and occipital regions of the patients is obvious. High cortical activity of the anterior and posterior regions in the right hemisphere of the MDD patients increased beta waves in these regions, while the activity of the central and temporal regions of the right hemisphere cortex was decreased in these patients, resulting in slower waves such as alpha, theta, and even delta waves (Fingelkurts, 2006; Gotlib, 1998).
Fig. 4.
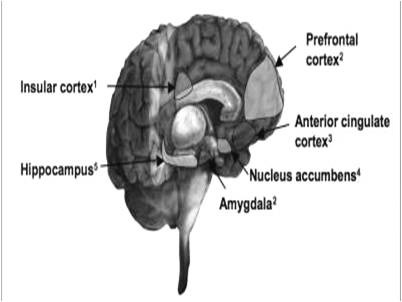
Brain regions involved in the MDD (17)
Mental disorders such as obsessive-compulsive disorder (OCD) can be detected through an EEG (Fig. 5). Studies have revealed a decrease in alpha and beta rhythms and an increase in the theta wave in the EGG of OCD patients (21).
Fig. 5.
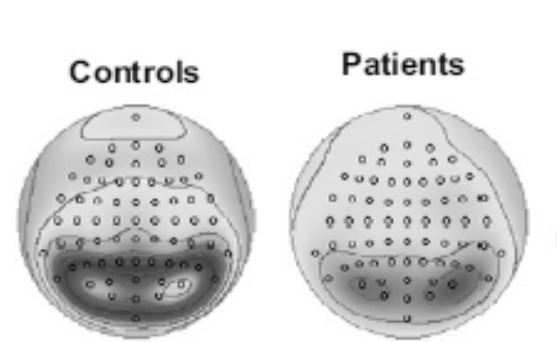
Decreased alpha waves in the OCD (20)
Moreover, anxiety has EEG manifestations including an increased activity of rapid brain waves (beta rhythm), especially in the central part of frontal cortex (Fig. 6). Moreover, the activity of the alpha rhythm is decreased in patients with chronic anxiety (18, 23).
Fig. 6.
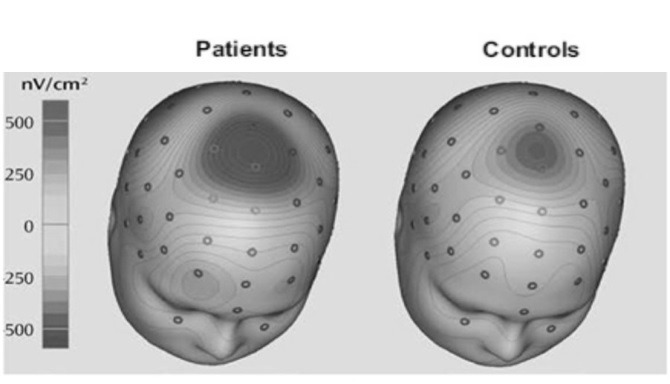
Increased activity of the central cortical parts in anxiety (22)
EGG findings are useful in the diagnosis of posttraumatic stress disorder (PTSD). This disorder is commonly observed in soldiers and sexual abuse survivors. EEG recording of these individuals shows asymmetry of the alpha rhythm and increased activity of the right parietal lobe. It seems that these changes are related to high sensitivity symptoms of these patients (24, 25). Furthermore, studies showed a decrease in the alpha rhythm and an increase in the beta rhythm in patients with a long history of PTSD (21).
Attention deficit hyperactivity disorder (ADHD) is one of the most common disorders diagnosed with EEG (Fig. 7). Four changes are seen in the EGG of the patients recorded from different parts of the brain:
Fig. 7.
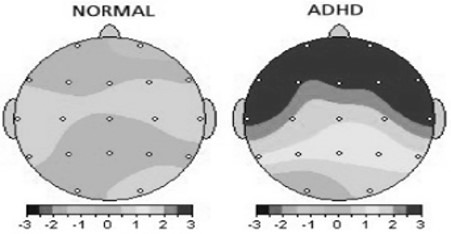
Brain wave changes in ADHD patients indicate a decrease in the activity of the prefrontal region compared with normal individuals (26)
Delta and theta changes in the central parts of the frontal lobe
Theta changes along the mid line of frontal
Beta changes in the frontal cortex
Alpha changes in the posterior, central, and frontal parts
Recent studies in ADHD patients showed decreased beta activity in comparison with normal children and an increase in theta to beta (Ɵ/β) rhythm. Moreover, it was found that the alpha wave that reflects a normal wakeful state is missing in ADHD patients (27).
An EEG can be used to diagnose children with autism as well. Autistic patients have problems with verbal and nonverbal communications, social interactions, and play-related activities. This disorder makes communication with others and the outside world difficult for the patients. The patients may also exhibit repetitive behaviors, unusual responses to people, and resistance to change (28). It seems that functional defects in mirror neurons play a role in autism. The activity of this neuronal system can be detected in EEGs recorded from the somatosensory cortex known as the mu rhythm.
There are reports of a decrease in the mu rhythm in somatosensory regions in autistic patients. Moreover, studies have shown increase high alpha activity (8-10 Hz) and theta rhythm, known as the alpha band, with a frequency of 4-10 Hz), along with suppression of the beta rhythm, especially in occipital and parietal lobes (29).
Neurological Disorders and EEG
As mentioned earlier, brain waves can be used as an index of the consciousness level (27, 30). Coma is a state of decreased consciousness in which the frequency of brain waves is similar to the alpha rhythm, and is regarded as the “alpha-coma” pattern. It seems that the pattern of EEG waves is mostly “theta-coma” in the elderly population. The theta-coma pattern ultimately changes to the delta rhythm, leading to death (31, 32). Brain death is defined as the irreversible loss of all brain functions and bioelectrical activity. As mentioned earlier, EEG can be, to some extent, recorded in a patient in deep coma, while no electrical activity is recorded in brain death patients and the EEG shows an isoelectric (flat) line (2).
Brain tumors also affect the EEG pattern. An increased delta rhythm during wakefulness is usually a characteristic of brain tumors. Polymorphic delta activity (PDA) in different parts of the brain and intermittent rhythmic delta activity (IRDA) in frontal regions of both hemispheres are very common in patients with brain tumors. Increased alpha activity in the posterior part of the involved region and/or disturbance theta is also observed in some brain tumors. However, some brain tumors have no electrical activity (33).
One of the most common applications of an EEG is in the diagnosis of epilepsy and identification of its focus. Epilepsy waves and epileptiform abnormalities may be observed on an EEG during seizure attacks. These waves include spikes (neural firing) and sharp waves (neural inhibition). In fact, abnormal activity of a network of inhibitory and stimulatory neurons, especially in the parietal and temporal lobes of one or both hemispheres induced epileptic waves in the patients (34).
Encephalitis is another example of the effect of neurological disorders on the EEG although EEG does not have a diagnostic role in this disease. The brain’s bioelectrical activity in these patients is similar to the pattern of brain waves in decreased consciousness or seizure attacks. Moreover, the EEG recording of these patients shows sharp waves in one or both temporal lobes (7).
Addiction and EEG
Abnormal electrical activity of the cerebral cortex is also seen in drug abuse. These changes include an increase in the theta rhythm and a decrease in the beta wave, mu rhythm, or sensory-motor rhythm (SMR) (35). Recent studies have reported that EEG alpha rhythm from frontier-central cortex is associated with the abuse of alcohol and other substances (24).
Conclusion
Although other methods like positron emission tomography (PET) and functional magnetic resonance image (fMRI) may be used as indirect markers of the brain’s electrical activity through showing cerebral blood flow or metabolic changes, the interactions of the neurons involved in consciousness as well as the levels of consciousness and sub-consciousness can only be evaluated in an EEG. Evaluation of the recorded brain waves in eyes closed (EC) or eyes open (EO) states can aid in the diagnosis and assessment of different mental and neurological disorders. Studies revealed a decrease in delta and theta amplitude and frequency waves of alpha and beta in EO condition in Autism spectrum disorder (ASD). Rapid rhythms indicate more brain activity and higher levels of consciousness and vice versa. Although it now seems that the level of consciousness is only a reflection of EEG bands, newer techniques may reveal other aspects of our neural activity in the near future (36-38).
Conflict of Interests
The authors declare that they have no competing interests.
Cite this article as: Roohi-Azizi M, Azimi L, Heysieattalab S, Aamidfar M. Changes of the brain’s bioelectrical activity in cognition, consciousness, and some mental disorders. Med J Islam Repub Iran. 2017 (3 Sep);31:53. https://doi.org/10.14196/mjiri.31.53
References
- 1. https://commons.wikimedia.org/wiki/.
- 2. Vaisanen, O. Multichannel EEG Methods to Improve the Spatial Resolution of Cortical Potential Distribution and the Signal Quality Deep Brain Sources. Publication 741, Tempere University of Technology. Finland; 2008.
- 3. Niedermeyer E, Lopes Da Silva F. Electroencephalography: Basic principles, clinical applications, and related fields. Lippincott Williams & Wilkins, Philadelphia, PA, 19106, USA, 2005.
- 4. Nuwer MR, Comi G, Emerson R, Fuglsang-Frederiksen A, Guérit JM, Hinrichs H, Ikeda A, Luccas FJ, Rappelsburger P. IFCN standards for digital recording of clinical EEG. International Federation of Clinical Neurophysiology. Electroencephalogr clin Neuro1998; 106(3):259-261. [DOI] [PubMed]
- 5. Olguin DO, Bouchereau F, Martinez S. Adaptive Notch Filter for EEG Signals Based on the LMS Algorithm with Variable Step-Size Parameter. Conference on Information Sciences and Systems, the Johns Hopkins University. USA; 2005:16-18.
- 6. http://psychedelic-information-teory.com.
- 7. Misulis KE, Head ThC. Essentials of Clinical Neurophysiology.3th ed. Neurology, Semmes-Murphey Clinic, Vanderbitt University, & University of Tennessee, Memphis. USA, 2011.
- 8. Nunez PL, Srinivasan R. Electric fields of the brain: the neurophysics of EEG, 2nd Edition. Oxford University Press, Inc. New York (USA) 2006.
- 9. http://commons.wikimedia.org/wiki/).
- 10.Bernier R, Dawson G, Webb S. EEG mu rhythm and imitation impairments in individuals with autism spectrum disorder. Brain Cogn. 2007;64(3):228–237. doi: 10.1016/j.bandc.2007.03.004. [DOI] [PMC free article] [PubMed] [Google Scholar]
- 11. Stern JM, Engel J. Atlas of EEG Patterns. Philadelphia, Lippincott Williams & Wilkins. USA; 2005.
- 12.Sterman MB. Physiological Origins and Functional Correlates of EEG Rhythmic Activities: Implications for Self-Regulation. Biofeedback Self Regul. 1996;21(1):1–31. doi: 10.1007/BF02214147. [DOI] [PubMed] [Google Scholar]
- 13.Silberbusch MA, Rothman MI, Bergey GK, Zoarski GH, Zagardo MT. Subdural Grid Implantation for Intracranial EEG Recording: CT and MR Appearance. Am J Neuroradiol. 1998;19:1089–93. [PMC free article] [PubMed] [Google Scholar]
- 14.Van der Loo E, Congedo M, Plazier M, Van de Heyning P, De Ridder R. Correlation between Independent Components of scalp EEG and intra-cranial EEG (iEEG) time series. Int J Bioelectromag. 2007;9(4):270–275. [Google Scholar]
- 15. Guyton AC, Hall JE. Textbook of medical physiology, 12th Edition. Saunders, Elsevier. Philadelphia, PA (USA) 2011.
- 16.Deldin PJ, Chiu P. Cognitive restructuring and EEG in major depression. Biol Psychol. 2005;70:141–151. doi: 10.1016/j.biopsycho.2005.01.003. [DOI] [PubMed] [Google Scholar]
- 17.Saltiel PF, Silvershein DI. Major depressive disorder: mechanism-based prescribing for personalized medicine. Neuropsychiatric Disease and Treatment. 2015;11:875–888. doi: 10.2147/NDT.S73261. [DOI] [PMC free article] [PubMed] [Google Scholar]
- 18.Fingelkurts AA, Fingelkurts AA, Rytsälä H, Sominen K, Isometsä E, Kähkönen S. Composition of Brain Oscillations in Ongoing EEG During Major Depression Disorder. Neurosci Res. 2006;56(2):133–144. doi: 10.1016/j.neures.2006.06.006. [DOI] [PubMed] [Google Scholar]
- 19.Gotlib IH, Ranganath C, Rosenfeld JP. Frontal EEG alpha asymmetry, depression, and cognition functioning. Cognt Emot. 1998;12(3):449–478. [Google Scholar]
- 20.Velikova S, Locatelli M, Insacco C, Smeraldi E, Comi G, Leocan L. Dysfunctional brain circuitry in obsessive–compulsive disorder: Source and coherence analysis of EEG rhythms. NeuroImage. 2010;49:977–983. doi: 10.1016/j.neuroimage.2009.08.015. [DOI] [PubMed] [Google Scholar]
- 21.Karadag E, Oguzhanoglu NK, Kurt T, Oguzhanoglu A, Atesci F, Ozdel O. Quantitative EEG analysis in obsessive compulsive disorder. Int J Neurosci. 2003;113(6):833–847. doi: 10.1080/00207450390200963. [DOI] [PubMed] [Google Scholar]
- 22.Martin EI, Ressler KJ, Binder E, Nemeroff CB. The Neurobiology of Anxiety Disorders: Brain Imaging, Genetics, and Psychoneuroendocrinology. Psychiatr Clin North Am. 2009 Sep;32(3):549–575. doi: 10.1016/j.psc.2009.05.004. [DOI] [PMC free article] [PubMed] [Google Scholar]
- 23.Macaulay M, Edmonds E. Does frontal EEG beta have application in anxiety monitoring during computer-based learning? J Educ Comput Res. 2004;30(3):229–241. [Google Scholar]
- 24.Ehlers CL, Gizer LR, Philips E, Wilhelmsen KC. EEG alpha phenotypes: Linkage analysis and relation to alcohol dependence in an American Indian community study. BMC Med Genet. 2010;11(43):1–11. doi: 10.1186/1471-2350-11-43. [DOI] [PMC free article] [PubMed] [Google Scholar]
- 25.Metzger LJ, Paiqe SR, Carso MA. PTSD arousal and depression symptoms associated with increased right-sides parietal EEG asymmetry. J Abnorm Psychol. 2004;113(2):324–329. doi: 10.1037/0021-843X.113.2.324. [DOI] [PubMed] [Google Scholar]
- 26. Mannuzza S, Klein R. Child and Adolescent Psychiatric Clinics of North America. 2000: 9. [PubMed]
- 27. Cvetkovic D, Cosic I. States of consciousness: Experimental insights into meditation, waking, sleep and dreams. Springer-Verlag Berlin; 2011;187-202.
- 28.Oberman LM, Hubbard EM, McCleery JP, Altschuler EL, Ramachandran VS, Pineda JA. EEG evidence for mirror neuron dysfunction in autism spectrum disorders. Cogn Brain Res. 2005;24:190–198. doi: 10.1016/j.cogbrainres.2005.01.014. [DOI] [PubMed] [Google Scholar]
- 29.Cowan JD, Markham L. EEG Biofeedback for the Attention Problems of Autism: A case Study: Annual Meeting of the Association for Applied Psychophysiology and Biofeedback. 1994:12–13. [Google Scholar]
- 30.Frith U, Frith C. The social brain: Allowing humans to boldly go where no other species has been. Philos Trans R Soc Lond B Biol Sci. 2010;365(1537):165–176. doi: 10.1098/rstb.2009.0160. [DOI] [PMC free article] [PubMed] [Google Scholar]
- 31.Martinez Bermejo A, Lopez-Martin V, Arcas J. Alpha coma: clinical, encephalographic and etiological correlation in childhood. Rev Neurol. 2001;33(12):1101–5. [PubMed] [Google Scholar]
- 32.Synek VM, Synek BJ. Theta pattern coma" occurring in younger adults. Clin Electroencephalogr. 1987;18(2):56–60. [PubMed] [Google Scholar]
- 33. Karameh FN, Dahleh MA. Automated classification of EEG signals in brain tumor diagnostics. Proceedings of the American Control Conference. Chicago, Illinois. 2000:1-5.
- 34.Destexhe A. Sike-and-wave oscillations. Scholarpedia. 2007;2(2):1402. [Google Scholar]
- 35.Rangaswamy CL, Porjesz B, Chorlian DB, Wang K, Jones KA, Bauer LO. et al. Beta Power in the EEG of Alcoholics. Biol Psychiatry. 2002;52(8):831–42. doi: 10.1016/s0006-3223(02)01362-8. [DOI] [PubMed] [Google Scholar]
- 36. Vaisanen, O. Multichannel EEG Methods to Improve the Spatial Resolution of Cortical Potential Distribution and the Signal Quality Deep Brain Sources. Publication 741, Tempere University of Technology. Finland; 2008.
- 37.Van der Loo E, Congedo M, Plazier M, Van de Heyning P, De Ridder R. Correlation between Independent Components of scalp EEG and intra-cranial EEG (iEEG) time series. Int J Bioelectromag. 2007;9(4):270–275. [Google Scholar]
- 38.Velikova S, Locatelli M, Insacco C, Smeraldi E, Comi G, Leocan L. Dysfunctional brain circuitry in obsessive–compulsive disorder: Source and coherence analysis of EEG rhythms. NeuroImage. 2010;49:977–983. doi: 10.1016/j.neuroimage.2009.08.015. [DOI] [PubMed] [Google Scholar]


