

Abstract
Introduction
Malignant ascites (MA) is a major cause of morbidity that occurs in 37% of ovarian cancer patients. The accumulation of MA in the peritoneal cavity due to cancer results in debilitating symptoms and extremely poor quality of life. There is an urgent unmet need to expand the understanding of MA to design effective treatment strategies, and to improve MA diagnosis.
Objective
Our purpose here is to contribute to a better characterization of MA metabolic composition in ovarian cancer.
Method
We determined the metabolic composition of ascitic fluids resulting from orthotopic growth of two ovarian cancer cell lines, the mouse ID8-vascular endothelial growth factor (VEGF)-Defb29 cell line and the human OVCAR3 cell line using high-resolution 1H MRS. ID8-VEGF-Defb29 tumors induce large volumes of ascites, while OVCAR3 tumors induce ascites less frequently and at smaller volumes. To better understand the factors driving the metabolic composition of the fluid, we characterized the metabolism of these ovarian cancer cells in culture by analyzing cell lysates and conditioned culture media with 1H NMR.
Results
Distinct metabolite patterns were detected in ascitic fluid collected from OVCAR3 and ID8-VEGF-Defb29 tumor bearing mice that were not reflected in the corresponding cell culture or conditioned medium.
Conclusion
High-resolution 1H NMR metabolic markers of MA can be used to improve characterization and diagnosis of MA. Metabolic characterization of MA can provide new insights into how MA fluid supports cancer cell growth and resistance to treatment, and has the potential to identify metabolic targeting strategies to reduce or eliminate the formation of MA.
Keywords: Ovarian cancer, ascitic fluid, orthotopic tumor implantation, metabolites, high-resolution proton NMR, cancer cells and conditioned culture media
INTRODUCTION
Malignant ascites (MA), defined by the National Cancer Institute as the accumulation of fluid in the abdomen that contains cancer cells, is an orphan problem observed in approximately 37% of terminal ovarian cancer patients (Ammouri and Prommer 2010). Our purpose in these studies was to contribute to the understanding of the formation of MA in ovarian cancer. MA plays a major role in the progression and chemoresistance of ovarian cancer, and is a major cause of quality of life deterioration; highly invasive procedures are currently used for detection and palliative treatment of MA (Ammouri and Prommer 2010). The abundance of tumor derived metabolites and proteins makes ascitic fluid a promising source for biomarker discovery. Establishing the metabolic profile of MA fluid and cancer cells in MA fluid using high-resolution 1H NMR, is an important first step in profiling ovarian cancer biofluids to identify potential new biomarkers of MA, and identifying metabolic targets that may be applied, in the future, for personalized medicine strategies.
Our rationale to characterize the metabolomics of MA of ovarian cancer xenografts with high-resolution 1H NMR was twofold. The first was to determine if ovarian cancers that induce high volumes of MA have a metabolic profile that can be used to identify MA. Cytological confirmation of the presence of malignant cells in ascites fluid, the standard for MA diagnosis, has a low sensitivity ranging from 50 to 70% (Ammouri and Prommer 2010). This is because the primary tumor may infiltrate the peritoneum without shedding cells, thus resulting in a false negative. As a result other invasive procedures, such as laparoscopy, are performed to confirm the presence of malignant cells. A fluid withdrawal based detection technique to detect MA would reduce the requirement of a significantly more invasive procedure such as laparoscopy, and is an important unmet clinical need. 1H NMR metabolomics allows rapid analysis of samples with minimal preparation (Vettukattil et al. 2013). Our second purpose of identifying metabolic patterns characteristic of MA fluid and cancer cells in MA was to develop new insights into MA that can, in the future, result in metabolic inhibition strategies to treat MA that is another critical unmet need in MA; currently limited palliative but invasive measures are available (Kipps et al. 2013).
Proton NMR provides an identification of several metabolites in a single measurement in cells, tumor biopsies or fluids (Serkova and Brown 2012). By applying Carr-Purcell-Meiboom-Gill (CPMG) technique, the signal of proteins can be suppressed based on their short T2 relaxation times (Gowda and Raftery 2014; Beckonert et al. 2007). One limitation of the technique can be an attenuation of a number of metabolites (Gowda and Raftery 2014), however it has been shown that CPMG provides a clean baseline compared to single pulse sequence and only marginally affects the quantitative accuracy (Van et al. 2003). Here, we applied high-resolution 1H NMR to determine the metabolic composition of ascitic fluids resulting from orthotopic growth of two ovarian cancer cell lines, the mouse ID8-vascular endothelial growth factor (VEGF)-Defb29 cell line and the human OVCAR3 cell line. ID8-VEGF-Defb29 tumors induce large volumes of ascites, often more than 10 mL, while OVCAR3 tumors induce ascites less frequently and at smaller volumes, usually less than 0.2 mL. The murine ID8-VEGF-Defb29 cell line was implanted in C57Bl6 mice, while the human OVCAR3 cell line was implanted in severe combined immunodeficient (SCID) mice. To better understand the factors driving the metabolic composition of the fluid, we characterized the metabolism of these ovarian cancer cells in culture by analyzing cell lysates and conditioned culture media with 1H NMR. Our data have identified specific metabolites such as β-hydroxybutyrate, maleic acid, and citrate that were common to both MA fluids originated from two different experimental models, despite the cells exhibiting significant intrinsic metabolic differences. These metabolites detected in MA may serve as biomarkers following more extensive validation.
METHODS
Cancer cell lines
OVCAR3 and ID8-VEGF-Defb29 cancer cells (Conejo-Garcia et al. 2004) were grown in RPMI 1640 medium with 10% fetal bovine serum and cultured in standard cell culture incubator conditions at 37°C in a humidified atmosphere containing 5% CO2. OVCAR3 cells were obtained from the American Type Culture Collection (ATCC), while ID8-VEGF Defb29 cells were provided by Drs. Wu and Hung at the Johns Hopkins University School of Medicine.
Cell samples preparation
Approximately 80% confluent ID8-VEGF-Defb29 and OVCAR3 cells were harvested by trypsinization. Two million cells per sample were used for analysis. After trypsinization, cells were washed three times with 1X PBS to remove the extracellular components and growth medium. Cell pellets were obtained by centrifuging at 1,500 rpm for 5 min. For 1H NMR analysis, cell pellets were resuspended in 750 μL of deuterated phosphate buffer and sonicated for 5 min with a 1 s pulse interval under ice cooled conditions. Once the cells were lysed, whole cell lysate was centrifuged at 10,000 rpm for 5 min to remove cell debris, and the supernatant was transferred to an NMR tube for spectral acquisition. Spectra were acquired from 3 independent replicates for each cell line.
Media preparation
Conditioned cell culture media were collected from culture flasks before harvesting the cells. Culture media were centrifuged at 1,500 rpm for 5 min to remove any cells or suspended particles present. 400 μL of media was mixed with 200 μL deuterated phosphate buffer for 1H NMR analysis. Spectra were acquired from 3 independent replicates for each cell line.
Tumor implantation
OVCAR3 and ID8-VEGF-Defb29 cells were implanted in female severe combined immunodeficient (SCID) mice and C57BL6 mice, respectively. Our orthotopic implantation model consisted of a two-step process (Penet et al. 2016). We first generated subcutaneous tumors by inoculating a cell suspension of 2 × 10⁶ OVCAR3 or ID8-VEGF-Defb29 cells in 0.05 ml of Hanks balanced salt solution in the flank of SCID or C57BL/6 female mice. Once tumors reached a size of ~ 100–200 mm3, they were excised, cut into small pieces under sterilized conditions, and implanted surgically onto the ovary of anesthetized SCID or C57BL/6 female mice. Ascitic fluids were obtained directly from the peritoneal cavity immediately after sacrificing the animal. We collected 8 ID8-VEGF-Defb29 ascitic fluids and 5 OVCAR3 ascitic fluids. Fluid samples were spun down to remove any cells, and maintained at −80°C until further analysis. All surgical procedures and animal handling were performed in accordance with protocols approved by the Johns Hopkins University Institutional Animal Care and Use Committee, and conformed to the Guide for the Care and Use of Laboratory Animals published by the NIH.
Ascites samples preparation
Initial analysis of ascitic fluid, performed using 50 μL of ascites supernatant diluted in 550 μL of D2O saline buffer, identified pH differences in the fluid samples from the chemical shift of the pH dependent metabolites. pH of ascites fluid diluted in D2O varied from 7.45 to 8.84 (8.38 +/− 0.44 and 8.04 +/− 0.33 for ID8-VEGF-Defb29 and OVCAR3 respectively). To decrease the effect of pH-dependent drift in chemical shift, we lyophilized the ascitic fluid samples, resuspended them in D2O saline buffer, and measured their pH as shown in Figure S-1. pH values measured were 7.01 +/− 0.13 and 6.96 +/− 0.09 for ID8-VEGF-Defb29 and OVCAR3 respectively. Approximately 50–100μL (depending upon availability of sample) of ascitic fluid was lyophilized and resuspended in 550 μL of deuterated phosphate buffer and vortexed for 2 min, following which the supernatant was transferred to NMR tubes for analysis.
High resolution MR spectra acquisition
High-resolution 1H MR spectra were recorded on a Bruker Biospin Avance-III 750 MHz NMR (Bruker Biospin) spectrometer operating at a proton frequency of 750.21 MHz using a 5-mm broad band inverse (BBI) probe head equipped with z-gradient accessories. 1H MR spectra with water suppression were acquired using a one-dimensional single pulse sequence with a presaturation pulse using the following experimental parameters: spectral width of 15,495.86 Hz, time domain data points of 64K, effective 90° flip angle, 11.0 μs, relaxation delay 10 s, acquisition time of 2.11 s, 64 number of scans with 8 dummy scans, a constant receiver gain of 512 with a total recording time of about 15 min. Spectra were also acquired with a one-dimensional CPMG pulse sequence with water suppression (echo time of 50 ms) to remove short T2 components arising due to the presence of macromolecules (Van et al. 2003) (Figure S-2). All other acquisition parameters for CPMG were kept similar to the ones used in the single pulse with water suppression sequence. All spectra were processed using zero filling of 64K and line broadening for exponential window function of 0.3 Hz prior to Fourier transformation. 1H MR spectra were manually phased and automated baseline corrected using TOPSPIN 3.2 software.
The 1H MR spectra were referenced to the methyl resonance of acetate at 1.91 ppm because of its insensitivity to pH variations (Cruz et al. 2014). Metabolites were identified based on the chemical shift, coupling constant, and splitting pattern of metabolites, as reported in literature and by comparison with standard MR spectra of metabolites reported by the Biological Magnetic Resonance Bank (BMRB, www.bmrb.wisc.edu), and one and two dimensional NMR spectroscopy (Bharti and Roy 2014; Van et al. 2003) (Bala et al. 2008).
Metabolites quantification
All samples were acquired and processed using the same experimental parameters. Thereafter an artificial reference signal with defined intensity was digitally inserted in each spectrum at −1.0 ppm (Bharti and Roy 2012). Metabolite peaks were integrated using variable size binning in AMIX software (version 3.9.14, Bruker Biospin GMBH) and normalized to the digital reference signal inserted externally (Bharti and Roy 2012). Hundred microliter of the ascites sample were lyophilized and reconstituted in 550 μL buffer. In the case of low ascites sample volume (<100μL), a volume correction factor was applied during quantitative analysis. Integrated metabolite peak areas were used to compare the groups and to perform statistical analysis. Integration of the lipid peak area (−CH3 methyl chain) at 0.9 ppm was used for quantification and comparison of overall lipid changes. The lipid peak at 5.3 ppm arises collectively from the vinyl (−CH=CH−) group protons in various unsaturated fatty acids chains and cholesterol. The lipid signal at 2.8 ppm arises from methylene protons [−CH=CH−CH2−(CH=CH−CH2−)n] in polyunsaturated fatty acid (PUFA) chains (Adosraku et al. 1994). The integral area of these peaks were analyzed and compared between the groups. The integration of the lipid peak at 0.9 ppm consists of free fatty acids, triacid glycerol (TAG), PUFA, cholesterol and provides an estimate of changes in lipid metabolism. Individual quantification of lipids was not performed due to overlapping signals in the NMR spectra.
Heat maps were created using MATLAB software (MATLAB R2012b, MathWorks) to visualize the metabolite patterns. Due to a high dynamic range of metabolites, it was not possible to scale all metabolites in a heat map plot. Instead, we normalized the highest intensity of a metabolite in any one of the samples in OVCAR3 or ID8-VEGF-Defb29 to 100%. For example, the intensity of isoleucine in OVCAR3 sample #3 (Figure 1B) was set to 100% and the level of isoleucine relative to that was calculated in the remaining OVCAR3 or ID8-VEGF-Defb29 samples. This normalization provides a dynamic range between 0–100%, allowing a better presentation of heat maps.
Figure 1.
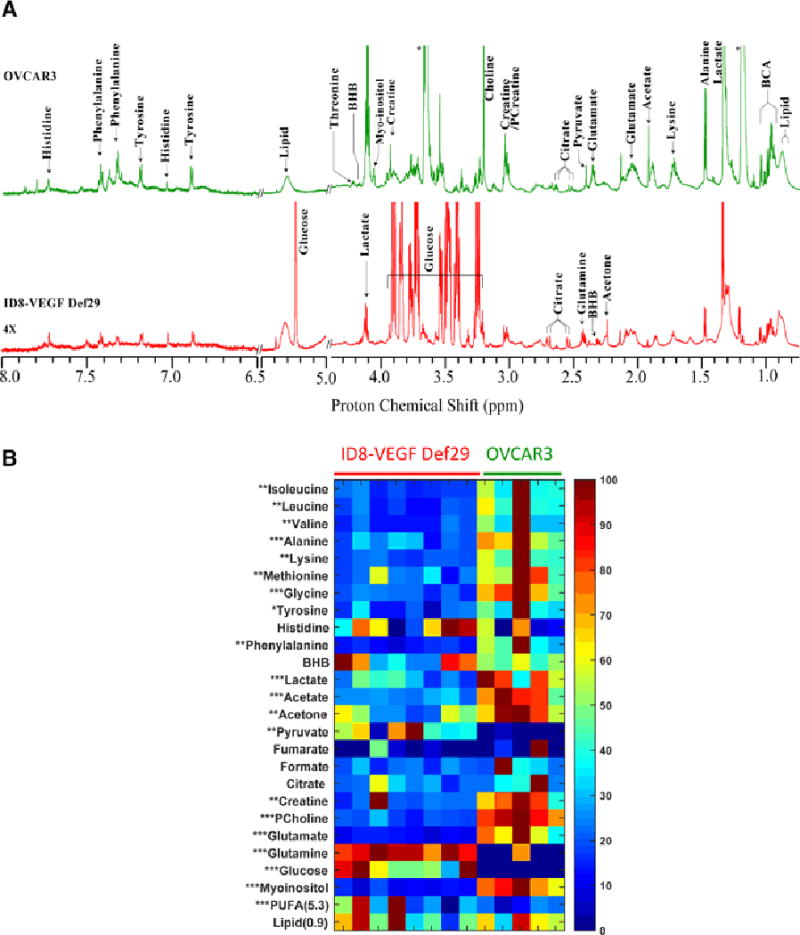
(A) Representative CPMG 1H MR spectra obtained from ascitic fluid of an ID8-VEGF-Defb29 (Red), and an OVCAR3 (Green) tumor bearing mice. Expansions of the spectra from 6.5–8.0 ppm are 4X vertically zoomed. (BHB; betahydroxybutyrate, BCA; branch chain amino acid). (B) Metabolic heat maps representing the significant changes in metabolites between ID8-VEGF-Defb29 and OVCAR3 ascitc fluids. Individual samples are separated by vertical column. Heat maps show a clear separation of metabolic pattern between these two groups with respect amino acid, choline, glutamine-glutamate and glucose metabolism. Mean value of all samples from VEGF-Defb29 and OVCAR3 groups were subjected to unpaired student t-test to measure statistical significance. (* P<0.05, ** P <0.01 and *** P <0.001)
Web based software Venny 2.1.0 (BioinfoGP at Spanish National Biotechnology Centre (CNB)-CSIC) was used to prepare the Venn diagrams of metabolites. Metabolites identified in each compartment, i.e. ascites, cells and conditioned media, were listed for the Venn diagram. The number of common metabolites, represented as % overlap, between the 3 groups was presented as the number (% overlap) of common metabolites. As an example, in the OVCAR3 model: 9 metabolites (24.3%) are common to the 3 groups, 8 (21.6%) are common to the cells and ascites, and 5 (13.5%) are common to the conditioned media and ascites. Six metabolites (16.2%) are specifically detected in ascites. No quantitative information was included in the diagram.
RESULTS
The two tumor models used in this study induced different ascitic profiles. While OVCAR3 tumor bearing mice developed small viscous volumes of ascites, ID8-VEGF-Defb29 induced higher volumes. Representative spectra of ascitic fluid acquired with high-resolution 1H NMR are shown in Figure 1A.
ID8-VEGF-Defb29 ascitic fluids were characterized by higher levels of glutamine, glucose, poly-unsaturated fatty acids (i.e. lipid peak at 5.3 ppm arose from PUFA and cholesterol chain) and pyruvate compared to the OVCAR3 fluids (Figure 1B, Figure S-3), while all the other metabolites, including glutamate, lactate, myoinositol, phosphocholine and acetate, were lower in ID8-VEGF-Defb29 ascitic fluids. Choline and phosphocholine were detected in ID8-VEGF-Defb29 ascitic fluid and a significant increase in phosphocholine level was observed in OVCAR3 ascites. Very low choline signal was detected in OVCAR3 ascites (Figure 2).
Figure 2.
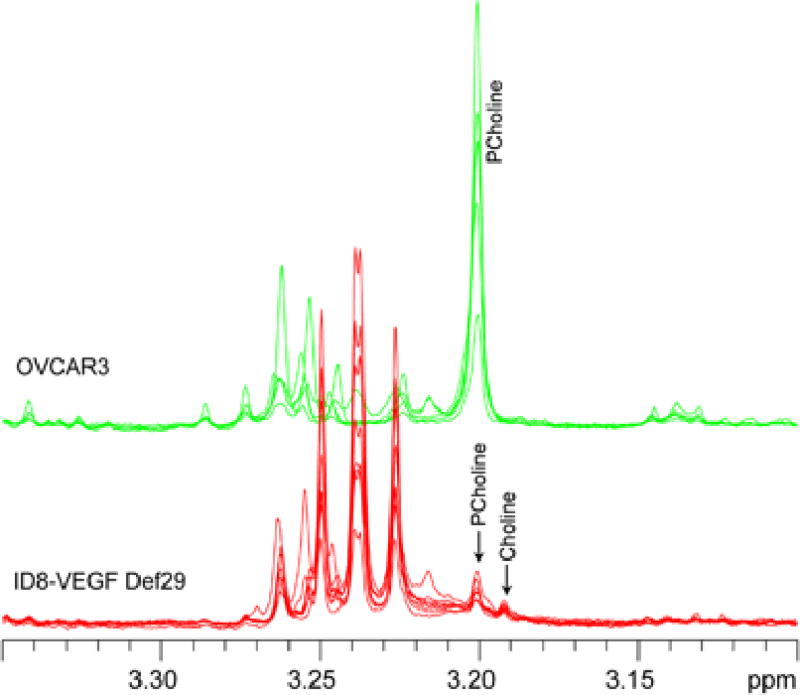
Representative CPMG 1H MR spectra of ascitic fluids obtained from ID8-VEGF-Def29 and OVCAR3 tumor bearing mice showing presence of choline and phosphocholine in the 3.2 ppm region.
To determine if the differences observed in the ascitic fluids were due to differences in metabolism of the cancer cells, we first analyzed metabolites present in the conditioned cell culture media, and compared these to the spectrum obtained from regular RPMI medium, that was used for both cell lines. Representative spectra of media are shown in Figure 3A, the quantitative values are described in details in Figure S-4.
Figure 3.
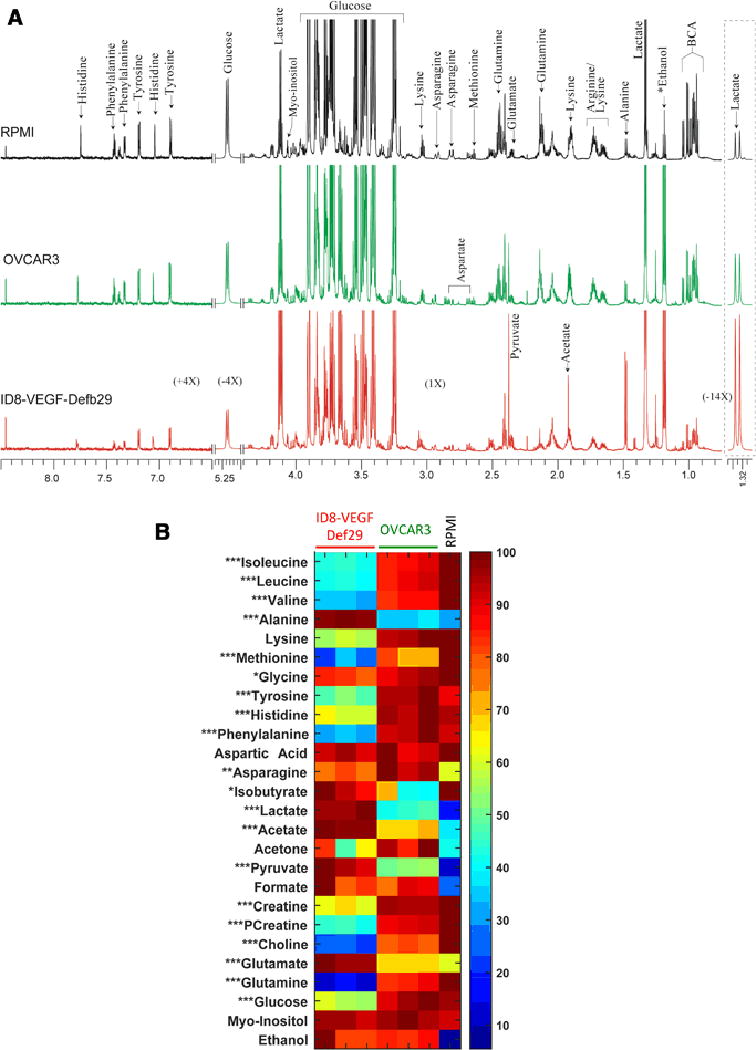
(A) Representative CPMG 1H MR spectra obtained from conditioned culture media from ID8-VEGF-Defb29 cells (red), OVCAR3 cells (green) and control RPMI media (black). Expansion of the spectra from 1.30–1.35 ppm, 5.20–5.27 ppm and 6.5–8.5 ppm are vertically zoomed for −14X, −4X and 4X respectively. BHB; betahydroxybutyrate, BCA; branch chain amino acids. (B) Metabolic heat maps representing the significant differences in the metabolites present in the conditioned media obtained from ID8-VEGF-Defb29 and OVCAR3 groups. Mean value of all samples from ID8-VEGF-Defb29 and OVCAR3 groups were subjected to unpaired student t-test to measure statistical significance. (* P<0.05, ** P <0.01 and *** P <0.001)
Figure 3B shows a heat map with the various metabolites quantified in both conditioned cell culture media and in RPMI. The metabolite concentrations differed between the OVCAR3 and the ID8-VEGF-Defb29 conditioned media. ID8-VEGF-Defb29 cells produced more lactate, acetate, alanine, glycine, pyruvate, glutamate, and myoinositol and secreted less glutamine, isoleucine, leucine, valine, acetone, methionine, creatine, phosphocreatine, choline, glucose, asparagine, tyrosine, phenylalanine than OVCAR3 cells. OVCAR3 cells consumed less glucose and produced less lactate and alanine compared to the ID8-VEGF-Defb29 cells. The glutamine - glutamate ratio was reversed in conditioned culture media, with high glutamate and low glutamine in ID8-VEGF-Defb29 media, and high glutamine low glutamate in the OVCAR3 media.
Following medium characterization, we investigated the metabolic profile of OVCAR3 and ID8-VEGF-Defb29 cell lysates. Representative spectra are shown in Figure 4A, and detailed quantification of all metabolites detected are presented in Figure S-5.
Figure 4.
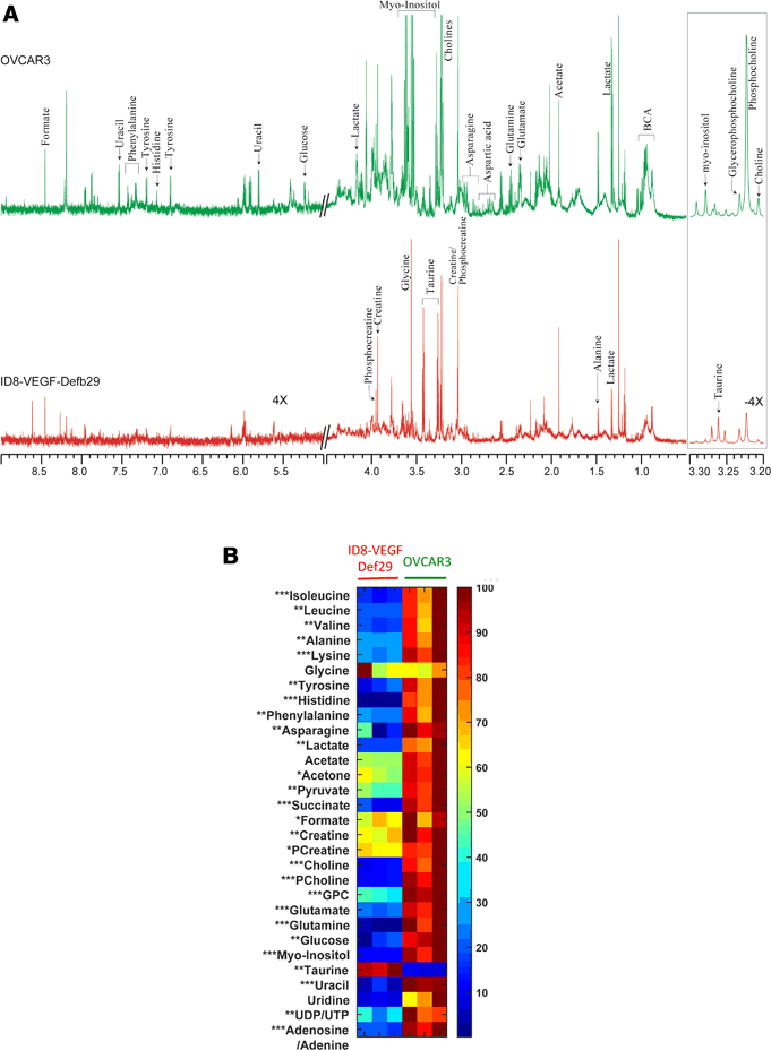
(A) Representative CPMG 1H MR spectra obtained from ID8-VEGF-Defb29 (red), and OVCAR3 cell lysates (green). Expansion of the spectra from 3.2–3.3 and 6.5–8.0 ppm are vertically zoomed for −4X and 4X respectively. BHB; beta-hydroxybutyrate, BCA; branch chain amino acid. (B) Metabolic heat maps representing significant differences in ID8-VEGF-Defb29 and OVCAR3 cell lysates metabolites. Mean value of all samples from ID8-VEGF-Defb29 and OVCAR3 groups were subjected to unpaired student t-test to measure statistical significance. (* P<0.05, ** P <0.01 and *** P <0.001)
Most of the MR visible metabolites found in the media were also present in the cells, with few exceptions. Succinate, phosphocholine, glycerophosphocholine, taurine, uracil, uridine, UDP/UTP, and adenosine/adenine were detected only in the cells, while methionine, aspartic acid, and isobutyrate were detected only in the conditioned media. As shown in Figure 4B, most of the metabolites analyzed were higher in the OVCAR3 cells compared to the ID8-VEGF-Defb29 cells, only taurine was higher in the ID8-VEGF-Defb29 cells. It is interesting to note that while lactate, glutamate, pyruvate, formate, asparagine and acetate concentrations were low in ID8-VEGF-Defb29 cells, their levels were high in the corresponding conditioned culture media.
Venn diagrams were created to visualize the partition of metabolites in ascites, cells and conditioned media (Figure 5). The diagrams also highlight the similarities and differences in both cell lines for each compartment. Few metabolites were found in ascites only, amongst them β-hydroxybutyrate, lipids, maleic acid and citrate were common to both models. Glutathione, PCreatine, PCholine, GPC and NAD/NADP were detected in both cell lines. Lysine, arginine, tyrosine, histidine and phenylalanine were found in both models in the media and ascites, but were absent from the cells, whereas succinate, creatine and choline were detected in the cells and ascites but not in the media.
Figure 5.
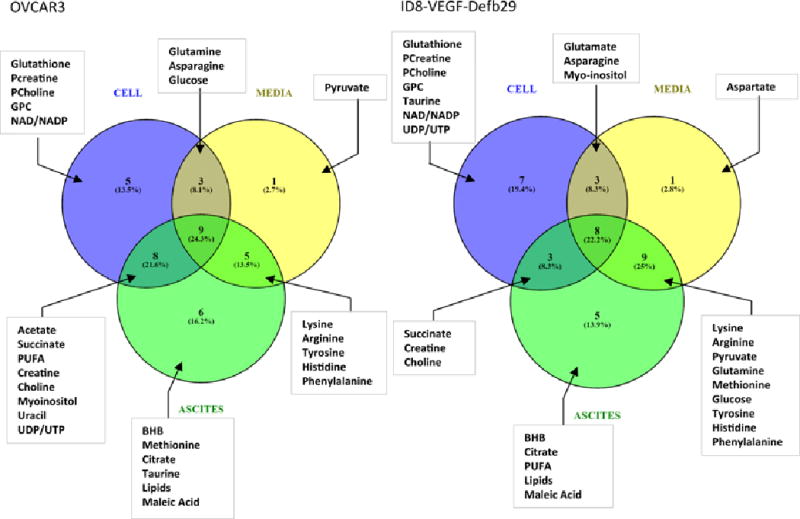
Venn diagrams representing all the metabolites detected in the different compartments in OVCAR3 and ID8-VEGF-Defb29 ascitic fluids.
DISCUSSION
MA is a common complication of advanced ovarian cancer that is associated with significant morbidity and mortality. Here, we investigated the metabolic profile of ascitic fluid obtained in two different experimental models of ovarian cancer using high resolution 1H NMR. To further understand the differences observed between both cell lines, we analyzed the metabolic profiles of these cells in culture and of their corresponding conditioned media. Remarkably, here for the first time, we identified metabolites such as BHB, citrate, lipids, and maleic acid that were common to ascitic fluid in both tumor models. This was despite significant differences in the metabolic profiles of OVCAR3 and ID8-VEGF-Defb29 cells in vitro, and of their conditioned culture media. Citrate and maleic acid are two metabolites involved in the TCA cycle, while hydroxybutyrate is a ketone body formed from acetyl-CoA. These metabolites that are common to ascitic fluid may lead to the development of complementary metabolic biomarkers to identify the presence of MA.
Analysis of biofluids with high-resolution 1H NMR is a promising non-invasive technique that can be used to identify metabolic profiles and provide information about endogenous metabolites that could serve as biomarkers for ovarian cancer detection and characterization.
1H NMR has been applied to analyze different ovarian cancer biofluids. Characterization of a small number of serum samples obtained from ovarian cancer patients and healthy volunteers, showed a 100% sensitivity and specificity to distinguish malignant samples from healthy samples using the 2.77 ppm and 2.04 ppm spectral regions (Odunsi et al. 2005). 3-hydroxybutyrate was one of the metabolites responsible for the differences in spectral patterns. These results were recently confirmed by mass spectrometry that detected accumulation of hydroxybutyric acid metabolites in ovarian cancer patient serum and tumor tissues (Hilvo et al. 2016). Studies using 1H NMR to explore ovarian cancer MA have been previously published (Bala et al. 2008; Vettukattil et al. 2013). Major characteristics of MA versus non-malignant cirrhotic ascites, analyzed by high-resolution NMR, were the presence of higher levels of lactate and ketone bodies, and lower levels of glucose compared to non-malignant ascites (Bala et al. 2008). The study was limited by a small number of samples that originated from different tumor types and were collected from women and men (Bala et al. 2008). Metabolic differences between serous ovarian cancer ascites obtained pre- and post-chemotherapy have been previously identified (Vettukattil et al. 2013). Ascites from ovarian cancer patients were also compared to specimens obtained from breast carcinoma and malignant mesothelioma (Vettukattil et al. 2013). Ovarian cancer malignant ascites showed elevated levels of ketone bodies and lactate compared to malignant mesotheliomas and breast carcinomas samples, whereas the breast carcinoma specimens had more glucose, alanine, and pyruvate (Vettukattil et al. 2013). We observed in our study presence of β-hydroxybutyrate, a ketone body, in both ascitic fluid types, that was not detected in the cells or the conditioned media.
We observed significant metabolic differences between OVCAR3 and ID8-VEGF-Defb29 cells. OVCAR3 cells in culture presented a higher concentration of most of the metabolites, compared to ID8-VEGF-Defb29 cells. Taurine was the only metabolite that was lower in the OVCAR3 cells.
ID8-VEGF-Defb29 cells modified culture media composition significantly more than OVCAR3 cells. Cell culture media of ID8-VEGF-Defb29 cells contained less glucose, and more lactate than media from OVCAR3 cells, although the opposite result was observed in the ascites. Cancer cells have elevated aerobic glycolysis and exhibit increased dependency on glutamine for growth and proliferation. Here, we observed low glutamine levels in ID8-VEGF-Defb29 cells and media, but high levels in their ascitic fluid. In vitro, the ID8-VEGF-Defb29 cells consumed more glutamine than the OVCAR3 cells. The glutamate levels were low in ID8-VEGF-Defb29 cells and ascitic fluid, and high in the media. Glutamine is an essential nutrient for cancer cells and a key ingredient in culture medium to support cancer cell growth (Lu et al. 2010). Glutamine can be converted to glutamate as a metabolic intermediate to be channeled into the tricarboxylic acid (TCA) cycle to produce ATP. It can also be a precursor for the biosynthesis of nucleic acids, amino acids, glutathione, protein, nucleotides, and lipid. The mitochondrial enzyme glutaminase catalyzes the conversion of glutamine to glutamate, and increased expression of glutaminase is often observed in tumor and in rapidly dividing cells (Lu et al. 2010).
The ID8-VEGF-Defb29 cells overexpress VEGF, explaining the high volume of ascites observed, and likely affecting cell metabolism, and the formation of ascites. VEGF plays a critical role in MA formation (Masoumi Moghaddam et al. 2012). By promoting tumor angiogenesis and enhancing vascular permeability, VEGF contributes to the development of peritoneal carcinomatosis associated with MA formation. This increased peritoneal permeability is due to a downregulation of the tight junction protein Claudin 5 in the peritoneal endothelium (Herr et al. 2012). ID8-VEGF-Defb29 tumor-implanted mice develop higher volume of ascites than the OVCAR3 tumor-implanted mice. This difference in volume could lead to a higher dilution of the metabolites in the ID8-VEGF-Defb29 fluid. While some metabolites presented at lower concentration in ID8-VEGF-Defb29 ascites, others including glutamine, glucose, pyruvate and PUFA, were higher in ID8-VEGF-Defb29 ascites despite the higher volume of ascites formed, indicating that ascitic fluid volume alone cannot explain the differences observed between the models.
Since the OVCAR3 cell line is a human cell line, the cells were implanted into immunodeficient mice to form tumors and induce ascitic fluid. The ID8-VEGF-Defb29 is a murine cell line that grows in syngeneic immunocompetent mice with an intact immune system that plays an important role in ascites formation. Both models are widely used as experimental models of ovarian cancer, and provided an opportunity to investigate tumors with different profiles of ascites formation frequencies and volumes, and to study the metabolic differences in the cells, conditioned media and ascitic fluids. We cannot exclude a potential contribution of the two mouse strains in the differences observed in vivo, since the OVCAR3 human cells were grown in immunocompromised mice, while the mouse ID8 cells were grown in C57BL/6 mice with a functioning immune system. Inflammation and the immune system are known to play a critical role in ascites formation (Robinson-Smith et al. 2007) and MA contains cytokines and immune cells (Landskron et al. 2015).
Prognostic factors for advanced epithelial ovarian cancer principally rely on age, performance status, residual tumor volume following primary surgery, and tumor histology (Kolomeyevskaya et al. 2015). It has been shown that substantial variability in progression-free survival exists among women with similar disease stage (Kolomeyevskaya et al. 2015). The accessibility of ascites composition could provide an opportunity to identify prognostic and treatment-monitor markers (Ahmed and Stenvers 2013). Studies have been performed to improve ovarian cancer diagnosis by identifying cancerous biomarkers in patient pelvic fluid for differential diagnosis, such as cancer antigen 125 (CA125) and cytokeratin 19 soluble fragments (CYFRA21-1). The combined measurement of CA125 and CYFRA21-1 in fluid assisted in detecting all ovarian cancer and papillary serous carcinoma of the peritoneum (Trape et al. 2015). Other studies have examined cytokines as predictive factor, showing an interaction between ascites TNF-α and IL-6 in driving tumor progression and resistance to chemotherapy in advanced epithelial ovarian cancer (Kolomeyevskaya et al. 2015). NMR derived biomarkers of ascites can provide companion diagnostics of ovarian cancer, and enhance our understanding of the biochemical and metabolic changes associated with ovarian cancer, and with ascites formation.
Supplementary Material
Acknowledgments
This work was supported by grants from the Tina’s Wish Foundation, by NIH P50CA013175, R01CA193365, R01CA136576 and P30CA06973.
ABBREVIATIONS
- Chk
choline kinase
- Cho
free choline
- CSI
chemical shift imaging
- GPC
glycerophosphocholine
- PC
phosphocholine
- PtCho
phosphatidylcholine
- PUFA
poly unsaturated fatty acids
- tCho
total choline
- VEGF
vascular endothelial growth factor
Footnotes
CONFLICT OF INTEREST DISCLOSURE
The authors declare that they have no conflict of interest.
COMPLIANCE WITH ETHICAL REQUIREMENTS
This article does not contain any studies with human participants performed by any of the authors.
Ethical approval: All procedures performed in studies involving animals were in accordance with the ethical standards of the institution or practice at which the studies were conducted.
References
- Adosraku RK, Choi GT, Constantinou-Kokotos V, Anderson MM, Gibbons WA. NMR lipid profiles of cells, tissues, and body fluids: proton NMR analysis of human erythrocyte lipids. Journal of lipid research. 1994;35(11):1925–1931. [PubMed] [Google Scholar]
- Ahmed N, Stenvers KL. Getting to know ovarian cancer ascites: opportunities for targeted therapy-based translational research. [Review] Frontiers in oncology. 2013;3:256. doi: 10.3389/fonc.2013.00256. [DOI] [PMC free article] [PubMed] [Google Scholar]
- Ammouri L, Prommer EE. Palliative treatment of malignant ascites: profile of catumaxomab. Biologics. 2010;4:103–110. doi: 10.2147/btt.s6697. [DOI] [PMC free article] [PubMed] [Google Scholar]
- Bala L, Sharma A, Yellapa RK, Roy R, Choudhuri G, Khetrapal CL. H-1 NMR spectroscopy of ascitic fluid: discrimination between malignant and benign ascites and comparison of the results with conventional methods. Nmr in Biomedicine. 2008;21(6):606–614. doi: 10.1002/nbm.1232. [DOI] [PubMed] [Google Scholar]
- Beckonert O, Keun HC, Ebbels TM, Bundy J, Holmes E, Lindon JC, et al. Metabolic profiling, metabolomic and metabonomic procedures for NMR spectroscopy of urine, plasma, serum and tissue extracts. Nat Protoc. 2007;2(11):2692–2703. doi: 10.1038/nprot.2007.376. [DOI] [PubMed] [Google Scholar]
- Bharti SK, Roy R. Quantitative 1H NMR spectroscopy. TrAC Trends in Analytical Chemistry. 2012;35:5–26. [Google Scholar]
- Bharti SK, Roy R. Metabolite Identification in NMR-based Metabolomics. Current Metabolomics. 2014;2:163–173. [Google Scholar]
- Conejo-Garcia JR, Benencia F, Courreges MC, Kang E, Mohamed-Hadley A, Buckanovich RJ, et al. Tumor-infiltrating dendritic cell precursors recruited by a beta-defensin contribute to vasculogenesis under the influence of Vegf-A. [Comparative Study, Research Support, Non-U.S. Gov’t, Research Support, U.S. Gov’t, P.H.S.] Nature medicine. 2004;10(9):950–958. doi: 10.1038/nm1097. [DOI] [PubMed] [Google Scholar]
- Cruz T, Balayssac S, Gilard V, Martino R, Vincent C, Pariente J, et al. 1H NMR Analysis of Cerebrospinal Fluid from Alzheimer’s Disease Patients: An Example of a Possible Misinterpretation Due to Non-Adjustment of pH. Metabolites. 2014;4(1):115–128. doi: 10.3390/metabo4010115. [DOI] [PMC free article] [PubMed] [Google Scholar]
- Gowda GAN, Raftery D. Quantitating Metabolites in Protein Precipitated Serum Using NMR Spectroscopy. Analytical Chemistry. 2014;86(11):5433–5440. doi: 10.1021/ac5005103. [DOI] [PMC free article] [PubMed] [Google Scholar]
- Herr D, Sallmann A, Bekes I, Konrad R, Holzheu I, Kreienberg R, et al. VEGF induces ascites in ovarian cancer patients via increasing peritoneal permeability by downregulation of Claudin 5. Gynecologic oncology. 2012;127(1):210–216. doi: 10.1016/j.ygyno.2012.05.002. [DOI] [PubMed] [Google Scholar]
- Hilvo M, de Santiago I, Gopalacharyulu P, Schmitt WD, Budczies J, Kuhberg M, et al. Accumulated Metabolites of Hydroxybutyric Acid Serve as Diagnostic and Prognostic Biomarkers of Ovarian High-Grade Serous Carcinomas. Cancer Res. 2016;76(4):796–804. doi: 10.1158/0008-5472.CAN-15-2298. [DOI] [PMC free article] [PubMed] [Google Scholar]
- Kipps E, Tan DS, Kaye SB. Meeting the challenge of ascites in ovarian cancer: new avenues for therapy and research. [Research Support, Non-U.S. Gov’t] Nature reviews Cancer. 2013;13(4):273–282. doi: 10.1038/nrc3432. [DOI] [PMC free article] [PubMed] [Google Scholar]
- Kolomeyevskaya N, Eng KH, Khan AN, Grzankowski KS, Singel KL, Moysich K, et al. Cytokine profiling of ascites at primary surgery identifies an interaction of tumor necrosis factor-alpha and interleukin-6 in predicting reduced progression-free survival in epithelial ovarian cancer. [Research Support, N.I.H., Extramural] Gynecologic oncology. 2015;138(2):352–357. doi: 10.1016/j.ygyno.2015.05.009. [DOI] [PMC free article] [PubMed] [Google Scholar]
- Landskron J, Helland O, Torgersen KM, Aandahl EM, Gjertsen BT, Bjorge L, et al. Activated regulatory and memory T-cells accumulate in malignant ascites from ovarian carcinoma patients. [Research Support, Non-U.S. Gov’t] Cancer immunology, immunotherapy : CII. 2015;64(3):337–347. doi: 10.1007/s00262-014-1636-6. [DOI] [PMC free article] [PubMed] [Google Scholar]
- Lu WQ, Pelicano H, Huang P. Cancer Metabolism: Is Glutamine Sweeter than Glucose? Cancer Cell. 2010;18(3):199–200. doi: 10.1016/j.ccr.2010.08.017. [DOI] [PMC free article] [PubMed] [Google Scholar]
- Masoumi Moghaddam S, Amini A, Morris DL, Pourgholami MH. Significance of vascular endothelial growth factor in growth and peritoneal dissemination of ovarian cancer. [Review] Cancer metastasis reviews. 2012;31(1–2):143–162. doi: 10.1007/s10555-011-9337-5. [DOI] [PMC free article] [PubMed] [Google Scholar]
- Odunsi K, Wollman RM, Ambrosone CB, Hutson A, McCann SE, Tammela J, et al. Detection of epithelial ovarian cancer using 1H-NMR-based metabonomics. [Comparative Study, Research Support, Non-U.S. Gov’t, Research Support, U.S. Gov’t, P.H.S.] International journal of cancer. 2005;113(5):782–788. doi: 10.1002/ijc.20651. [DOI] [PubMed] [Google Scholar]
- Penet MF, Krishnamachary B, Wildes F, Mironchik Y, Mezzanzanica D, Podo F, et al. Effect of Pantethine on Ovarian Tumor Progression and Choline Metabolism. Frontiers in oncology. 2016;6:244. doi: 10.3389/fonc.2016.00244. [DOI] [PMC free article] [PubMed] [Google Scholar]
- Robinson-Smith TM, Isaacsohn I, Mercer CA, Zhou M, Van Rooijen N, Husseinzadeh N, et al. Macrophages mediate inflammation-enhanced metastasis of ovarian tumors in mice. [Research Support, Non-U.S. Gov’t] Cancer research. 2007;67(12):5708–5716. doi: 10.1158/0008-5472.CAN-06-4375. [DOI] [PubMed] [Google Scholar]
- Serkova NJ, Brown MS. Quantitative analysis in magnetic resonance spectroscopy: from metabolic profiling to in vivo biomarkers. [Research Support, N.I.H., Extramural Research Support, Non-U.S. Gov’t Review] Bioanalysis. 2012;4(3):321–341. doi: 10.4155/bio.11.320. [DOI] [PubMed] [Google Scholar]
- Trape J, Gurt G, Franquesa J, Montesinos J, Arnau A, Sala M, et al. Diagnostic Accuracy of Tumor Markers CYFRA21-1 and CA125 in the Differential Diagnosis of Ascites. Anticancer research. 2015;35(10):5655–5660. [PubMed] [Google Scholar]
- Van QN, Chmurny GN, Veenstra TD. The depletion of protein signals in metabonomics analysis with the WET-CPMG pulse sequence. [Research Support, U.S. Gov’t, P.H.S.] Biochemical and biophysical research communications. 2003;301(4):952–959. doi: 10.1016/s0006-291x(03)00079-2. [DOI] [PubMed] [Google Scholar]
- Vettukattil R, Hetland TE, Florenes VA, Kaern J, Davidson B, Bathen TF. Proton magnetic resonance metabolomic characterization of ovarian serous carcinoma effusions: chemotherapy-related effects and comparison with malignant mesothelioma and breast carcinoma. Human pathology. 2013;44(9):1859–1866. doi: 10.1016/j.humpath.2013.02.009. [DOI] [PubMed] [Google Scholar]
Associated Data
This section collects any data citations, data availability statements, or supplementary materials included in this article.